Chapter 12: Social Stratification
Chapter 12: Social Stratification
SCIENCE MASTERY ASSESSMENT
Every pre-med knows this feeling: there is so much content I have to know for the MCAT! How do I know what to do first or what’s important?
While the high-yield badges throughout this book will help you identify the most important topics, this Science Mastery Assessment is another tool in your MCAT prep arsenal. This quiz (which can also be taken in your online resources) and the guidance below will help ensure that you are spending the appropriate amount of time on this chapter based on your personal strengths and weaknesses. Don’t worry though—skipping something now does not mean you’ll never study it. Later on in your prep, as you complete full-length tests, you’ll uncover specific pieces of content that you need to review and can come back to these chapters as appropriate.
How to Use This Assessment
If you answer 0–7 questions correctly:
Spend about 1 hour to read this chapter in full and take limited notes throughout. Follow up by reviewing all quiz questions to ensure that you now understand how to solve each one.
If you answer 8–11 questions correctly:
Spend 20–40 minutes reviewing the quiz questions. Beginning with the questions you missed, read and take notes on the corresponding subchapters. For questions you answered correctly, ensure your thinking matches that of the explanation and you understand why each choice was correct or incorrect.
If you answer 12–15 questions correctly:
Spend less than 20 minutes reviewing all questions from the quiz. If you missed any, then include a quick read-through of the corresponding subchapters, or even just the relevant content within a subchapter, as part of your question review. For questions you answered correctly, ensure your thinking matches that of the explanation and review the Concept Summary at the end of the chapter.
- Which of the following best describes the component of socioeconomic status attributable to direct individual efforts?
- Ascribed status
- Meritocratic competition
- Anomic condition
- Achieved status
- Which of the following displays a correct association?
- High social networking and low social capital
- High social mobility and low social capital
- Low social class and low social capital
- Low social networking and high social capital
- Which of the following phenomena are LEAST likely to coincide?
- Hazardous waste facilities and low-income neighborhoods
- Tuberculosis and poor living conditions
- Environmental pollution and populations of underrepresented groups
- Globalization and global equality
- Which of the following trends is most likely FALSE?
- Mortality rates are increased in groups with low income.
- Life expectancy is decreased in groups with high income.
- Birth weights are decreased in children of low-income women.
- Rates of lung cancer are increased in low-income groups.
Questions 5–6 refer to the scenario described below.
A small town has 1000 residents, including 500 males and 500 females. In this town, 20 of the males have prostate cancer. During a calendar year, 10 more males are diagnosed with prostate cancer. Assume none of the males are cured or die during the year.
- What is the prevalence of prostate cancer in the population that can develop the condition at the end of the year?
- 10 ÷ 480
- 10 ÷ 1000
- 20 ÷ 500
- 30 ÷ 500
- What is the incidence of prostate cancer in this population during the year?
- 10 ÷ 480
- 10 ÷ 1000
- 20 ÷ 500
- 30 ÷ 1000
- A low-income single parent works a part-time job and lives in a small apartment in the city. When the single parent’s children grow up, they take similar jobs and live in similar housing. This is an example of:
- upward social mobility.
- downward social mobility.
- social exclusion.
- social reproduction.
- Which of the following is true with regard to relative poverty?
- Individuals in relative poverty have incomes below the poverty line.
- Individuals in relative poverty exhibit downward social mobility.
- Individuals in relative poverty may be in the upper class.
- Individuals in relative poverty exhibit upward social mobility.
- In comparison to urban centers, suburbs tend to have:
- larger racially and ethnically underrepresented populations.
- higher rates of poverty.
- larger upper- and middle-class populations.
- higher rates of crime and homicide.
- Which of the following terms refers to the burden or degree of disease associated with a given illness?
- Morbidity
- Mortality
- Second sickness
- Chronicity
- Compared to White Americans, which of the following racial or ethnic groups tends to have a better overall health profile?
- African Americans
- Asian Americans
- Hispanic Americans
- American Indians
- Which of the following best describes the populations targeted by Medicare and Medicaid, respectively?
- Medicare: mostly patients without employer-guaranteed healthcare; Medicaid: mostly patients who have recently immigrated
- Medicare: mostly patients who have recently immigrated; Medicaid: mostly patients without employer-guaranteed healthcare
- Medicare: mostly patients in older age groups; Medicaid: mostly patients with low socioeconomic status
- Medicare: mostly patients with low socioeconomic status; Medicaid: mostly patients in older age groups
- Morbidity is increased in low-income groups because of all of the following EXCEPT:
- higher rates of obesity.
- less access to healthcare.
- higher rates of homicide.
- lower rates of physical activity.
- Hypertension (high blood pressure) can be diagnosed by having two or more blood pressure readings higher than 140/90 on two different occasions, separated by a week. Suppose that the criteria were changed to include anyone with a reading higher than 130/80 on at least one occasion. How would this change the prevalence of diagnosed hypertension in the population?
- The prevalence would increase.
- The prevalence would decrease.
- The prevalence would remain the same.
- There is not enough information to determine the change in prevalence.
- Which of the following trends regarding healthcare disparities has NOT been documented?
- Females are more likely to be insured than males.
- Primary care use is more likely among males than females.
- Low-income individuals have more difficulty accessing care than high-income individuals.
- LGBTQ individuals have more barriers to healthcare than other individuals.
Answer Key
- D
- C
- D
- B
- D
- A
- D
- C
- C
- A
- B
- C
- C
- A
- B
Chapter 12: Social Stratification
CHAPTER 12
SOCIAL STRATIFICATION
In This Chapter
12.1 Social Class
Aspects of Social Stratification
Patterns of Social Mobility
Poverty
Spatial Inequality
12.2 Epidemiology and Disparities
Inequities in Health
Inequities in Healthcare
Concept Summary
CHAPTER PROFILE
The content in this chapter should be relevant to about 9% of all questions about the behavioral sciences on the MCAT.
This chapter covers material from the following AAMC content categories:
8B: Social thinking
8C: Social interactions
10A: Social inequality
Introduction
The wonderfully witty Oscar Wilde once said, “Work is the curse of the drinking classes.” While this quote is intended to be humorous, it does speak to the stereotypical characteristics associated with socioeconomic class. Some Americans think that class and social stratification are nonissues in our society. Unlike earlier feudal societies, most Americans are not royals or gentry, possessing inherited titles, land, or palaces; we’re often considered to be a much more equality-oriented society, in keeping with our constitutional ideals. Yet how do we explain such differences in wealth, power, and privilege as a Manhattan lawyer driving a shiny Porsche past a homeless person rooting through a trash can? Such scenes make it hard to ignore the uneven distributions of material wealth and the overall social inequality in the United States.
To understand social inequalities in America and how such disparities impact health and healthcare services, we will examine several aspects of social stratification in terms of class, status, and social capital and how these intersect with race, gender, and age. We will also focus on patterns of social mobility and how poverty and location play major roles in health and illness. Later, we will connect how race, gender, and socioeconomic inequalities impact health profiles and access to quality healthcare.
12.1 Social Class
LEARNING OBJECTIVES
After Chapter 12.1, you will be able to:
- Explain how socioeconomic status of an individual or a community is determined
- Define social capital and social cohesion
- Identify groups that suffer disproportionate social inequality
- Describe the relationship between social mobility and merit
A social class is defined as a category of people who share a similar socioeconomic position in society, and can be identified by looking at the economic opportunities, job positions, lifestyles, attitudes, and behaviors of a given slice of society. Social cohesion, or social integration, refers to the solidarity and sense of connectedness among different social groups and social classes in society.
Aspects of Social Stratification
Social stratification focuses on social inequalities and studies the basic question of who gets what and why. Social stratification is thus related to one’s socioeconomic status (SES), which may depend on ascribed or achieved status, and causes the emergence of status hierarchies. Ascribed status derives from clearly identifiable characteristics, such as age, gender, and skin color; achieved status is acquired via direct, individual efforts. In other words, ascribed status is involuntary, while achieved status is obtained through hard work or merit. An important factor in achieved status is educational attainment, which is the highest degree obtained, or number of years of education completed. Caste and estate systems stratify by ascribed SES, while class systems stratify by achieved SES. After breaking free from British colonial rule, the United States moved toward a class-based system of social stratification.
KEY CONCEPT
It’s important to keep in mind that socioeconomic status is not only determined by merit (achieved status), but also external characteristics or outward appearances like skin color and gender (ascribed status).
BRIDGE
There are three major types of status: ascribed, achieved, and master status. While ascribed and achieved statuses are described here, remember that a master status is one that pervades all aspects of an individual’s life. The role of statuses in social interaction is discussed in Chapter 9 of MCAT Behavioral Sciences Review.
Class, Status, and Power
There are three major classes—upper, middle, and lower—although these vary to different degrees in different locations. The upper class consists of those who have great wealth, along with recognized reputations and lifestyles, and have a larger influence on society’s political and economic systems. In other words, the upper class has a high concentration of prestige and power. The middle class can be further divided into three levels: upper-middle, middle-middle, and lower-middle class. The middle class includes successful business and professional people (upper-middle), those who have been unable to achieve the upper-middle lifestyle because of educational and economic shortcomings (middle-middle), and those who are skilled and semiskilled workers with fewer luxuries (lower-middle). The lower class includes people who have lower incomes, and has a greatly reduced amount of sociopolitical power. The proportional improvement in healthcare as one moves up in socioeconomic status is called the socioeconomic gradient in health and development.
Prestige refers to the amount of positive regard society has for a given person or idea. Certain occupations, such as physicians, are broadly viewed with high levels of status, respect, and importance. Particular educational institutions, organizations, awards, and accolades may also be considered prestigious.
Power can be described as the ability to affect others’ behavior through real or perceived rewards and punishments, and is based on the unequal distribution of valued resources. At its core, power defines the relationship between individuals, groups, and social institutions. Power relationships function to maintain order, organize economic systems, conduct warfare, and rule over and exploit people. As a result, power creates worldwide social inequalities as people tend to fall somewhere within the haves and the have-nots.
You may recall from Chapter 11 of MCAT Behavioral Sciences Review that Marxist theory, also called conflict theory, proposes that the have-nots, called the proletariat, could overthrow the haves, called the bourgeoisie, as well as the entire capitalist economy by developing class consciousness. Class consciousness refers to the organization of the working class around shared goals and recognition of a need for collective political action. By working together as one unit, the proletariat could revolt and take control of the political and economic system, laying the groundwork for a socialist state. The one major barrier to class consciousness, however, is false consciousness, a misperception of one’s actual position within society. Members of the proletariat either do not see just how bad conditions are, do not recognize the commonalities between their own experiences and others, or otherwise are too clouded to assemble into the revolutionaries Marx envisioned.
Even in developed countries of the modern, globalized world, social inequality persists. Early sociologists explained that social inequality is further accelerated by what is called anomie, which refers to a lack of widely accepted social norms and the breakdown of social bonds between an individual and society. Strain theory focuses on how anomic conditions can lead to deviance. Anomic conditions include excessive individualism, social inequality, and isolation; these all erode social solidarity, which is the sense of community and social cohesion. Other sociologists have focused on the importance of social trust in the proper functioning of civil society. Social trust comes from two primary sources: social norms of reciprocity (I’ll scratch your back if you scratch mine) and social networks. In the past several decades, as some societies have become more urbanized, self-oriented, and materialistic, associational ties have diminished and consequently have led to a decline in social capital. But what is the relationship between social stratification, social capital, and power?
KEY CONCEPT
Anomic conditions in postindustrial modern life have accelerated the decline of social inclusion and, as a result, have further obstructed opportunities to acquire social capital.
Social Capital
Essentially, social capital is the investment people make in their society in return for economic or collective rewards; the greater the investment, the higher the level of social integration, which is the movement of new or underrepresented populations into a larger culture while maintaining their ethnic identities. One of the main forms of social capital is the social network. Social networks can create two types of social inequality: situational (socioeconomic advantage) and positional (based on how connected one is within a network and one’s centrality within that network). Inequality in networks creates and reinforces privilege, which is inequality in opportunity. Moreover, low social capital leads to greater social inequality. As social capital refers to the benefits one receives from group association, cultural capital refers to the benefits one receives from knowledge, abilities, and skills.
Communities are joined together through what are called strong and weak ties. Strong ties refer to peer group and kinship contacts, which are quantitatively small but qualitatively powerful. Weak ties refer to social connections that are personally superficial, such as associates, but that are large in number and provide connections to a wide range of other individuals. Social networking websites—especially those focusing on professional relationships—are examples of groups of weak ties. People without multiple weak ties, such as disadvantaged groups, may find accessing and contributing to social capital extremely difficult.
REAL WORLD
People who experience poor mental health are one of the largest disadvantaged groups to lack both strong and weak ties. Due to repercussions of social exclusion, these individuals may find that social capital is out of their reach. Consequently, this group is personally and socially disempowered, further propelling a cycle of exclusion. Social exclusion has huge financial repercussions on healthcare, with greater morbidity rates.
Intersections with Race, Gender, and Age
Social stratification, or, more properly, social inequality, remains higher among certain disadvantaged groups than others, including groups who are racially and ethnically underrepresented (especially Hispanic and African American people), households headed by women, and older adults. Think about who you know that may fall into these underprivileged or underserved groups. Your friends? Your relatives? Yourself? Socioeconomic inequalities remain in the United States. As described in Chapter 11 of MCAT Behavioral Sciences Review, this continued socioeconomic inequality is partially due to intersectionality—the compounding of disadvantage seen in individuals who belong to more than one underserved group.
Patterns of Social Mobility
Unlike a caste-based or estate-based system of social stratification, people in North America generally have the ability to move up or down from one class to another. In a class system, social mobility, also known as structural mobility, is typically the result of an economic and occupational structure that allows one to acquire higher-level employment opportunities given proper credentials and experience requirements. In the United States, the class system encourages this type of ambition through dedication and hard work, an ethos embodied in the phrase The American Dream.
Intergenerational and Intragenerational Mobility
Social mobility can either occur within a generation or across generations. Intragenerational mobility refers to changes in social status that happen within a person’s lifetime, while intergenerational mobility refers to changes in social status from parents to children. Many people consider the United States to be the land of opportunity, where intragenerational and intergenerational mobility can easily occur. However, others argue that opportunities for social mobility are diminishing because the gap between the upper class and the middle and lower classes continues to widen.
MCAT EXPERTISE
For the guided example that follows, we were able to answer part of the question very quickly. On Test Day, all questions are multiple choice, so as soon as you have even part of the answer to a question, you can look at the answers and eliminate any that aren’t a match.
BEHAVIORAL SCIENCES GUIDED EXAMPLE WITH EXPERT THINKING
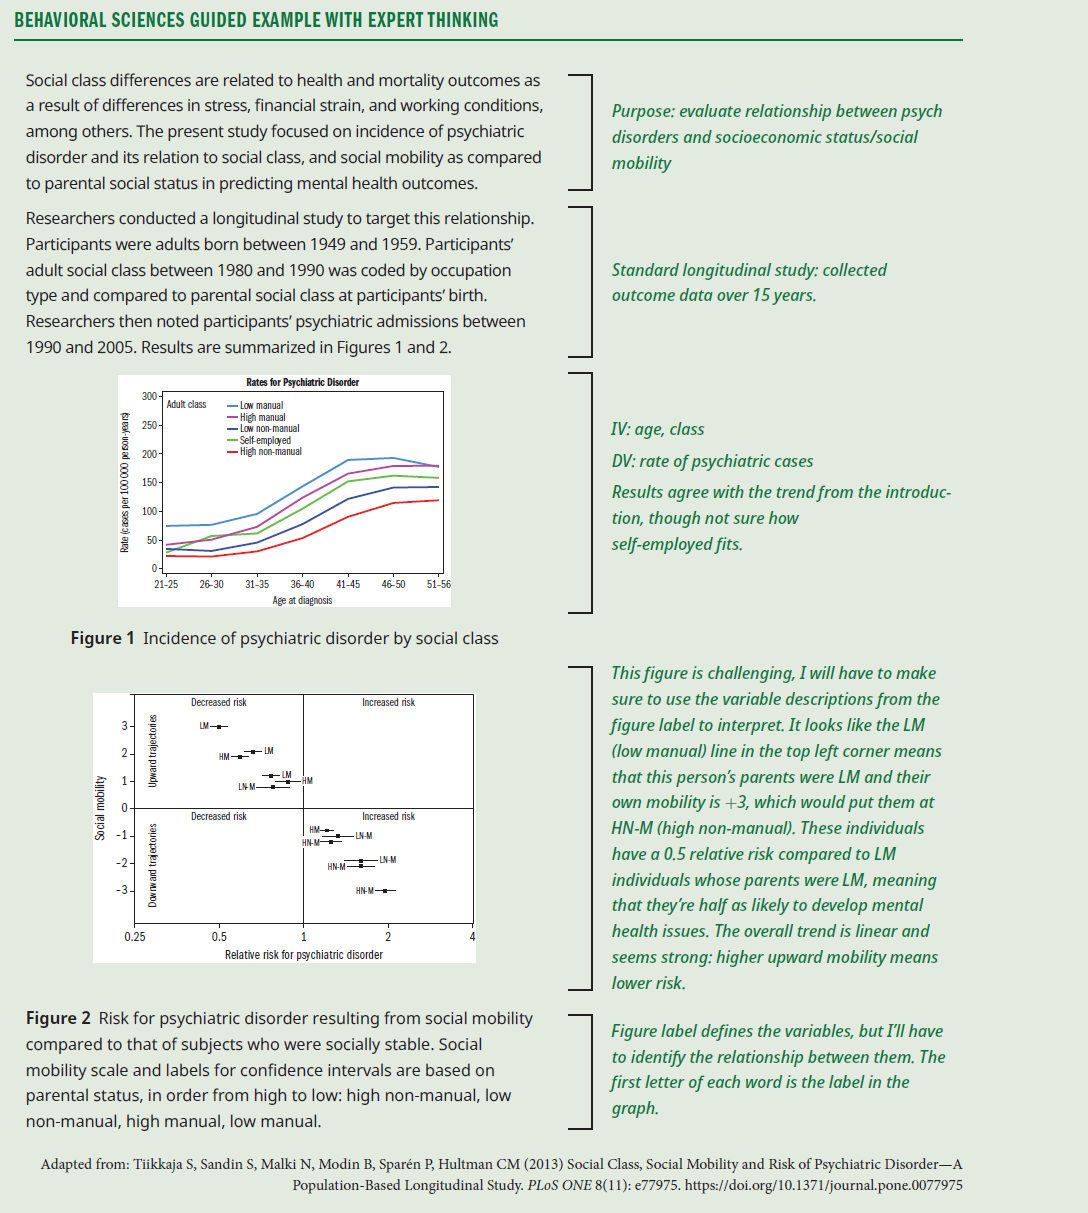
Researchers examined the records of three individuals: Person A (HM, parental class HN-M), Person B (LM, parental class LN-M), and Person C (HM, parental class HM). What can be predicted about the comparative risk of psychiatric disorder for A, B, and C?
This question is asking for a direct application of the results of the study, so the first thing to do to answer the question is to take a deeper look at the figures and determine what can be learned about these three individuals. Figure 1 gives overall incidence of mental health diagnoses for each class, and it looks like risk is inversely proportional to social class: people in lower social classes have a higher risk for psychiatric disorder. We can use this information alone to answer part of the question: Because the social class of person A is HM, i.e. "high manual," and the social class of person B is LM, i.e. "low manual," person B is in a lower social class and is therefore overall more likely to develop a psychiatric disorder.
Figure 2 is a little tougher to interpret, but we can start by finding the region of the graph where persons A and B would be located. Person A has parents in the HN-M class, but is in the HM class, for a mobility of –2. Person B has the same mobility, –2, from LN-M to LM. Looking at the data for individuals at –2 mobility, both persons A and B are about 1.75 times more likely to develop a psychiatric disorder than members of their respective social class with stable mobility. So, although person A will have a lower overall risk compared to person B due to social class, both persons A and B will have an elevated risk compared to socially stable members of their respective social class.
By contrast, person C shares a social class with their parents, meaning no additional risk is conferred to person C by downward social mobility. Given that persons A and C are in the same social class, but person C did not experience intergenerational downward mobility, person C would be expected to have a lower risk of disorder than person A.
Therefore, in order of risk, person C is at the lowest risk for psychiatric disorder based on the results of this study, followed by person A, with person B at the highest risk for psychiatric disorder based on both social status and downward social mobility.
Meritocracy
One of the largest factors driving American social mobility has been meritocratic competition or a merit-based system of social mobility. Meritocracy is a social structure in which intellectual talent and achievement are means for a person to advance up the social ladder. Given the rising levels of social inequality and concentration of wealth in the United States, some argue that motivation, a strong work ethic, a conscientious drive, and mastery of skills no longer offer the same opportunities for advancement. Some fear that the US meritocratic system is quickly becoming a plutocracy, or a rule by the upper classes. Nonetheless, merit still plays a key role in many segments of society, but merit does not always guarantee positive social mobility.
Upward and Downward Mobility
Social mobility usually occurs in one of two directions: up or down. Upward and downward mobility both refer to patterns of vertical mobility, or movement from one social class to another. Upward mobility is a positive change in a person’s social status, resulting in a higher position. Downward mobility is the opposite: a negative change in a person’s social status, wherein they fall to a lower position. Social mobility is often directly correlated with education, although other factors can contribute to upward mobility as well. Some of the best examples of upward mobility are seen with professional athletes, professional musicians, and entrepreneurs. So, in addition to education, athletics, music, and greater opportunities for small businesses may offer disadvantaged individuals more potential ladders to a higher social status.
Horizontal Mobility
Horizontal mobility is a change in occupation or lifestyle by an individual that keeps that individual within the same social class. For example, a construction worker who switches jobs to work in custodial services or mechanical maintenance has made a shift in occupation but typically remains in the lower-middle class.
Poverty
Poverty is defined by low socioeconomic status and a lack of possessions or financial resources. Poverty can be handed down from generation to generation, and can be defined on its own terms or in comparison to the rest of the population.
Social Reproduction
Social inequality, especially poverty (but also inherited wealth), can be reproduced or passed on from one generation to the next. This idea is referred to as social reproduction. Some consider social reproduction to be a cycle-of-poverty explanation for social inequality. In other words, the lifestyle of poverty, powerlessness, isolation, and even apathy is handed down from one generation to another as a feature of the society. However, there are many other factors that contribute to poverty, including where one lives and an emphasis on present orientation, in which people do not plan for the future. One theory, that of structural poverty, is based on the concept of “holes” in the structure of society being more responsible for poverty than the actions of any individual. Proponents of structural poverty argue that the same individuals do not by necessity occupy these “holes” from year to year, but the percentage of a society that falls under the poverty line stays relatively constant due to their existence. To understand how poverty is reproduced, it may be helpful to examine what types of poverty exist.
Absolute and Relative
On an absolute level, poverty is a socioeconomic condition in which people do not have enough money or resources to maintain a quality of living that includes basic life necessities such as shelter, food, clothing, and water. This absolute poverty view applies across locations, countries, and cultures. Poverty can also be defined as relative, in which people have less income and wealth in comparison to the larger population in which they live. For example, surviving on a low teaching salary while living in the Upper East Side of Manhattan may very well be considered poor relative to the other, far wealthier residents of that neighborhood.
In the United States, the official definition of the poverty line is derived from the government’s calculation of the minimum income requirements for families to acquire the minimum necessities of life. Poverty is highly related to geography, as can be seen in Figure 12.1. One of the main problems with the official poverty line is that it is not contextualized according to geographic location and, as a result, does not take into account the cost of living in different communities. For example, the price of renting an apartment in a major urban center is much higher than the cost of rent in a rural small town. Some conceive of poverty as a form of powerlessness or a sociological and psychological condition of hopelessness, indifference, and distrust. In other words, poverty can be the result of the inability to control events that shape a person’s life, often leading to a large degree of dependency on others.

Figure 12.1. Percentage of Population Living below the Poverty Line by County, 2009
KEY CONCEPT
In the United States, poverty is determined by the government’s estimation of the minimum income requirements for families to acquire their minimum needs, such as shelter, food, water, and clothing. The problem with this official definition is that it fails to take into account geographical variables that impact the value of money in different locations. Certain areas are more costly to live in than others.
Social Exclusion
Social exclusion can arise from a sense of powerlessness when individuals who are poor or otherwise disadvantaged feel segregated and isolated from society. This feeling can create further obstacles to achieving self-help, independence, and self-respect. Disadvantaged groups, such as the racially and ethnically underrepresented, can experience magnified feelings of alienation and powerlessness when living in an affluent community. These feelings are similar to anomic conditions, which tend to further accelerate social inequality.
Spatial Inequality
Another important factor influencing poverty is the spatial setting of one’s social life. In other words, where one lives plays a major role in the distribution of valuable resources. Does a person living in a low-income neighborhood in Mumbai have the same access to clean water and electricity as someone living in the posh neighborhood of London’s West End? Spatial inequality focuses on social stratification across territories and their populations. Examining space helps to illuminate social inequalities because it attends to how geography influences social processes. Social categories such as gender, ethnicity and race, and class are distributed across spaces differently, as shown in Figure 12.2. In turn, these groups use spaces differently. For example, some cultures consider the home the center of family life, culture, and entertainment, while other cultures may view the home as merely a stop-off point for eating and sleeping while spending most of their time outside of the home.

Figure 12.2. White and Black Population Distribution in Milwaukee County, WI
Space can be used to reinforce existing inequalities and can even amplify their effects, particularly poverty, leading to population segregation and the formation or expansion of destitute neighborhoods. Space can also be used to create social inequalities. In other words, social relationships between different agents, such as capitalists, laborers, the government, and citizens, result in spatially-varied social structures, built environments, and unequal regional development. For example, poorer neighborhoods tend to have less political and social influence than more affluent neighborhoods; as a result, “undesirable” buildings, like water refineries, trash-smoldering plants, and chemical manufacturers, tend to be placed in low-income areas, as shown in Figure 12.3. Citizens of these areas may lack the social resources to fight government and industry. To further understand spatial inequality, we must explore this idea on three levels: residential, environmental, and global.
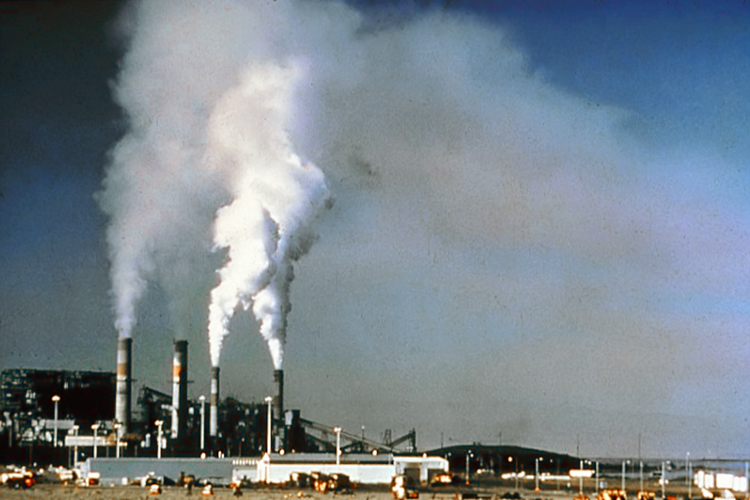
Figure 12.3. Industrial Park in a Low Socioeconomic Area
Residential Segregation
Where one resides—an urban, suburban, or rural environment, and which neighborhood in that environment—has a substantial effect on how people interact, cooperate, and advance. The cultural diversity and anonymity of urban neighborhoods offer a person a greater range of opportunities than normally found in rural areas. For example, in urban environments, people are less likely to fall into their occupations and social positions because of familial ties. In rural environments, this is more likely to occur: My parents were farmers, my grandparents were farmers, my great-grandparents were farmers; therefore, I will take up the family business when it’s handed down to me. People in urban areas tend to have more career options to choose from and can more easily improve their SES through such avenues as education, career choice, and marriage. In rural environments, these choices exist, but are less universally available. Such opportunities also do not always extend across urban environments. The neighborhood in which one lives plays a major role: affluent neighborhoods tend to have more homeowners, professionals and managers, college graduates, and higher-quality schools. Low-income neighborhoods tend to have greater poverty, unemployment rates, lower-quality schools, and higher rates of homelessness. Low-income neighborhoods are also less safe, with higher rates of violent crime, organized crime, and gang activity. These key attributes stratify neighborhoods and create unequal chances for people who live in these communities. The overall greater concentration of individuals who are poor in urban centers helps to explain suburbanization, or the migration pattern of the middle classes to suburban communities, as shown in Figure 12.4. The suburbs have become more attractive as they are generally cleaner and less crowded, have lower crime rates, and often have better school systems. Unlike the middle or upper classes, members of the lower class are often less able to relocate to areas that might offer them better opportunities. Many disadvantaged groups therefore remain in urban centers under poor living conditions. To make matters worse, this type of environment can easily expose low-income groups to illness and disease. Suburbanization can also lead to urban decay, in which a previously functional portion of a city deteriorates and becomes decrepit over time. Interestingly, this process can spontaneously reverse in the process of urban renewal, in which city land is reclaimed and renovated for public or private use. Urban renewal is often fueled by gentrification, when upper- and middle-class populations begin to purchase and renovate neighborhoods in deteriorated areas, displacing the low-SES population.
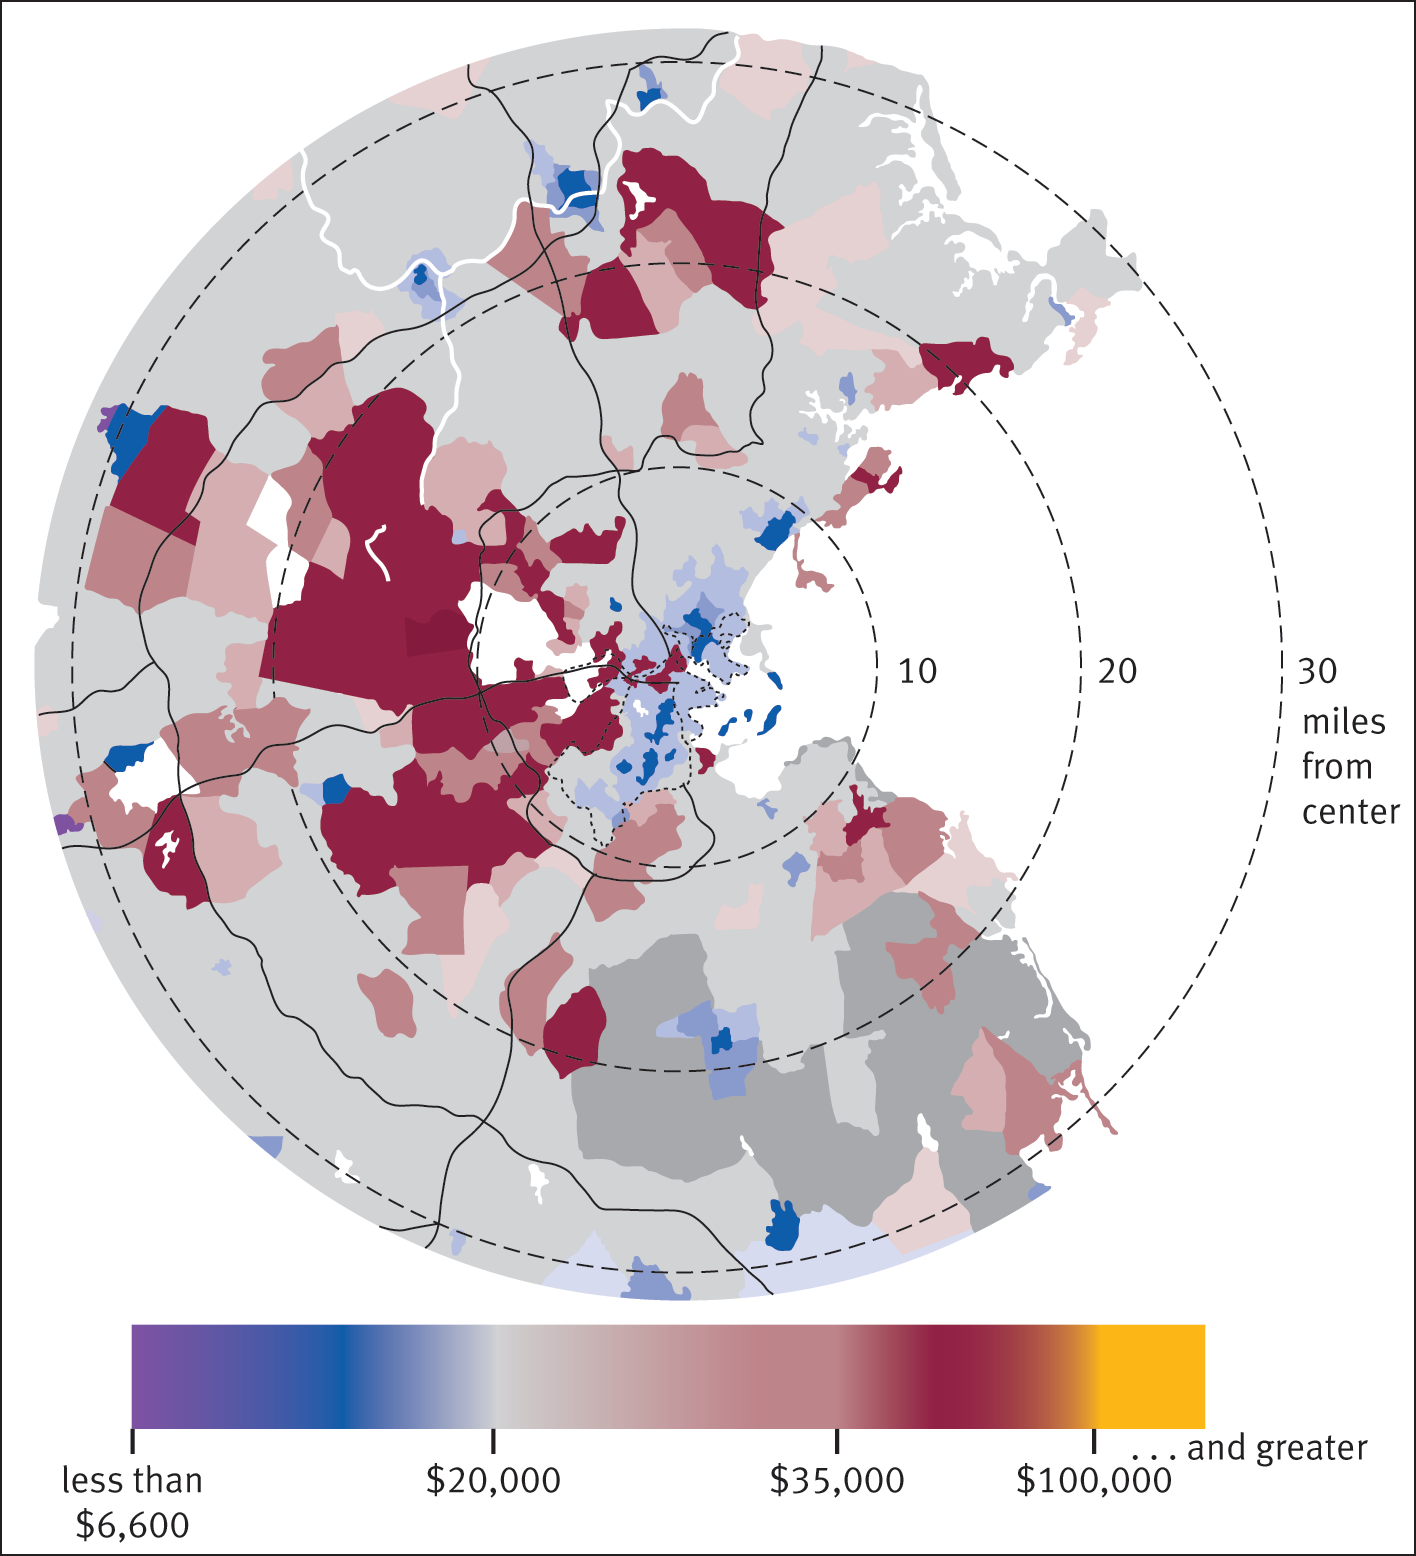
Figure 12.4. The Boston “Doughnut” of Income and Socioeconomic Status Urban centers tend to contain lower-SES communities, surrounded by a ring of middle- to upper-SES suburbs. Further out are lower-SES exurbs and rural areas.
Environmental Justice
Poor living conditions and dangerous environmental conditions can result in an increase in illness and disease. Many low-income and underrepresented groups tend to reside closer to sites of environmental pollution because these areas are usually cheaper housing markets. Environmental risks, such as hazardous waste-producing plants and toxic waste dumps, tend to be located in low-income areas with a high concentration of groups who are racially and ethnically underrepresented. It is no surprise that inadequate housing, heating, and sanitation, in concert with toxin exposure, can contribute to acute medical problems. Illnesses such as influenza, pneumonia, substance use disorders, tuberculosis, and whooping cough are much more common among people living in poor-quality conditions. As mentioned earlier, these low-income areas also may lack the social and political power to prevent environmental risks from encroaching on their communities.
Global Inequalities
Poverty and social inequalities are not limited to hierarchies within a country. The world system theory categorizes countries and emphasizes the inequalities of the division of labor at the global level. Core nations focus on higher skills and higher paying productions while exploiting peripheral nations for their lower-skilled productions. Semi-peripheral nations are midway between the two—these nations work toward becoming core nations, while having many characteristics of peripheral nations. Much of the world, especially within semi-peripheral and peripheral nations, lives on less than the equivalent of $1.25 per day. Such rates of poverty are especially prevalent in parts of India, sub-Saharan Africa, and South Central Asia, as shown in Figure 12.5.
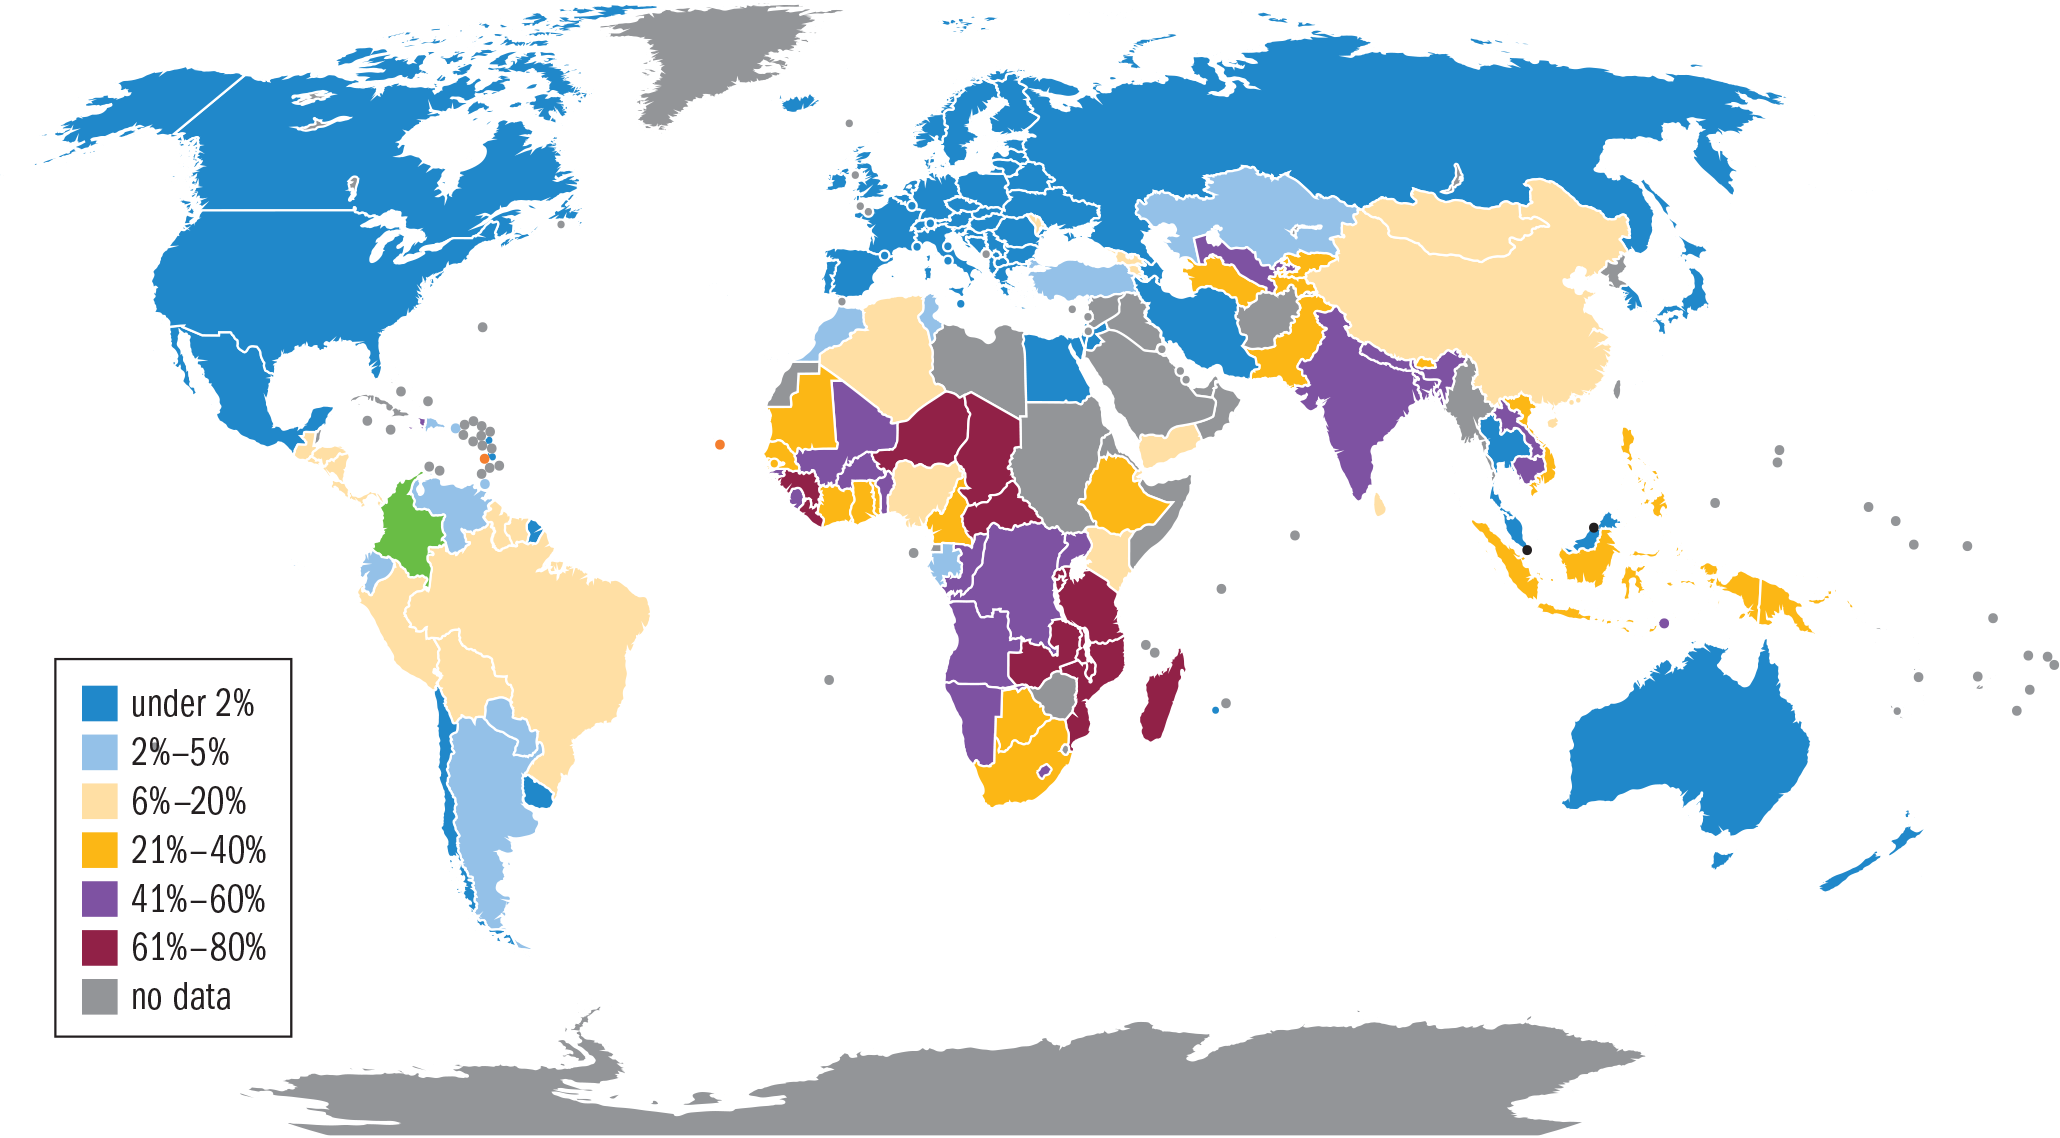
Figure 12.5. Percentage of Population Living on Less than $1.25 per Day, 2008
Largely due to the effects of globalization, massive restructuring of industry and trade patterns have had a major impact on local communities, specifically because of the production of cheap goods at suppressed rates for the global market. This reconfiguration obstructs or limits access to power and resources as the production of goods constantly shifts from location to location. Social inequalities have increased on a worldwide level as local communities become more and more subject to the ebb and flow of the global market. Since the advent of globalization, with the development of world cities, international communication chains, and global immigration, interaction between industrialized and developing nations has had more of an impact on peoples and regions within the state, and has thereby led to further inequalities in space, food and water, energy, housing, and education. Global inequality has been further exacerbated by an unprecedented large population spike, placing strain on the world’s resources. The majority of the world also has limited access to healthcare. Consequently, many people around the globe suffer from malnutrition and parasitic and infectious diseases, and have higher rates of morbidity and mortality.
MCAT CONCEPT CHECK 12.1
Before you move on, assess your understanding of the material with these questions.
_________________________
- How is socioeconomic status (SES) determined?
_________________________
- How does social capital affect social cohesion?
_________________________
- What are some groups that suffer disproportionate social inequality?
_________________________
- What is the relationship between merit and social mobility?
_________________________
- With regard to health, which groups are most often affected by environmental hazards?
12.2 Epidemiology and Disparities
LEARNING OBJECTIVES
After Chapter 12.2, you will be able to:
- Identify the causes of Waitzkin’s “second sickness”
- Explain why women are more likely to have better health profiles than men
- Describe the links between class, ethnicity, and healthcare disparities
An old saying intones that Your health is your wealth. This same correlation certainly holds true in reverse: the wealthier tend to have better health and better access to healthcare. Wherever there is low social capital, high urban degradation, interpersonal violence, and low social trust, the social environment is poor, and there is less protection against disease. As a result, class gradients often increase. Poor health conditions and lower life expectancy, as shown in Figure 12.6, are some of the many consequences of social stratification. Low-income groups are significantly worse off than the middle or upper classes when it comes to health disparities, meaning they tend to be sicker than others. Social epidemiology is a branch of epidemiology that studies the ways in which health and disease correlate to social advantages and disadvantages.
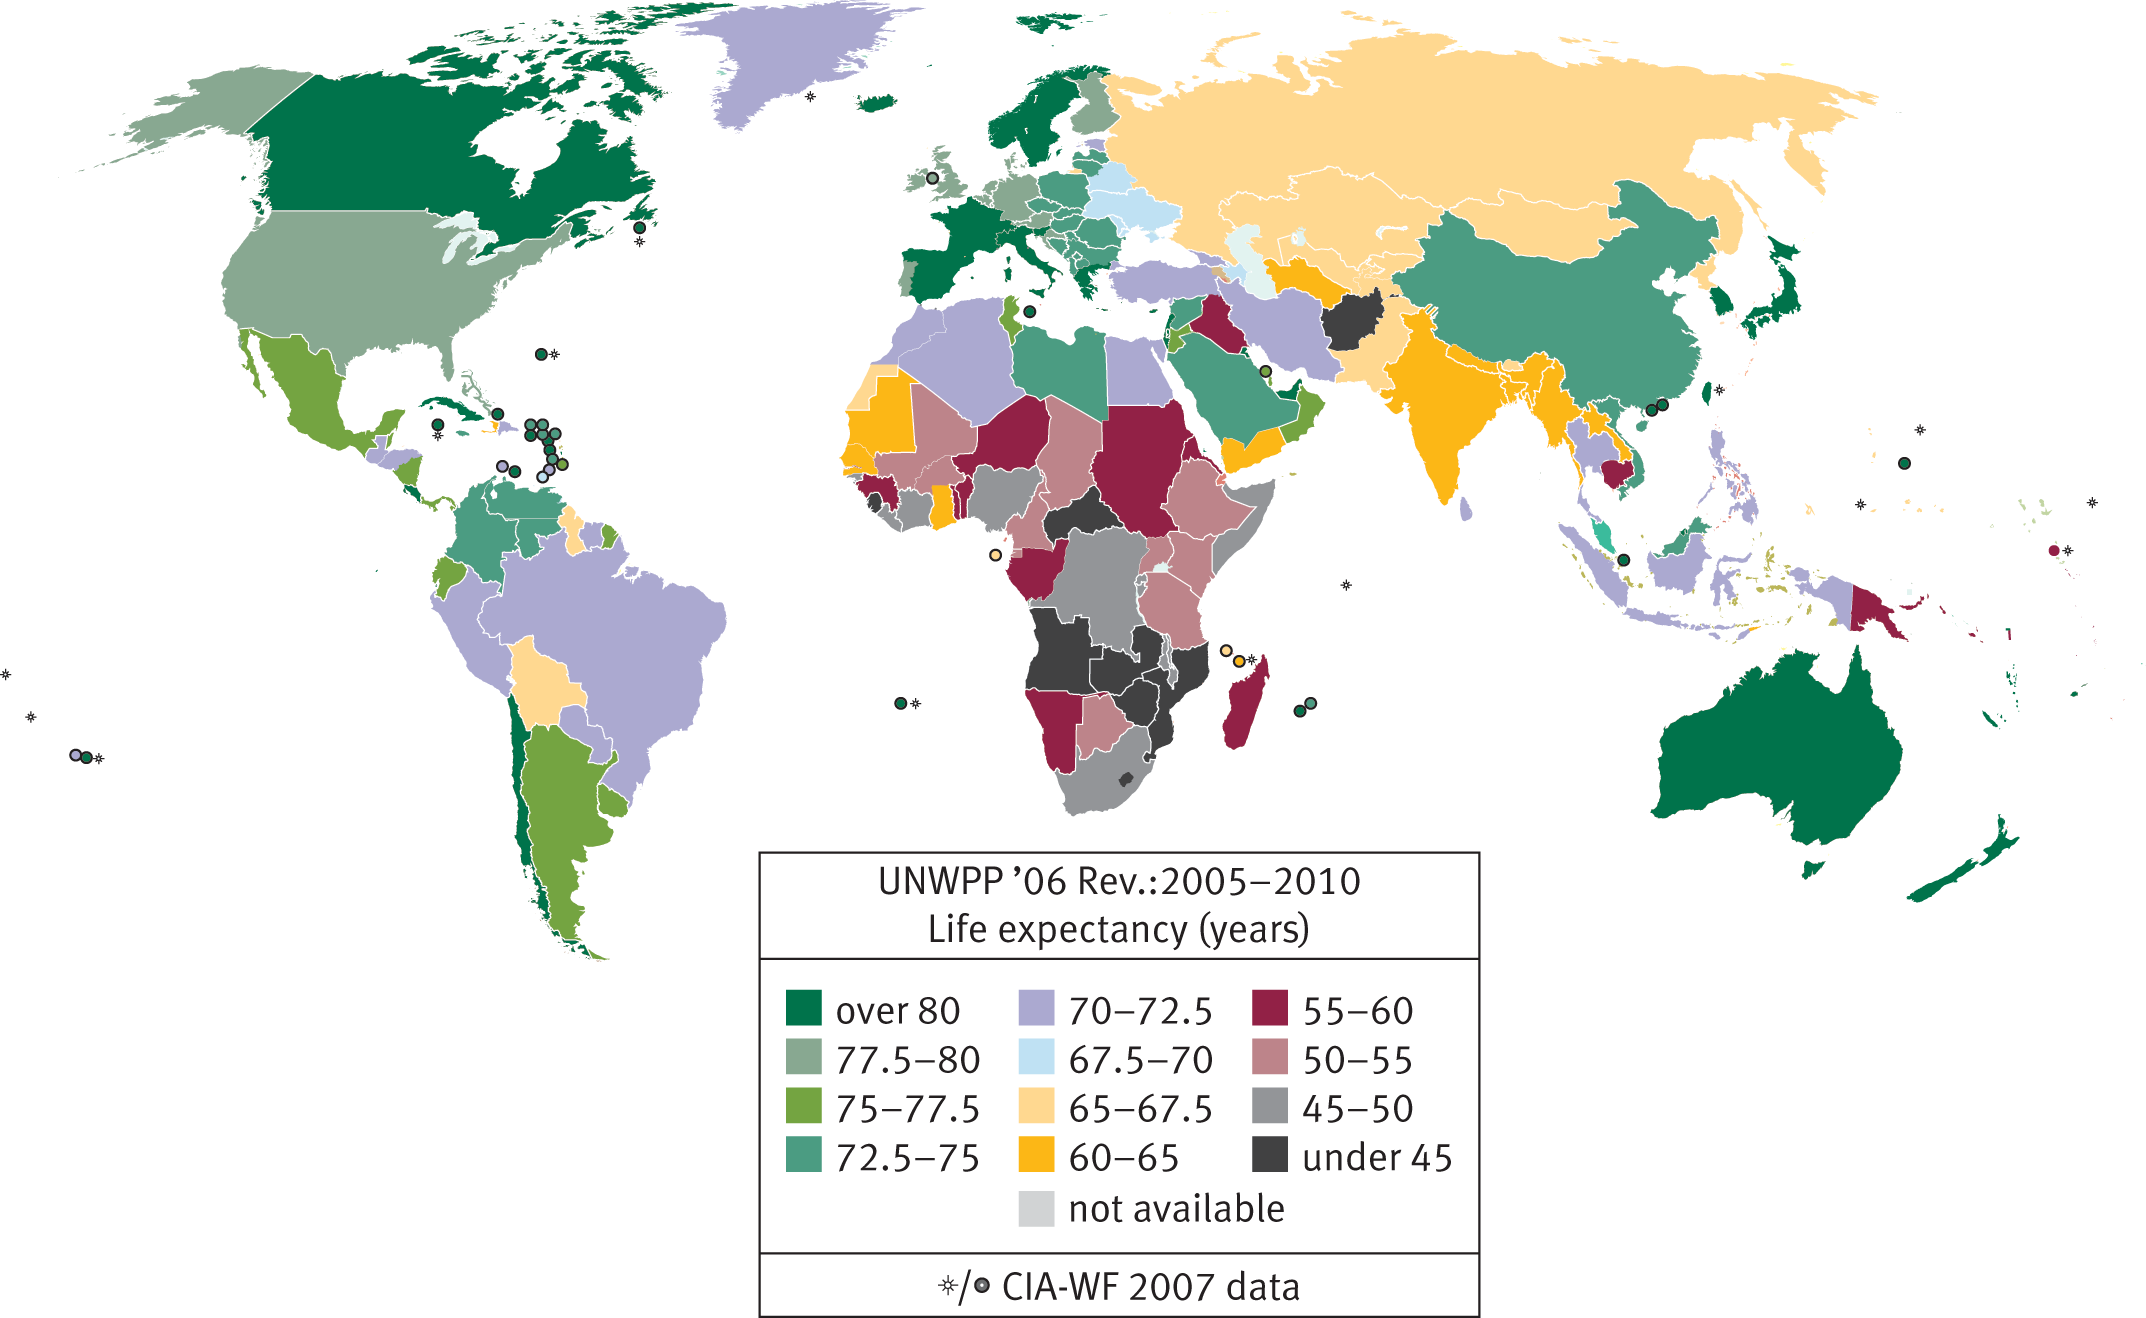
Figure 12.6. Life Expectancy at Birth, 2005–2010
To understand health statistics, it is important to define a few epidemiological terms. Incidence is defined as the number of new cases of an illness per population at risk in a given amount of time; for example, the number of new cases of lung cancer per 1000 at-risk people per year. Prevalence is a measure of the number of cases of an illness overall—whether new or chronic—per population in a given amount of time; for example, the number of people with new or chronic lung cancer per 1000 people per year. Health statistics are also given in terms of morbidity and mortality. Morbidity is the burden or degree of illness associated with a given disease, while mortality refers to deaths caused by a given disease.
KEY CONCEPT
Epidemiology statistics:
- Incidence = new cases / population at risk / time
- Prevalence = total cases / total population / time
Note that incidence is relative to the population at risk, not the total population; if you already have the illness, you are no longer at risk!
Inequities in Health
Science has clearly demonstrated that there are many non-medical factors that influence health outcomes, which are termed social determinants of health. These determinants include environmental factors such as where one is born or raised, or social factors such as culture or social class. Such a correlation was first demonstrated in the nineteenth century, when John Snow’s investigation of a cholera outbreak in London in 1854 demonstrated a link between location and the outbreak. Snow tracked cases of cholera on a map, as shown in Figure 12.7, and was able to deduce that a water pump in the neighborhood was causing the spread of the infectious agent (a bacterium called Vibrio cholerae).

Figure 12.7. John Snow’s Map of Disease Cases during the 1854 Cholera Outbreak in London By tracing the geography of the disease, Snow deduced that a water pump was responsible for cholera transmission.
Health is dependent not only on geography, but also on social and economic factors. Over time, socioeconomic improvements lead to greater general health in the population, and the best health outcomes are generally seen in egalitarian societies. However, despite the ambitions of the modern welfare state (the system of government that protects the health and well-being of its citizens), the Black Report of 1980 showed that class differences in health still exist, with professional groups having longer life expectancies than working-class people. Howard Waitzkin described this outcome as the second sickness, which is an exacerbation of health outcomes caused by social injustice. As the Centers for Disease Control and Prevention (CDC) have shown, low-income groups are more likely to have poorer health, be uninsured, and die younger than middle- or upper-class adults. Poverty, in combination with a culture of inequality, leads to worse health outcomes, and this effect runs across gender, age, and racial and ethnic boundaries. For example, low-income women are more likely to deliver babies with low birth weights, thereby placing these babies at risk for numerous physical and cognitive problems in life. Similarly, impoverished members of racially and ethnically underrepresented groups have lower life expectancies. Members of the lower class, overall, are four times more likely to view themselves in worse health compared with affluent groups. Low-income groups are much more likely to develop life-shortening diseases such as lung cancer, diabetes, heart disease, and other degenerative illnesses. These groups are also more likely to commit suicide and die from homicide in comparison to wealthier adults. The infant mortality rate among the poor is also much higher; in some populations of the United States, the infant mortality rate can approximate that of developing countries. However, because of the correlation between poverty and racially and ethnically underrepresented groups, many of these characteristics apply to particular ethnic groups more than others.
When it comes to health and illness among racially and ethnically underrepresented groups, Asian Americans and Pacific Islanders have some of the best health profiles. Reports illustrate that, in comparison to White Americans, these groups have a lower rate of death associated with cancer, heart disease, diabetes, and infant mortality. African Americans appear to have a worse health profile in comparison to White Americans, showing higher rates of death linked to cancer, heart disease, diabetes, drug and alcohol use, infant mortality, and HIV/AIDS. African American infants have twice the infant mortality rate of White infants. Specifically, African American males have the lowest life expectancy of any racial or gender category. Hispanic Americans have a mixed profile in comparison to White Americans, in that they have lower mortality rates attributable to cancer, heart disease, and infant mortality, but higher mortality rates attributable to diabetes, alcohol and drug use, and HIV/AIDS. Hispanic Americans also have a high mortality rate from influenza, pneumonia, and accidents. American Indians also have a mixed profile in this regard, showing higher rates of death from diabetes, alcohol and drug use, and infant mortality, but lower mortality rates compared to White Americans from cancer, heart disease, and HIV/AIDS. American Indians also show some of the highest rates of death by suicide in comparison to the general population. This group also has some of the highest mortality rates linked to diabetes compared to any racial category.
MCAT EXPERTISE
The MCAT will not expect you to be able to rattle off the relative rates of these illnesses across racial groups, but a sensitivity to these differences between groups may be important in passages related to sociology and public health.
KEY CONCEPT
Low-income groups, especially those who are racially and ethnically underrepresented, have an overall worse health profile in terms of morbidity and mortality rates.
When it comes to gender-related health disparities, most statistical information shows that women have better health profiles than men. This trend is true throughout the world. Female life expectancy has been consistently higher than male life expectancy since records began. While the gap in life expectancy is beginning to narrow in the United States, most countries still have higher life expectancies for female citizens than male citizens, as shown in Figure 12.8.
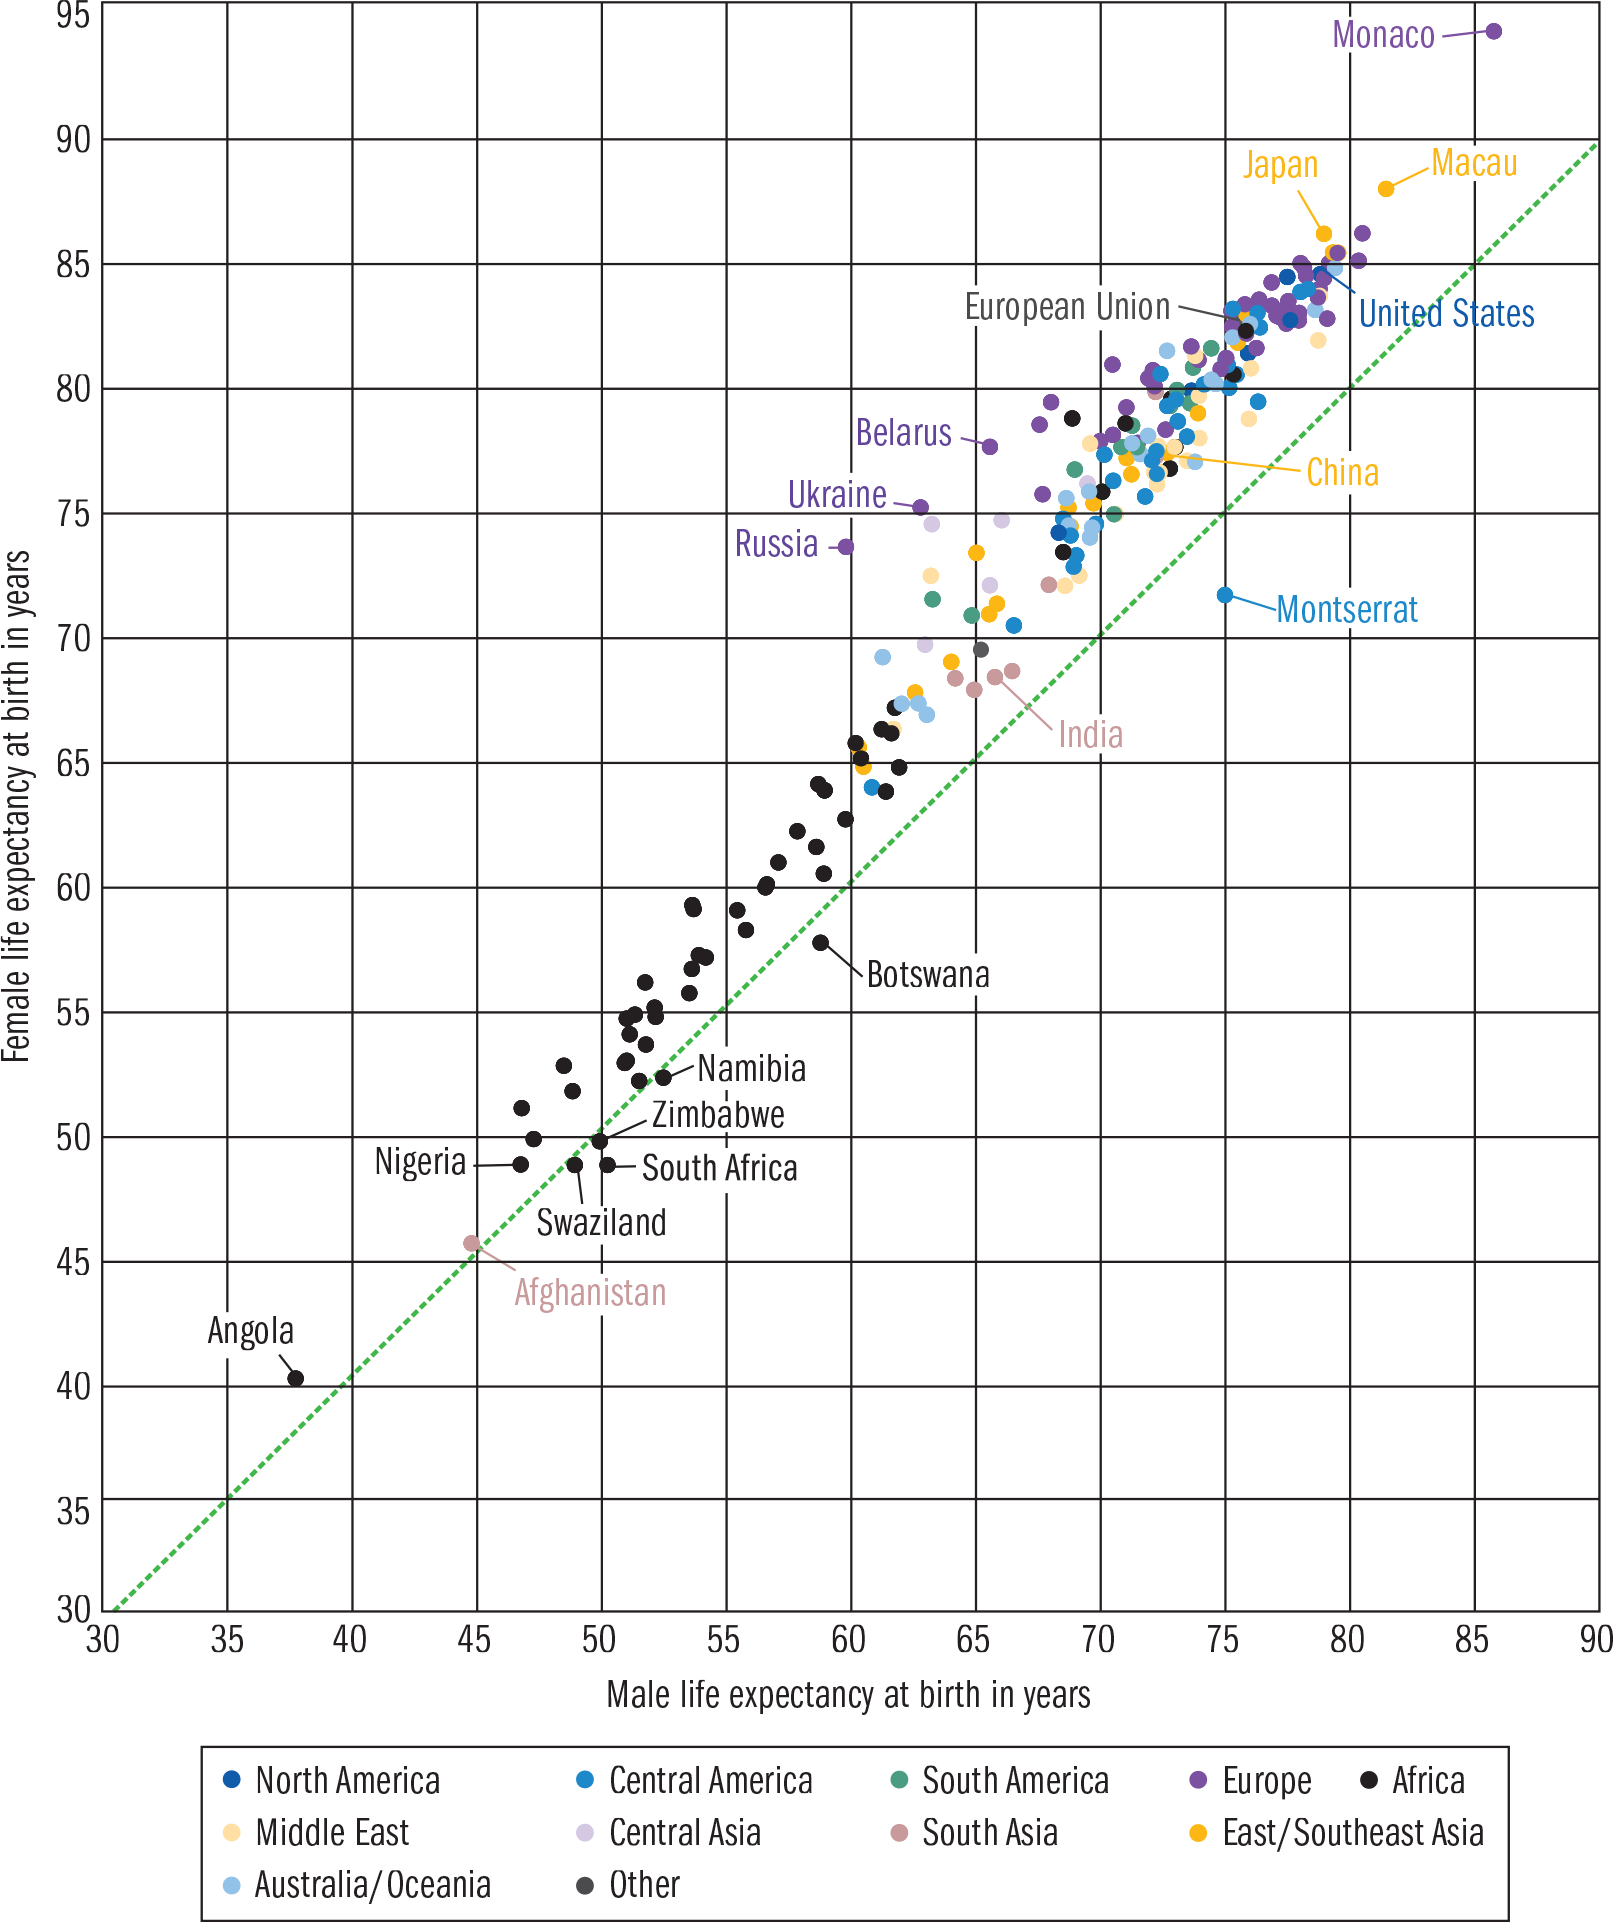
Figure 12.8. Male and Female Life Expectancies by Region and Country Note that female life expectancies are almost universally higher than male life expectancies. Based on data from the CIA World Factbook.
Mortality rates from heart disease, cancer, chronic lower respiratory diseases, and diabetes are higher for men than women. Men are also three times more likely than women to die from accidents, suicide, and homicide. Men are far less likely to seek medical attention than women. Men, especially those raised to have hypermasculine behaviors, may try to “tough it out” rather than go to a doctor. When men do seek healthcare, they are less likely to comply with medical instructions or adhere to medical advice.
While women show better mortality rates, this is not the case when it comes to morbidity rates for certain acute and chronic diseases. More women than men suffer from infectious and parasitic diseases, digestive problems, respiratory conditions, high blood pressure (hypertension), arthritis, diabetes, and inflammatory bowel diseases (colitis). Women tend to suffer more from illnesses and disabilities than men, but their conditions are less often life threatening.
KEY CONCEPT
In comparison to women, men tend to have worse mortality rates. However, women have higher morbidity rates. Differences in male and female health profiles are both biologically and sociologically determined, the latter being the result of factors like risk-taking behavior, hypermasculinity, and dangerous employment.
The reasons that men tend to have lower life expectancy rates are both sociological and biological. Sociologically, men are considered to be bigger risk takers, and therefore more likely to expose themselves to accidents and unintentional injuries. This is especially true of young men. Men are also more likely to be employed in dangerous jobs, such as the police force, steel industry, and coal mining. Men also have higher rates of alcohol use, speeding, and participation in potentially violent sports. Biologically speaking, men are at a disadvantage from infancy onward. Throughout life, men are more likely to come down with diseases that are life threatening.
Inequities in Healthcare
While the United States has one of the most advanced healthcare systems in the world, quality healthcare and services are not always extended to all. Like many institutions, quality healthcare favors those in higher social classes. Many people are frustrated by the way healthcare is delivered in the United States, especially with regard to health insurance. Further, the healthcare system of the United States is one of the few among industrialized nations that is not organized and planned by a central (governmental) system.
Passage of the Affordable Care Act (ACA) in 2010 was an attempt in the United States to increase coverage and affordability of insurance for all Americans, and also to reduce the overall costs of healthcare. Medicare and Medicaid are also programs that attempt to increase access to healthcare in the United States. Medicare covers patients over the age of 65, those with end-stage renal disease, and those with amyotrophic lateral sclerosis (ALS). Medicaid covers patients who are in significant financial need. However, disadvantaged groups, especially those who are poor, are still affected by disparities in healthcare both in terms of access and quality. Even those individuals who have Medicare or Medicaid may lack access, as many physicians will not accept such public insurance programs. Additionally, some doctors will not open practices in low-income neighborhoods, making access even harder for populations with low socioeconomic status. Consequently, individuals in the lower class are less likely to seek medical assistance until they are seriously ill; by then, intervention may be too late.
KEY CONCEPT
Medicare covers patients over 65, those with end-stage renal disease, and those with amyotrophic lateral sclerosis (ALS). Medicaid covers patients in significant financial need.
Some of the primary reasons low-income groups have higher mortality rates include poor access to quality medical care, poor nutrition, and feeling less in control of life circumstances. Those who are poor are more likely to smoke and be overweight or obese; they are less likely to engage in physical activity. In addition to socioeconomic status, race and ethnicity can create barriers to care. In race-concordant patient-physician relationships, the patient and physician are of the same race, whereas they are of different races in race-discordant relationships. Sometimes, culture and non-native language are viewed as contributors to pathology because they can act as obstacles to diagnosis and treatment. Also, despite efforts to systemically address unequal treatment of underrepresented populations by physicians, there are still inequalities and disparities in treatment relative to race and ethnicity over a wide range of medical specialties. In other words, underrepresented and low-income groups tend to face greater barriers to care, and poorer quality of care when they receive it. To be specific, it has been demonstrated that African Americans, Asian Americans, American Indians, and Hispanic Americans receive worse care than White Americans.
Quality of preventative care, acute treatment, and chronic disease management also differ regionally. States in New England and the Mid-Atlantic are shown to be in the top quartile of healthcare quality while states in the South are in the bottom quartile.
Outside of race and ethnicity, other identifiable characteristics may have a large impact on how patients are treated by their providers. One of the most common biases is discrimination against overweight and obese patients. This bias can apply to any individual who is overweight, regardless of socioeconomic status, gender, age, and racial and ethnic background, although there is a higher prevalence of obesity in low-income groups. Doctors may assume that being overweight or obese is the only cause of a patient’s health problems, which can sometimes lead to misdiagnoses and ineffective treatments. This, in turn, damages the trust necessary to form a strong doctor–patient relationship. As a result, patients who are overweight or obese are more likely than other patients to switch doctors repeatedly. When one does not have a consistent primary care doctor, continuity of care is nearly nonexistent. Additionally, patients who are overweight or obese are less likely to have quality preventative care and screenings, including screenings for breast and colon cancer.
In terms of gender, women tend to be favored by the healthcare system. As a whole, women tend to fare better when it comes to accessing healthcare, largely because women are more likely to be insured. Women tend to utilize healthcare services more than men, with more examinations, blood pressure checks, lab tests, drug prescriptions, and physician visits per year. Women also receive more services per visit than men do. Healthcare use is likely more common among women due to higher morbidity rates among women for many illnesses, thereby facilitating the need to seek medical attention. On the other hand, women are more likely to be delayed or unable to obtain necessary medical care, dental care, and prescription medicines. Also, for LGBTQ individuals, discrimination and decreased access to healthcare are quite common, often due to homophobia and other prejudices.
MCAT CONCEPT CHECK 12.2
Before you move on, assess your understanding of the material with these questions.
_________________________
- What is Waitzkin’s second sickness?
_________________________
- What is the relationship between class, ethnicity, and health?
_________________________
- Why are women more likely to have better health profiles than men?
_________________________
- What are some of the factors that contribute to healthcare disparities between classes?
Conclusion
So what have we learned? We do not live in a perfect world where valuable materials and resources are unlimited and evenly distributed. In the United States and on a worldwide level, social stratification is an unfortunate reality. In a class-based economic system such as ours, status and power are inextricably linked, which can either facilitate or hinder access to social capital and its associated rewards. This is especially the case for certain disadvantaged groups based on categories of class, race, gender, and age. While not perfect, our class system does tend to allow for upward social mobility either in one’s lifetime or across generations. At the heart of America’s socioeconomic values is the principle of meritocracy, which means that through hard work, credentials, and dedication, one can move up in society. However, many people in the United States remain impoverished. Social inequality and social exclusion make it increasingly difficult for low-income groups to improve their socioeconomic condition. Some hold that social inequalities such as poverty remain because these inequalities are passed down from one generation to another. While there is some truth to the social reproduction of poverty, one’s situational context also plays a role through spatial inequality. Where one lives in this world has an impact on one’s position in life, especially in terms of accessing key resources and prosperous opportunities. Spatial inequality remains at the residential, environmental, and global level.
But how do such social inequalities influence health and healthcare disparities? Well, as is the case with many facets of life, wealth matters. Those with greater income typically have access to better quality healthcare. This is especially the case in the U.S. healthcare system because of uneven levels of coverage and high healthcare costs. Socioeconomic status or class greatly impacts one’s ability to navigate the system and procure healthcare in the United States. Low-income racially and ethnically underrepresented groups tend to be worse off, having both poorer health and poorer access to healthcare. Women, despite being more prone to chronic and degenerative diseases, tend to fare better than men when it comes to overall health and accessing and utilizing healthcare resources.
While the U.S. healthcare system is undergoing a significant reorientation and taking on a more preventative approach, it is more important now than ever to place a greater emphasis on sociological issues to understand the relationship between social stratification and health and healthcare disparities. Illness and disease are a product of social as well as psychological and physiological issues. This chapter is the last chapter in MCAT Behavioral Sciences Review; you have therefore covered all of the psychology and sociology content required for the MCAT. This is a fitting chapter to finish this discussion, and we leave you with a charge: as you prepare for the MCAT, medical school, and life as the physician you deserve to be, think about the changes that are needed in the U.S. healthcare system. Serve your local, national, and international community and improve the health status of those around you, while contributing to a future where everyone can access quality healthcare.
GO ONLINE
You’ve reviewed the content, now test your knowledge and critical thinking skills by completing a test-like passage set in your online resources!
CONCEPT SUMMARY
Social Class
- Social stratification is based on socioeconomic status (SES). Socioeconomic status depends on ascribed status and achieved status.
- Ascribed status is involuntary and derives from clearly identifiable characteristics, such as age, gender, and skin color.
- Achieved status is acquired through direct, individual efforts.
- A social class is a category of people with shared socioeconomic characteristics. The three main social classes are upper, middle, and lower class. These groups also have similar lifestyles, job opportunities, attitudes, and behaviors.
- Prestige is the respect and importance tied to specific occupations or associations.
- Power is the capacity to influence people through real or perceived rewards and punishments. It often depends on the unequal distribution of valued resources. Power differentials create social inequality.
- Anomie is a state of normlessness. Anomic conditions erode social solidarity by means of excessive individualism, social inequality, and isolation.
- Social capital is the investment people make in their society in return for economic or collective rewards. Social networks, either situational or positional, are one of the most powerful forms of social capital and can be achieved through establishing strong and weak social ties.
- Meritocracy refers to a society in which advancement up the social ladder is based on intellectual talent and achievement.
- Social mobility allows one to acquire higher-level employment opportunities by achieving required credentials and experience. Social mobility can either occur in a positive upward direction or a negative downward direction depending on whether one is promoted or demoted in status.
- Poverty is a socioeconomic condition. In the United States, the poverty line is determined by the government’s calculation of the minimum income requirements for families to acquire the minimum necessities of life.
- Social reproduction refers to the passing on of social inequality, especially poverty, from one generation to the next.
- Poverty can either be absolute or relative.
- Absolute poverty is when people do not have enough resources to acquire basic life necessities, such as shelter, food, clothing, and water.
- Relative poverty is when one is poor in comparison to a larger population.
- Social exclusion is a sense of powerlessness when individuals feel alienated from society.
- Spatial inequality is a form of social stratification across territories and their populations, and can occur along residential, environmental, and global lines.
- Urban areas tend to have more diverse economic opportunities and more ability for social mobility than rural areas. Urban areas also tend to have more neighborhoods that are low-income and racially and ethnically underrepresented than do rural areas.
- Formation of higher-income suburbs is a common occurrence, and is due in part to the limited mobility of lower-income groups in urban centers.
- Environmental injustice refers to an uneven distribution of environmental hazards in communities. Lower-income neighborhoods may lack the social and political power to prevent the placement of environmental hazards in their neighborhoods.
- Globalization has led to further inequalities in space, food and water, energy, housing, and education as the production of goods shifts to cheaper and cheaper labor markets. This has led to significant economic hardship in industrializing nations.
Epidemiology and Disparities
- Incidence is calculated as the number of new cases of a disease per population at risk in a given period of time: for example, new cases per 1000 at-risk people per year.
- Prevalence is calculated as the number of cases of a disease per population in a given period of time: for example, cases per 1000 people per year.
- Morbidity is the burden or degree of illness associated with a given disease.
- Mortality refers to deaths caused by a given disease.
- Health is dependent on geographic, social, and economic factors.
- The second sickness refers to an exacerbation of health outcomes caused by social injustice.
- Poverty is associated with worse health outcomes, including decreased life expectancy, higher rates of life-shortening diseases, higher rates of suicide and homicide, and higher infant mortality rates.
- Certain racially and ethnically underrepresented groups have worse health profiles than others. African Americans have the worst health profiles; White Americans, American Indians, and Hispanic Americans have health profiles in the middle; and Asian Americans and Pacific Islanders have the best health profiles.
- Females have better health profiles than males, including higher life expectancy, lower rates of life-threatening illnesses, and higher rates of accessing and utilizing health resources. However, females have higher rates of chronic diseases and higher morbidity rates.
- Efforts to improve healthcare for underserved populations include the Affordable Care Act (ACA) and the Medicare and Medicaid programs.
- Healthcare access and quality differ across the population.
- Low-income groups and racially and ethnically underrepresented groups (specifically, African Americans, Asian Americans, American Indians, and Hispanic Americans) receive worse care than high-income groups and White Americans, respectively.
- Biases against overweight or obese patients are associated with lower-quality treatment, including less preventative care and fewer screenings.
- Women tend to have better access to healthcare and utilize more healthcare resources than men.
- LGBTQ individuals may have barriers to care due to prejudices, discrimination, homophobia, and transphobia.
ANSWERS TO CONCEPT CHECKS
**12.1**
- SES is determined by two factors: it can be ascribed according to physical or external characteristics such as age, gender, or skin color, or acquired through direct efforts such as hard work or merit.
- The less social capital a person has (reduced network equality and equality of opportunity), the more social inequality. This, in turn, decreases social cohesion.
- Social inequality is highest among racially and ethnically underrepresented groups (especially African Americans and Hispanic Americans), households headed by women, and older adults. It is also most prevalent among those living in poverty.
- Social mobility can be dependent on intellectual talent and achievement (meritocratic competition) but can also be obstructed by concentrated power as well as discrimination based on ethnicity, gender, age, or other identifiable characteristics.
- Environmental hazards tend to be located in low-income areas with a higher population of racially and ethnically underrepresented groups. Poor living conditions can result in increased illness and disease among these groups of people.
**12.2**
- The second sickness refers to the fact that health outcomes are exacerbated by social inequalities and social injustice. As a result, higher-income groups have longer life expectancies than lower-income groups.
- Low-income racially and ethnically underrepresented groups have higher morbidity rates and overall worse health compared to the middle and upper classes. The lower class also has higher infant mortality rates, homicide rates, and suicide rates in comparison to wealthier classes.
- Women typically have longer life expectancies and an overall better health profile in comparison to men. This can be attributed to both biological and sociological causes: women are less likely to have life-threatening conditions, although they do have higher morbidity rates. Women are also more likely to seek care and to utilize healthcare services than men.
- Low-income groups have less access to healthcare services and often experience lower quality healthcare. Poor Americans are less likely to be insured and consequently are less likely to seek medical attention until conditions have become extremely serious, thereby limiting available interventions. As a result, morbidity and mortality rates are highest among low-income groups.
SCIENCE MASTERY ASSESSMENT EXPLANATIONS
1. D
Social stratification based on direct efforts, such as merit, is a form of achieved socioeconomic status. Ascribed socioeconomic status, (A), is based on identifiable external characteristics. Achieved status may be due to meritocratic competition, (B), but other individual efforts can also be associated with achieved status. Anomic conditions, (C), are those that cause a breakdown between the individual and society and erode social solidarity.
2. C
Low social class may lead to low social capital. Members of the lower class often have smaller numbers of weak ties in social networks, and therefore have less opportunity to invest in society and reap its benefits.
3. D
Globalization does not typically lead to global equality; rather, globalization tends to create further global inequalities. In regard to environmental justice, higher numbers of hazardous waste facilities tend to be found in low-income neighborhoods, (A). Poor living conditions tend to be associated with greater health problems, including tuberculosis, (B). Finally, environmental pollution is more prevalent in areas with larger populations of underrepresented groups, especially when low-income, (C).
4. B
Groups with high income tend to have increased life expectancy rates, not decreased. People with low income have higher mortality rates than those with high income, (A). Low-income women tend to have children with lower birth weights, (C). Finally, rates of various diseases, including lung cancer, are increased among low-income groups, (D).
5. D
Prevalence is defined as the total number of cases divided by the possibly affected population during a period of time. Here, the period of time is defined as one point: the end of the year. At the end of the year, there are 30 total cases in a population of 1000 individuals, but only 500 of those individuals can develop prostate cancer, meaning the prevalence is 30 ÷ 500.
6. A
Incidence is defined as the total number of new cases divided by the at-risk population during a period of time. Here, the period of time is one year. There were 10 new cases in this year, and the at-risk population will be only the males who do not already have prostate cancer; the 20 males already diagnosed and the 500 females should not be included in the at-risk population. Therefore, the incidence in this population is 10 ÷ 480.
7. D
In this scenario, the children remain in the same socioeconomic class as their parent, indicating a lack of social mobility, (A) and (B). Rather, this is an example of social reproduction, in which social inequality, especially poverty, is passed from one generation to the next.
8. C
Relative poverty is a comparative term: it describes being poorer than those in the surrounding population. Members of the upper class can live in relative poverty compared to others in their neighborhood if they are not as well-off as their neighbors. Relative poverty is not directly associated with upward or downward social mobility, eliminating (B) and (D); individuals living in relative poverty could exhibit mobility in either direction or no social mobility at all.
9. C
Suburbs tend to have larger upper- and middle-class populations than urban centers; urban centers tend to have larger low-socioeconomic status populations than suburbs. This is due, in part, to the increased mobility seen in upper- and middle-class populations, which permits their migration into the suburbs.
10. A
Morbidity refers to the burden of illness, or the severity or degree of illness. Mortality, (B), refers to deaths caused by a given illness. Second sickness, (C), is a term used to describe the exacerbation of health outcomes due to social injustice. Chronicity, (D), refers to the duration of a disease, not its severity or significance for the patient.
11. B
In comparison to White Americans, Asian Americans tend to have better overall health profiles. African Americans, (A), tend to have worse overall health profiles. Hispanic Americans and American Indians, (C) and (D), both have mixed health profiles in comparison to White Americans: they are better off in some categories and worse off in others. However, Hispanic Americans and American Indians do not have better overall health profiles than White Americans.
12. C
Medicare covers patients over the age of 65 (older age groups), those with end-stage renal disease, and those with amyotrophic lateral sclerosis (ALS). Medicaid covers patients below a certain socioeconomic level.
13. C
Morbidity refers to the burden or severity of disease. All of the factors listed are true with regard to low-socioeconomic status populations; however, high homicide rates cause increases in mortality, not morbidity.
14. A
If the threshold for hypertension (high blood pressure) were lowered, more individuals would be fit the criteria for the disease. If the number of individuals with the disease increases and the population stays the same overall, there will be an increased prevalence of the disease.
15. B
In comparison to females, males visit primary care doctors less frequently. All of the other trends listed here have been documented.
GO ONLINE
Consult your online resources for additional practice.
SHARED CONCEPTS
Behavioral Sciences Chapter 5
Motivation, Emotion, and Stress
Behavioral Sciences Chapter 6
Identity and Personality
Behavioral Sciences Chapter 7
Psychological Disorders
Behavioral Sciences Chapter 8
Social Processes, Attitudes, and Behavior
Behavioral Sciences Chapter 10
Social Thinking
Behavioral Sciences Chapter 11
Social Structure and Demographics