Brain Rhythms and Sleep
BOX 19.1 PATH OF DISCOVERY: The Puzzle of Brain Rhythms, by Stephanie R. Jones
BOX 19.2 OF SPECIAL INTEREST: Walking, Talking, and Screaming in Your Sleep
BOX 19.3 OF SPECIAL INTEREST: The Longest All-Nighter
Wakefulness and the Ascending Reticular Activating System
BOX 19.5 OF SPECIAL INTEREST: Mutant Hamster Clocks
Earth has a rhythmic environment. Temperature, precipitation, and daylight vary with the seasons; light and dark trade places each day; tides ebb and flow. To compete effectively and survive, an animal’s behavior must oscillate with the cadences of its environment. Brains have evolved a variety of systems for rhythmic control. Sleeping and waking are the most striking periodic behavior. But some rhythms controlled by the brain have much longer periods, as in hibernating animals, and many have shorter periods, such as the cycles of breathing, the steps of walking, the repetitive stages of one night’s sleep, and the electrical rhythms of the cerebral cortex. The functions of some rhythms are obvious, while others are obscure, and some rhythms indicate pathology.
In this chapter, we explore selected brain rhythms, beginning with the fast and proceeding to the slow. The forebrain, especially the cerebral cortex, produces a range of rapid electrical rhythms that are easily measured and that closely correlate with interesting behaviors, including sleep. We discuss the electroencephalogram, or EEG, because it is the classical method of recording brain rhythms and is essential for studying sleep. Sleep is explored in detail because it is complex, ubiquitous, and so dear to our hearts. Finally, we summarize what is known about the timers that regulate the everyday ups and downs of our hormones, body temperature, alertness, and metabolism. Almost all physiological functions change according to daily cycles known as circadian rhythms. The clocks that time circadian rhythms are in the brain, calibrated by the sun via the visual system, and they profoundly influence our health and well-being.
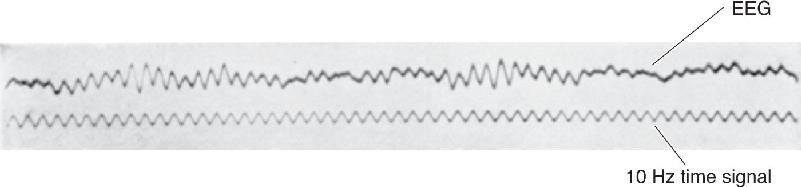
Sometimes the forest is more interesting than the trees. Similarly, we are often less concerned with the activities of single neurons than with understanding the activity of a large population of neurons. The electroencephalogram (EEG) is a measurement of electrical activity from the surface of the scalp that enables us to glimpse the generalized activity of the cerebral cortex. The roots of the EEG lie in work done by English physiologist Richard Caton in 1875. Caton made electrical recordings from the surface of dog and rabbit brains using a primitive device sensitive to voltage. The human EEG was first described by Austrian psychiatrist Hans Berger in 1929, who observed that waking and sleeping EEGs are distinctly different. Figure 19.1 shows one of his first published records, taken from the head of his 15-year-old son, Klaus. Today, the EEG is used primarily to help diagnose certain neurological conditions, especially the seizures of epilepsy, and for research purposes, notably to study the stages of sleep and cognitive processes during wakefulness.

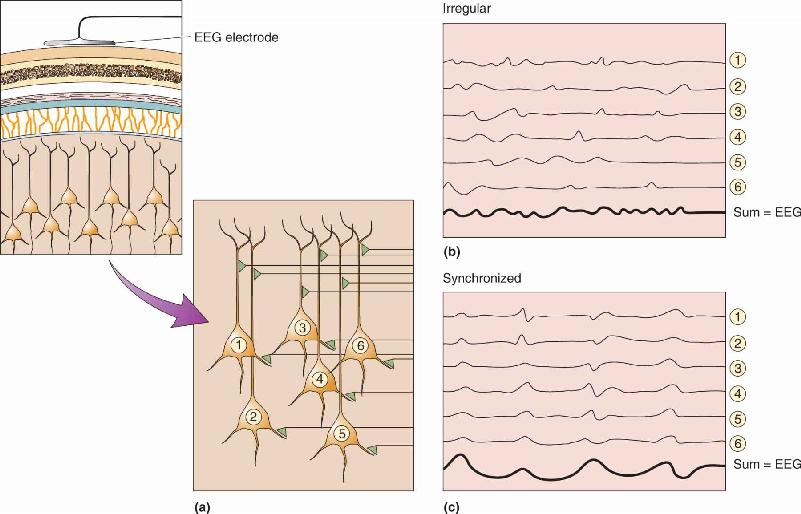
FIGURE 19.1 The first published human EEG rhythm. (Source: Berger, 1929.)
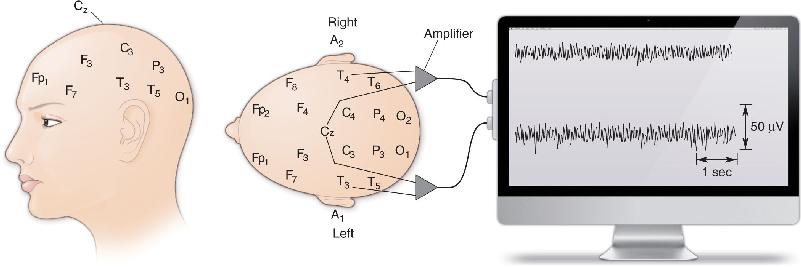
Recording an EEG is relatively simple. The method is usually noninvasive and is painless. Countless people have slept through entire nights wearing EEG electrodes in the comfort of sleep research laboratories (Figure 19.2). The electrodes are wires taped to the scalp, along with conductive paste to ensure a low-resistance connection. Figure 19.3 shows a common EEG configuration, in which some two dozen electrodes are fixed to standard positions on the head and connected to banks of amplifiers and recording devices. Small voltage fluctuations, usually a few tens of microvolts (μV) in amplitude, are measured between selected pairs of electrodes. Different regions of the brain—anterior and posterior, left and right—can be examined by selecting the appropriate electrode pairs. The typical EEG record is a set of many simultaneous squiggles, indicating voltage changes between pairs of electrodes.

FIGURE 19.2 A subject in a sleep research study. The subject shown here is American sleep researcher Nathaniel Kleitman, codiscoverer of REM sleep. The white patches on his head are pieces of tape holding EEG electrodes, and those next to his eyes hold electrodes that monitor his eye movements. (Source: Carskadon, 1993.)


FIGURE 19.3 Standard positions for the placement of EEG electrodes. A, auricle (or ear); C, central; Cz, vertex; F, frontal; Fp, frontal pole; O, occipital; P, parietal; T, temporal. Wires from pairs of electrodes are fed to amplifiers, and each recording measures voltage differences between two points on the scalp. The output of each amplifier is stored in a computer for analysis and display.
What part of the nervous system generates the fluctuations and oscillations of an EEG? For the most part, an EEG measures voltages generated by the currents that flow during synaptic excitation of the dendrites of many pyramidal neurons in the cerebral cortex, which lies right under the skull and makes up most of the brain’s mass. But the electrical contribution of any single cortical neuron is exceedingly small, and the signal must penetrate several layers of non-neural tissue, including the meninges, fluid, bones of the skull, and skin, to reach the electrodes (Figure 19.4). Therefore, it takes many thousands of underlying neurons, activated together, to generate an EEG signal big enough to be measured at all.

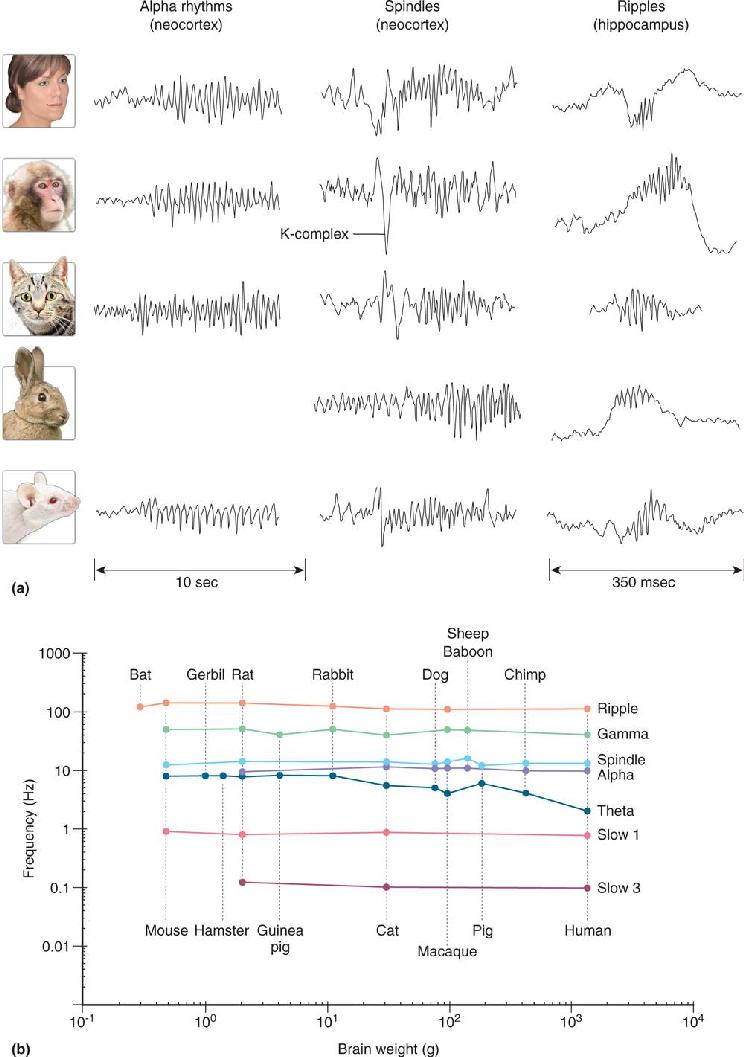
FIGURE 19.4 The generation of very small electrical fields by synaptic currents in pyramidal cells. In this case, the active synapse is on the upper part of the dendrite. When the afferent axon fires, the presynaptic terminal releases glutamate, which opens cation channels. Positive current flows into the dendrite, leaving a slight negativity in the extracellular fluid. Current spreads down the dendrite and escapes from its deeper parts, leaving the fluid slightly positive at those sites. The EEG electrode (referred to a second electrode some distance away) measures this pattern through thick tissue layers. Only if thousands of cells contribute their small voltage is the signal large enough to reach the scalp surface. (Notice the EEG convention of plotting the signals with negativity upward.) Description
This has an interesting consequence: The amplitude of the EEG signal strongly depends, in part, on how synchronous is the activity of the underlying neurons. When a group of cells is excited simultaneously, the tiny signals sum to generate one larger surface signal. However, when each cell receives the same amount of excitation but the excitations are spread out in time, the summed signals are meager and irregular (Figure 19.5). Notice that in this case, the number of activated cells and the total amount of excitation may not have changed, only the timing of the activity. If synchronous excitation of this group of cells is repeated again and again, the resulting EEG will consist of large, rhythmic waves. We often describe rhythmic EEG signals in terms of their relative amplitude, suggesting how synchronous the underlying activity is (although other factors, especially the number of active neurons, contribute to amplitude as well).

FIGURE 19.5 The generation of large EEG signals by synchronous activity. (a) In a population of pyramidal cells located under an EEG electrode, each neuron receives many synaptic inputs. (b) If the inputs fire at irregular intervals, the pyramidal cell responses are not synchronized, and the summed activity detected by the electrode has a small amplitude. (c) If the same number of inputs fire within a narrow time window so the pyramidal cell responses are synchronized, the resulting EEG is much larger. Description
An alternative way to record the rhythms of the cerebral cortex is with magnetoencephalography (MEG). Recall from physics that whenever electrical current flows, a magnetic field is generated according to the “right hand rule” (hold up your right hand loosely; if your thumb points in the direction of electrical current flow, the rest of your curling fingers indicate the direction of the magnetic field). It stands to reason that when neurons generate currents, as in Figure 19.4, they should also produce a magnetic field. But the magnetic field they generate is minuscule. Even the strongest brain activity, with many synchronously active neurons contributing, produces a field strength just one billionth that of the magnetic field generated by the Earth, nearby power lines, and the movement of distant metal objects such as elevators and cars. Detecting the brain’s infinitesimal magnetic signals in the midst of those relatively immense sources of environmental magnetic “noise” is analogous to listening for the footsteps of a mouse in the middle of a rock concert! It requires a specially screened room to shield out the magnetic noise and a large, expensive instrument with highly sensitive magnetic detectors that are cooled with liquid helium to –269 °C (Figure 19.6).

FIGURE 19.6 Magnetoencephalography (MEG). (a) A person receiving an MEG scan. (b) The tiny magnetic signals generated by neurons on the brain are detected by an array of 150 sensitive magnetic detectors. (c) Researchers use the signals to calculate the locations of sources of neural activity (color-coded, in this image). (Sources: part a, http://infocenter.nimh.nih.gov/il/public_il/image_details.cfm?id=80; parts b and c, Los Alamos National Laboratory.) Description
The capabilities of MEG complement those of other methods that measure brain function. MEG is much better than EEG at localizing the sources of neural activity in the brain, particularly those deep below the surface. Like EEG, MEG can record rapid fluctuations of neural activity that are much too fast to be detected by functional magnetic resonance imaging (fMRI) or positron emission tomography (PET) (see Box 7.3). MEG cannot provide the spatially detailed images of fMRI, however. Another important distinction is that EEG and MEG directly measure the activity of neurons, whereas fMRI and PET detect changes in blood flow or metabolism, which are controlled in part by neuronal activity but which may also be influenced by other physiological factors. MEG is currently being used in experimental studies of the human brain and its cognitive functions and as an aid in the diagnosis of epilepsy and language disorders (Box 19.1).
I’ve always loved a good puzzle, and what better puzzle is there than understanding how our brains form perceptions and actions? This isn’t the puzzle I set out to solve at the start of my career. My analytic nature led me to pursue a Ph.D. in mathematics at Boston University. I intended to study the mathematics of chaos, but as with many careers my path diverged unexpectedly. A year into my graduate study, mathematician Nancy Kopell established the Center for BioDynamics, catalyzing growing interest in the applications of dynamical systems theory to the study of biological phenomena, including neuroscience. After attending a few neuroscience lectures, I knew this was a puzzle I wanted to help solve. To my good fortune, Nancy took me on as a student. I began using mathematics to study rhythmic activity in simplified representations of neural circuits, such as the central pattern-generating network that regulates crayfish swimming. By the time I finished my mathematics Ph.D., I was passionate about neuroscience. I knew I wanted to apply my knowledge to understand human brain dynamics. Little did I know just how many pieces are in that puzzle!
For the next decade, I studied human brain rhythms using magnetoencephalography (MEG) in the brain-imaging center at Massachusetts General Hospital (MGH). At MGH, my path of discovery was again shaped by the gift of fantastic mentors and colleagues. The first is my now close colleague, neurophysiologist Chris Moore, who was himself a postdoctoral fellow at the time. Chris enlightened me to the nuances of neuroscience and to the idea that the somatosensory system was the “ideal system to study” because of its puzzle-like topographical representation of the body, the homunculus (see Figure 12.19). With MEG we began studying tactile perception, such as the detection of light taps to the fingertips, in humans. Chris’s notion that this system was “ideal” was fortuitous, as was revealed in a surprising way through the mentorship of physicist Matti Hämäläinen, director of the MEG center. Matti taught me the ins and outs of MEG data collection and, importantly, the electromagnetic physics underlying these brain signals. I learned that the intracellular currents within the long, aligned dendrites of pyramidal neurons are the primary generators of the recorded magnetic field signals. Further, the pyramidal neurons in primary somatosensory cortex (S1) are “ideally” oriented to produce strong MEG signals during finger taps that can be reliably localized to the hand representation in S1. This enabled us to do careful studies of the neural generators of brain rhythms.
As with all MEG (and EEG) recordings, the dominant activities from S1 are low-frequency, large-amplitude rhythms, including the beta rhythms of 15–29 Hz. We discovered that when a subject directs her attention to her finger before it is tapped, the beta rhythms in the hand area of S1 decrease compared to when her attention is directed elsewhere. Attention and reduced beta rhythms correlated with an increase in the subject’s ability to feel a light tap. Our results were similar to previous findings in the visual cortex, suggesting that beta rhythms may signal inhibitory processes in sensory areas of cortex. But why? What is it about these rhythms, if anything, that links them to decreased perception? And why, in conditions like Parkinson’s disease, are beta rhythms over-expressed in motor cortex with a corresponding decrease in motor actions?
To address this piece of the puzzle, I turned to my mathematics roots and began constructing a computational neural model to study the origins of these rhythms. My prior research had given me solid intuitions about how stable rhythms can emerge from neural circuits. However, after much exploration using simplified mathematical representations of neural circuits (e.g., collapsing the activity of an entire neuron to a single point), I realized these models simply could not reproduce signals that resembled the recordings. Next, I drew on the pioneering work of Yoshio Okada, who combined experimental and mathematical modeling to understand MEG signals from pyramidal neurons. Equipped with my new knowledge of the biophysics underlying MEG, I constructed more complex models that included details of the structure and physiology of pyramidal neurons and other cortical neuron types. This endeavor spanned several years that also included the birth of the first of my three children.
To my delight, the detailed model yielded novel and non-intuitive predictions about rhythms. Specifically, it predicted that beta rhythms emerge from the integration of two sets of synaptic inputs that are roughly synchronous and that excite different parts of pyramidal cell dendrites. These inputs drive alternating electrical currents up and down within the dendrites to reproduce rhythms remarkably consistent with recordings. The model not only accounted for many features of the MEG rhythms in S1 but also suggested how these rhythms influence sensory processing. I subsequently tested these secondary predictions with the MEG data, and to my surprise they were confirmed! This discovery was thrilling since the mathematical model was now predicting what the data from new experiments would look like. Finally, pieces of the puzzle were fitting together!
The close agreement between the model’s output and the recorded human data gives us confidence in the model’s predictions about how neurons generate beta rhythms. More importantly, the model suggests how rhythms influence brain function. Through continued collaboration with Chris Moore and other neurophysiologists and neurosurgeons, we are currently testing model-derived predictions with electrode recordings. We may discover the pieces do not fit together exactly as the model suggests. However, through collaboration and the interplay of interdisciplinary methods, I am convinced we can build interpretive bridges between neural activity and human brain functions. Solving the puzzle of brain rhythms will be an important and exciting step along the way.
EEG rhythms vary dramatically and often correlate with particular states of behavior (such as level of attentiveness, sleeping, or waking) and pathology (seizures or coma). Figure 19.7 shows part of a normal EEG. The brain can generate rhythms that are as slow as about 0.05 Hz and as fast as 500 Hz or more. The main EEG rhythms are categorized by their frequency range, and each range is named after a Greek letter. Delta rhythms are slow, less than 4 Hz, are often large in amplitude, and are a hallmark of deep sleep. Theta rhythms are 4–7 Hz and can occur during both sleeping and waking states. Alpha rhythms are about 8–13 Hz, are largest over the occipital cortex, and are associated with quiet, waking states; Mu rhythms are similar in frequency to alpha rhythms but are largest over the motor and somatosensory areas. Beta rhythms are about 15–30 Hz. Gamma rhythms are relatively fast, ranging from about 30–90 Hz, and signal an activated or attentive cortex. Additional rhythms include spindles, brief 8–14 Hz waves associated with sleep, and ripples, brief bouts of 80–200 Hz oscillations. An interesting feature of EEG rhythms is that their characteristics are remarkably similar across mammalian brains from mice to humans, despite 17,000-fold differences in brain mass (Figure 19.8).

FIGURE 19.7 A normal EEG. The subject is awake and quiet, and recording sites are indicated at the left. The first few seconds show normal alpha activity, which has frequencies of 8–13 Hz and is largest in the occipital regions. About halfway through the recording, the subject opened his eyes, signaled by the large blink artifacts on the top traces (arrows), and alpha rhythms were suppressed. Description

FIGURE 19.8 EEG rhythms across species. (a) Examples of alpha rhythms, spindles, and ripples from human, macaque monkey, cat, rabbit, and rat. Note that the 10 sec calibration for alpha rhythms also applies to the spindles. (b) Relationship between the brain weight and main frequency for each type of EEG rhythm across species. Each colored line represents the frequencies of a single type of rhythm recorded from several species (the absence of data about a particular rhythm for a species does not necessarily mean that species lacks that rhythm). Note how little the properties of the EEG rhythms vary despite the vast range of brain sizes. (Source: Buzsáki et al., 2013) Description
While analysis of an EEG cannot tell us what a person is thinking, it can help us know if a person is thinking. In general, high-frequency, low-amplitude rhythms are associated with alertness and waking, or the dreaming stages of sleep. Low-frequency, high-amplitude rhythms are associated with nondreaming sleep states, certain drugged states, or the pathological condition of coma. This is logical because when the cortex is most actively engaged in processing information, whether generated by sensory input or by internal processes, the activity level of cortical neurons is relatively high but also relatively unsynchronized. In other words, each neuron, or a very small group of neurons, is vigorously involved in a slightly different aspect of a complex cognitive task; it fires rapidly but not quite simultaneously with most of its neighbors. This leads to low synchrony, so EEG amplitude is low, and gamma and beta rhythms dominate. In contrast, during deep sleep, cortical neurons are not engaged in information processing, and large numbers of them are phasically excited by a common, slow, rhythmic input. In this case, synchrony is high, so EEG amplitude is high.
Electrical rhythms abound in the cerebral cortex. But how are they generated, and what functions, if any, do they perform? Let’s take a look at each of these questions.
The Generation of Synchronous Rhythms. The activity of a large set of neurons will produce synchronized oscillations in one of two fundamental ways: (1) They may all take their cues from a central clock, or pacemaker, or (2) they may share or distribute the timing function among themselves by mutually exciting or inhibiting one another. The first mechanism is analogous to a band with a leader, with each musician playing in strict time to the beat of the leader’s baton (Figure 19.9a). The second mechanism is more subtle because the timing arises from the collective behavior of the cortical neurons themselves. Musically, it is more like a jam session (Figure 19.9b).

FIGURE 19.9 Two mechanisms of synchronous rhythms. Synchronous rhythms can (a) be led by a pacemaker or (b) arise from the collective behavior of all participants. Description
The concept of shared synchronous rhythm can be easily demonstrated by a group of people, even nonmusical ones. Simply tell them to begin clapping, but give them no instructions about how fast to clap or whose beat to follow. Almost immediately they will all be clapping in synchrony! How? By listening and watching each other, they will adjust their clapping rates to match. A key factor is person-to-person interaction; in a network of neurons, these interactions occur via synaptic connections. People naturally tend to clap within a narrow range of frequencies, so they don’t have to adjust their timing very far in order to clap in synchrony. Likewise, some neurons may fire at certain frequencies much more than others. This kind of collective, organized behavior can generate rhythms of impressive dimensions, which can move in space and time. Have you ever been part of a human wave in the stands of a sold-out football stadium?
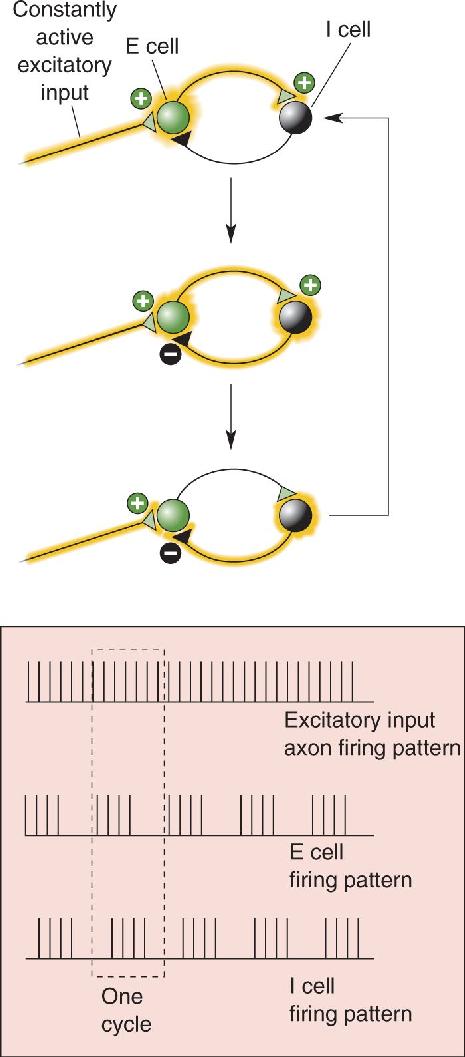
Many different circuits of neurons can generate rhythmic activity. A very simple model oscillator, consisting of just one excitatory and one inhibitory neuron, is shown in Figure 19.10. Most real neural oscillators include far more neurons but similar basic features: a source of constant excitatory drive, feedback connections, and synaptic excitation and inhibition.

FIGURE 19.10 A two-neuron oscillator. One excitatory cell (E cell) and one inhibitory cell (I cell) synapse upon each another. As long as there is a constant excitatory drive (which does not have to be rhythmic) onto the E cell, activity will tend to trade back and forth between the two neurons. One activity cycle through the network will generate the pattern of firing shown in the dashed box. Description
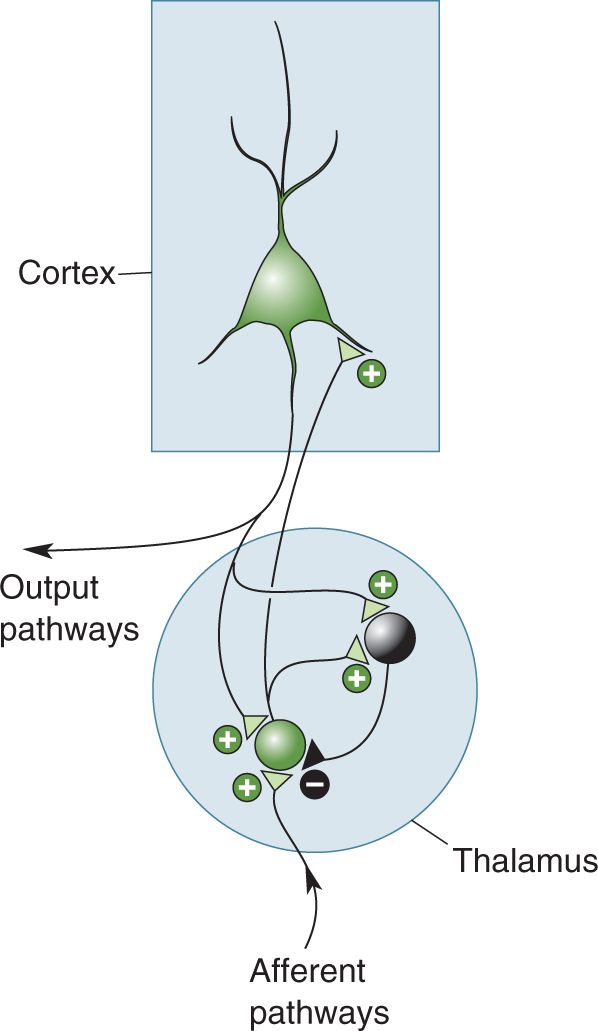
Within the mammalian brain, rhythmic, synchronous activity is usually coordinated by a combination of the pacemaker and collective methods. For example, the thalamus, with its massive input to all of the cortex, can act as a powerful pacemaker. Under certain conditions, thalamic neurons can generate very rhythmic action potential discharges (Figure 19.11). But how do thalamic neurons oscillate? Some thalamic cells have a particular set of voltage-gated ion channels that allow each cell to generate very rhythmic, self-sustaining discharge patterns even when there is no external input to the cell. The rhythmic activity of each thalamic pacemaker neuron then becomes synchronized with many other thalamic cells via a hand-clapping kind of collective interaction. Synaptic connections between excitatory and inhibitory thalamic neurons force each individual neuron to conform to the rhythm of the group. These coordinated rhythms are then passed to the cortex by the thalamocortical axons, which excite cortical neurons. In this way, a relatively small group of centralized thalamic cells (acting as the band leader) can compel a much larger group of cortical cells (acting as the band) to march to the thalamic beat (Figure 19.12).

FIGURE 19.11 A one-neuron oscillator. At times during sleep states, thalamic neurons fire in rhythmic patterns that do not reflect their input. Shown here are intracellular recordings of membrane voltage in such a case. (a) A short pulse (less than 0.1 second) of stimulus current was applied, and the cell responded with almost 2 seconds of rhythmic firing, first with bursts at about 5 Hz and then with single spikes. (b) Two of the bursts expanded in time; each burst is a cluster of five or six action potentials. (Source: Adapted from Bal and McCormick, 1993, Fig. 2.) Description

FIGURE 19.12 Rhythms in the thalamus drive rhythms in the cerebral cortex. The thalamus can generate rhythmic activity because of the intrinsic properties of its neurons and because of its synaptic interconnections. In the thalamus, green represents a population of excitatory neurons, and black represents a population of inhibitory neurons.
Some rhythms of the cerebral cortex do not depend on a thalamic pacemaker but rely instead on the collective, cooperative interactions of cortical neurons themselves. In this case, the excitatory and inhibitory interconnections of the neurons result in a coordinated, synchronous pattern of activity that may remain localized or spread to encompass larger regions of cortex.
Functions of Brain Rhythms. Cortical rhythms are fascinating to watch in an EEG, and they parallel so many interesting human behaviors that we are compelled to ask: Why so many rhythms? More importantly, do they serve a purpose? There are no satisfactory answers yet. Ideas abound, but definitive evidence is scarce. One hypothesis for sleep-related rhythms is that they are the brain’s way of disconnecting the cortex from sensory input. When you are awake, the thalamus allows sensory information to pass through it and be relayed up to the cortex. When you are asleep, thalamic neurons enter a self-generated rhythmic state that prevents organized sensory information from being relayed to the cortex. While this idea has intuitive appeal (most people do prefer to sleep in a dark, quiet environment), it does not explain why rhythms are necessary. Why not just steadily inhibit the thalamus and allow the cortex to rest quietly?
A function for fast rhythms in the awake cortex has also been proposed. One scheme for understanding visual perception takes advantage of the fact that cortical neurons responding to the same object are synchronously active. Walter Freeman, a neurobiologist at the University of California, Berkeley, pioneered the idea that neural rhythms are used to coordinate activity between regions of the nervous system. Both sensory and motor systems of the awake brain often generate bursts of synchronous neural activity that give rise to EEG gamma rhythms (30–90 Hz).
By momentarily synchronizing the fast oscillations generated by different regions of cortex, perhaps the brain binds together various neural components into a single perceptual construction. For example, when you are trying to catch a basketball, different groups of neurons that simultaneously respond to the specific shape, color, movement, distance, and even the significance of the basketball tend to oscillate synchronously. The fact that the oscillations of these scattered groups of cells (those that together encode “basketballness”) are highly synchronous would somehow tag them as a meaningful group, distinct from other nearby neurons, thereby unifying the disjointed neural pieces of the “basketball puzzle.” The evidence for this idea is indirect, far from proven, and understandably controversial.
For now, the functions of rhythms in the cerebral cortex are largely a mystery. One plausible hypothesis is that most rhythms have no direct function. Instead, they may be intriguing but unimportant by-products of the tendency for brain circuits to be strongly interconnected, with various forms of excitatory feedback. When something excites itself, whether it is an audio amplifier or the human stadium wave, it often leads to instability or oscillation. Feedback circuits are essential for the cortex to do all the marvelous things it does for us. Oscillations may be the unavoidable consequence of so much feedback circuitry, unwanted but tolerated by necessity. Even if they don’t have a function, however, EEG rhythms provide us with a convenient window on the functional states of the brain.
Seizures, the most extreme form of synchronous brain activity, are always a sign of pathology. A generalized seizure involves the entire cerebral cortex of both hemispheres. A partial seizure involves only a circumscribed area of the cortex. In both cases, the neurons within the affected areas fire with a synchrony that never occurs during normal behavior. As a consequence, seizures are usually accompanied by very large EEG patterns. The cerebral cortex, probably because of its extensive feedback circuitry, is never far from the runaway excitation we know as a seizure. Isolated seizures are not uncommon during a lifetime, and 7–10% of people in the general population have had at least one. When a person experiences repeated seizures, the condition is known as epilepsy. About 0.7% of people worldwide (50 million) have epilepsy. Epilepsy is more common in developing countries, particularly in rural areas, presumably because of higher rates of untreated childhood epilepsy, infections, and poor pre- and postnatal care. The diagnosis of epilepsy occurs most often in young children and among the elderly (Figure 19.13). Childhood epilepsy is usually congenital, caused by genes or a disease or abnormality present at birth, whereas the elderly tend to acquire epilepsy as a consequence of conditions such as stroke, tumors, or Alzheimer’s disease.

FIGURE 19.13 Incidence of epilepsy by age. The graph plots the number of new cases of epilepsy per 100,000 people, as a function of age at the time of diagnosis. Data were compiled from 12 studies performed in developed countries. (Source: D.J. Thurman, http://iom.edu/~/media/Files/Activity%20Files/Disease/Epilepsy/Thurman%202.pdf.) Description
Epilepsy is more a symptom of disease than a disease itself. Its causes can sometimes be identified, including tumors, trauma, genetics, metabolic dysfunction, infection, and vascular disease, but in many cases, the cause of epilepsy is not known. Different types of seizures have different underlying mechanisms. Some forms of epilepsy show a genetic predisposition, and many of the genes responsible have been identified. These genes code for a diverse array of proteins, including ion channels, transporters, receptors, and signaling molecules. Several mutations of genes that encode for sodium channel proteins, for example, have been linked to rare familial forms of epilepsy. These mutated sodium channels tend to stay open a bit longer than normal, allowing more sodium current to enter the neurons and thus making neurons hyperexcitable. Another group of mutations that lead to epilepsy impair synaptic inhibition mediated by GABA by affecting its receptors, enzymes critical for its synthesis or transport, or proteins involved in its release.
Research suggests that some seizures reflect an upset of the delicate balance of synaptic excitation and inhibition in the brain. Other seizures may be due to excessively strong or dense excitatory interconnections. Drugs that block GABA receptors are very potent convulsants (seizure-promoting agents). The withdrawal of chronic depressant drugs, such as alcohol or barbiturates, may also trigger seizures. A variety of drugs are useful for the therapeutic suppression of seizures, and these anticonvulsants tend to counter excitability in various ways. For example, some act by prolonging the inhibitory actions of GABA (e.g., barbiturates and benzodiazepines [see Figure 6.22]), while others decrease the tendency for certain neurons to fire action potentials at a high frequency (e.g., phenytoin and carbamazepine).
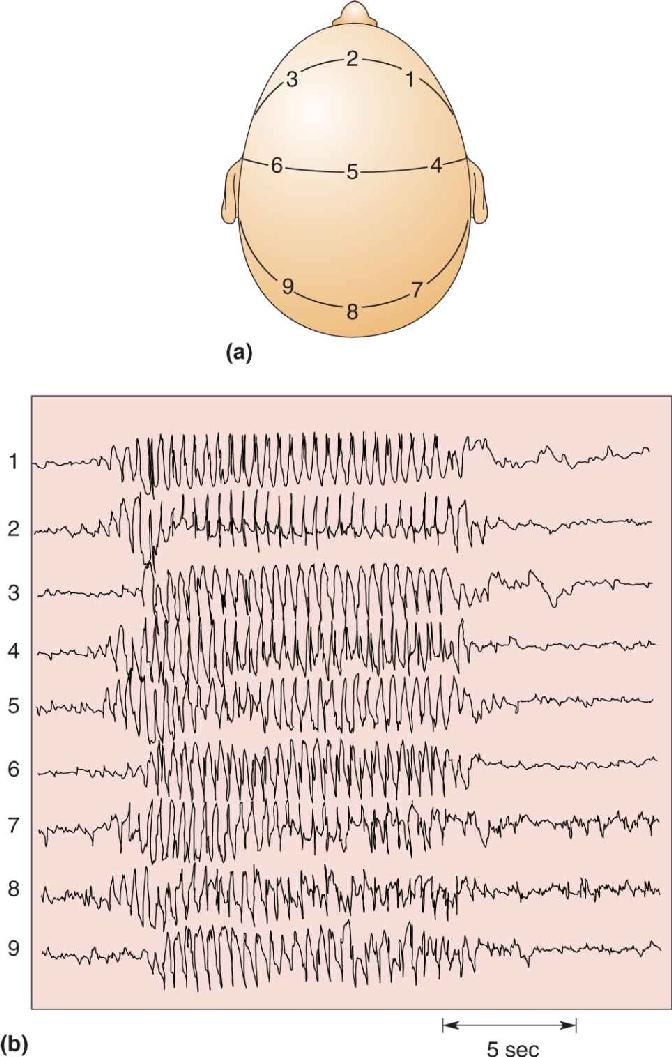
The behavioral features of a seizure depend on the neurons involved and the patterns of their activity. During most forms of generalized seizures, virtually all cortical neurons participate, so behavior is completely disrupted for many minutes. Consciousness is lost, while all muscle groups may be driven by tonic (ongoing) activity or by clonic (rhythmic) patterns, or by both in sequence, the so-called tonic–clonic seizure. Absence seizures characterize a childhood form of epilepsy, consisting of less than 30 seconds of generalized, 3 Hz EEG waves accompanied by loss of consciousness. An EEG recorded during an absence seizure illustrates several very striking abnormalities (Figure 19.14). The voltage patterns are extraordinarily large, regular, and rhythmic and are generated synchronously across the entire brain. Despite this dramatic pattern of activity, the motor signs of an absence seizure are strangely subtle, only fluttering eyelids or a twitching mouth.

FIGURE 19.14 An EEG of a generalized epileptic seizure. (a) EEG electrodes are placed at various positions on the scalp. (b) They detect a brief absence seizure that begins abruptly, is synchronized across the entire head, generates strong neural activity with rhythms of about 3 Hz, and ends abruptly after about 12 seconds. (Source: J.F. Lambert and N. Chantrier.) Description
Partial seizures can be instructive. If they begin in a small area of motor cortex, they can cause clonic movement of part of a limb. In the late 1800s, British neurologist John Hughlings Jackson observed the progression of seizure-related movements across the body, looked at the lesions in his patients’ brains after they died, and correctly inferred the basic somatotopic map of the motor cortex (see Chapter 14). If seizures begin in a sensory area, they can trigger an abnormal sensation, or aura, such as an odd smell or sparkling lights. Most bizarre are the partial seizures that elicit more well-formed auras such as déjà vu (the feeling that something has happened before) or hallucinations. Sometimes involving the cortex of the temporal lobes, including the hippocampus and amygdala, they can impair memory, thought, and consciousness. In some cases, partial seizures may spread uncontrollably and become generalized seizures.
Sleep and dreams—they are mysterious, even mystical to some people, and a favorite subject of art and literature, philosophy, and science. Sleep is a powerful master. Each night we abandon our companions, our work, and our play and enter the cloister of sleep. We have only limited control over the decision; we can postpone sleep for a while, but eventually it overwhelms us. We spend about one-third of our lives sleeping, and one-quarter of that time in a state of active dreaming.
Sleep may be universal among higher vertebrates and perhaps among all animals. Research suggests that even the fruit fly, Drosophila, sleeps. Prolonged sleep deprivation is devastating to proper functioning, at least temporarily, and in some animals (such as rats and cockroaches, though probably not in humans), it may even cause death. Sleep is essential to our lives, almost as important as eating and breathing. But why do we sleep? What purpose does it serve? Despite many years of research, the joke remains that the only thing we are sure of is that sleep overcomes sleepiness. But one of the wonderful things about science is that the lack of consensus inspires a flourishing of theories, and sleep research is no exception.
We can still describe what we cannot explain, and sleep has been richly studied. Let’s begin with a definition: Sleep is a readily reversible state of reduced responsiveness to, and interaction with, the environment. (Coma and general anesthesia are not readily reversible and do not qualify as sleep.) In the sections that follow, we discuss the phenomenology and neural mechanisms of sleep and dreaming.
During a normal day, you experience two very different and noticeable types of behavior: waking and sleeping. It is much less obvious that your sleep also has very distinct phases or states. Several times during a night, you enter a state called rapid eye movement sleep, or REM sleep, when your EEG looks more awake than asleep, your body (except for your eye and respiratory muscles) is immobilized, and you conjure up the vivid, detailed illusions we call dreams. The rest of the time, you spend in a state called non-REM sleep, in which the brain does not usually generate complex dreams. (Non-REM sleep is also sometimes called slow-wave sleep because of its domination by large, slow EEG rhythms.) These fundamental behavioral states—awake, non-REM sleep, and REM sleep—are produced by three distinct states of brain function (Table 19.1). Each behavioral state is also accompanied by large shifts in body function.
Characteristics of the Three Functional States of the Brain

Non-REM sleep seems to be a period for rest. Muscle tension throughout the body is reduced, and movement is minimal. It is important to realize that the body is capable of movement during non-REM sleep but only rarely does the brain command it to move, usually to briefly adjust the body’s position. The temperature and energy consumption of the body are lowered. Because of an increase in activity of the parasympathetic division of the ANS, heart rate, respiration, and kidney function all slow down, and digestive processes speed up.
During non-REM sleep, the brain also seems to rest. Its rate of energy use, and the general firing rates of its neurons, is at their lowest point of the day. The slow, large-amplitude EEG rhythms indicate that the neurons of the cortex are oscillating in relatively high synchrony, and experiments suggest that most sensory input cannot even reach the cortex. While there is no way to know for certain what people are thinking when they are asleep, studies indicate that mental processes also hit their daily low during the non-REM state. When awakened, people often recall nothing, or only brief, fragmentary, plausible thoughts with few visual images. Detailed, entertaining, irrational dreams are rare, although not absent, during non-REM sleep. William Dement, a pioneering sleep researcher at Stanford University, characterizes non-REM sleep as an idling brain in a movable body.
In contrast, Dement calls REM sleep an active, hallucinating brain in a paralyzed body. REM sleep is dreaming sleep. Although the REM period accounts for only a small part of our sleep time, it is the part most researchers get excited about (and this is the state that most excites the brain), perhaps because dreams are so intriguing and enigmatic. If you awaken someone during REM sleep, as Dement, Eugene Aserinsky, and Nathaniel Kleitman first did in the mid-1950s, the person will likely report visually detailed, lifelike episodes, often with bizarre story lines—the kinds of dreams we love to talk about and try to interpret.
The physiology of REM sleep is also bizarre. The EEG looks almost indistinguishable from that of an active, waking brain, with fast, low-voltage fluctuations. This is why REM sleep is sometimes referred to as paradoxical sleep. In fact, the oxygen consumption of the brain (a measure of its energy use) is higher in REM sleep than when the brain is awake and concentrating on difficult mathematical problems. The paralysis that occurs during REM sleep is caused by an almost total loss of skeletal muscle tone or atonia. Most of the body is actually incapable of moving! Respiratory muscles do continue to function but just barely. The muscles controlling eye movement and the tiny muscles of the inner ear are the exceptions; these are strikingly active. With lids closed, the eyes occasionally dart rapidly back and forth. These bursts of rapid eye movement are the best predictors of vivid dreaming, and at least 90% of people awakened during or after them report dreams.
Physiological control systems are dominated by sympathetic activity during REM sleep. Inexplicably, the body’s temperature control system simply quits, and core temperature begins to drift downward. Heart and respiration rates increase but become irregular. In healthy people, the clitoris and penis become engorged with blood and erect, although this usually has nothing to do with any sexual content of dreams. Overall, during REM sleep, the brain seems to be doing everything except resting.
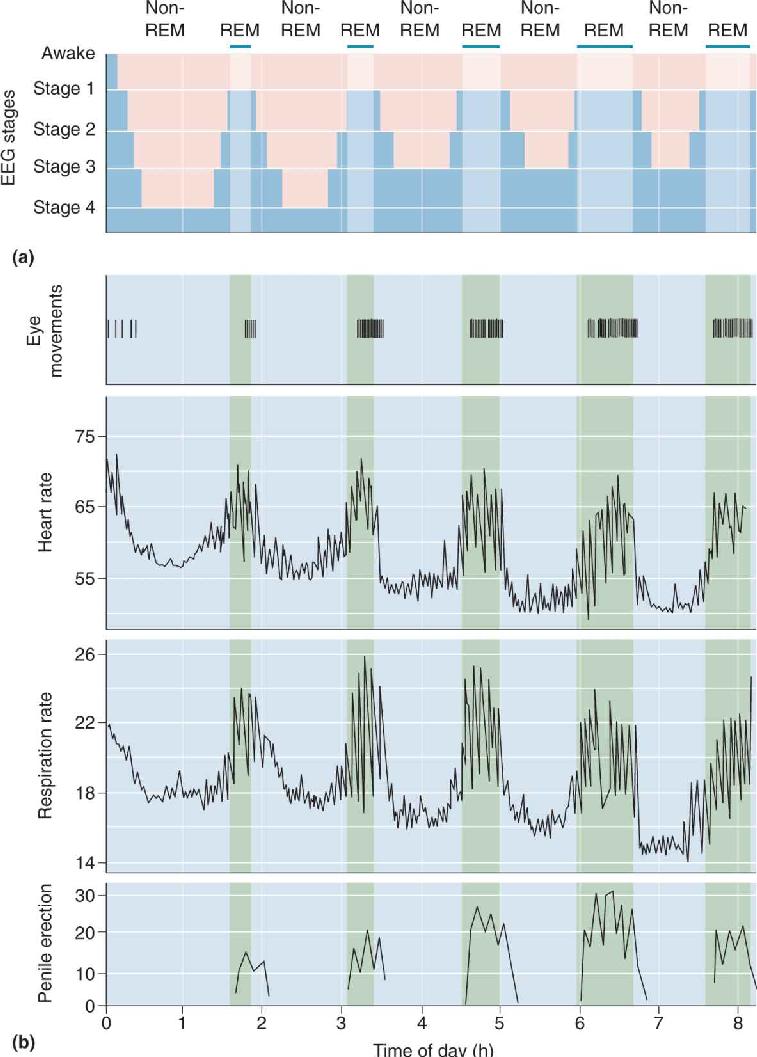
Even a good night’s sleep is not a steady, unbroken journey. It normally begins with a period of non-REM sleep. Figure 19.15 shows that a typical full night of sleep includes a regular cycling of eye movements, physiological functions, and penile erections through non-REM and REM periods. It is obvious that sleep takes the brain through a repetitive roller coaster ride of activity, and sometimes the ride is pretty wild (Box 19.2). Roughly 75% of total sleep time is spent in non-REM and 25% in REM, with periodic cycles between these states throughout the night. Non-REM sleep is generally divided into four distinct stages. During a normal night, we slide through the stages of non-REM, then into REM, then back through the non-REM stages again, repeating the cycle about every 90 minutes. These cycles are examples of ultradian rhythms, which have faster periods than circadian rhythms.

FIGURE 19.15 Physiological changes during non-REM and REM sleep. (a) This graph represents one night of sleep, starting with a transition from awake to stage 1 non-REM sleep. The sleep cycle progresses through the deeper stages of non-REM sleep, then into REM sleep. It is repeated several times, but each cycle has shorter and shallower non-REM periods and longer REM periods. (b) These graphs show regular increases in heart rate, respiration rate, and penile erection during the REM periods of one night sleep. (Source: Adapted from Purves et al., 2004, Fig. 27.7.) Description
Sleep is not always serene and stationary. Talking, walking, and screaming are common, usually occurring during non-REM sleep. If this seems surprising, remember that REM sleep is accompanied by almost total body paralysis. You would therefore be incapable of walking or talking during REM sleep, even if your dream “urged” you to do it.
Sleepwalking, or somnambulism, peaks at about age 11. Although 40% of us were sleepwalkers as children, few of us sleepwalk as adults. Sleepwalking usually occurs during the first stage 4 non-REM period of the night. A full-blown sleepwalking incident involves open eyes and movement around the room, the house, or even outside, with enough awareness to avoid objects and climb stairs. Cognitive functioning and judgment are severely impaired. It is often difficult to awaken sleepwalkers because they are in deep, slow-wave sleep. The best treatment is a guiding hand back to bed. Sleepwalkers usually have no memory of the incident the next morning.
Almost everyone practices sleep talking, somniloquy, now and then. Unfortunately, sleeping speech is often so garbled or nonsensical that a curious listener is disappointed by its emptiness.
More dramatic are sleep terrors, also known as night terrors, which are most common in children 5–7 years old. A girl screams in the middle of the night. Her parents rush to her bedside, frantic to know what has alarmed her. The girl cries inconsolably, unable to explain her horrifying experience. After 10 agonizing minutes of shrieking and flailing, she finally sleeps quietly, leaving the parents shaken and baffled. The next morning she is bright and cheerful, with no recollection of the night’s misadventure. Sleep terrors are distinctly different from nightmares, which are vivid, complex dreams, outwardly quiet, that occur during REM sleep. By contrast, sleep terrors begin in stage 3 or 4 of non-REM sleep, and the experience is not dreamlike but a feeling of uncontrollable panic, accompanied by greatly increased heart rate and blood pressure. They usually pass with adolescence and are not a symptom of a psychiatric disorder.
EEG rhythms during the stages of sleep are shown in Figure 19.16. An average, healthy adult becomes drowsy and begins to sleep, first entering stage 1 non-REM sleep. Stage 1 is transitional sleep, when the EEG alpha rhythms of relaxed waking become less regular and wane, and the eyes make slow, rolling movements. Stage 1 is fleeting, usually lasting only a few minutes. It is also the lightest stage of sleep, meaning that we are most easily awakened. Stage 2 is slightly deeper and may last 5–15 minutes. Its characteristics include the occasional 8–14 Hz oscillation of the EEG called the sleep spindle, which is generated by a thalamic pacemaker (see Figure 19.12). In addition, a high-amplitude sharp wave called the K complex is sometimes observed. Eye movements almost cease. Next follows stage 3, and the EEG begins large-amplitude, slow delta rhythms. Eye and body movements are few. Stage 4 is the deepest stage of sleep, with large EEG rhythms of 2 Hz or less. During the first cycle of sleep, stage 4 may persist for 20–40 minutes. Then sleep begins to lighten again, ascends through stage 3 to stage 2 for 10–15 minutes, and suddenly enters a brief period of REM sleep, with its fast EEG beta and gamma rhythms and sharp, frequent eye movements.

FIGURE 19.16 EEG rhythms during the stages of sleep. (Source: Adapted from Horne, 1988, Fig. 1.1) Description
As the night progresses, there is a general reduction in the duration of non-REM sleep, particularly in stages 3 and 4, and an increase in the REM periods. Half of the night’s REM sleep occurs during its last third, and the longest REM periods may last 30–50 minutes. Still, there seems to be an obligatory refractory period of about 30 minutes between periods of REM; in other words, each REM period is followed by at least 30 minutes of non-REM sleep before the next REM period can begin.
What is a normal night’s sleep? Your mother may have insisted that you need a “good 8 hours” of sleep each night. Research suggests that normal requirements vary widely among adults, from about 5–10 hours per night. The average length is about 7.5 hours, and the sleep duration of about 68% of young adults is between 6.5 and 8.5 hours. Teenagers may find it especially challenging to get enough sleep. Research by Mary Carskadon at Brown University suggests that sleep requirements do not decrease between preadolescence and early teen years, but changes in circadian timing mechanisms make it progressively harder for teenagers to fall asleep early in the evening. This process often coincides with the move to high school and an earlier start of the school day. As a result, many students are chronically sleep-deprived, which is an unhealthy condition. Too little sleep can reduce cognitive, emotional, and physical well-being.
What is the proper length of sleep time for you? The best measure of successful sleep is the quality of your time awake. You need a certain amount of sleep in order to maintain a reasonable level of alertness. Too much daytime sleepiness can be more than annoying; it can be dangerous if it interferes with driving, for example. Because of the wide variations among individuals, you must decide for yourself how much sleep you need.
All mammals, birds, and reptiles appear to sleep, although only mammals and some birds have a REM phase. Sleep time varies widely, from about 18 hours a day in bats and opossums to about 3 hours a day in horses and giraffes. Many people argue that a behavior as pervasive as sleep must have a critical function; otherwise, some species would have lost the need to sleep through evolution. Whatever the function, there is good reason to believe sleep is mainly for the brain. Cognitive impairment is the most immediate and obvious consequence of sleep deprivation. A restful 8 hours in bed without sleep might allow your body to recover from physical exertion, but you would not be at your best mentally the next day.
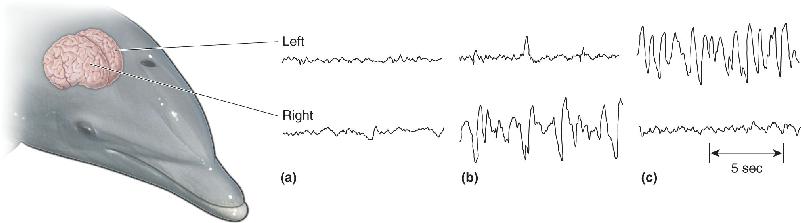
Some animals apparently have more reason not to sleep than others. Imagine living your entire life in deep or turbulent water, yet needing to breathe air every minute or so. Even a quick nap would be awkward, at best. This is precisely the situation with dolphins and whales, yet they sleep about as much as humans do. Remarkably, bottlenose dolphins sleep with only one cerebral hemisphere at a time: about 2 hours of non-REM sleep on just one side, then 1 hour awake on both sides, 2 hours of non-REM sleep on the other side, and so on, for a total of about 12 hours per night (Figure 19.17). (This gives new meaning to the phrase “being half asleep.”) There is no evidence that dolphins or whales have REM sleep. Another unusual sleep strategy is used by the blind Indus River dolphin of Pakistan. This dolphin uses sonar to navigate through muddy, turbid, sweeping currents, and during monsoon season it must never stop swimming or it will come to grief on the rocks and debris of the flooded estuary it calls home. Still, the Indus River dolphin seems to sleep, snatching “microsleeps” 4–6 seconds long while continuing to swim slowly. Its many microsleeps add up to about 7 hours in a 24-hour day.

FIGURE 19.17 Sleep in the bottlenose dolphin. These EEG patterns were recorded from the right and left hemispheres of swimming dolphins. (a) High-frequency activity on both sides during alert wakefulness. (b) Large delta rhythms of deep sleep only on the right side, with fast activation on the left. (c) The patterns shift to opposite hemispheres some time later. (Source: Lyamin et al., 2008, Fig. 1.) Description
Dolphins have evolved extraordinary sleep mechanisms that adapt them to a demanding environment. But the fact that dolphins are not sleepless reinforces our question: What is so important about sleeping?
No single theory of the function of sleep is widely accepted, but the most reasonable ideas fall into two categories: theories of restoration and theories of adaptation. The first category is a commonsense explanation: We sleep in order to rest and recover and to prepare to be awake again. The second category is less obvious: We sleep to keep us out of trouble, to hide from predators when we are most vulnerable or from other harmful features of the environment, or to conserve energy.
If sleep is restorative, what is it restoring? Quiet rest is certainly not a substitute for sleep. Sleeping does something more than simple resting. Prolonged sleep deprivation can lead to serious physical and behavioral problems (Box 19.3). Unfortunately, no one has yet identified a particular physiological process that is clearly restored by sleep or an essential substance that is made or a toxin that is destroyed while sleeping. Sleep does prepare us to be effectively awake again. But does sleep renew us in the same way that eating and drinking do, by replacing essential substances, or the way the healing of a wound repairs damaged tissues? For the most part, evidence indicates that sleep is not a time of increased tissue repair for the body. However, it is possible that brain regions such as the cerebral cortex can achieve some form of essential “rest” only during non-REM sleep.
In 1963, Randy Gardner was a 17-year-old high school student with an ambitious idea for a San Diego Science Fair project. On December 28 he awoke at 6 a.m. to begin. When he finished 11 days (264 hours) later, he had broken the world’s record for nonstop wakefulness, under the continuous scrutiny of two friends and, during the last 5 days, fascinated sleep researchers. He had used no drugs, not even caffeine.
The experience was not pleasant. After 2 days without sleep, Randy became irritable and nauseated, had trouble remembering, and could not even watch television. By the fourth day, he had mild delusions and overwhelming fatigue, and by the seventh day, he had tremors, his speech was slurred, and his EEG no longer showed alpha rhythms. At times he was paranoid or hallucinating. Fortunately, he did not become psychotic, despite the predictions of some experts. On the contrary, on his last awake night, he beat one of his better rested observers at an arcade baseball game, and he gave a coherent account of himself at a national press conference.
When he finally went to bed, he slept for almost 15 hours straight, then stayed awake 23 hours to wait for nightfall, and slept for another 10.5 hours. After the first sleep, his symptoms had mostly disappeared, and within a week, he was sleeping and behaving normally.
One of the most interesting things about Randy’s ordeal is that there were no lasting harmful effects. The same is not true for some animals deprived of sleep. If rats are kept awake for long periods, they progressively lose weight while consuming much more food, become weak, accumulate stomach ulcers and internal hemorrhages, and even die. They seem to suffer from an impairment of their ability to regulate body temperature and metabolic needs. Total sleep deprivation is not necessary. Prolonged REM sleep loss alone is detrimental. These results may imply that sleep provides something physiologically essential.
Adaptation theories of sleep take many forms. Some large animals eat small animals; a stroll in the moonlight is far too risky for a squirrel living in owl and fox territory. The squirrel’s best strategy may be to stay safely tucked away in an underground burrow during the night, and sleep is a good way to enforce such isolation. At the same time, sleep may be an adaptation for conserving energy. While sleeping, the body does only just enough work to stay alive, core temperature drops, temperature regulation is depressed, and the rate of calories burned is kept low.
In many ancient cultures, people believed that dreams were a window on some higher world and a source of information, guidance, power, or enlightenment. Perhaps they were right, but the collective wisdom of the past does not agree on exactly how to interpret the meaning of dreams. Today we must take a step backward and first ask whether dreams even have meaning. Dreams are difficult to study. Obviously, we can’t directly observe the dreams of someone else, and even the dreamer has access to them only after he or she has awakened and perhaps forgotten or distorted the experience. Modern explanations of dreaming lean heavily on studies of REM sleep rather than dreaming because the phenomena of REM can be objectively measured. But it is important to remember that the two are not synonymous. Some dreams can occur outside of REM sleep, and REM sleep has many peculiar features that have nothing to do with dreaming.
Do we need to dream? No one knows, but the body does seem to crave REM sleep. It is possible to deprive sleepers of REM sleep specifically by waking them every time they enter the REM state; when they fall asleep a minute or two later, it is inevitably into a non-REM state, and they can accumulate an entire night of relatively pure non-REM sleep. As Dement first observed, after several days of this annoying treatment, sleepers attempt to enter the REM state much more frequently than normal. When they are finally allowed to sleep undisturbed, they experience REM rebound and spend more time in REM proportional to the duration of their deprivation. Most studies have found that REM deprivation does not cause any major psychological harm during the daytime. Again, it is important not to interpret REM deprivation as dream deprivation, since during REM deprivation, dreams may continue to occur during sleep onset and during non-REM periods.
Sigmund Freud suggested many functions for dreams. For Freud, dreams were disguised wish fulfillment, an unconscious way for us to express our sexual and aggressive fantasies, which are forbidden while we are awake. Bad dreams might help us conquer the anxiety-provoking events of life. Recent theories of dreaming are more biologically based. Allan Hobson and Robert McCarley of Harvard University propose an “activation–synthesis hypothesis,” which explicitly rejects freudian, psychological interpretations. Instead, dreams, or at least some of their bizarre features, are seen as the associations and memories of the cerebral cortex that are elicited by the random discharges of the pons during REM sleep. Thus, the pontine neurons, via the thalamus, activate various areas of the cerebral cortex, elicit well-known images or emotions, and the cortex then tries to synthesize the disparate images into a sensible whole. Not surprisingly, the “synthesized” dream product may be quite bizarre and even nonsensical because it is triggered by the semirandom activity of the pons. Evidence for the activation–synthesis hypothesis is mixed. It does predict the weirdness of dreams and their correlation with REM sleep. But it does not explain how random activity can trigger the complex and fluid stories that many dreams contain nor how it can evoke dreams that recur night after night.
Many researchers have suggested that REM sleep, and perhaps dreams themselves, have an important role in memory. None of the evidence is definitive, but intriguing hints indicate that REM sleep somehow aids the integration or consolidation of memories. Depriving humans or rats of REM sleep can impair their ability to learn a variety of tasks. Some studies show an increase in the duration of REM sleep after an intense learning experience. In one study, Israeli neuroscientist Avi Karni and his colleagues trained people to identify the orientation of a small line in their peripheral visual field. The task was made difficult by presenting the visual stimulus for a very short period of time. With repeated practice over days, people got much better at this task; surprisingly, their performance also improved between evening and morning, after a night’s sleep. Karni found that if people were deprived of REM sleep, their learning of the task did not improve overnight. Depriving them of non-REM sleep, on the other hand, actually enhanced their performance. Karni hypothesizes that this kind of memory requires a period of time to strengthen and that REM sleep is particularly effective for this purpose.
You may have heard about sleep learning, the notion that you can study for an exam by simply listening to a tape of the material while you blissfully snooze away. Sounds like a student’s fantasy, right? Unfortunately, it is exactly that and no more. There is no scientific evidence for sleep learning, and careful studies have shown that the very few things recalled the next morning were heard when the subjects briefly woke up. In fact, sleep is a profoundly amnesic state. Most of our dreams, for example, seem to be lost forever. Although we dream profusely during each of the four or five REM periods every night, we usually remember only the last dream before waking. Also, when we briefly wake up to do something in the middle of the night, we have often forgotten the incident by morning.
At this point you are probably confused about the functions of dreaming and REM sleep. So are we. Unfortunately, there is not enough evidence to support or dismiss any of the theories we have discussed. There are also many other creative and plausible ideas that we do not have the space to present here.
Until the 1940s, it was generally believed that sleep was a passive process: Deprive the brain of sensory input, and it will fall asleep. However, when the sensory afferents to an animal’s brain are blocked, the animal continues to have cycles of waking and sleeping. We now know that sleep is an active process that requires the participation of a variety of brain regions. As we saw in Chapter 15, wide expanses of the cortex are actually controlled by very small collections of neurons much deeper in the brain. These cells act like the switches or tuners of the forebrain, altering cortical excitability and gating the flow of sensory information into it. The full details of these control systems are complex and not fully understood. But we can summarize a few basic principles:
- The neurons most critical to the control of sleeping and waking are part of the diffuse modulatory neurotransmitter systems (see Chapter 15, Figures 15.12 to 15.15).
- The brain stem modulatory neurons using norepinephrine and serotonin fire during waking and enhance the awake state; some neurons using acetylcholine enhance critical REM events, and other cholinergic neurons are active during waking.
- The diffuse modulatory systems control the rhythmic behaviors of the thalamus, which in turn controls many EEG rhythms of the cerebral cortex; slow, sleep-related rhythms of the thalamus apparently block the flow of sensory information up to the cortex.
- Sleep also involves activity in descending branches of the diffuse modulatory systems, such as the inhibition of motor neurons during dreaming.
There are three basic kinds of evidence for the localization of sleep mechanisms in the brain. Lesion data reveal changes in function after a part of the brain is removed, results of stimulation experiments identify changes following the activation of a brain region, and recordings of neural activity determine the relationship between that activity and different brain states.
Wakefulness and the Ascending Reticular Activating System. Lesions in the brain stem of humans can cause sleep and coma, suggesting that the brain stem has neurons whose activity is essential to keeping us awake. Italian neurophysiologist Giuseppe Moruzzi and his colleagues, working in the 1940s and 1950s, began to sort out the neurobiology of the brain stem’s control of waking and arousal. They found that lesions in the midline structures of the brain stem caused a state similar to non-REM sleep, but lesions in the lateral tegmentum, which interrupted ascending sensory inputs, did not. Conversely, electrical stimulation of the midline tegmentum of the midbrain, within the reticular formation, transformed the cortex from the slow, rhythmic EEGs of non-REM sleep to a more alert and aroused state with an EEG similar to that of waking. Moruzzi called this ill-defined region of stimulation the ascending reticular activating system (mentioned in Chapter 15). This area is now much better defined, anatomically and physiologically, and it is clear that Moruzzi’s stimulation was affecting many different sets of ascending modulatory systems.
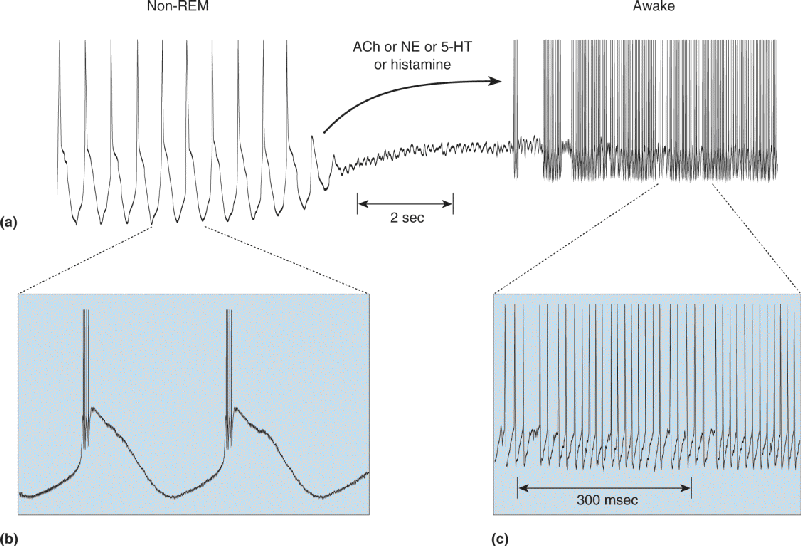
Several sets of neurons increase their firing rates in anticipation of awakening and during various forms of arousal. They include cells of the locus coeruleus, which contain norepinephrine, serotonin-containing cells of the raphe nuclei, acetylcholine-containing cells of the brain stem and basal forebrain, midbrain neurons that use histamine as a neurotransmitter, and neurons of the hypothalamus that use hypocretin (orexin) as a transmitter (Figure 19.18). Collectively, these neurons synapse directly on the entire thalamus, cerebral cortex, and many other brain regions. The general effects of their transmitters are a depolarization of neurons, an increase in their excitability, and a suppression of rhythmic forms of firing. These effects are most clearly seen in the relay neurons of the thalamus (Figure 19.19).

FIGURE 19.18 Key components of the modulatory systems that regulate waking and sleeping. Description

FIGURE 19.19 Modulating thalamic rhythmicity during waking and sleeping. (a) Thalamic neurons at rest have a tendency to generate slow, delta frequency rhythms of intrinsic burst-firing (left). Under the influence of several neuromodulators such as ACh, NE, and histamine, neurons depolarize and switch to a more excitable single-spiking mode (right). This may resemble what happens during transitions from non-REM sleep to the waking state. Expanded views of rhythmic bursting (b) and single-spiking (c) are also shown. (Source: Adapted from McCormick and Pape, 1990, Fig. 14.) Description
Hypocretin (also known as orexin; see Chapter 16) is a small peptide neurotransmitter expressed mainly by neurons whose cell bodies are in the lateral hypothalamus. The axons of hypocretin (orexin)-secreting neurons project widely in the brain, and they strongly excite cells of the cholinergic, noradrenergic, serotonergic, dopaminergic, and histaminergic modulatory systems. When the peptide was first discovered, researchers thought hypocretin (orexin) was involved specifically in feeding behavior (see Chapter 16), but it clearly has a more general role. The peptide also promotes wakefulness, inhibits REM sleep, facilitates neurons that enhance certain kinds of motor behavior, and is involved in the regulation of neuroendocrine and autonomic systems. The loss of hypocretin (orexin) neurons leads to a sleep disorder called narcolepsy (Box 19.4).
Narcolepsy is a bizarre and disabling disturbance of sleeping and waking. Despite the sound of the name, it is not a form of epilepsy. It can include some or all of the following manifestations.
Excessive daytime sleepiness can be severe and often leads to unwanted “sleep attacks.” Cataplexy is a sudden muscular paralysis while consciousness is maintained. In the middle of a normal day, sufferers suddenly collapse into a state similar to REM sleep. Cataplexy is often brought on by strong emotional expression, such as laughter or tears, or by surprise or sexual arousal, and it usually lasts less than a minute. Sleep paralysis, a similar loss of muscle control, occurs during the transition between sleeping and waking. Sometimes occurring in the absence of narcolepsy, it can be very disconcerting; even though conscious, a person may be unable to move or speak for several minutes. Hypnagogic hallucinations are graphic dreams, often frightening, that can accompany sleep onset and may occur following sleep paralysis. Sometimes such dreams flow smoothly with real events that occurred just prior to falling asleep.
EEG monitoring reveals a distinct difference between narcoleptic and normal sleep. A narcoleptic person goes directly from waking into a REM phase, whereas normal adult sleepers always enter a long period of non-REM sleep first. Most narcolepsy symptoms might be interpreted as an abnormal intrusion of the characteristics of REM sleep into waking.
The prevalence of narcolepsy varies widely, affecting about 1 in 1000–2000 people in the U.S. population but only 1 in 500,000 in Israel, for example. The typical age of onset is 12–16 years. The disorder has a genetic component, and a high percentage of narcoleptics have a particular form of the human leukocyte antigen (HLA) gene. However, about 25% of the general population has the narcoleptic form of the HLA gene, yet the large majority do not develop narcolepsy. Environmental factors may also play an important role. A recent study in China found that the onset of narcolepsy in children varies with the seasons and tends to be highest following winter-related respiratory infections. There was a particularly sharp rise in cases of narcolepsy just after the H1N1 influenza pandemic in 2009–2010, followed by a decrease in the two years following. Narcolepsy rates increased both in Europe, where many people were vaccinated against H1N1, and in China, where vaccines were not available.
Narcolepsy occurs in goats, donkeys, ponies, and more than a dozen breeds of dogs. In 1999, Emmanuel Mignot, Seiji Nishino, and their research team at Stanford University found that canine narcolepsy is caused by a mutation of the gene for a hypocretin receptor. Also in 1999, Masashi Yanagisawa and his group at the University of Texas Southwestern Medical Center deleted the genes responsible for the peptide neurotransmitter hypocretin in mice and found that the animals were narcoleptic. Basic animal research of this sort quickly inspired important studies of human narcolepsy.
In 2000, two research teams discovered that the brains of human narcoleptics have about 10% or less of the normal complement of hypocretin-containing neurons (Figure A). Their CSF has immeasurably low levels of hypocretin, whereas hypocretin is found at normal levels in nearly every other neurological disease. Human narcolepsy almost certainly results from the selective death of hypocretin-containing neurons in most cases. Unlike in some animal versions of the disease, hypocretin deficiency is rarely caused by mutations of the hypocretin or hypocretin receptor genes. The reason hypocretin neurons die in narcoleptic patients is unknown, although there is strong evidence that some kind of autoimmune process is involved. Fragments of viral proteins may mimic hypocretin, somehow priming immune cells to attack hypocretin-releasing cells.

Figure A Hypocretin (orexin)-containing neurons in the hypothalamus of a normal brain (left) and a narcoleptic brain (right). (Source: Adapted from Thannickal et al., 2000, Fig. 1)
There is no cure for narcolepsy yet, and current treatments aim only to relieve the symptoms. Frequent naps, amphetamines, and a drug called modafinil may help daytime sleepiness, while tricyclic antidepressant drugs (which have REM-suppressant effects) may reduce cataplexy and sleep paralysis. The discovery that hypocretin deficiency underlies narcolepsy suggests an obvious potential treatment; administer hypocretin or its agonists. Results from human trials have so far been disappointing. One problem is that hypocretin does not penetrate the blood–brain barrier very well. Transplantation of hypocretin neurons has shown some promise in animal studies, but no human trials have been attempted.
Falling Asleep and the Non-REM State. Falling asleep involves a progression of changes over several minutes, culminating in the non-REM state. It is not entirely clear what initiates non-REM sleep, although certain sleep-promoting factors contribute (as we will describe later), and there is a general decrease in the firing rates of most brain stem modulatory neurons (those using NE, 5-HT, and ACh). Although most regions of the basal forebrain seem to promote alertness and arousal, a subset of its cholinergic neurons increases their firing rate with the onset of non-REM sleep and are silent during wakefulness.
Early stages of non-REM sleep include the EEG sleep spindles, described earlier, which are generated in part by the inherent rhythmicity of thalamic neurons (see Figure 19.11). As non-REM sleep progresses, spindles disappear and are replaced by slow delta rhythms (less than 4 Hz). Delta rhythms may also be a product of thalamic cells, occurring when their membrane potentials become even more negative than during spindle rhythms (and much more negative than during waking). Synchronization of activity during spindle or delta rhythms is due to neural interconnections within the thalamus and between the thalamus and cortex. Because of the strong, two-way excitatory connections between the thalamus and cortex, rhythmic activity in one is often strongly and widely projected upon the other.
Mechanisms of REM Sleep. REM is such a different state from non-REM that we would expect some clear neural distinctions. Many cortical areas are at least as active during REM sleep as they are during waking. For example, neurons of the motor cortex fire rapidly and generate organized motor patterns that attempt to command the entire body but succeed only with a few muscles of the eye and inner ear and those essential for respiration. The elaborate dreams of REM sleep certainly require the cerebral cortex. However, the cortex is not necessary for the production of REM sleep.
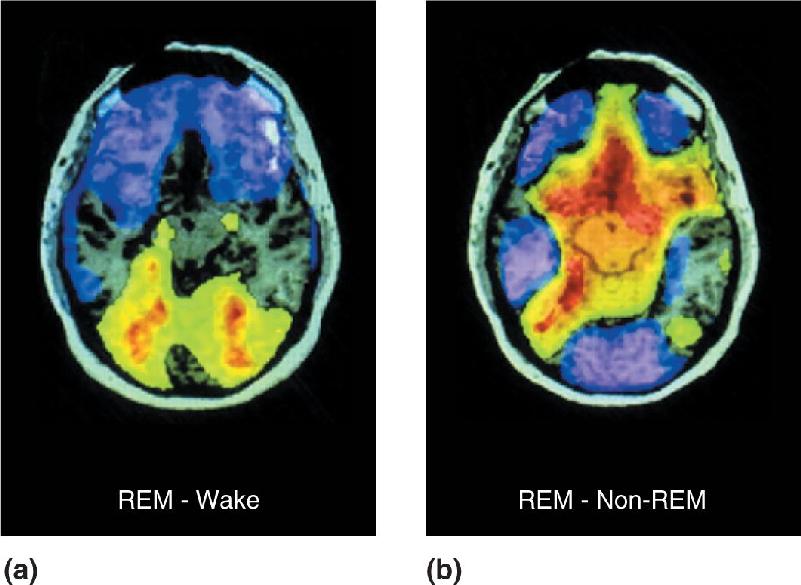
The use of PET and fMRI imaging in the waking and sleeping human brain has provided fascinating glimpses of the activity patterns that distinguish waking from REM and non-REM sleep. Figure 19.20a shows the difference in brain activity between REM sleep and waking. Some areas, including primary visual cortex, were about equally active in the two states. However, extrastriate cortical areas and portions of the limbic system were significantly more active during REM sleep than waking. Conversely, regions of the frontal lobes were noticeably less active during REM. Figure 19.20b contrasts the brain activity in REM and non-REM sleep. The primary visual cortex and a number of other areas are significantly less active during REM sleep, but extrastriate cortex is more active than it is in non-REM. These results paint an intriguing picture of what happens when we sleep. During REM, there is an explosion of extrastriate activity, presumably during the times when we dream. However, there is no corresponding activity increase in the primary visual cortex, suggesting that the extrastriate excitation is internally generated. The emotional component of dreams might derive from the heightened limbic activation. The low activity in the frontal lobe suggests that high-level integration or interpretation of the extrastriate visual information might not take place, leaving us with a buzz of uninterpreted visual imagery.

FIGURE 19.20 PET images of the waking and sleeping human brain.These images show brain activity in horizontal sections. (a) Colors represent differences in activity between REM sleep and waking; green, yellow, and red indicate higher activation during REM, and purples indicate lower activation during REM. Note the dark notch at the bottom (posterior) edge of the section, indicating that striate cortex is equally active in the two states. (b) REM sleep compared with non-REM sleep. In REM, striate cortex is less active. (Source: Braun et al., 1998, Fig. 1.) Description
The control of REM sleep, as with the other functional brain states, derives from diffuse modulatory systems in the core of the brain stem, particularly the pons. The firing rates of the two major systems of the upper brain stem, the locus coeruleus and the raphe nuclei, decrease to almost nothing before the onset of REM (Figure 19.21). However, there is a concurrent sharp increase in the firing rates of ACh-containing neurons in the pons, and some evidence suggests that cholinergic neurons induce REM sleep. It is probably the action of ACh during REM sleep that causes the thalamus and cortex to behave so much like they do in the waking state.

FIGURE 19.21 Control of the onset and offset of REM periods by brain stem neurons. This graph shows the relative firing rates of REM-associated neurons during a single night. Periods of REM sleep are green. REM-on cells are cholinergic neurons of the pons, and they increase their firing rates just before the onset of REM sleep (red line). REM-off cells are noradrenergic and serotonergic neurons of the locus coeruleus and raphe nuclei, respectively, and their firing rates increase just before the end of REM sleep (blue line). (Source: McCarley and Massaquoi, 1986, Fig. 4B.) Description
Why don’t we act out our dreams? The same core brain stem systems that control the sleep processes of the forebrain also actively inhibit our spinal motor neurons, preventing the descending motor activity from expressing itself as actual movement. This is clearly an adaptive mechanism, protecting us from ourselves. In rare cases, usually elderly men, dreamers seem to act out their dreams; they have a hazardous condition known as REM sleep behavior disorder. These people often sustain repeated injuries, and even their spouses have fallen victim to their nocturnal flailings. One man dreamed he was in a football game and tackled his bedroom bureau. Another imagined he was defending his wife from attack, when in fact he was beating her in her bed. The basis for this REM disorder seems to be disruption of the brain stem systems that normally mediate REM atonia. Experimental lesions in certain parts of the pons can cause a similar condition in cats. During REM periods, they may seem to chase imaginary mice or investigate invisible intruders. Disorders of REM control mechanisms, caused by a deficiency of hypocretin (orexin), also contribute to the problems of people with narcolepsy (see Box 19.4).
Sleep-Promoting Factors. Sleep researchers have searched intensively for chemicals in the blood or cerebrospinal fluid (CSF) that promote or even cause sleep. Many sleep-promoting substances have been identified in sleep-deprived animals. We will describe some of the major ones here. One key sleep substance is adenosine. Adenosine is used by all cells to build some of the most basic molecules of life, including DNA, RNA, and adenosine triphosphate (ATP). Adenosine is also released by some neurons and glia and acts as a neuromodulator at synapses throughout the brain. It’s a substance that might appeal to the millions who drink coffee, tea, and cola. From ancient times, antagonists of adenosine receptors, such as caffeine and theophylline, have been used to keep people awake. Conversely, the administration of adenosine or its agonists increases sleep. Extracellular levels of natural brain adenosine are higher during waking than while sleeping. Levels progressively increase during prolonged waking periods and sleep deprivation, and they gradually decrease during sleep. Waking-related changes in adenosine levels occur not in the entire brain, but only in certain sleep-related regions. These two properties of adenosine—its sleep-promoting effect and the levels that track the need for sleep—strongly suggest it is an important sleep-promoting factor.
How might adenosine promote sleep? Adenosine has an inhibitory effect on the diffuse modulatory systems for ACh, NE, and 5-HT that tend to promote wakefulness. This suggests that sleep may be the result of a molecular chain reaction. Neural activity in the awake brain increases adenosine levels, thereby increasing the inhibition of neurons in the modulatory systems associated with wakefulness. Enhanced suppression of the “wakeful” modulatory systems makes it more likely that the brain will fall into the slow-wave synchronous activity characteristic of non-REM sleep. After sleep begins, adenosine levels slowly fall, and activity in the modulatory systems gradually increases until we wake up to start the cycle anew.
Another important sleep-promoting factor is nitric oxide (NO). Recall that NO is a small, mobile, gaseous molecule that can diffuse easily across membranes and serves as a retrograde (postsynaptic to presynaptic) messenger between certain neurons (see Chapter 6). The wake-promoting cholinergic neurons of the brain stem express particularly high levels of the synthesizing enzyme for NO. Brain NO levels are highest during waking, and they rise rapidly with sleep deprivation. How does NO promote sleep? Studies have shown that NO triggers the release of adenosine. As we have seen, adenosine promotes non-REM sleep by suppressing the activity of neurons that help to sustain waking.
Sleepiness is one of the most familiar consequences of infectious diseases, such as the common cold and the flu. There are direct links between the immune response to infection and the regulation of sleep. In the 1970s, physiologist John Pappenheimer of Harvard University identified a muramyl dipeptide in the spinal fluid of sleep-deprived goats that facilitated non-REM sleep. Muramyl peptides are usually produced only by the cell walls of bacteria, not brain cells, and they also cause fever and stimulate immune cells of the blood. It is not clear how they appear in CSF, but they may be synthesized by bacteria in the intestines. More recent research has implicated several cytokines, small signaling peptides involved in the immune system, in the regulation of sleep. One of them is interleukin-1, which is synthesized in the brain by glia, and by macrophages, cells throughout the body that scavenge foreign material. Like adenosine and NO, interleukin-1 levels increase during waking, and in humans its levels peak just before the onset of sleep. Interleukin-1 promotes non-REM sleep even when the immune system has not been challenged. When given to humans, it induces fatigue and sleepiness. Interleukin-1 also stimulates the immune system.
Another endogenous sleep-promoting substance is melatonin, a hormone secreted by the pea-sized pineal body (see the appendix to Chapter 7). Melatonin is a derivative of the amino acid tryptophan. It has been called the “Dracula of hormones” because it is released only when the environment darkens—normally at night—and its release is inhibited by light. In humans, melatonin levels tend to rise around the time we become sleepy in the evening, peak in the early morning hours, and then fall to baseline levels by the time we awaken. Evidence suggests that melatonin helps initiate and maintain sleep, but its precise role in natural sleep–wake cycles is not clear. In recent years, melatonin has become popular as an over-the-counter sleep-promoting drug. Although it has shown some promise in treating the symptoms of jet lag and the insomnia that affects some older adults, the general effect of melatonin on improving sleep remains debatable.
Gene Expression during Sleeping and Waking. Research into the neural function of sleep has benefited from studies at various levels of analysis, including sleep behavior, brain physiology, and the action of diffuse modulatory systems. Methods from molecular neurobiology have also contributed interesting facts. While the pieces do not all fit together quite yet, it is clear that the behavioral states of sleeping and waking are different even at the molecular level. For example, in the macaque monkey, most areas of cerebral cortex show higher rates of protein synthesis in deep sleep than in light sleep. In rats, levels of cAMP in several brain areas have been found to be lower during sleeping than waking.
Research has demonstrated that sleeping and waking are associated with differences in the expression of certain genes. Chiara Cirelli and Giulio Tononi, working at the Neurosciences Institute in San Diego and at the University of Wisconsin, have studied the expression of thousands of genes in rats that were awake or asleep. The vast majority of genes were expressed at the same level in the two states. However, the 0.5% of genes that showed different levels of expression may provide insight into what happens in the brain during sleep. Most of the genes that were more highly expressed in the awake brain could be placed into one of three groups. One group includes what are called immediate early genes, genes that code for transcription factors that affect the expression of other genes. Some of these genes appear to be related to changes in synaptic strength. The low expression of these genes during sleep may be associated with the fact that learning and memory formation are largely absent in this state. The second group of genes comes from mitochondria. Increased expression of these genes may play a role in satisfying the higher metabolic demands of the awake brain. The third group includes genes related to responses to cellular stress.
A different group of genes was most highly expressed during sleep, and some of them might contribute to increased protein synthesis and synaptic plasticity mechanisms that complement those most prevalent during waking. An important point is that the sleep-related changes in gene expression were specific to the brain, and they did not change in other tissues, such as the liver and skeletal muscle. This is consistent with the widely held hypothesis that sleep is a process generated by the brain for the benefit of the brain.
Almost all land animals coordinate their behavior according to circadian rhythms, the daily cycles of daylight and darkness that result from the spin of the Earth. (The term is from the Latin circa, “approximately,” and dies, “day.”) The precise schedules of circadian rhythms vary among species. Some animals are active during daylight hours, others only at night, and others mainly at the transitional periods of dawn and dusk. Most physiological and biochemical processes in the body also rise and fall with daily rhythms; body temperature, blood flow, urine production, hormone levels, hair growth, and metabolic rate all fluctuate (Figure 19.22). In humans, there is an approximately inverse relationship between the propensity to sleep and body temperature.

FIGURE 19.22 Circadian rhythms of physiological functions. Fluctuations over two consecutive days are shown here. Alertness and core body temperature vary similarly, but growth hormone and cortisol levels in the blood are highest during sleep, although at different times. The bottom graph shows the excretion of potassium by the kidneys, which is highest during the day. (Source: Adapted from Coleman, 1986, Fig. 2.1.) Description
When the cycles of daylight and darkness are removed from an animal’s environment, circadian rhythms continue on more or less the same schedule because the primary clocks for circadian rhythms are not astronomical (the sun and Earth) but biological in the brain. Brain clocks, like all clocks, are imperfect and require occasional resetting. Now and then you readjust your watch to keep it in sync with the rest of the world (or at least the time on your computer). Similarly, external stimuli, such as light and dark, or daily temperature changes, help adjust the brain’s clocks to keep them synchronized with the coming and going of the sunlight. Circadian rhythms have been well studied at behavioral, cellular, and molecular levels. Brain clocks are an interesting example of the link between the activity of specific neurons and behavior.
The first evidence for a biological clock came from a brainless organism, the mimosa plant. The mimosa raises its leaves during the day and lowers them at night. It seemed obvious to many people that the plant simply reacted to sunlight with some kind of reflex movement. In 1729, French physicist Jean Jacques d’Ortous de Mairan tested the obvious; he put some mimosa plants in a dark closet and found that they continued to raise and lower their leaves. But a surprising new observation can still lead to a wrong conclusion. It was de Mairan’s opinion that the plant was still somehow sensing the sun’s movement, even in the darkness. More than a century later, Swiss botanist Augustin de Candolle showed that a similar plant in the dark moved its leaves up and down every 22 hours, rather than every 24 hours, according to the sun’s movement. This implied that the plant was not responding to the sun and very likely had an internal biological clock.
Environmental time cues (light/dark, temperature and humidity variations) are collectively termed zeitgebers (German for “time givers”). In the presence of zeitgebers, animals become entrained to the day–night rhythm and maintain an activity cycle of exactly 24 hours. Obviously, even small, consistent errors of timing could not be tolerated for long. A 24.5-hour cycle would, within 3 weeks, completely shift an animal from daytime to nighttime activity. When mammals are completely deprived of zeitgebers, they settle into a rhythm of activity and rest that often has a period more or less than 24 hours, in which case their rhythms are said to free-run. In mice, the natural free-running period is about 23 hours, in hamsters it is close to 24 hours, and in humans it tends to be 24.5–25.5 hours (Figure 19.23).

FIGURE 19.23 Circadian rhythms of sleep and wakefulness. This is a plot of one person’s daily sleep-wake cycles over a period of 45 days. Each horizontal line is a day; solid lines indicate sleep, and dashed lines indicate waking. A triangle indicates the point of the day’s lowest body temperature. The subject was first exposed to 9 days of natural 24-hour cycles of light and dark, noise and quiet, and air temperature. During the middle 25 days, all time cues were removed, and the subject was free to set his own schedule. Notice that the sleep–wake cycles remained stable, but each lengthened to about 25 hours. The subject was now free-running. Notice also that the low point of body temperature shifted from the end of the sleep period to the beginning. During the last 11 days, a 24-hour cycle of light and meals was reintroduced, the subject again entrained to a day-long rhythm, and body temperature gradually shifted back to its normal point in the sleep cycle. (Source: Adapted from Dement, 1976, Fig. 2.) Description
It is quite difficult to separate a human from all possible zeitgebers. Even inside a laboratory, society provides many subtle time cues, such as the sounds of machinery, the comings and goings of people, and the on–off cycling of heating and air conditioning. Some of the most secluded environments are deep caves, which have been the sites for several isolation studies. When people in caves are allowed to set their own schedules of activity for months on end—waking and sleeping, turning lights on and off, and eating when they choose—they initially settle into roughly a 25-hour rhythm. But after days to weeks, their activity may begin to free-run with a surprisingly long period of 30–36 hours. They may stay awake for about 20 hours straight, then sleep for about 12 hours, and this pattern seems perfectly normal to them at the time.
In isolation experiments, behavior and physiology do not always continue to cycle together. Recent studies have found that body temperature and other physiological measures may continue to change reliably over a 24-hour cycle, even if people are entrained on a 20-hour or 28-hour “day” with artificial lighting. This means that the rhythms of temperature and sleeping–waking, which are normally synchronized to a 24-hour period, become desynchronized. In the cave experiments described earlier, there can be even larger differences in the periods of behavioral and physiological cycles, when people are allowed to set their own schedules. Normally, our lowest body temperature occurs shortly before we awaken in the morning, but when desynchronized, this temperature nadir can drift, first moving earlier into the sleep period, and then into waking time. Sleep quality and waking comfort are impaired when cycles are desynchronized. One implication of this desynchronization is that the body has more than one biological clock because sleeping–waking and temperature can cycle at their own pace, uncoupled from one another.
Desynchronization may occur temporarily when we travel and force our bodies suddenly into a new sleep–wake cycle. This is the familiar experience known as jet lag, and the best cure is bright light, which helps resynchronize our biological clocks.
The primary zeitgeber for mature mammals is the light–dark cycle. A mother’s hormone levels may be the first zeitgeber for some mammals, however, already entraining their activity levels in the womb. In studies of various adult animals, effective zeitgebers have also included the periodic availability of food or water, social contact, environmental temperature cycles, and noise–quiet cycles. Although many of these are much less effective than light–dark cycles, they may be important for particular species, in certain circumstances.
A biological clock that produces circadian rhythms consists of several components:
One or more input pathways are sensitive to light and dark and entrain the clock and keep its rhythm coordinated with the circadian rhythms of the environment. The clock itself continues to run and keep its basic rhythm even when the input pathway is removed. Output pathways from the clock allow it to control certain brain and body functions according to the timing of the clock.
Mammals have a tiny pair of neuron clusters in the hypothalamus that serves as a biological clock: the suprachiasmatic nuclei (SCN), introduced in Chapter 15. Each SCN has a volume of less than 0.3 mm3, and its neurons are among the smallest in the brain. They are located on either side of the midline, bordering the third ventricle (Figure 19.24). When the SCN is stimulated electrically, circadian rhythms can be shifted in a predictable way. Removal of both nuclei abolishes the circadian rhythmicity of physical activity, sleeping and waking, and feeding and drinking (Figure 19.25). In hamsters, the transplantation of a new SCN can restore rhythms within 2–4 weeks (Box 19.5). The brain’s internal rhythms never return without an SCN. Lesions in the SCN do not abolish sleeping, however, and animals will continue to coordinate their sleeping and waking with light–dark cycles if they are present. Sleep appears to be regulated by a mechanism other than the circadian clock, which depends primarily on the amount and timing of prior sleep.

FIGURE 19.24 The human suprachiasmatic nuclei. Two SCN reside within the hypothalamus, just above the optic chiasm and next to the third ventricle. The sagittal view is followed by a frontal view, sectioned at the dashed line. Description

FIGURE 19.25 The SCN and circadian rhythms. (a) Normal squirrel monkeys kept in a constantly lit environment display circadian rhythms of about 25.5 hours. The graph shows the stages of waking–sleeping and concurrent variations in body temperature. The animals’ activity states were defined as awake, two levels of non-REM sleep (non-REM1 or non-REM2), or REM sleep. (b) Circadian rhythms are abolished in monkeys with lesions in both SCN, kept in the same constant light environment. Notice that persistent high-frequency rhythms of both activity and temperature result from SCN lesions. (Source: Adapted from Edgar et al., 1993, Figs. 1, 3.) Description
Golden hamsters are perfectionists of circadian timing. When placed in constant darkness, they continue sleeping and waking, running on their wheels, and eating and drinking over an average period of 24.1 hours for weeks on end.
It was this dependability that made neuroscientists Martin Ralph and Michael Menaker, then working at the University of Oregon, notice when one of the hamsters in their laboratory began punching in with 22.0-hour cycles during a period of 3 weeks in the dark. This maverick male was bred with three females of unimpeachable circadian character (their free-running periods were 24.01, 24.03, and 24.04 hours—quite normal). When 20 pups from the three resulting litters were tested in the dark, their free-running periods were evenly split into two narrow groups. Half had periods of 24.0 hours and half had periods of 22.3 hours. Further cross-breeding showed that the hamsters with the shorter circadian periods had one mutant copy of a gene (tau) that was dominant over their normal gene. After further breeding, Ralph and Menaker found that animals with two copies of the mutant tau gene had free-running periods of only 20 hours! The tau mutation was eventually identified as a specific kinase that interacts with certain clock genes (see Figure 19.27).

FIGURE 19.27 Clock genes. In the SCN, clock genes produce proteins that inhibit further transcription. Gene transcription and the firing rate of individual SCN neurons cycle up and down over 24 hours. The cycles of many cells are synchronized by light exposure (input from the retina) and by interactions of the SCN neurons. Description
Hamsters with mutant circadian rhythms provided a convincing way to answer a fundamental question: Is the SCN the brain’s circadian clock? Ralph, Menaker, and their colleagues found that when both SCNs of a hamster were ablated, rhythms were entirely lost. But rhythms could be restored to these ablated animals by simply transplanting a new SCN into their hypothalamus and waiting about a week.
The key finding was that hamsters receiving transplants adopted the circadian rhythm of the transplanted SCN, not the rhythm they were born with. In other words, if a genetically normal hamster with SCN lesions received an SCN from a donor with one copy of the mutant tau gene, it subsequently cycled at about 22 hours. If its transplanted SCN came from an animal with two mutant taus, it cycled at 20 hours. This is very compelling evidence that the SCN is the master circadian clock in the hamster brain and probably in our own brain as well.
Short circadian periods were often devastating to a mutant hamster’s lifestyle when it was placed into normal 24-hour light and dark cycles. A hamster’s normal preference is to be active at night, but most tau animals could not completely entrain to the 24-hour rhythm. Instead, they found their activity periods continually shifting through various parts of the light–dark cycle.
A similar problem sometimes occurs in people, most often in the elderly. Due to an age-dependent shortening of the circadian rhythm, overwhelming sleepiness begins in early evening, and awakening comes at 3:00 or 4:00 in the morning. Some people are unable to entrain their sleep–wake cycles to a daily rhythm and, like the mutant hamsters, find their activity cycles constantly shifting with respect to daylight.
Because behavior is normally synchronized with light–dark cycles, there must also be a photosensitive mechanism for resetting the brain clock. The SCN accomplishes this via the retinohypothalamic tract: Axons from ganglion cells in the retina synapse directly on the dendrites of SCN neurons. This input from the retina is necessary and sufficient to entrain sleeping and waking cycles to night and day. When recordings are made from neurons of the SCN, many are indeed sensitive to light. Unlike the more familiar neurons of the visual pathways (see Chapter 10), SCN neurons have very large, nonselective receptive fields and respond to the luminance of light stimuli rather than their orientation or motion.
Research in the last decade suggests, surprisingly, that the retinal cells synchronizing the SCN are neither rods nor cones. It had long been known that eyeless mice cannot use light to reset their clocks, but mutant mice with intact retinas that lack rods and cones can! Since rods and cones were the only known photoreceptors in mammals, it remained a mystery how light could affect the circadian clock without them.
This mystery was solved by David Berson of Brown University and his colleagues. They discovered a new photoreceptor in the retina that was not at all like rods and cones but was, remarkably, a very specialized type of ganglion cell. Recall from Chapter 9 that ganglion cells are retinal neurons whose axons send visual information to the rest of the brain; ganglion cells, like nearly all other neurons in the brain, were not supposed to be directly sensitive to light. The light-sensitive ganglion cells, however, express a unique type of photopigment called melanopsin, which is not present in rods and cones. These neurons are very slowly excited by light, and their axons send a signal directly to the SCN that can reset the circadian clock that resides there.
Output axons of the SCN mainly innervate nearby parts of the hypothalamus, but some also go to the midbrain and other parts of the diencephalon. Because almost all SCN neurons use GABA as their primary neurotransmitter, presumably they inhibit the neurons they innervate. It is not yet clear how the SCN sets the timing of so many important behaviors. Extensive lesions in the efferent SCN pathways disrupt circadian rhythms. In addition to the axonal output pathways, SCN neurons may rhythmically secrete the peptide neuromodulator vasopressin (see Chapter 15).
How do neurons of the SCN keep time? It’s clear that each SCN cell is a minuscule clock that keeps time with regular ticks and tocks of its molecular machinery. The ultimate isolation experiment has been simply to remove neurons from the SCN of an animal and grow each cell alone in a tissue culture dish, segregating them from the rest of the brain and from each other. Nevertheless, their rates of action potential firing, glucose utilization, vasopressin production, and protein synthesis continue to vary with rhythms of about 24 hours, just as they do in the intact brain (Figure 19.26). SCN cells in culture can no longer be entrained to light–dark cycles (input from the eyes is necessary for this), but their basic rhythmicity remains intact and expresses itself just as it does when an animal is deprived of zeitgebers.

FIGURE 19.26 Circadian rhythms of the SCN isolated from the rest of the brain. The activity of a clock gene was monitored in 100 individual SCN neurons maintained in tissue culture. Each neuron generates a strong circadian rhythm that is well coordinated with the other neurons. (Source: Adapted from Yamaguchi et al., 2003, Fig. 1) Description
SCN cells communicate their rhythmic message to the rest of the brain through efferent axons, using action potentials in the usual way, and rates of SCN cell firing vary with a circadian rhythm. However, action potentials are not necessary for SCN neurons to maintain their rhythm. When tetrodotoxin (TTX), a blocker of sodium channels, is applied to SCN cells, it blocks their action potentials but has no effect on the rhythmicity of their metabolism and biochemical functions. When the TTX is removed, action potentials resume firing with the same phase and frequency they had originally, before the TTX, implying that the SCN clock keeps running even without action potentials. SCN action potentials are like the hands of a clock; removing the clock’s hands does not stop the innards of the clock from working, but it does make it impossible to read the time in the usual way.
What is the nature of this clock that functions without action potentials? Research in a wide range of species indicates that it is a molecular cycle based on gene expression. The molecular clock used in humans is similar to those found in mice, fruit flies (Drosophila), and even bread mold. In Drosophila and mice, the system involves a variety of clock genes. Some of the more important genes in mammals are known as period (per), cryptochrome, and clock. Although the details vary across species, the basic scheme is a negative feedback loop. Many of the details were first worked out in experiments performed by Joseph Takahashi and his colleagues at Northwestern University, who named the clock gene (an acronym for circadian locomotor output cycles kaput). A clock gene is transcribed to produce mRNA that is then translated into proteins. After a delay, the newly manufactured proteins send feedback and interact with the transcription mechanism, causing a decrease in gene expression. As a consequence of decreased transcription, less protein is produced, and gene expression again increases to start the cycle anew. This entire cycle takes about 24 hours, and thus it is a circadian rhythm (Figure 19.27).
If each SCN neuron is a clock, there must be a mechanism to coordinate the thousands of cellular clocks so that the SCN as a whole transmits a single, clear message about time to the rest of the brain. Light information from the retina serves to reset the clocks in the SCN neurons each day, but the SCN neurons also communicate directly with each other. Surprisingly, the coordination of rhythms between SCN cells seems to be independent of action potentials and normal synaptic transmission because TTX does not block them. Also, the SCN of the very young rat brain coordinates circadian rhythms perfectly well, even before it has developed any chemical synapses. The nature of neuron-to-neuron communication within the SCN is poorly understood, but in addition to classical chemical synapses, it includes other chemical signals, electrical synapses (gap junctions), and the participation of glia.
Research has shown that nearly every cell of the body, including those in the liver, kidney, and lung, has a circadian clock. The same types of gene transcription feedback loops that drive the SCN clock also drive the clocks in these peripheral tissues. When cells from liver, kidney, or lung are grown in isolation, each exhibits a circadian rhythm of its own. Under normal conditions in an intact body, however, all cells’ clocks are under the master control of the SCN. How does the SCN govern the innumerable clocks scattered throughout the body’s organs? Several signaling pathways seem to be important. The SCN has a strong circadian influence on the autonomic nervous system, core body temperature, adrenal gland hormones such as cortisol, and neural circuits that control feeding, movement, and metabolism (Figure 19.28). Each of these processes in turn regulates many of the body’s circadian clocks. Body temperature, for example, has a powerful effect on the clocks of peripheral tissues. It drops sharply by about 1 °C each night under the influence of the SCN (see Figure 19.22). This pulse of cooling helps to ensure that the clocks of the internal organs all remain set to the daily rhythms of the SCN and thus to the cycles of environmental dark and light. Interestingly, the SCN’s circadian clock is very resistant to temperature changes; this makes sense because it ensures that the SCN, which controls core temperature changes, is not destabilized by its own control signals.

FIGURE 19.28 Control pathways from the SCN to peripheral circadian clocks. The SCN regulates circadian clocks throughout the body (including the liver shown here) via its control over the ANS; core body temperature; cortisol and other hormones; and feeding, locomotion, and metabolism. (Source: Adapted from Mohawk et al., 2012, Fig. 3.) Description
The complex systems that coordinate the body’s clocks are not perfect. Odd feeding schedules, chronic doses of methamphetamine and, as we mentioned previously, extreme living conditions (long-term cave dwelling) can all desynchronize the body’s circadian clocks.
Rhythms are ubiquitous in the vertebrate central nervous system. They also span a broad range of frequencies, from more than 500 Hz in the cortical EEG to once per year (0.00000003 Hz) for many seasonal behaviors, such as the autumn mating of deer, the winter hibernation of chipmunks, and the instinct that drives migrating swallows to return to Capistrano, California every March 19. According to local legend, in 200 years, these swallows have missed the date only twice. In some cases, these rhythms are based on intrinsic brain mechanisms; in some, they result from environmental factors; and in others, such as the SCN clock, they represent an interaction of a neural process and zeitgebers.
While the purpose of some rhythms is obvious, the functions of many neural rhythms are unknown. Indeed, some rhythms may have no function at all but arise as a secondary consequence of neural interconnections that are essential for other, nonrhythmic, purposes.
Among the most conspicuous yet inexplicable of brain rhythms is sleep. Sleep provides a fascinating set of problems for neuroscience. Unlike most studies of single ion channels, single neurons, or the systems mediating perception and movement, sleep research begins with profound ignorance about a most basic question: Why? We still don’t know why we spend one-third of our lives sleeping, most of that time languid and vegetative and the rest of it paralyzed and hallucinating. Sleep and dreams may have no vital function, but they can be studied and enjoyed nevertheless. Ignoring the functional question will not be a satisfying approach for long, however. For most neuroscientists, asking “Why?” remains the deepest and most challenging problem of all.
1. Why do EEGs with relatively fast frequencies tend to have smaller amplitudes than EEGs with slower frequencies?
2. The human cerebral cortex is very large and must be folded extensively to fit within the skull. What do the foldings of the cortical surface do to the brain signals that are recorded by an EEG electrode at the scalp?
3. Sleep seems to be a behavior of every species of mammal, bird, and reptile. Does this mean that sleep performs a function essential for the life of these higher vertebrates? If you do not think so, what might be an explanation for the abundance of sleep?
4. An EEG during REM sleep is very similar to an EEG when awake. How do the brain and body in REM sleep differ from the brain and body when awake?
5. What is a likely explanation for the brain’s relative insensitivity to sensory input during REM sleep compared to the waking state?
6. The SCN receives direct input from the retina, via the retinohypothalamic tract, and this is how light–dark cycles can entrain circadian rhythms. If the retinal axons were somehow disrupted, what would be the likely effect on a person’s circadian rhythms of sleeping and waking?
7. What differences would there be in the behavioral consequences of a free-running circadian clock versus no clock at all?
Brown RE, Basheer R, McKenna JT, Strecker RE, McCarley RW. 2012. Control of sleep and wakefulness. Physiological Reviews 92: 1087–1187.
Buzsáki G. 2006. Rhythms of the Brain. New York: Oxford University Press.
Carskadon MA, ed. 1993. Encyclopedia of Sleep and Dreaming. New York: Macmillan.
Fries P. 2009. Neuronal gamma-band synchronization as a fundamental process in cortical computation. Annual Review of Neuroscience 32:209–224.
Goldberg EM, Coulter DA. 2013. Mechanisms of epileptogenesis: a convergence on neural circuit dysfunction. Nature Reviews Neuroscience 14:337–349.
Mohawk JA, Green CB, Takahashi JS. 2012. Central and peripheral circadian clocks in mammals. Annual Review of Neuroscience 35:445–462.
Additional figures