Chapter 11: Spectroscopy
Chapter 11: Spectroscopy
SCIENCE MASTERY ASSESSMENT
Every pre-med knows this feeling: there is so much content I have to know for the MCAT! How do I know what to do first or what's important?
While the high-yield badges throughout this book will help you identify the most important topics, this Science Mastery Assessment is another tool in your MCAT prep arsenal. This quiz (which can also be taken in your online resources) and the guidance below will help ensure that you are spending the appropriate amount of time on this chapter based on your personal strengths and weaknesses. Don't worry though— skipping something now does not mean you'll never study it. Later on in your prep, as you complete full-length tests, you'll uncover specific pieces of content that you need to review and can come back to these chapters as appropriate.
How to Use This Assessment
If you answer 0–7 questions correctly:
Spend about 1 hour to read this chapter in full and take limited notes throughout. Follow up by reviewing all quiz questions to ensure that you now understand how to solve each one.
If you answer 8–11 questions correctly:
Spend 20–40 minutes reviewing the quiz questions. Beginning with the questions you missed, read and take notes on the corresponding subchapters. For questions you answered correctly, ensure your thinking matches that of the explanation and you understand why each choice was correct or incorrect.
If you answer 12–15 questions correctly:
Spend less than 20 minutes reviewing all questions from the quiz. If you missed any, then include a quick read-through of the corresponding subchapters, or even just the relevant content within a subchapter, as part of your question review. For questions you got correct, ensure your thinking matches that of the explanation and review the Concept Summary at the end of the chapter.
-
IR spectroscopy is most useful for distinguishing:
- double and triple bonds.
- C–H bonds.
- chirality of molecules.
- relative percentage of enantiomers in mixtures.
-
Oxygen (O2) does not exhibit an IR spectrum because:
- it has no molecular motions.
- it is not possible to record IR spectra of a gaseous molecule.
- molecular vibrations do not result in a change in the dipole moment.
- molecular oxygen contains four lone pairs overall.
-
If IR spectroscopy were employed to monitor the oxidation of benzyl alcohol to benzaldehyde, which of the following would provide the best evidence that the reaction was proceeding as planned?
- Comparing the fingerprint region of the spectra of starting material and product
- Noting the change in intensity of the peaks corresponding to the benzene ring
- Noting the appearance of a broad absorption peak in the region of 3100–3500 cm–1
- Noting the appearance of a strong absorption in the region of 1750 cm–1
-
Which of the following chemical shifts could correspond to an aldehydic proton signal in a 1H–NMR spectrum?
- 9.5 ppm
- 7.0 ppm
- 11.0 ppm
- 1.0 ppm
-
The isotope 12C is not useful for NMR because:
- it is not abundant in nature.
- its resonances are not sensitive to the presence of neighboring atoms.
- it has no magnetic moment.
- the signal-to-noise ratio in the spectrum is too low.
-
In 1H–NMR, splitting of spectral lines is due to:
- coupling between a carbon atom and protons attached to that carbon atom.
- coupling between a carbon atom and protons attached to adjacent carbon atoms.
- coupling between adjacent carbon atoms.
- coupling between protons on adjacent carbon atoms.
-
Compared to IR and NMR spectroscopy, UV spectroscopy is preferred for detecting:
- aldehydes and ketones.
- unconjugated alkenes.
- conjugated alkenes.
- aliphatic acids and amines.
-
Considering only the 0 to 4.5 ppm region of a 1H–NMR spectrum, how could ethanol and isopropanol be distinguished?
- They cannot be distinguished from 1H–NMR alone.
- A triplet and quartet are observed for ethanol, whereas a doublet and septet are observed for isopropanol.
- A triplet and quartet are observed for isopropanol, whereas a doublet and septet are observed for ethanol.
- The alcohol hydrogen in ethanol will appear within that region, whereas the alcohol hydrogen in isopropanol will appear downfield of that region.
-
Before absorbing an ultraviolet photon, electrons can be found in:
- the HOMO only.
- the LUMO only.
- both the HOMO and the LUMO.
- neither the HOMO nor the LUMO.
-
In an IR spectrum, how does extended conjugation of double bonds affect the absorbance band of carbonyl (C=O) stretches compared with normal absorption?
- The absorbance band will occur at a lower wavenumber.
- The absorbance band will occur at a higher wavenumber.
- The absorbance band will occur at the same wavenumber.
- The absorbance band will disappear.
-
Wavenumber is directly proportional to:
- wavelength.
- frequency.
- percent transmittance.
- absorbance.
-
Two enantiomers will:
- have identical IR spectra because they have the same functional groups.
- have identical IR spectra because they have the same specific rotation.
- have different IR spectra because they are structurally different.
- have different IR spectra because they have different specific rotations.
-
In a molecule containing a carboxylic acid group, what would be expected in a 1H–NMR spectrum?
- A deshielded hydrogen peak for the hydroxyl hydrogen, shifted left
- A deshielded hydrogen peak for the hydroxyl hydrogen, shifted right
- A shielded hydrogen peak for the hydroxyl hydrogen, shifted left
- A shielded hydrogen peak for the hydroxyl hydrogen, shifted right
-
The coupling constant, J, is:
- the value of n + 1 when determining splitting in NMR spectra.
- measured in parts per million (ppm).
- corrected for by calibration with tetramethylsilane.
- a measure of the degree of splitting caused by other atoms in the molecule.
-
The IR spectrum of a fully protonated amino acid would likely contain which of the following peaks?
- A sharp peak at 1750 cm–1
- A sharp peak at 3300 cm–1
- A broad peak at 3300 cm–1
- I only
- I and II only
- II and III only
- I, II, and III
Answer Key
- A
- C
- D
- A
- C
- D
- C
- B
- A
- A
- B
- A
- A
- D
- B
Chapter 11: Spectroscopy
CHAPTER 11
SPECTROSCOPY
In This Chapter
11.1 Infrared Spectroscopy
Intramolecular Vibrations and Rotations
Characteristic Absorptions
11.2 Ultraviolet Spectroscopy
Electron Transitions
Conjugated Systems
11.3 Nuclear Magnetic Resonance Spectroscopy
Proton NMR (1H–NMR)
Concept Summary
CHAPTER PROFILE
The content in this chapter should be relevant to about 8% of all questions about organic chemistry on the MCAT.
This chapter covers material from the following AAMC content category:
4D: How light and sound interact with matter
Introduction
If we are given an unknown compound, one of the most efficient ways to identify it and determine its properties is by using spectroscopy. Spectroscopy measures the energy differences between the possible states of a molecular system by determining the frequencies of electromagnetic radiation absorbed by the molecules. These possible states are quantized energy levels associated with different types of molecular motion, such as molecular rotation, vibration of bonds, electron absorption, and nuclear spin transitions. Different types of spectroscopy measure different types of molecular properties, allowing us to identify the presence of specific functional groups and to detect the connectivity (backbone) of a molecule.
In a medical context, spectroscopy is important in magnetic resonance imaging (MRI). MRI scanners actually measure 1H–NMR spectra of water molecules in different environments in the body. They then convert these signals into greyscale, allowing excellent visualization of the body, especially soft tissue.
One of the big advantages of laboratory spectroscopy is that only a small quantity of a sample is needed. Also, the sample may be reused after a test is performed. The downside of spectroscopy is that it’s difficult to do without special equipment—but as long as you have a chemistry lab available, these are some of the best techniques to identify compounds.
11.1 Infrared Spectroscopy
LEARNING OBJECTIVES
After Chapter 11.1, you will be able to:
- Predict the IR peaks for common organic functional groups, including ketones, carboxylic acids, and alcohols
- Recall the conditions in which IR spectroscopy is generally used, and what it is used to measure
Infrared (IR) spectroscopy measures molecular vibrations, which can be seen as bond stretching, bending, or combinations of different vibrational modes. To record an IR spectrum, infrared light is passed through a sample, and the absorbance is measured. By determining what bonds exist within a molecule, we hope to infer the functional groups in the molecule.
Intramolecular Vibrations and Rotations
The infrared light range runs from λ = 700 nm to 1 mm, but the useful absorptions for spectroscopy occur at wavelengths of 2500 to 25,000 nm. On an IR spectrum, we use an analog of frequency called wavenumber. The standard range corresponding to 2500 to 25,000 nm is 4000 to 400 cm–1. When light of these wavenumbers is absorbed, the molecules enter excited vibrational states. Four types of vibration that can occur are shown in Figure 11.1. Others include twisting and folding.
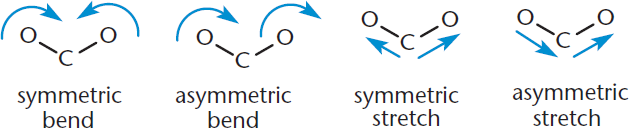
Figure 11.1. Molecular Vibrations Measured by Infrared (IR) Spectroscopy Bond bending and stretching; twisting and folding can also occur.
KEY CONCEPT
Wavenumbers (cm–1) are an analog of frequency.

whereas

More complex vibration patterns, caused by the motion of the molecule as a whole, can be seen in the 1500 to 400 cm–1 range. This is called the fingerprint region because the specific absorbance pattern is characteristic of each individual molecule. Spectroscopy experts can use this region to identify a substance, but you won’t ever need to use it on the MCAT.
For an absorption to be recorded, the vibration must result in a change in the bond dipole moment. This means that molecules that do not experience a change in dipole moment, such as those composed of atoms with the same electronegativity or molecules that are symmetrical, do not exhibit absorption. For example, we cannot get an absorption from O2 or Br2, but we can from HCl or CO. Symmetric bonds, such as the triple bond in acetylene (C2H2), will also be silent.
KEY CONCEPT
Symmetric stretches do not show up in IR spectra because they involve no net change in dipole movement.
Characteristic Absorptions
For the MCAT, you only need to memorize a few absorptions. The first is the hydroxyl group, O–H, which absorbs with a broad (wide) peak at around one of two frequencies: 3300 cm–1 for alcohols, and 3000 cm–1 for carboxylic acids. The carbonyl of a carboxylic acid pulls some of the electron density out of the O–H bond, shifting the absorption to a lower wavenumber. The second is the carbonyl, which absorbs around 1700 cm–1 with a sharp (deep) peak. In Table 11.1, notice how the bond between any atom and hydrogen always has a relatively high absorption frequency and how, as we add more bonds between carbon atoms, the absorption frequency increases. N–H bonds are in the same region as O–H bonds (around 3300 cm–1), but have a sharp peak instead of a broad one. You should be able to identify these three peaks in an IR spectrum. If you need to identify other peaks on Test Day, a list or table of peak wavenumbers will be provided.
Table 11.1. Absorption Frequencies
FUNCTIONAL GROUP WAVENUMBER (cm−1) VIBRATION
Alkanes 2800–3000 1200 C–H C–C
Alkenes 3080–3140 1645 =C–H C=C
Alkynes 3300 2200 ≡C–H C≡C
Aromatic 2900–3100 1475–1625 C–H C–C
Alcohols 3100–3500 O–H (broad)
Ethers 1050–1150 C–O
Aldehydes 2700–2900 1700–1750 (O)C–H C=O
Ketones 1700–1750 C=O
Carboxylic Acids 1700–1750 2800–3200 C=O O–H (broad)
Amines 3100–3500 N–H (sharp)
MCAT EXPERTISE
Infrared spectroscopy is best used for identification of functional groups. The most important peaks to know are:
- O–H (broad around 3300 cm–1)
- N–H (sharp around 3300 cm–1)
- C=O (sharp around 1750 cm–1)
We can learn a great deal of information from an IR spectrum; for the MCAT, all of the information comes from the frequencies between 1400 and 4000 cm–1. Everything lower (in the fingerprint region) is out of scope. IR spectra are plotted as percent transmittance, the amount of light that passes through the sample and reaches the detector, vs. wavenumber.
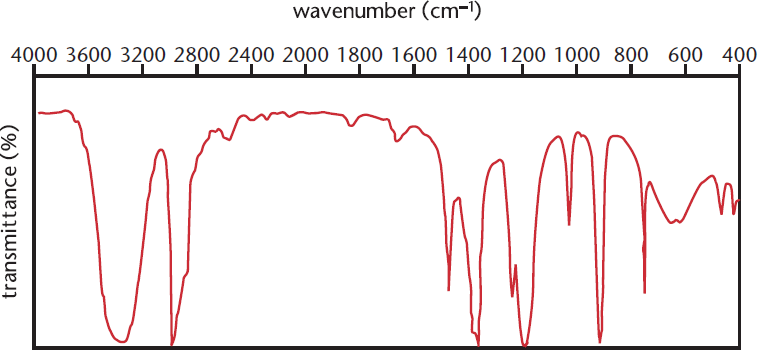
Figure 11.2. IR Spectrum of an Aliphatic Alcohol Broad peak at 3300 cm–1: –OH
KEY CONCEPT
In an IR spectrum, percent transmittance is plotted vs. frequency. The equation relating absorbance, A, and percent transmittance, % T, is A = 2 – log %T; this means that maximum absorptions appear as the bottoms of valleys on the spectrum.
Figure 11.2 shows the IR spectrum for an aliphatic alcohol: the large broad peak at 3300 cm–1 is due to the presence of a hydroxyl group, whereas the sharper peak at 3000 cm–1 is due to the carbon–hydrogen bonds in the alkane portion of the molecule, as listed in Table 11.1.
MCAT CONCEPT CHECK 11.1:
Before you move on, assess your understanding of the material with these questions.
-
What does infrared (IR) spectroscopy measure? What is IR spectroscopy generally used for?
________________________
-
What two peaks would you expect to see in the IR spectrum of a carboxylic acid?
- ____________________________
- ____________________________
11.2 Ultraviolet Spectroscopy
LEARNING OBJECTIVES
After Chapter 11.2, you will be able to:
- Predict whether a given molecule can be detected via UV spectroscopy
- Describe the relationship between HOMO, LUMO, and absorption wavelength
Although you will never have to interpret ultraviolet (UV)spectroscopy data on the MCAT, it is fair game for discussion. A basic understanding of how it works and when it is used will suffice. UV spectra are obtained by passing ultraviolet light through a sample that is usually dissolved in an inert, nonabsorbing solvent, and recording the absorbance. The absorbance is then plotted against wavelength. The absorbance is caused by electronic transitions between orbitals. The biggest piece of information we get from this technique is the wavelength of maximum absorbance, which tells us the extent of conjugation within conjugated systems: the more conjugated the compound, the lower the energy of the transition and the greater the wavelength of maximum absorbance.
Electron Transitions
UV spectroscopy works because molecules with π-electrons or nonbonding electrons can be excited by ultraviolet light to higher-energy antibonding orbitals. Molecules with a lower energy gap between highest occupied molecular orbital (HOMO) and lowest unoccupied molecular orbital (LUMO) are more easily excited and can absorb longer wavelengths (lower frequencies) with lower energy.
MCAT EXPERTISE
UV spectroscopy is most useful for studying compounds containing double bonds or heteroatoms with lone pairs that create conjugated systems. For the MCAT, that is all you need to know.
Conjugated Systems
Conjugated molecules, or molecules with unhybridized p-orbitals, can also be excited by ultraviolet light. Conjugation shifts the absorption spectrum, resulting in higher maximum wavelengths (lower frequencies). For example, benzene has three broad absorbances, which mark the energy level transitions; these are found at 180, 200, and 255 nm wavelengths. Larger conjugated molecules may even absorb light in the visible range, leading to color. Because the technique for UV spectroscopy can also be used at visible wavelengths, it is sometimes called UV–Vis spectroscopy.
MCAT CONCEPT CHECK 11.2:
Before you move on, assess your understanding of the material with these questions.
-
Which of the following molecules are detectable by UV spectroscopy: propane, propene, propanone? ______________________________
-
In UV spectroscopy, what is the HOMO? What is the LUMO? How are they related to absorption wavelength?
- HOMO:______________________________
- LUMO:______________________________
- Relation to absorption wavelength:______________________________
11.3 Nuclear Magnetic Resonance Spectroscopy
LEARNING OBJECTIVES
After Chapter 11.3, you will be able to:
- Describe what NMR spectroscopy measures and what it is generally used for
- Recall the units for chemical shift on standardized NMR
- Identify what deshielding and spin-spin coupling are, and how they impact NMR spectra
- Recognize key regions and peaks within an NMR spectrum
- Match a compound to a given NMR spectrum analysis:
Nuclear magnetic resonance (NMR) spectroscopy is the most important spectroscopic technique to understand for the MCAT. NMR spectroscopy is based on the fact that certain atomic nuclei have magnetic moments that are oriented at random. When such nuclei are placed in a magnetic field, their magnetic moments tend to align either with or against the direction of this applied field. Nuclei with magnetic moments that are aligned with the field are said to be in the α-state (lower energy). The nuclei can then be irradiated with radiofrequency pulses that match the energy gap between the two states, which will excite some lower-energy nuclei into the β-state (higher energy). The absorption of this radiation leads to excitation at different frequencies, depending on an atom’s magnetic environment. In addition, the nuclear magnetic moments of atoms are affected by nearby atoms that also possess magnetic moments.
Magnetic resonance imaging (MRI) is a noninvasive diagnostic tool that uses proton NMR, as shown in Figure 11.3. Multiple cross-sectional scans of the patient’s body are taken, and the various chemical shifts of absorbing protons are translated into specific shades of grey. This produces a picture that shows the relative density of specific types of protons; for instance, a dark area on a T1-weighted MRI tends to correspond to water, whereas a light area indicates fattier tissue. Comparison with a normal MRI then allows the diagnostician to detect abnormalities in the scanned region. We mention this to explain the relevance of NMR spectroscopy to medicine; the MCAT will not test you on the details of how MRI works.
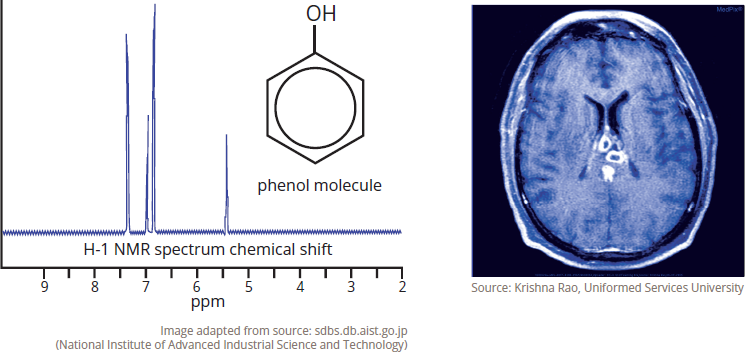
Figure 11.3. Magnetic Resonance Imaging (MRI)
A typical NMR spectrum is a plot of frequency vs. absorption of energy. Because different NMR spectrometers operate at different magnetic field strengths, a standardized method of plotting the NMR spectrum has been adopted. This standardized method, which is the only one seen on the MCAT, uses an arbitrary variable called chemical shift (δ), with units of parts per million (ppm) of spectrometer frequency. The chemical shift is plotted on the x-axis, and it increases toward the left (referred to as downfield). To make sure that we know just how far downfield compounds are, we use tetramethylsilane (TMS) as the calibration standard to mark 0 ppm; when counting peaks, make sure to skip the TMS peak.
KEY CONCEPT
TMS provides a reference peak. The signal for its 1H atoms is assigned δ = 0.
Nuclear magnetic resonance is most commonly used to study 1H nuclei (protons), although any atom possessing a nuclear spin (with an odd atomic number, odd mass number, or both) can be studied, such as 13C, 19F, 17O, 31P, and 59Co. The MCAT, however, only tests knowledge of 1H–NMR.
BRIDGE
Nuclei with odd mass numbers, odd atomic numbers, or both, will have a magnetic moment when placed in a magnetic field. Not all nuclei have magnetic moments (12C, for example). Atomic numbers and mass numbers are discussed in more detail in Chapter 1 of MCAT General Chemistry Review.
Proton NMR (1H–NMR)
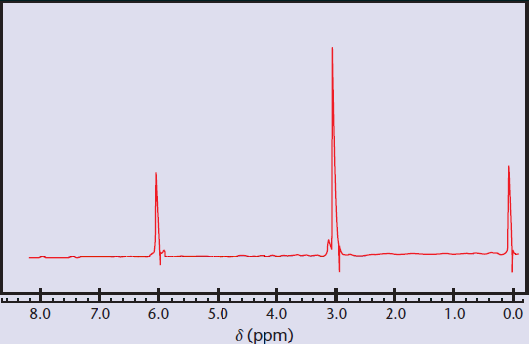
Most hydrogen (1H) nuclei come into resonance 0 to 10 ppm downfield from TMS. Each distinct set of nuclei gives rise to a separate peak. This means that if multiple protons are chemically equivalent, having the same magnetic environment, they will lead to the same peak. For example, Figure 11.4 depicts the 1H–NMR of dichloromethyl methyl ether, which has two distinct sets of 1H nuclei. The single proton attached to the dichloromethyl group (Ha) is in a different magnetic environment from the three protons on the methyl group (Hb), so the two classes will resonate at different frequencies. The three protons on the methyl group are chemically equivalent and resonate at the same frequency because this group rotates freely, and, on average, each proton sees an identical magnetic environment.
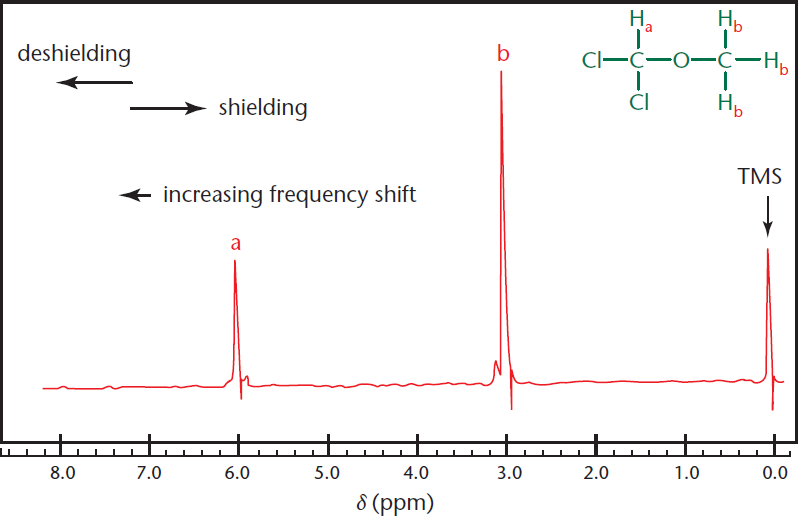
Figure 11.4. 1H–NMR Spectrum of Dichloromethyl Methyl Ether Peak a: Dichloromethyl proton; Peak b: Methyl protons.
MCAT EXPERTISE
To determine how many peaks will be in the spectrum, see if you can describe protons differently using words. In the dichloromethyl methyl ether shown in Figure 11.4, one could call Ha the hydrogen on the carbon with two chlorides and all three Hb hydrogens the ones in the methyl group. It would not be possible to describe each of these three hydrogens as distinct from each other because they rotate freely in space.
The peak on the left (a) is from the single dichloromethyl proton, and the taller middle peak is from the three methyl protons (b). The height of each peak is proportional to the number of protons it contains. Specifically, if we were to analyze the area under the peaks, called the integration, we would find that the ratio of (a) to (b) is 1:3, corresponding exactly to the ratio of protons that produced each peak.
Now that we know which peak is which, let’s talk about their respective positions on the spectrum. We can see that the peak for the single proton (a) is fairly far downfield compared with the other protons. This is because it is attached to a carbon with two electronegative chlorine atoms and an oxygen atom. These atoms pull electron density away from the surrounding atoms, thus deshielding the proton from the magnetic field. The more the proton’s electron density is pulled away, the less it can shield itself from the applied magnetic field, resulting in a reading further downfield. With this same reasoning, we know that if we had an electron-donating group, such as the silicon atom in TMS, it would help shield the 1H nuclei and give it a position further upfield. This is why tetramethylsilane is used as the reference or calibration peak; everything else in proton NMR will be more deshielded than it.
KEY CONCEPT
- Each peak or group of peaks that are part of a multiplet represents a single group of equivalent protons
- The relative area of each peak reflects the ratio of the protons producing each peak
- The position of the peak (upfield or downfield) is due to shielding or deshielding effects and reflects the chemical environment of the protons
Now, let’s make it a little more interesting. Consider a compound containing protons that are within three bonds of each other: in other words, a compound in which there are hydrogens on two adjacent atoms. When we have two protons in such close proximity to each other that are not magnetically identical, spin–spin coupling (splitting) occurs. Let’s use the molecule in Figure 11.5 to demonstrate this concept.
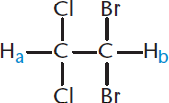
Figure 11.5. 1,1-Dibromo-2,2-dichloroethane
MNEMONIC
When dealing with 1H–NMR on the MCAT, think of a proton as being surrounded by a shield of electrons. As we add electronegative atoms or have resonance structures that pull electrons away from the proton, we Deshield and move Downfield.
Notice the two protons, Ha and Hb, on 1,1-dibromo-2,2-dichloroethane. Because of their proximity, the magnetic environment of Ha can be affected by Hb, and vice-versa. Thus, at any given time, Ha can experience two different magnetic environments because Hb can be in either the α- or the β-state. The different states of Hb influence the nucleus of Ha, causing slight upfield and downfield shifts. There is approximately a 50% chance that Hb will be in either of the two states, so the resulting absorption is a doublet: two peaks of identical intensity, equally spaced around the true chemical shift of Ha. Ha and Hb will both appear as doublets because each one is coupled with one other hydrogen. To determine the number of peaks present (as doublets, triplets, and so on), we use the ***n* + 1 rule***:if a proton hasnprotons that are three bonds away, it will be split inton+ 1 peaks. (One caveat: donotinclude protons attached to oxygen or nitrogen.) The magnitude of this splitting, measured in hertz, is called the coupling constant,J*.
KEY CONCEPT
The splitting of the peak represents the number of adjacent hydrogens. A peak will be split into n + 1 subpeaks, where n is the number of adjacent hydrogens.
Let’s try a molecule that has even more coupled protons. In 1,1-dibromo-2-chloroethane, shown in Figure 11.6, the Ha nucleus is affected by two nearby Hb nuclei, which together can be in one of four different states: αα, αβ, βα, or ββ.
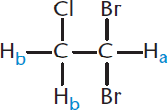
Figure 11.6. 1,1-Dibromo-2-chloroethane
Although there are technically four different states, αβ has the same effect as βα, so both of these resonances occur at the same frequency. This means we will have three unique frequencies, αα, αβ or βα, and ββ. Ha will thus appear as three peaks (a triplet) centered on the true chemical shift, with an area ratio of 1:2:1.
KEY CONCEPT
Proton NMR is good for:
- Determining the relative number of protons and their relative chemical environments
- Showing how many adjacent protons there are by splitting patterns
- Inferring certain functional groups
Now let’s move on to Hb. Because both hydrogens are attached to the same carbon, which can freely rotate, they will be magnetically identical. These hydrogens are three bonds away from one other hydrogen, Ha. This means that they will appear as a doublet. Because there are two of them, the integration for the doublet representing Hb will be larger than the triplet for Ha.
Table 11.2 shows the ratios for up to seven adjacent hydrogens, but it isn’t necessary to memorize this table for the MCAT. Just remember to follow the n + 1 rule for the proton of interest to determine the number of peaks. In addition, peaks that have more than four shifts will generally be referred to generically as a multiplet.
Table 11.2. Area Ratios for Peaks Split by Adjacent Hydrogens
NUMBER OF ADJACENT HYDROGENS TOTAL NUMBER OF PEAKS AREA RATIOS
0 1 1
1 2 1:1
2 3 1:2:1
3 4 1:3:3:1
4 5 1:4:6:4:1
5 6 1:5:10:10:5:1
6 7 1:6:15:20:15:6:1
7 8 1:7:21:35:35:21:7:1
Table 11.3 indicates the chemical shift ranges of several different types of protons. It is unnecessary to memorize this table, as it is fairly low-yield information. The values that are useful to memorize are the outliers like the deshielded aldehyde at 9 to 10 ppm, and the even more deshielded carboxylic acid between 10.5 and 12 ppm. Another popular peak on the MCAT is the hydrogen of an aromatic ring, which lies between 6.0 and 8.5 ppm. It is also worthwhile to know the general ranges for hydrogens on sp3-hybridized carbons (0.0 to 3.0 ppm; higher if electron-withdrawing groups are present), sp2-hybridized carbons (4.6 to 6.0 ppm), and sp-hybridized carbons (2.0 to 3.0 ppm). When electronegative groups are present, they pull electron density away from the protons. The more electron density that is pulled away from the proton, the more deshielded it will be and the further downfield the proton will appear.
Table 11.3. Proton Chemical Shift Ranges
TYPE OF PROTON APPROXIMATE CHEMICAL SHIFT δ (ppm) DOWNFIELD FROM TMS
RCH3 0.9
R2CH2 1.25
R3CH 1.5
RC=CH 4.6–6.0
RC≡CH 2.0–3.0
Ar–H 6.0–8.5
RCHX 2.0–4.5
RCHOH/RCHOR 3.4–4.0
RCHO 9.0–10.0
RCOCH3 2.0–2.5
RCHCOOH/RCHCOOR 2.0–2.6
ROH 1.0–5.5
ArOH 4.0–12.0
RCOOH 10.5–12.0
RNH2 1.0–5.0
MCAT EXPERTISE
On Test Day, just counting the number of peaks and unique hydrogens may be enough to get you the correct answer. (Remember not to count the peak for TMS, though!) If you need to consider shifts, the main ones for Test Day are:
- Alkyl groups: 0 to 3 ppm
- Alkynes: 2 to 3 ppm
- Alkenes: 4.6 to 6 ppm
- Aromatics: 6 to 8.5 ppm
- Aldehydes: 9 to 10 ppm
- Carboxylic acids: 10.5 to 12 ppm
MCAT CONCEPT CHECK 11.3:
Before you move on, assess your understanding of the material with these questions.
-
What does nuclear magnetic resonance (NMR) spectroscopy measure? What is NMR spectroscopy generally used for?
________________________
-
What are the units for chemical shift on a standardized NMR spectrum?
________________________
-
What does it mean for a proton to be deshielded? How does this affect its peak in NMR spectroscopy?
________________________
-
What is spin–spin coupling?
________________________
Conclusion
This chapter was full of numbers and values, but the most important thing to know about spectroscopy on the MCAT is that you don’t need to know a lot of numbers. The numbers that you do need to know have already been stressed heavily in this chapter. Know that infrared (IR) spectroscopy is best for identifying the presence (or, more importantly, the absence) of functional groups. A cursory understanding of ultraviolet (UV) spectroscopy and its association with conjugation will suffice. Nuclear magnetic resonance (NMR) spectroscopy—specifically, proton (1H) NMR— also helps us figure out the arrangement of functional groups. Know how to interpret IR and NMR spectra: IR spectra have three important peaks (O–H, C=O, and N–H), but NMR spectra can be far more complex. The MCAT can test the chemical shift of deshielded protons, which will be downfield, or toward the left of the spectrum. Make sure that you can interpret peak splitting, which is due to interference from neighboring hydrogens, and peak integration, which is proportional to the number of magnetically identical hydrogens.
Spectroscopy is often tested on the MCAT in the context of experiment-based passages. As you continue studying the reaction chemistry discussed in Chapters 4 through 10 of MCAT Organic Chemistry Review, consider what these products would yield in different spectroscopic modalities.
This chapter focused on one method of identifying compounds based on structural characteristics and interactions with electromagnetic energy, but spectroscopy is not the only method for characterizing organic molecules. In the next chapter, we explore another side of laboratory techniques: separation and purification schemes. These utilize physical differences between molecules to allow us to isolate and describe them.
GO ONLINE
You've reviewed the content, now test your knowledge and critical thinking skills by completing a test-like passage set in your online resources!
CONCEPT SUMMARY
Infrared Spectroscopy
- Infrared (IR) spectroscopy measures absorption of infrared light, which causes molecular vibration (stretching, bending, twisting, and folding).
- IR spectra are generally plotted as percent transmittance vs. wavenumber

- The normal range of a spectrum is 4000 to 400 cm–1.
- The fingerprint region is between 1500 and 400 cm–1. It contains a number of peaks that can be used by experts to identify a compound.
- To appear on an IR spectrum, vibration of a bond must change the bond dipole moment. Certain bonds have characteristic absorption frequencies, which allow us to infer the presence (or absence) of particular functional groups.
- The O–H peak is a broad peak around 3300 cm–1. Molecules with O–H include alcohols, water, and carboxylic acids; the carboxylic acid O–H peak will be shifted around 3000 cm–1.
- The N–H peak is a sharp peak around 3300 cm–1. Molecules with N–H include some amines, imines, and amides.
- The C=O peak is a sharp peak around 1750 cm–1. Molecules with C=O include aldehydes, ketones, carboxylic acids, amides, esters, and anhydrides.
Ultraviolet Spectroscopy
- Ultraviolet (UV) spectroscopy measures absorption of ultraviolet light, which causes movement of electrons between molecular orbitals.
- UV spectra are generally plotted as percent transmittance or absorbance vs. wavelength.
- To appear on a UV spectrum, a molecule must have a small enough energy difference between its highest occupied molecular orbital (HOMO) and its lowest unoccupied molecular orbital (LUMO) to permit an electron to move from one orbital to the other.
- The smaller the difference between HOMO and LUMO, the longer the wavelengths a molecule can absorb.
- Conjugation occurs in molecules with unhybridized p-orbitals. Conjugation shifts the absorption spectrum to higher maximum wavelengths (lower frequencies).
Nuclear Magnetic Resonance Spectroscopy
- Nuclear magnetic resonance (NMR) spectroscopy measures alignment of nuclear spin with an applied magnetic field, which depends on the magnetic environment of the nucleus itself. It is useful for determining the structure (connectivity) of a compound, including functional groups.
- Nuclei may be in the lower-energy α-state or higher-energy β-state; radiofrequency pulses push the nucleus from the α-state to the β-state, and these frequencies can be measured.
- Magnetic resonance imaging (MRI) is a medical application of NMR spectroscopy.
- NMR spectra are generally plotted as frequency vs. absorption of energy. They are standardized by using chemical shift (δ), measured in parts per million (ppm) of spectrophotometer frequency.
- NMR spectra are calibrated using tetramethylsilane (TMS), which has a chemical shift of 0 ppm.
- Higher chemical shifts are located to the left (downfield); lower chemical shifts are located to the right (upfield).
- Proton (1H) NMR is the most common.
- Each unique group of protons has its own peak.
- The integration (area under the curve) of this peak is proportional to the number of protons contained under the peak.
- Deshielding of protons occurs when electron-withdrawing groups pull electron density away from the nucleus, allowing it to be more easily affected by the magnetic field. Deshielding moves a peak further downfield.
- When hydrogens are on adjacent atoms, they interfere with each other’s magnetic environment, causing spin–spin coupling (splitting). A proton’s (or group of protons’) peak is split into n + 1 subpeaks, where n is the number of protons that are three bonds away from the proton of interest.
- Splitting patterns include doublets, triplets, and multiplets.
- Protons on sp3-hybridized carbons are usually in the 0 to 3 ppm range (but higher if electron-withdrawing groups are present). Protons on sp2-hybridized carbons are usually in the 4.6 to 6.0 ppm range. Protons on sp-hybridized carbons are usually in the 2.0 to 3.0 ppm range.
- Aldehydic hydrogens tend to appear between 9 and 10 ppm.
- Carboxylic acid hydrogens tend to appear between 10.5 and 12 ppm.
- Aromatic hydrogens tend to appear between 6.0 and 8.5 ppm.
ANSWERS TO CONCEPT CHECKS
**11.1**
- IR spectroscopy measures absorption of infrared light by specific bonds that vibrate. These vibrations cause changes in the dipole moment of the molecule that can be measured. Once the bonds in a molecule are determined, one can infer the presence of a number of functional groups to determine the identity of the molecule.
- A carboxylic acid would have a broad O–H peak around 2800–3200 cm–1 and a sharp carbonyl peak at 1700–1750 cm–1.
**11.2**
- Conjugated systems and other molecules with π or nonbonding electrons can give absorbances on a UV spectroscopy plot. Therefore, propane would not be detectable, but propene and propanone would.
- HOMO is the highest occupied molecular orbital; LUMO is the lowest unoccupied molecular orbital. The smaller the difference in energy between the two, the longer the wavelengths that can be absorbed by the molecule.
**11.3**
- NMR measures alignment of the spin of a nucleus with an applied magnetic field. It is most often used for identifying the different types and magnetic environments of protons in a molecule, which allows us to infer the connectivity (backbone) of a molecule.
- The units for chemical shift on a standardized NMR spectrum are parts per million (ppm).
- Deshielding occurs in molecules that have electronegative atoms that pull electron density away from the hydrogens being measured. This results in a downfield (leftward) shift of the proton peak.
- Spin–spin coupling occurs when two protons close to one another have an effect on the other’s magnetic environment. This results in the splitting of peaks into doublets, triplets, or multiplets, depending on the environment.
SCIENCE MASTERY ASSESSMENT EXPLANATIONS
1. A
Infrared spectroscopy is most useful for distinguishing between different functional groups. Almost all organic compounds have C–H bonds, (B), so except for fingerprinting a compound, these absorptions are not useful. Little information about the optical properties of a compound, such as (C) and (D), can be obtained by IR spectroscopy.
2. C
Because molecular oxygen is homonuclear (composed of only one element) and diatomic, there is no net change in its dipole moment during vibration or rotation; in other words, the compound does not absorb in a measurable way in the infrared region. IR spectroscopy is based on the principle that, when the molecule vibrates or rotates, there is a change in dipole moment. (A) is incorrect because oxygen does have molecular motions; they are just not detectable in IR spectroscopy. (B) is incorrect because it is possible to record the IR of a gaseous molecule as long as it shows a change in its dipole moment when it vibrates. (D) is incorrect because lone pairs do not have an effect on the ability to generate an IR spectrum of a compound.
3. D
In this reaction, the functional group is changing from a hydroxyl to an aldehyde. This means that a sharp peak will appear around 1750 cm–1, which corresponds to the carbonyl functionality. (C) is the opposite of what occurs; the reaction will be characterized by the disappearance of the O–H peak at 3100 to 3500 cm–1, not its appearance. Comparing the fingerprint regions, as in (A), will provide evidence that a reaction is occurring, but it is not as useful for knowing that the reaction that occurred was indeed the one that was desired.
4. A
The peak at 9.5 ppm corresponds to an aldehydic proton. This signal lies downfield because the carbonyl oxygen is electron-withdrawing and deshields the proton. (C) corresponds to a carboxyl proton and is even further downfield because the acidic proton is deshielded to a greater degree than the aldehydic proton. (B) corresponds to aromatic protons. (D) is characteristic of an alkyl proton on an sp3-hybridized carbon.
5. C
This isotope has no magnetic moment and will therefore not exhibit resonance with an applied magnetic field. Nuclei with odd mass numbers (1H, 11B, 13C, 15N, 19F, and so on) or those with an even mass number but an odd atomic number (2H, 10B) will have a nonzero magnetic moment.
6. D
Spin–spin coupling (splitting) is due to influence on the magnetic environment of one proton by protons on the adjacent atom. These protons are three bonds away from each other. Splitting in other NMR spectra can include coupling with carbon atoms, but not in 1H–NMR.
7. C
Most conjugated alkenes have an intense ultraviolet absorption. Aldehydes, ketones, acids, and amines, mentioned in (A) and (D), all absorb in the ultraviolet range. However, other forms of spectroscopy (mainly IR and NMR) are more useful for precise identification. Isolated alkenes, (B), can rarely be identified by UV spectroscopy.
8. B
The region in question often gives information about the types of alkyl groups present. Specifically, ethanol will give a characteristic triplet for the methyl group (which is coupled to –CH2–) and a quartet for –CH2– (which is coupled to the methyl group). Isopropanol will have a septet for the –CH– group (which is coupled to both methyl groups combined) and a doublet for the two methyl groups (which are coupled to –CH–). In both cases, the proton in the alcohol does not participate in coupling. The alcohol hydrogen likely lies downfield for both compounds because it is bonded to such an electronegative element.
9. A
The HOMO is the highest occupied molecular orbital. Only after absorbing ultraviolet light is an electron is excited from the HOMO to the LUMO, the lowest unoccupied molecular orbital.
10. A
Carbonyl groups (C=O) in conjugation with double bonds tend to absorb at lower wavenumbers because the delocalization of π electrons causes the C=O bond to lose double-bond character, shifting the stretching frequency closer to C–O stretches. Remember that higher-order bonds tend to have higher absorption frequencies, so loss of double-bond character should decrease the absorption frequency of the group.
11. B
Wavenumber

is directly proportional to frequency

It is inversely proportional to wavelength, (A), and has no proportionality to percent transmittance or absorbance, (C) and (D).
12. A
Enantiomers will have identical IR spectra because they have the same functional groups and will therefore have the exact same absorption frequencies. Enantiomers have opposite specific rotations, but specific rotation actually has no effect on the IR spectrum.
13. A
The oxygen of the hydroxyl group will deshield the hydroxyl hydrogen, shifting it downfield, or leftward. Hydrogens in carboxylic acids can have some of the most downfield absorbances, around 10.5 to 12 ppm.
14. D
The coupling constant is a measure of the degree of splitting introduced by other atoms in a molecule, and is the frequency of the distance between subpeaks. It is measured in hertz, eliminating (B). The coupling constant is independent of the value of n + 1 and is not changed by calibration with tetramethylsilane, eliminating (A) and (B).
15. B
Amino acids in their fully protonated form contain all three of the peaks that should be memorized for Test Day: C–O, N–H, and O–H. While statements I and II correctly give the peaks for the C=O bond (sharp peak at 1750 cm–1) and the N–H bond (sharp peak at 3300 cm–1), the peak for the O–H bond is in the wrong place. In a carboxylic acid, the C=O bond withdraws electron density from the O–H bond, shifting the absorption frequency down to about 3000 cm–1. Statement III is therefore incorrect.
GO ONLINE
Consult your online resources for additional practice.
SHARED CONCEPTS
- General Chemistry Chapter 1
- Atomic Structure
- General Chemistry Chapter 3
- Bonding and Chemical Interactions
- Organic Chemistry Chapter 3
- Bonding
- Organic Chemistry Chapter 12
- Separations and Purifications
- Physics and Math Chapter 8
- Light and Optics
- Physics and Math Chapter 9
- Atomic and Nuclear Phenomena