Chapter 11: Reasoning about the Design and Execution of Research

Chapter 11: Reasoning about the Design and Execution of Research
Science Mastery Assessment
Every pre-med knows this feeling: there is so much content I have to know for the MCAT! How do I know what to do first or what’s important?
While the high-yield badges throughout this book will help you identify the most important topics, this Science Mastery Assessment is another tool in your MCAT prep arsenal. This quiz (which can also be taken in your online resources) and the guidance below will help ensure that you are spending the appropriate amount of time on this chapter based on your personal strengths and weaknesses. Don’t worry though— skipping something now does not mean you’ll never study it. Later on in your prep, as you complete full-length tests, you’ll uncover specific pieces of content that you need to review and can come back to these chapters as appropriate.
How to Use This Assessment
If you answer 0–7 questions correctly:
Spend about 1 hour to read this chapter in full and take limited notes throughout. Follow up by reviewing all quiz questions to ensure that you now understand how to solve each one.
If you answer 8–11 questions correctly:
Spend 20–40 minutes reviewing the quiz questions. Beginning with the questions you missed, read and take notes on the corresponding subchapters. For questions you answered correctly, ensure your thinking matches that of the explanation and you understand why each choice was correct or incorrect.
If you answer 12–15 questions correctly:
Spend less than 20 minutes reviewing all questions from the quiz. If you missed any, then include a quick read-through of the corresponding subchapters, or even just the relevant content within a subchapter, as part of your question review. For questions you got correct, ensure your thinking matches that of the explanation and review the Concept Summary at the end of the chapter.
- An experimenter is attempting to investigate the effect of a new antibiotic on E. coli. The experimenter plates cells and administers one milliliter of the antibiotic. Which of the following is an appropriate negative control in this experiment?
- A plate with no cells that was coated with one milliliter of antibiotic
- A plate with E. coli and no additional treatment
- A plate with E. coli and one milliliter of isotonic saline
- A plate of epithelial cells treated with one milliliter of antibiotic
- Which of the following would best establish a causal link?
- A cross-sectional study using survey data for hand-washing and colds
- A case–control study of an exposure during childhood and development of a certain disease later in life
- A randomized clinical controlled trial of a new antipyretic drug
- An IQ test where the results are later separated by gender
- An experimenter is attempting to determine the internal energy of a well-known compound. The experimenter cleans the glassware, completes the synthesis, calibrates a bomb calorimeter, and then uses it to measure the appropriate thermodynamic values. One error here is that the experimenter:
- did not determine if the compound was novel or if the information has already been determined.
- did not have a specific goal at the beginning of the research.
- should not be involved in both the synthesis of the compound and later testing.
- should have calibrated the calorimeter before the synthesis of the compound.
- A researcher wishes to generate a parameter for the mean weight of residents of the United States. Which of the following is the most significant concern?
- Measuring a person’s weight may have psychological consequences and is unethical.
- Gathering all of the necessary study participants would be prohibitive.
- Knowing the average weight of US residents does not provide any useful information.
- Enough studies have already been conducted on this topic to render it unnecessary.
- A cross-sectional study in which current smoking status and cancer history are assessed simultaneously cannot satisfy which of Hill’s criteria?
- Strength
- Coherence
- Plausibility
- Temporality
- After randomization, it is discovered that one group in a study has almost twice as many women as the other. Which of the following is an appropriate response?
- Move men and women between groups manually so that they have the same gender profile.
- Check the randomization algorithm; if it is fair, continue with the research.
- Eliminate all of these subjects because of potential bias and randomize a new cohort.
- Keep the current cohort and continue randomizing subjects until the gender profiles are equal.
- An experimenter is attempting to determine the effects of smoking on very low birth weight (VLBW) and of VLBW on IQ. Which of the following statements is correct?
- Smoking is an independent variable.
- Smoking is a dependent variable.
- VLBW is an independent variable.
- VLBW is a dependent variable.
- I only
- II and IV only
- I, III, and IV only
- II, III, and IV only
- A study is performed on a new medication. Subjects in the experimental group are told about the potential side effects of the medication, while subjects in the placebo group are not. The subjects have no contact with each other and do not know in which group they are placed. The side effects end up being significantly more severe in the treatment group, when seen by the same assessor physician. This is most likely caused by which of the following?
- Physician unblinding only
- Patient unblinding only
- Both physician and patient unblinding
- Both physician and patient blinding
- As part of a graduate program entrance exam, a student must submit a grant proposal for a scientific investigation. While the student’s hypothesis is well formulated and the student has some preliminary data, the student’s proposal is rejected, with the committee reviewing the proposal citing several articles that support the hypothesis. What mistake did the student make in drafting the proposal?
- The student did not formulate a testable hypothesis.
- The student did not spend sufficient time reviewing existing studies.
- The proposed study did not adequately test the hypothesis.
- The student did not have enough preliminary data.
- A new study of a weight loss drug uses a radio advertisement to generate study participation. What type of error is most likely to result?
- Hawthorne effect
- Selection bias
- Confounding
- Detection bias
- A researcher designing a study has paid for it to be professionally translated into several languages. The researcher discusses the potential risks and benefits with each participant and allows them to bring documentation home for review before committing to the study. This researcher has put special focus on:
- justice by explaining potential risks.
- beneficence by describing the potential benefits of the study.
- respect for persons by acknowledging the subject’s perspective and rights.
- selection bias, by making the recruitment documents inclusive.
- Which of the following methods would be most appropriate for an initial assessment of hemoglobin saturation during an experiment about breath holding?
- A pulse oximeter, which uses a small light on an adhesive bandage
- An arterial cannula, which permits repeated blood draws with a single puncture
- Repeated venipuncture, because a single puncture would cause data overlap
- A Swan–Ganz catheter inserted through the femoral artery, which can measure saturation nearest the heart
- A medical student attempting to impress an attending physician refers to a recent article that says that there is a statistically significant difference in pregnancy length with a new therapy. Which of the following is most likely to be a valid criticism of the article?
- Medical students usually reference articles in the newest journals, which may be unreliable.
- The effect didn’t change patient outcomes, only a secondary measure.
- There is a lack of internal validity in the results, despite significance.
- Selection bias is inherent in the scientific process.
- Which sample would be the most appropriate participants for a study on hormone replacement therapy for postmenopausal symptoms?
- Prepubescent girls
- Premenopausal adult women
- Pregnant women
- Postmenopausal women
- Use of a colorimetric assay to determine protein concentration may be subject to all of the following EXCEPT:
- the use of standards.
- measurement error.
- the Hawthorne effect.
- systematic error.
Answer Key
- C
- C
- A
- B
- D
- B
- C
- A
- B
- B
- C
- A
- B
- D
- C
Chapter 11: Reasoning about the Design and Execution of Research
CHAPTER 11
REASONING ABOUT THE DESIGN AND EXECUTION OF RESEARCH
In This Chapter
11.1 The Scientific Method
The FINER Method
11.2 Basic Science Research
Controls
Causality
Error Sources
11.3 Human Subjects Research
Experimental Approach
Observational Approach
Error Sources
11.4 Ethics
Respect for Persons
Justice
Beneficence
11.5 Research in the Real World
Populations vs. Samples
Generalizability
Support for Interventions
Concept Summary
MCAT EXPERTISE
As with the previous chapter, this chapter does not contain any content that falls directly within an AAMC content category. That said, the AAMC has confirmed that a full 10% of the science questions on every MCAT will touch on material in this chapter – and many of those questions will require only information from this chapter, without any other supportive science content. That makes it, point for point, one of the most important chapters in the entire MCAT Review series!
Introduction
In the modern world, there are standard places to search for the answers to questions we have: encyclopedias, academic journals, online databases, and other publications. By perusing current research on a topic, we can figure out whether someone else has already asked and answered our question. This is just as true for scientists and other professionals. In many cases, our searches may take us in different directions. This may be as simple as finding additional resources that confirm the answers to our questions; however, research is often more complicated than that. We may find conflicting answers and have to perform critical analysis to determine which data set (and conclusion) was obtained in the most legitimate, unbiased way. Other times, we’ll have to find the answers on our own through experiment or observation and data analysis.
In order to generate a consistent body of knowledge, the ways in which scientists generate and search for information must be orderly and uniform. In this chapter, we will discuss the premise of basic science, biomedical, and social sciences research. Our examination will include the necessary criteria for causality, different types of error, and the ethical implications of human subjects research. These research methods are core skills that the MCAT tests—in fact, they constitute one of the four Scientific Inquiry and Reasoning Skills on the exam. In addition, their importance will last for the rest of your medical career. As a physician, you will constantly be seeking answers in research to determine prognoses, assess the appropriateness of a treatment modality for a given patient, and answer patients’ questions. You may be a researcher yourself in a basic science, clinical, or translational setting. Regardless of your path, evaluating research is critical to the progress of all fields of medicine and will be a key component of your life as a physician.
11.1 The Scientific Method
LEARNING OBJECTIVES
After Chapter 11.1, you will be able to:
- Determine the relative value of a research question by applying the FINER method
- Identify the stages of the scientific method, and evaluate whether they have been appropriately completed
- Evaluate the quality and testability of a hypothesis
The basic paradigm for all scientific inquiry is the scientific method. The scientific method is a set of steps that defines the appropriate order of events to structure and carry out an experiment. As such, the scientific method is the established protocol for transitioning from a question to a new body of knowledge. The steps in the scientific method are:
- Generate a testable question: This usually occurs after observing something anomalous in another scientific inquiry or in daily life.
- Gather data and resources:**** Think back to our introduction; this is the phase of journal and database searches and compiling information. At this step, we as scientists must be careful to look for all information, not just that consistent with our expectations.
- Form a hypothesis: A hypothesis is the proposed explanation or proposed answer to our testable question. It is often in the form of an if–then statement, which will be tested in subsequent steps.
- Collect new data: This step results from either experimentation, which involves manipulating and controlling variables of interest; or observation, which often involves no changes in the subject’s environment.
- Analyze the data: Look for trends and perform mathematical manipulations to solidify the connections between variables.
- Interpret the data and existing hypothesis: Consider whether the data analysis is consistent with the original hypothesis. If the data is inconsistent, consider alternative hypotheses.
- Publish: Publication provides an opportunity for peer review; a summary of what was done during all six prior steps should be included in the publication.
- Verify results: Most experiments are repeated to verify the results under new conditions.
BRIDGE
It is easy to focus on research that agrees with our expectations or opinions, and to ignore research that goes against them. This is an example of confirmation bias at work. Specific types of biases are discussed in Chapter 4 of MCAT Behavioral Sciences Review and later in this chapter.
MCAT EXPERTISE
The MCAT will most often test experimental or logical errors during research. Pay particular attention to the scientific method now in order to recognize each area in which an error may occur.
Formulating a testable question often presents students with a challenge because we tend to overreach, creating all-encompassing broad questions; however, in order to form a good testable question, it must be restricted to a relatively narrow area. The same is true of our hypotheses. One might wonder, Why do hot objects cause injury? This is not a testable question. In fact, most questions that begin with Why are too broad to be testable through a single experiment. In this case, a better, more testable question could be How do epithelial cells respond to heat in vivo? Even this question is likely too broad for a single experiment, but it is testable, and we can form related hypotheses. One possible hypothesis would be: if heat is applied to in vivo epithelial cells, then those cells will lyse. Pay attention to the format of the hypothesis, as the if–then format ensures that it is testable. We will examine other components of the scientific method as they pertain to basic science research, biochemical and biomedical research, and social science research in the relevant sections.
The FINER Method
The FINER method for evaluating a research question is a method to determine whether the answer to one’s question will add to the body of scientific knowledge in a practical way and within a reasonable time period. The FINER method asks five questions to make this determination.
- Is the necessary research study going to be feasible? A question about the response of chemosynthetic bacteria to a particular antibiotic requires access to chemosynthetic bacteria (which are often associated with harsh and difficult environments to access). If the scientist cannot obtain the necessary supplies, then the research is not feasible. Financial or time constraints, or the inability to gather enough subjects are also feasibility concerns.
- Do other scientists find this question interesting? This is somewhat subjective, but if there is little interest in the outcome of a particular research question, then the research will have little utility.
- Is this particular question novel? If someone has asked this question before, and answered it to the satisfaction of a peer-reviewed journal, then it’s now in the confirmatory stages of the scientific method. Barring any anomalies, asking this question again isn’t likely to gain new knowledge.
- Would the study obey ethical principles? Just because we are capable of carrying out a research study does not mean it is ethically or morally acceptable. If there’s an ethical or moral reason not to perform a study, this should dissuade researchers from carrying out the study just as much as an inability to secure funding.
- Is the question relevant outside the scientific community? The more people that the research will impact in everyday life, the more important it usually is. There are exceptions, of course—many people might agree that curing a rare fatal illness is more important than improving the odor of a popular perfume, although a much larger group may be impacted by the latter study.
MCAT CONCEPT CHECK 11.1
Before you move on, assess your understanding of the material with these questions.
- Rank the following research questions from 1 (best) to 3 (worst) using the FINER method and explain your rationale:
- How long does it take for the Earth to complete one revolution around the Sun?
- How do medical errors relate to sleep deprivation of medical residents?
- What is the average lifespan of bacteria in Martian rocks?
- _________________________________
_________________________________
- _________________________________
_________________________________
- _________________________________
_________________________________
- Errors or biases during publication of results are most likely to affect which stages of the scientific method?
_________________________________
_________________________________
_________________________________
- True or False: Most people with hepatitis C acquired it through IV drug use is an example of a well-formatted hypothesis.
11.2 Basic Science Research
LEARNING OBJECTIVES
After Chapter 11.2, you will be able to:
- Identify common types and sources of error
- Recognize independent and dependent variables and how they are typically displayed graphically
- Explain the importance of the different types of control, including positive and negative controls
- Distinguish between accuracy and precision:
Basic science research—the kind conducted in a laboratory, and not on people—is generally the easiest to design because the experimenter has the most control. Often a causal relationship is being examined because the hypothesis generally states a condition and an outcome. In order to make generalizations about our experiments, we must make sure that the outcome of interest would not have occurred without our intervention, and therefore, we use controls. We must also demonstrate causality, which is relatively simple in basic science research, but less so in other research areas.
Controls
In basic science research, conditions can be applied to multiple trials of the same experiment that are as near to identical as possible. In this way, a control or standard acts as a method of verifying results. Consider the following experiment: a scientist has an unknown concentration of a basic ammonia solution and wishes to determine the concentration experimentally. The scientist takes a standardized solution of hydrochloric acid (made by comparison to a potassium hydrogen phthalate [KHP] standard) and titrates the basic solution in the presence of the same calibrated pH meter used for the hydrochloric acid standardization. The scientist then determines the ammonia concentration from the results of the titration. Because the concentration of the acid used to determine the ammonia concentration was verified against a standard, the scientist can be confident that the calculated ammonia concentration is accurate.
REAL WORLD
The use of controls also allows investigators to check for contamination of reagents.
Controls can also be separate experimental conditions altogether. For example, when testing the reaction of a tissue culture to an antibiotic, a separate culture is generally grown and administered an equal quantity of a compound known to be inert, like water or saline. The control corrects for any impact that the simple addition of volume might have had on the experiment. Some experiments have both positive and negative controls for points of comparison or a group of controls that can be used to create a curve of known values. Positive controls are those that ensure a change in the dependent variable when it is expected. In the development of a new assay for detection of HIV, for example, administering the test to a group of blood samples known to contain HIV could constitute a positive control. Negative controls, in contrast, ensure no change in the dependent variable when no change is expected. With the same assay, administering the test to a group of samples known not to contain the HIV virus could constitute a negative control. In drug trials, a negative control group is often used to assess for the placebo effect—an observed or reported change when an individual is given a sugar pill or sham intervention.
Example: A clinical trial is devised to quantify the effectiveness of a retinal scanning system for the detection of Alzheimer’s disease. The trial will include a positive control group, a negative control group, and an experimental group. The experimental group is a large sample of individuals who are 70 years old and showing symptoms of Alzheimer’s disease. Assuming the retinal scanning system is effective at detecting Alzheimer’s disease, rank the groups in decreasing order of percentage of expected disease detection.
Solution: Members of the positive control group should consist of patients who have previously been diagnosed with Alzheimer’s disease, whereas members of the negative control group should consist of patients who have previously tested negative for Alzheimer’s disease. Therefore, the positive control group and negative control groups should establish the upper and lower bounds of percent detection, respectively. The experimental group is likely to fall between those two extremes. The predicted order is: positive, experimental, and negative.
Causality
The other big advantage to being able to manipulate all of the relevant experimental conditions is that basic science researchers can often establish causality. Causality is an if–then relationship, and is often the hypothesis being tested. In basic science research, we manipulate an independent variable, and measure or observe a dependent variable. When there is a theoretical or known mechanism that links the independent and dependent variables, a causal relationship can be investigated. If the change in the independent variable always precedes the change in the dependent variable, and the change in the dependent variable does not occur in the absence of the experimental intervention, the relationship is said to be causal.
Example: A test was conducted to determine if water consumption impacts systolic blood pressure in mice. The water consumption and systolic blood pressure of eight mice was tracked for three weeks. The average daily water consumption and the average systolic blood pressure of each mouse is listed in the following table.
Mouse Average Daily Water Consumption (mL) Average Systolic Blood Pressure (mmHg)
1 3.9 122
2 3.3 128
3 1.5 146
4 4.7 117
5 6.1 108
6 0.8 153
7 10.3 103
8 8.6 105
The researchers plotted pressure and consumption and obtained the following graph. Identify the independent and dependent variables, and determine if a causal relationship exists between the two.
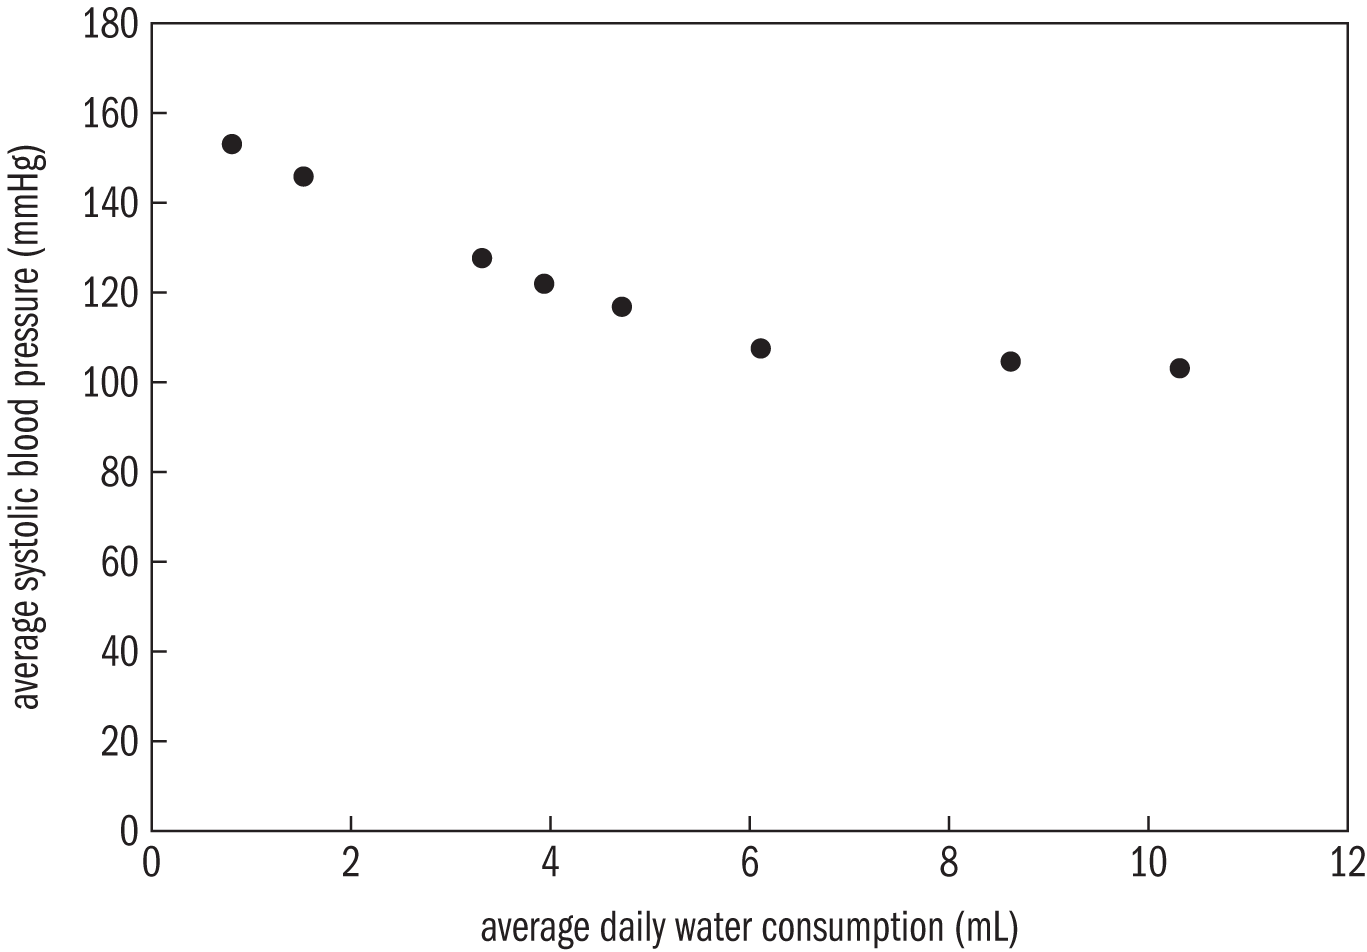
Solution: The independent variable is the “average daily water consumption (mL)” and the dependent variable is the “average systolic blood pressure (mmHg).”
Not enough data is given to determine if a causal relationship exists. More information is needed to determine if the differences in systolic blood pressure occur due to differences in water consumption. It’s possible that the mice could have the given systolic blood pressure values even when consuming equal amounts of water.
KEY CONCEPT
The independent variable is the one that the experimenter is manipulating, and the dependent or outcome variable is the one that is being observed. On a graph the independent variable belongs on the x-axis and the dependent variable belongs on the y-axis.
Error Sources
In basic science research, experimental bias is usually minimal. The most likely way for an experimenter’s personal opinions to be incorporated is through the generation of a faulty hypothesis from incomplete early data and resource collection. However, there can be manipulation of the results by eliminating trials without appropriate background, or by failing to publish works that contradict the experimenter’s own hypothesis.
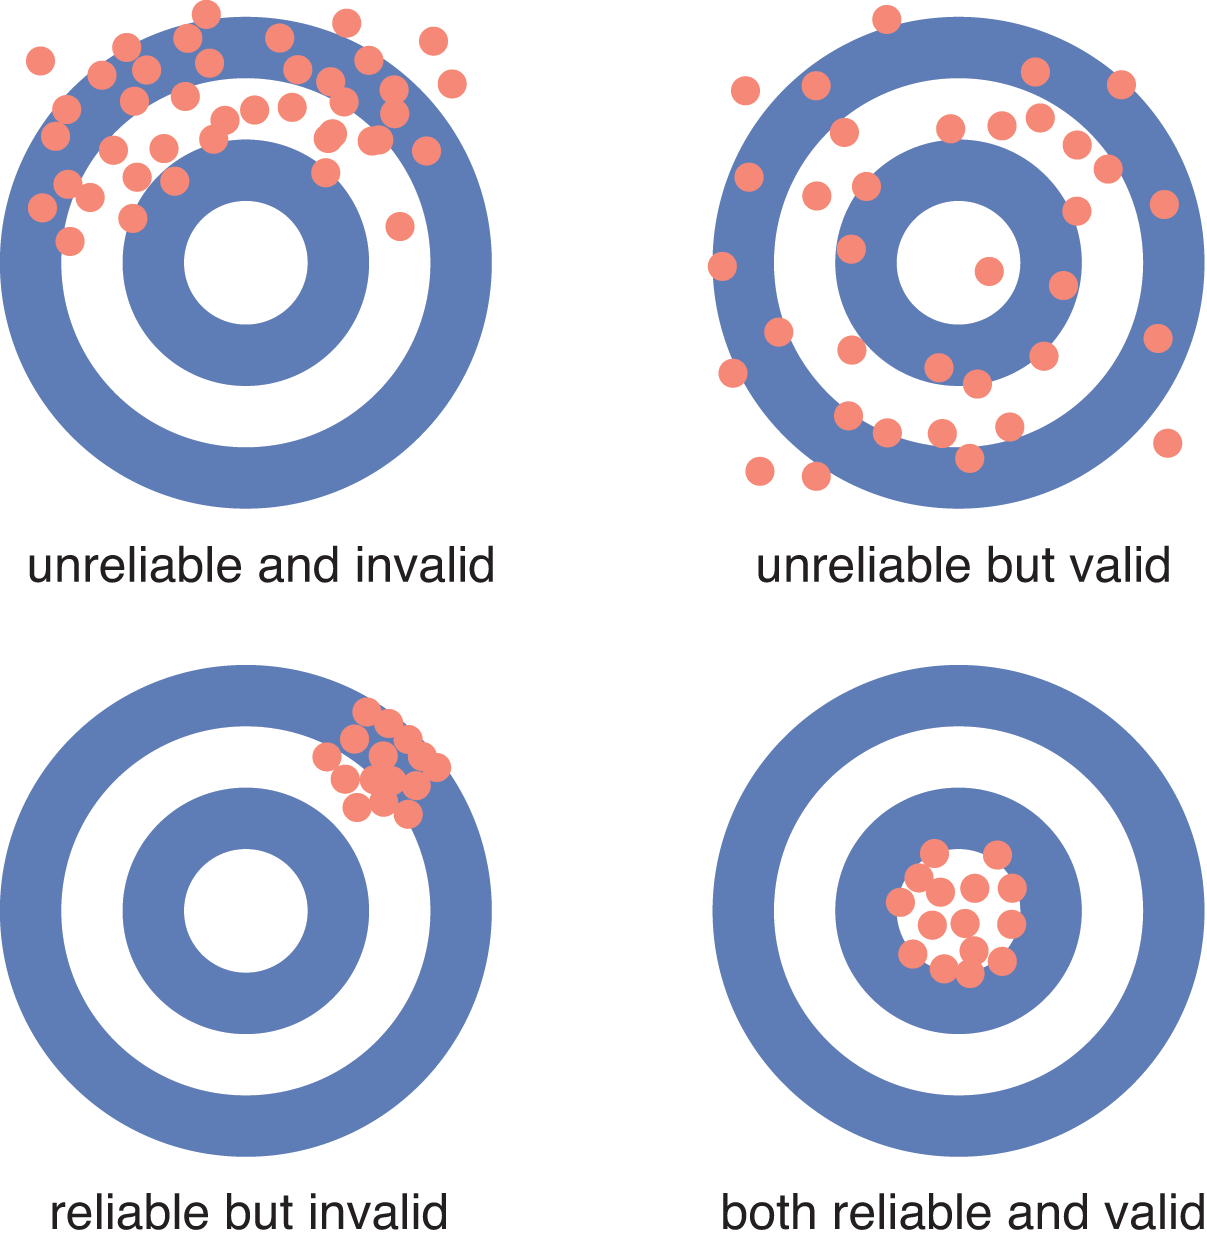
The low levels of bias introduced by the experimenter do not eliminate all error from basic science research. Measurements are especially important in the laboratory sciences, and the instruments may give faulty readings. Instrument error may affect accuracy, precision, or both. Accuracy, also called validity, is the ability of an instrument to measure a true value. For example, an accurate scale should register a 170-pound person’s weight as 170 pounds. Precision, also called reliability, is the ability of the instrument to read consistently, or within a narrow range. The same person standing on a scale that is accurate but imprecise may get readings between 150 and 190 pounds. The same person standing on a scale that is inaccurate but precise may get readings between 129 and 131 pounds, a relatively narrow range. Accuracy and precision are represented in Figure 11.1. Because bias is a systematic error in data, only an inaccurate tool will introduce bias, but an imprecise tool will still introduce error. Random chance can also introduce error into an experiment; while random error is difficult to avoid, it is usually overcome by using a large sample size.
Figure 11.1 Accuracy (Validity) and Precision (Reliability) of Measurements
MCAT CONCEPT CHECK 11.2
Before you move on, assess your understanding of the material with these questions.
- An experiment with an improperly tared (zeroed) mass balance would suffer from what type of error?
_________________________________
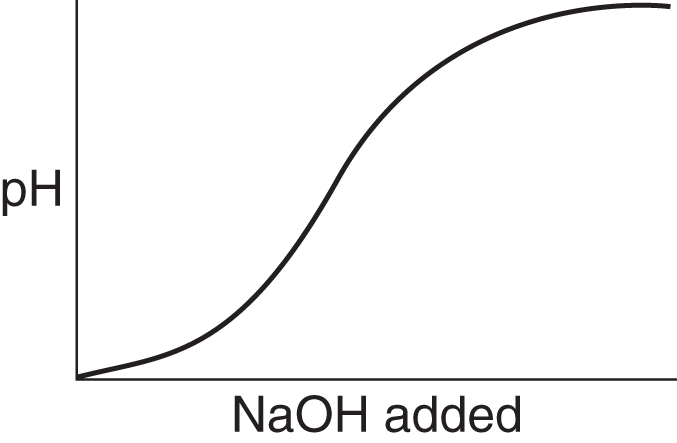
- Label the axes and provide representative data for the following situation: An experimenter adds sodium hydroxide to an experimental solution and records the pH. The experimenter finds that the relationship is sigmoidal and that the pH is rising.

- What is the purpose of a control during experiments? What characteristic of experimental research would be reduced in the absence of a control?
_________________________________
11.3 Human Subjects Research
LEARNING OBJECTIVES
After Chapter 11.3, you will be able to:
- Apply Hill’s criteria to an experiment to determine the likelihood of a causal relationship
- Distinguish between observational and experimental research
- Compare and contrast bias and confounding
In some cases of biomedical or clinical research, we must move away from petri dishes full of cells or experimental animal models that can have all aspects of their living conditions controlled to research on human subjects. For ethical reasons, which we will discuss later, the level of experimental control is invariably lower than basic science research, and the relationships established by such research will therefore be weaker. In human subjects research, there are both experimental and observational studies.
Variable Types
In data analysis, it is important to consider the variable types used in the study. Binary variables only have two options, such as “yes” or “no.” Continuous variables can take on any value between a certain range, such as amount of weight lost, height, or percent improvement in cardiac output. In contrast, categorical variables take on a fixed amount of outcomes. For example, if a study conducted in the Unites States separates participants by the state they live in, there are only 50 possibilities rather than an infinite range.
Data can also be categorized as either quantitative data or qualitative data. Quantitative data describes data that is in the form of numbers, including percentages or statistics. In contrast, qualitative data describes data that is non-numeric. A study that looks at the percentage of people who own a house in Canada would be an example of a quantitative study, as it numerically characterizes the percentage of people who own a house. A follow-up study that asks house-owners to explain how they feel about owning a house would be an example of a qualitative study. In a mixed-method study, research generates both numerical and non-numerical data. If the follow-up study also calculated how many house-owners felt negatively about owning a house, it would have both quantitative data (percentage of house-owners with negative thoughts) and non-numerical qualitative data (the data on the feelings of each participant about owning a house).
Experimental Approach
In biomedical research, it is possible to perform experiments in which an independent variable is manipulated and an outcome is observed. In these experiments, we are still attempting to elicit a causal relationship. Because subjects are in less-controlled conditions, the data analysis phase is more complicated than in laboratory studies. In clinical and social sciences research, it is often still possible to conduct experiments by manipulating the environment or circumstances of the subject.
Randomization
Randomization is the method used to control for differences between subject groups in biomedical research. Randomization uses an algorithm to determine the placement of each subject into either a control group that receives no treatment or a sham treatment, or one or more treatment groups. A proper randomization algorithm will be equivalent to a coin toss or die roll. Once each individual is assigned to a group, the intervention is performed and the results are measured. Ideally, each group is perfectly matched on conditions such as age and gender; however, as long as there is an appropriate randomization algorithm, the collected data may be analyzed without concern.
Blinding
Because many of the measures in biomedical research are subjective, the perception of the subject and the investigator may be biased by knowing which group the subject is in. To remove this bias, the subjects and/or investigators may be blinded, which means they do not have information about which group the subject is in. In single-blind experiments, only the patient or the assessor (the person who makes measurements on the patient or performs subjective evaluations) is blinded. In double-blind experiments, the investigator, subject, and assessor all do not know the subject’s group. Without blinding, the placebo effect would be greatly reduced in the control group, but still be present in the treatment group.
REAL WORLD
Blinding isn’t only useful in drug trials; even sham treatments of acupuncture have been used to blind subjects in randomized controlled trials focusing on the use of acupuncture for musculoskeletal pain.
Data Analysis
In biomedical research, data analysis must account for both the variables used in the study and variables outside of those used. Some influencing factors can be inferred from the initial literature review, although other unexpected variables, such as confounding variables (discussed later on in this section), may exist and may need consideration during data analysis. Other important considerations during data analysis include differentiating between a main effect, as opposed to an interaction effect. A main effect describes how a single independent variable individually affects the dependent variable. An interaction effect, on the other hand, defines how one independent variable affects the relationship between a different independent variable and the dependent variable. For example, assume a study looked at how well students of different grade levels did on exams on different days of the week. If it was shown that within each grade level, students did best on Mondays and worst on Fridays, the main effect of the variable “day of the week” on test scores would be a decreased performance from Monday to Friday. However, if higher grade levels showed a significantly smaller drop in test scores during the week than students from younger grades, it means test scores are not only influenced by the day of the week, but also by grade level.
There are different methods of data analysis, with most outside of the scope of the MCAT, though methods such as the creation of a regression model can be used to look at the relationship between the studied variables. This analysis may demonstrate linear, parabolic, exponential, logarithmic, or other relationships, as is discussed further in Chapter 12 of MCAT Physics and Math Review.
Observational Approach
We may wish to study certain causal associations for which an experiment cannot be performed for ethical or practical reasons. In such a case, we must draw on the available data and analyze it. Observational studies in medicine fit into one of three categories: cohort studies, cross-sectional studies, and case–control studies. These studies often look for the connections between exposures and outcomes. Observational studies do not demonstrate causality, although the tendency toward causality may be demonstrated by Hill’s criteria, which we will examine later.
REAL WORLD
Ethnographic studies are observational studies utilized by sociologists. These studies attempt to understand cultures by looking at the complete social environment.
Cohort studies are those in which subjects are sorted into groups based on differences in risk factors (exposures), and then assessed at various intervals to determine how many subjects in each group had a certain outcome. For example, a study in which 100 smokers and 100 nonsmokers are followed for 20 years while counting the number of subjects who develop lung cancer in each group would be an example of a cohort study.
KEY CONCEPT
A longitudinal study is an observational research method that follows the same subjects over time. Therefore, a cohort study is a form of longitudinal study.
Cross-sectional studies attempt to categorize patients into different groups at a single point in time. For example, a study to determine the prevalence of lung cancer in smokers and nonsmokers at a given point in time would be an example of a cross-sectional study.
Case-control studies start by identifying the number of subjects with or without a particular outcome, and then look backwards to assess how many subjects in each group had exposure to a particular risk factor. For example, a study in which 100 patients with lung cancer and 100 patients without lung cancer are assessed for their smoking history would be an example of a case–control study.
Other Types of Studies
Surveys are studies that give predetermined questions to participants to answer, which are then used for statistical analysis to draw conclusions. For example, a restaurant may send their diners a survey of 10 questions on how they would rate their food on a scale of 1 to 10 compared to the food from a competing restaurant. From the compiled ratings, the restaurant would be able to tell if the diners preferred their food or their competitor’s food. Note that, in real life, surveys can contain either qualitative or quantitative data; however, the MCAT tends to consider surveys to be quantitative.
Content analysis is a type of study that looks at documents and communication artifacts to find themes and patterns in communication. For example, a historian may read numerous ancient documents on a historical figure to analyze the use of positive and negative adjectives in an effort to determine how that historical figure was generally viewed by others.
In-depth interviews, as the name implies, is a qualitative method of obtaining detailed information from individuals using open-ended questions through individual interviews. These interviews are done with participants one-on-one.
Focus groups are another method of qualitative data gathering, where groups of people are assembled to participate in a guided discussion of a topic. Participants are asked to share their thoughts, experiences, and perceptions, and are also encouraged to engage with one another. An example includes a marketing department of a company bringing together twenty potential customers to gain detailed feedback on a proposal the company has for a new product.
Hill’s Criteria
Hill’s criteria describe the components of an observed relationship that increase the likelihood of causality in the relationship. While only the first criterion is necessary for the relationship to be causal, it is not sufficient. The more criteria that are satisfied by a relationship, the likelier it is that the relationship is causal. Hill’s criteria do not provide an absolute guideline on whether a relationship is causal; thus, for any observational study, the relationship should be described as a correlation.
- Temporality: The exposure (independent variable) must occur before the outcome (dependent variable).
- Strength: As more variability in the outcome variable is explained by variability in the study variable, the relationship is more likely to be causal.
- Dose–response relationship: As the study or independent variable increases, there is a proportional increase in the response. The more consistent this relationship, the more likely it is to be causal.
- Consistency: The relationship is found to be similar in multiple settings.
- Plausibility: There is a reasonable mechanism for the independent variable to impact the dependent variable supported by existing literature.
- Consideration of alternative explanations: If all other plausible explanations have been eliminated, the remaining explanation is more likely.
- Experiment: If an experiment can be performed, a causal relationship can be determined conclusively.
- Specificity: The change in the outcome variable is only produced by an associated change in the independent variable.
- Coherence: The new data and hypothesis are consistent with the current state of scientific knowledge.
Error Sources
In addition to the measurement error found in basic science research, we must be aware of bias and error introduced by using human subjects as part of an experimental or observational model. As mentioned earlier, bias is a systematic error. As such, it generally does not impact the precision of the data, but rather skews the data in one direction or another. Bias is a result of flaws in the data collection phase of an experimental or observational study. Confounding is an error during analysis.
Selection Bias
The most prevalent type of bias is selection bias, in which the subjects used for the study are not representative of the target population. People who volunteer for a study in a particular area may be significantly different from people who do not volunteer. For example, someone volunteering for a drug trial that requires clinical visits may be healthier or more likely to benefit from the study than someone who does not volunteer because they cannot make it to the hospital.
Selection bias may also apply in cases where one gender is more prevalent in a study than another, or where there are differences in the age profile of the experiment group and the population. Measurement and assessment of selection bias occurs before any intervention.
Detection Bias
Detection bias results from educated professionals using their knowledge in an inconsistent way. Because prior studies have indicated that there is a correlation between two variables, finding one of them increases the likelihood that the researcher will search for the second. For example, high blood pressure (hypertension) and diabetes mellitus are more common among individuals who are obese; thus, a physician may screen patients who are obese for hypertension and diabetes at a higher rate than other patients, inflating the true value of the secondary measurement (although, as described in Chapter 12 of MCAT Behavioral Sciences Review, other biases against individuals who are obese actually tend to lead to lower rates of screening and preventative care).
Response Biases
The tendency for participants to inaccurately respond to questions in research is called a response bias. This type of bias can impact the validity of certain types of studies that depend on self-reporting from participants, such as surveys. The phenomenon of reactivity, which is a general term that describes how people change their behavior when they know they are being watched, offers one explanation of how response bias can be introduced: The Hawthorne effect, or observation bias, is a specific type of reactivity that posits that the behavior of study participants is altered simply because they recognize that they are being studied. For example, patients in a study for a given weight loss drug may begin exercising more frequently or may make healthier diet choices, thus artificially increasing the perceived effect of the drug. Because the change in data is systematic and occurs before data analysis, this is an example of bias. Another type of response bias includes social desirability bias, where participants answer questions in a way that makes them seem more socially fitting. For example, in a survey that asks MCAT students how many hours a week they spend studying, participants may respond with a higher than accurate number in order to make themselves seem like better students. One other type of response bias worth knowing is called demand characteristics, which occurs when participants change their behavior or responses in a study in order to match what they think is expected of them from the experimenter. While similar to the idea of social desirability bias, the key difference is social desirability bias is geared towards fitting into social norms, while demand characteristics is about a participant trying to behave in a way they think the experimenter wants them to behave.
Confounding, Mediating, and Moderating Variables
Confounding, sometimes inaccurately called confounding bias or omitted variable bias, is a data analysis error. Confounding variables, or confounders, are unmeasured and not-controlled-for variables that affect both the independent and dependent variables in a study, leading to a “confounding” or mischaracterization of the true association between them. These “third-party” variables are illustrated schematically in Figure 11.2. For example, say a researcher looks at the frequency of cancer in coffee drinkers. Noticing that coffee drinkers have higher rates of cancer, the researcher may erroneously assume coffee causes cancer. However, the researcher did not take into account other potentially confounding variables such as smoking. If coffee drinkers are more likely to smoke than non-coffee drinkers, and smoking increases the likelihood of cancer, this means that the smoking, not the coffee, is the actual cause of increased cancer rates in coffee drinkers
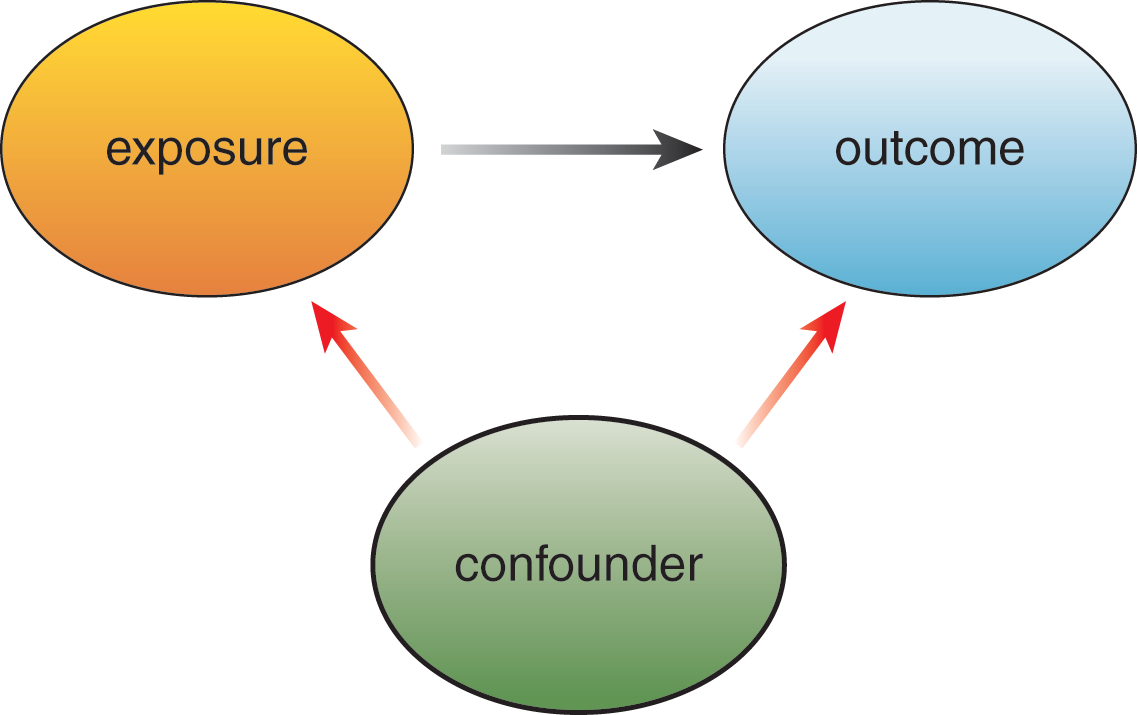
Figure 11.2. Confounding
Confounding variables should not be mistaken for mediating variables. Unlike confounding variables, mediating variables sit “in-between” two variables and provide a mechanism to explain an association. For example, if one were to find a positive correlation between level of education and life satisfaction, a mediating variable might be income, where a higher level of income leads to better access to healthcare, which in turn leads to an increase in satisfaction. Another type of variable to be aware of is a moderating variable, which is a variable that changes the strength of the association between the independent and dependent variables. For example, imagine a study was conducted looking at a new medication in patients with heart disease, and the medication was not shown to have a benefit. However, when the patients were separated by biological sex, the medication significantly improved heart health in female patients, but not male patients. In this scenario, biological sex would be considered a moderating variable since the association between taking the medication and heart health in patients with heart disease is dependent on whether someone was a biological male or female. Moderating variables are closely tied to the idea of interaction effects, though the term moderating variable refers to the variable itself, while the effect of the moderating variable is characterized as an interaction. In contrast to confounding, moderating, and mediating variables, control variables are variables that are purposely held constant throughout an experiment to ensure the effects of the variables of interest are not influenced by fluctuations in the control variables.
MCAT CONCEPT CHECK 11.3
Before you move on, assess your understanding of the material with these questions.
- True or False: A researcher who fails to demonstrate temporality can still provide evidence for a causal relationship by satisfying the rest of Hill’s criteria.
- How does observational research differ from experimental research?
- Observational research:
_________________________________
- Experimental research:
_________________________________
- What is the difference between bias and confounding?
- Bias:
_________________________________
- Confounding:
_________________________________
11.4 Ethics
LEARNING OBJECTIVES
After Chapter 11.4, you will be able to:
- Distinguish between autonomy (medical ethics) and respect for persons (research ethics)
- Predict the ethical issues regarding respect for persons, justice, beneficence, and nonmaleficence within a study
- Distinguish between monetary compensation and coercive influence for a research study
- Recall the populations that must receive special consideration for coercion
In medicine, there are four core ethical tenets: beneficence, or the obligation to act in the patient’s best interest; nonmaleficence, or the obligation to avoid treatments or interventions in which the potential for harm outweighs the potential for benefit; respect for patient autonomy, or the responsibility to respect patients’ decisions and choices about their own healthcare; and justice, or the responsibility to treat similar patients with similar care, and to distribute healthcare resources fairly.
BRIDGE
The key ethical tenets of medicine are also discussed in Chapter 11 of MCAT Behavioral Sciences Review in conjunction with an analysis of major institutions in the United States.
In research, these four principles are replaced by a slightly modified set. The Belmont Report, a landmark document published by the National Commission for the Protection of Human Subjects of Biomedical and Behavioral Research in 1979, delineates the three necessary pillars of research ethics: respect for persons, justice, and a slightly more inclusive version of beneficence.
Respect for Persons
Respect for persons includes the need for honesty between the subject and the researcher, and generally—but not always—prohibits deception. Respect for persons also includes the process of informed consent, in which a patient must be adequately counseled on the procedures, risks and benefits, and goals of a study to make a knowledgeable decision about whether or not to participate in the study. Further, the investigator cannot exert a coercive influence over the subjects, or they will not be acting autonomously. This coercive influence may be the result of a natural power imbalance, such as that between a teacher and a student, or may be the result of an extreme financial incentive or the inability to otherwise receive treatment for a condition. Respect for persons also includes the need to respect the subjects’ wishes to continue with or cease participation in a study. The subject may withdraw consent that was previously granted at any time.
Many older studies did not abide by respect for persons. For example, sentinel studies on the severity of untreated syphilis were conducted without the participants’ knowledge or consent. Many early psychological and sociological studies involved significant deception, which was not always disclosed after the fact. In current practice, hospital or university institutional review boards have put into place systematic protections against unethical studies. Vulnerable persons, which include children, pregnant individuals, and prisoners, require special protections above and beyond those taken with the general population. Confidentiality is also generally considered as part of respect for persons during research.
REAL WORLD
The Tuskegee syphilis experiment was a notorious forty-year study (1932–1972) by the United States Public Health Service that was fraught with extreme violations of the ethical principle of respect for persons. In this study, African American men living in conditions of poverty were enrolled into a study on the natural progression of syphilis. These men were given sham treatments, barred from accessing appropriate healthcare, and repeatedly deceived by investigators—including the fact that they were never told they had syphilis! This study was so significant in bioethical history that it is actually considered the primary impetus for the writing of the Belmont Report.
Justice
Justice in research applies to both the selection of a research topic and the execution of the research. If we lived in a world where all individuals and all questions were ethically the same, the only just way to determine the selection of a research question would be through random chance. However, we live in a world with morally relevant differences as established by our cultures. Morally relevant differences are defined as those differences between individuals that are considered an appropriate reason to treat them differently. For example, age is a significant moral difference in ethical deliberations: all else being equal, a transplant that is as likely to benefit a young child or an older adult might be given to the child because of a longer life expectancy. Population size is often morally relevant in study design because a study that impacts a large population will generally have more potential to do good than one that impacts a small population. In contrast, race, ethnicity, sexual orientation, gender identity, disability status, and financial status are generally not considered morally relevant differences. It should be noted that religion may or may not be a valid moral criterion, depending on the context; for example, certain interventions that are prohibited by a given religion are grounds to avoid that treatment in an individual of that religion—this is in keeping with patient autonomy.
Justice is also important in the selection of subjects and the execution of research. When there is risk associated with a study, it must be fairly distributed so as not to unduly harm any group. This generally corresponds to seeking a diverse group for a study. Note that this also has a side benefit of increasing external validity, which will be discussed later in the chapter. However, the population that is most likely to benefit from the study may be required to bear a greater proportion of the risk. This apparent discrepancy—that all individuals should equally share the burden of risk, and that the target population may assume a higher proportion of risk—is reflective of the fact that likelihood of benefit is a morally relevant difference between individuals. Therefore, in studies in which there is no perceived difference in the likelihood of benefit between individuals, all individuals should assume equal risk; in those for which a particular population is most likely to benefit, that population should assume a higher proportion of risk. Finally, be aware that in some cases, such as drug trials, it may necessary to test the intervention in individuals unaffected by the illness for which the drug has been designed. In this case, the burden of risk falls on a secondary population. This is permissible as long as the potential risks and benefits for the subjects have been addressed through informed consent and respect for persons has been maintained.
Beneficence
Beneficence is the easiest concept to understand in the context of research ethics. It must be our intent to cause a net positive change for both the study population and general population, and we must do our best to minimize any potential harms. This benefit may be as intangible as a feeling of personal satisfaction, and it may be unrelated to the original purpose of the study, such as small financial incentives. It may also be a future benefit if the participant is a member of the target population.
Research should be conducted in the least invasive, painful, or traumatic way possible. For example, a measurement that could be taken with either a finger stick or an indwelling catheter should be taken with a finger stick because it is far less painful and invasive. In addition, in studies comparing two potential treatment options, one cannot approach the research with the knowledge that one treatment is superior to the other. This is termed equipoise. If it becomes evident that one treatment option is clearly superior before a study is scheduled to finish, the trial must be stopped because providing an inferior treatment is a net harm.
MCAT CONCEPT CHECK 11.4
Before you move on, assess your understanding of the material with these questions.
- What is the difference between autonomy in medical ethics and respect for persons in research ethics?
_________________________________
_________________________________
_________________________________
- During study design, a company wishing to market a drug to individuals with severe diabetes proposes to enroll only individuals with mild diabetes. Which principle of research ethics is the company violating? Are there any research concerns in this proposed study besides ethics?
_________________________________
_________________________________
_________________________________
- What is the difference between a coercive influence and monetary compensation for a research study?
_________________________________
_________________________________
_________________________________
- What are some populations that must receive special consideration for coercion?
_________________________________
_________________________________
11.5 Research in the Real World
LEARNING OBJECTIVES
After Chapter 11.5, you will be able to:
- Compare and contrast internal and external validity
- Explain the impact of sample size on generalizability
- Recall the qualities a study must have to justify an intervention
Until this point, we’ve been discussing research in a vacuum but our goals with any research are application-based. In order to apply the data generated, there are practical concerns that we must consider. For example, we must take into account the statistical strengths and weaknesses of a study, especially those that are related to the differences between the target population and the study sample. We also consider ways in which bias impacts the ability to use study conclusions in the real world, and whether there is any true justification for an intervention.
Populations *vs*. Samples
In statistics and research, we generally work with a sample rather than an entire population. A population is the complete group of every individual that satisfies the attributes of interest. Populations may be very large; for example, the population of humans is over seven billion people. In contrast, a population with a large number of qualifiers—for example, the population of females who live in the United States, are between 18 and 30 years old, and who have Darier’s disease, a rare skin condition—will be much smaller (in this case, about 100 people). Information that is calculated using every person in a population is called a parameter.
Working with a population is generally not feasible, even for smaller groups. Therefore, we make generalizations about populations based on sample data. A sample is any group taken from a population that does not include all individuals from the population. Ideally, samples will be representative of the population, and there are several methods of ensuring this. Random samples are generally considered the gold standard, although selecting for certain small subgroups may also be used. Information about a sample is called a statistic. With comparatively large or repeated samples, statistics can be used to estimate population parameters. If only a single small sample is taken, then very little information can be gleaned about the population.
Generalizability
When analyzing a study, we also look for markers of internal validity (or support for causality as discussed earlier) and external validity, or generalizability. Studies with low generalizability have very narrow conditions for sample selection that do not reflect the target population, whereas studies with high generalizability have samples that are representative of the target population. For example, a psoriasis study with low generalizability might have only participants who were diagnosed within the last year, while a study with high generalizability would have participants with a distribution of time since diagnosis that is similar to the population of all patients who have psoriasis.
REAL WORLD
Drugs undergo continuous evaluation in part because of poor preclinical generalizability. Some marketing changes or additional warnings may become necessary, or a drug may even be taken off the market. These are unforeseen risks or outcomes that only become apparent when the drug becomes available to the entire population.
Support for Interventions
As future doctors, we are interested in applying research to our patients. To do so, we’ll need to consider whether the data is sufficient for the recommendation or exclusion of any therapy or treatment plan.
Statistical *vs.* Clinical Effect
In research, the primary marker of success is being able to generate results that are statistically significant—that is, not the result of random chance. However, even the smallest difference between two treatments may be significant mathematically. For example, a decrease in systolic blood pressure of one millimeter of mercury could be statistically significant; however, it is not likely to change patient outcomes. In this way, we must assess whether there is clinical significance—a notable or worthwhile change in health status as a result of our intervention.
MCAT CONCEPT CHECK 11.5
Before you move on, assess your understanding of the material with these questions.
- What is the difference between internal validity and external validity?
- Internal validity:
_________________________________
- External validity:
_________________________________
- Why might small samples provide insufficient information about a population?
_________________________________
_________________________________
- What qualities must a study have to provide justification for an intervention?
_________________________________
_________________________________
Conclusion
In this chapter, we focused on one of the four Scientific Inquiry and Reasoning Skills that will be tested on the MCAT: reasoning about the design and execution of research. We began by reviewing the scientific method and the value of historical data in the formulation of a research question. We then compared the methodology for both basic sciences research and human subjects research, especially with regard to error. We finished our investigation by examining the ethical and practical concerns in research design. The questions for this chapter are designed to allow you to practice this new skill, rather than to test your memorization of this content. In the next chapter, we’ll specifically work with data and graphical analysis, another of the Scientific Inquiry and Reasoning Skills that will be essential on Test Day.
GO ONLINE
You’ve reviewed the content, now test your knowledge and critical thinking skills by completing a test-like passage set in your online resources!
CONCEPT SUMMARY
The Scientific Method
- The scientific method is a series of eight steps for the generation of new knowledge.
- The initial steps (generate a testable question, gather data and resources, form a hypothesis) focus on generating a hypothesis.
- The intermediate steps (collect new data, analyze the data, interpret the data and existing hypothesis) focus on testing that hypothesis.
- The final steps (publish and verify results) relate to providing the results for further testing of the hypothesis.
- The FINER method assesses the value of a research question on the basis of whether or not it is feasible, interesting, novel, ethical, and relevant.
Basic Science Research
- Basic science research uses chemicals, cell cultures, or animal subjects and is experiment-based.
- During research, we manipulate independent variables and observe changes in the dependent variable.
- Controls are used to correct for any influences of an intervention that are not part of the model. Controls may be positive or negative.
- Positive controls ensure that a change in the dependent variable occurs when expected.
- Negative controls ensure that no change in the dependent variable occurs when none is expected.
- Basic science research is often the best type for demonstrating causality because the experimenter has the highest degree of control over the experimental conditions.
- Error in basic science research most often results from errors in measurement.
- Accuracy (validity) is the quality of approximating the true value.
- Precision (reliability) is the quality of being consistent in approximations.
Human Subjects Research
- Human subjects research is subject to ethical constraints that are generally absent in basic science research.
- Experiments may still be performed, but causal conclusions are harder to determine because circumstances are harder to control.
- Much of human subjects research is observational.
- Cohort studies record exposures throughout time and then assess the rate of a certain outcome.
- Cross-sectional studies assess both exposure and outcome at the same point in time.
- Case–control studies assess outcome status and then assess for exposure history.
- Causality in observational studies is supported by Hill’s criteria, which include temporality, strength, dose–response relationships, consistency, plausibility, consideration of alternative explanations, experiments, specificity, and coherence.
- Error may be in the form of bias, confounding, or random error.
- Bias is systematic and results from a problem during data collection.
- Selection bias, in which the sample differs from the population, is most common in human subjects research.
- Detection bias arises from educated professionals using their knowledge in an inconsistent way by searching for an outcome disproportionately in certain populations.
- The Hawthorne effect results from changes in behavior—by the subject, experimenter, or both—that occur as a result of the knowledge that the subject is being observed.
- Confounding is an error in research design that results from a common connection of both the dependent and independent variables to a third unaccounted-for variable.
- Mediating variables explain the association or relationship between two variables.
- Moderating variables explain the strength or direction of the relationship between two variables.
Ethics
- Medical ethics generally refers to the four principles of beneficence, nonmaleficence, respect for patient autonomy, and justice.
- Research ethics were established by the Belmont Report.
- Respect for persons includes autonomy, informed consent, and confidentiality.
- Justice dictates which study questions are worth pursuing and which subjects to use.
- Beneficence requires us to do the most good with the least harm. We cannot perform an intervention without equipoise—a lack of knowledge about which arm of the research study is better for the subject.
Research in the Real World
- Populations are all of the individuals who share a set of characteristics. Population data are called parameters.
- Samples are a subset of a population that are used to estimate population data. Sample data are called statistics.
- Internal validity refers to the identification of causality in a study between the independent and dependent variables. External validity refers to the ability of a study to be generalized to the population that it describes.
- In order to be supported, an intervention must display both statistical and clinical significance.
- Statistical significance refers to the low likelihood of the experimental findings being due to chance.
- Clinical significance refers to the usefulness or importance of experimental findings to patient care or patient outcomes.
ANSWERS TO CONCEPT CHECKS
**11.1**
-
- How do medical errors relate to sleep deprivation of medical residents? This is a current topic of investigation and a consensus in the scientific community is still being reached. Medical residents are available for interview, and the research has very relevant outcomes.
- What is the average lifespan of bacteria in Martian rocks? While it is not very feasible to acquire the Martian rocks, the results would be both novel and interesting.
- How long does it take the Earth to complete one revolution around the Sun? This question has been asked and answered to the satisfaction of the scientific community. It is neither novel nor interesting (in terms of further research).
- Errors during publication of current studies adversely affect the quality of future experimentation by providing an incomplete or flawed research base. Without accurate resources, subsequent hypotheses are likely to be flawed.
- False. While the statement may or may not be true, this is not an easily testable hypothesis. While not required, if–then formatting of a hypothesis necessarily implies a testable relationship between ideas.
**11.2**
- This experiment would likely have inaccuracy error but not imprecision error. In other words, the scale would reliably read the same mass or weight, but the mass or weight it reads is not correct. This would lead to bias in thewould lead to bias in the results.
-
- Controls in experiments help to establish causality by demonstrating that the outcome does not occur in the absence of an intervention. Controls are used to keep the manipulations of different systems as similar as possible, or as a known standard against which to judge an experimental manipulation. Without controls, it is far more difficult to establish causality.
**11.3**
- False. Temporality is the only necessary criterion from Hill’s criteria. If temporality is not satisfied, the relationship cannot be said to be causal. The addition of other criteria increases the probability of a causal relationship, assuming that temporality has not been invalidated.
- Observational research does not involve manipulation of the subjects’ environment. It is generally less conclusive and more subjective than experimental research, which does involve manipulation of the subject or environment.
- Bias is a systematic (unidirectional) error that occurs during the selection of subjects or the measurement and collection of data. Confounding is an error that occurs during data analysis, in which an association is erroneously drawn between two variables because of a shared connection to a third variable.
**11.4**
- Autonomy is simply the right of individuals to make decisions on their own behalf and to have those decisions be respected. Respect for persons also requires honesty, confidentiality, informed consent, and freedom from coercion.
- The company is violating the principle of justice by choosing participants that are not part of the target population. The company is also introducing selection bias.
- The line between a coercive influence and a compensatory influence is often debated. In general, a compensatory influence is one that does not impact the decision to participate, while a coercive influence is one in which the subject loses autonomy to make the decision to participate.
- Children, pregnant individuals, and prisoners are considered especially at risk for coercion and thus are granted special protections.
**11.5**
- Internal validity is the tendency of the same experiment to produce the same results when repeated, and provides support for causality. External validity is the ability to take the information generated during research and apply it to a larger group. External validity is also called generalizability.
- Small samples are subject to more random variation than large samples. If only one person is selected, that person may be an outlier, but if a much larger sample is selected, an outlier will have less of an effect on the results.
- A study must have both statistical significance and clinical significance to provide justification for an intervention. A study without statistical significance may be the result of random chance, whereas one without clinical significance will not impact patients.
SCIENCE MASTERY ASSESSMENT EXPLANATIONS
1. C
The purpose of a control is to keep the conditions of two experiments as close as possible to establish causality. In this case, the one milliliter volume addition might have impacted the growth of E. coli; thus, we must control for this by administering an equal volume of a theoretically inert compound to a plate of E. coli.
2. C
An experiment will always establish a clearer causal link than an observational study. (A), (B), and (D) are all examples of observational data.
3. A
The experimenter has not completed the initial phases of research. There was no data acquisition or refinement, and there was no indication that the question required an experiment to be answered. Were the experimenter doubtful of the validity of the reported value, an experiment could be appropriate—but there is no information to indicate that this is so. Based on the question stem, it is clear that the experimenter had a clear goal, eliminating (B). In human subjects research, tasks may be divided to facilitate blinding, but this is generally unnecessary in basic sciences research, eliminating (C). As long as the calorimeter was calibrated prior to its use, it does not matter when this calibration occurred relative to the synthesis of the compound, eliminating (D).
4. B
A parameter is a population measure, so to calculate it, every single member must be measured. Identifying, measuring, and recording data for a population that large—over 300 million—is essentially impossible. Common biometric measures, if not misused, generally neither cause significant psychological harm nor are unethical, eliminating (A). Knowing a mean weight could have major ramifications, including public health measures, medical recommendations, and shifting of body image, eliminating (C). While a number of studies on weight have been performed, there is not yet a parameter describing the entire population, eliminating (D).
5. D
Because both the exposure and outcome are measured at the same time, we cannot make any conclusions about temporality. The cancer patient may have only begun smoking after diagnosis, and this type of study doesn’t examine that possibility.
6. B
Randomization is based on the idea that the results will only vary as a result of random chance as long as the assignment is proper. The appropriate response to a fair algorithm that assigns groups in an unexpected way is to proceed with the research. Participants should never be assigned by the researcher, nor should one continue randomizing samples to achieve a desired outcome—these are likely to introduce more error than leaving unequal groups, eliminating (A) and (D). It is unnecessary to drop this entire cohort, assuming the randomization algorithm was fair, eliminating (C).
7. C
Two relationships are being assessed. In the relationship between smoking and very low birth weight (VLBW), smoking is the independent variable and VLBW is the dependent variable. In the second relationship, VLBW is being compared to IQ. VLBW is the independent variable here, while IQ is the dependent variable.
8. A
Because the same physician sees both the control groups and the experimental groups, there is the potential for the physician to realize which of the groups is receiving which treatment—especially if the subject mentions expected side effects. In this study, patients were not told which group they were in, but if they were assigned to the medication group, they were told about its side effects. If the patients talked to each other they could experience patient unblinding, but we are told they have no communication with each other.
9. B
As part of the scientific method, after formulating a testable question, one must search through journals and databases to review the available information. This student likely did not spend sufficient time reviewing existing studies because the review committee was able to cite several studies that had already tested and affirmed the student’s hypothesis, meaning that the hypothesis is not scientifically interesting. This observation is consistent with (B). On the other hand, the question stem indicates that the hypothesis was well formulated and that the student had some preliminary data, which eliminates (A) and (D). There is no stated criticism of the student’s research methods, which eliminates (C).
10. B
Requiring subjects to volunteer for a study and to seek the study out will introduce selection bias. The people who end up volunteering listen to the radio, which the general population may not, and are interested in the topic and willing to volunteer. Most studies suffer from selection bias and it is the most common impediment to generalizability.
11. C
The behaviors described in the question stem (informing the patient, providing time to make a decision) are consistent with informed consent and autonomy, which are both part of respect for persons.
12. A
While it may appear that this question is asking to determine which method is the most accurate or reliable, this is an ethics question. All of these methods (with the exception of venipuncture, (C)) measure oxygen saturation. According to the principle of beneficence, we must minimize potential harms associated with our investigations; thus, the noninvasive pulse oximeter should be greatly favored over other measurements for an initial assessment.
13. B
Statistical significance is not the same as clinical significance. There are medications that increase the length of pregnancy in preterm labor, but some only do so for a few hours. Because this may not impact patient outcomes, it should not inform treatment decisions.
14. D
Samples should always be taken from the target population or population of interest. Given that the target population is postmenopausal women, this group should be used for the sample. Both prepubescent girls and pregnant women are populations with special precautions against coercion, and are not appropriate for this study, eliminating (A) and (C). Premenopausal women are unlikely to require hormone replacement therapy unless they have a condition that specifically necessitates it, eliminating (B).
15. C
The Hawthorne effect—a change in behavior as a result of the knowledge that one is being observed—is only present with human subjects. Basic science research generally does not suffer from the Hawthorne effect.
GO ONLINE
Consult your online resources for additional practice.
SHARED CONCEPTS
Behavioral Sciences Chapter 4
Cognition, Consciousness, and Language
Behavioral Sciences Chapter 8
Social Processes, Attitudes, and Behavior
Behavioral Sciences Chapter 11
Social Structure and Demographics
Behavioral Sciences Chapter 12
Social Stratification
Physics and Math Chapter 12
Data-Based and Statistical Reasoning