How the exams carve this up
- Exam 1 · Oct 5 — Units 1 and 2. Two units, one exam: methods, genomes, genome evolution, phylogeny. Start early.
- Exam 2 · Oct 28 — Unit 3 (cell structure + viruses). No lecture Oct 26.
- Exam 3 · Nov 23 — Unit 4 (energetics, catabolism, biosynthesis).
- Exam 4 · Dec 16, 10–11:59 AM — Unit 5. The optional comprehensive final (Dec 16–18) can replace one of exams 1–3.
Unit 1 · Methods for studying microorganisms
- Three domains
- Bacteria, Archaea, Eukarya — Carl Woese's rRNA-based tree (1977). Archaea are sister to Eukarya, not Bacteria.
- Koch's postulates
- (1) Microbe present in disease, absent in healthy. (2) Isolated in pure culture. (3) Causes disease when introduced. (4) Re-isolated from new host. Modernized for non-culturable + viral pathogens.
- Pasteur
- Disproved spontaneous generation; pioneered fermentation, pasteurization, vaccines (rabies, anthrax).
- Microbial sizes
- Most bacteria 1-5 µm; viruses 20-300 nm; Mycoplasma ~0.3 µm; Thiomargarita up to 750 µm (visible!). Size sets which method can see them — light microscopy bottoms out near 0.2 µm.
- Resolution limit
- d = 0.61λ / NA. Visible light + oil-immersion NA ~1.4 gives ~0.2 µm — enough for bacteria, not for viruses or ribosomes. Electron microscopy uses electrons (λ far shorter) to reach nm resolution.
- Bright-field vs phase-contrast vs dark-field
- Bright-field needs stain for contrast (kills cells). Phase-contrast converts refractive-index differences into brightness — live, unstained cells. Dark-field images only scattered light; good for thin spirochetes.
- Fluorescence microscopy
- Fluorophore absorbs short λ, emits longer λ. DAPI stains all DNA; GFP fusions localize a specific protein; FISH probes rRNA to identify uncultured cells in situ.
- Electron microscopy
- TEM = electrons through thin sections → internal structure. SEM = scattered electrons off the surface → 3D topography. Cryo-EM freezes hydrated specimens, avoiding fixation artifacts.
- Gram stain
- Crystal violet → iodine mordant → ethanol decolorize → safranin counter. Gram-positive retain purple (thick peptidoglycan); Gram-negative pink (thin PG + outer membrane). The single most informative 3-minute test in microbiology.
- Differential vs selective media
- Selective suppresses unwanted organisms (MacConkey's bile salts block Gram-positives). Differential reveals a phenotype by color (MacConkey lactose fermenters → pink). Many plates are both.
- Pure culture
- Population descended from one cell. Obtained by streak plate, spread plate, or pour plate. Prerequisite for Koch's postulates and for almost every classical assay.
- Viable count (CFU/mL)
- Serial-dilute, plate, count colonies on a plate with 30–300, then CFU/mL = colonies × dilution factor ÷ volume plated. Counts only cells that grow — misses viable-but-nonculturable cells.
- Direct count
- Counting chamber, flow cytometry, or DAPI + epifluorescence. Counts live and dead cells, so direct counts routinely exceed viable counts by orders of magnitude in environmental samples.
- Turbidity / OD₆₀₀
- Light scattering as a fast proxy for biomass. Must be calibrated against viable counts, and it saturates at high density.
- Generation time
- Time for a population to double. E. coli ~20 min in rich media; M. tuberculosis ~24 hr.
- Growth curve
- Lag → exponential (log) → stationary → death. N = N₀ × 2ⁿ, where n = generations.
- Continuous culture (chemostat)
- Steady-state growth held at a chosen rate by limiting one nutrient; dilution rate sets growth rate. The way to study physiology at a fixed, reproducible growth rate.
- Culture-independent methods
- Most environmental microbes have never been cultured. 16S rRNA amplicon surveys and shotgun metagenomics identify who is present without growing them — the reason Unit 2 is genome-first.
Microbiology, Section 4.3 study notes
Contents
Right-click here and choose Update Field to build the contents.
Bacteria Are Grown in Culture Media
Liquid (broth) media
- Organisms float freely, mix around
- Good for: pure culture (one strain/species), studying growth kinetics (how fast it grows over time), biochemistry at different growth phases
Solid (agar) media
- Organisms stay put where they land
- Good for: separating mixed populations (like from a dirty clinical sample or environment) into distinct, isolated colonies
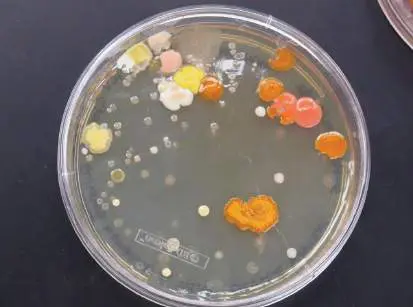
- Figure 1. Colonies on an agar surface. One founding cell gives one visible colony.
- Source: Slonczewski & Foster, Microbiology: An Evolving Science, 6e, Fig. 4.12
Dilution Streaking and Spread Plates
Agar (the solidifying agent)
- From seaweed
- Melts at 100°C, resolidifies only at ≈40°C. That gap is why you can pour it hot and add heat-sensitive stuff before it sets
- Poured into Petri dishes → flat surface for streaking
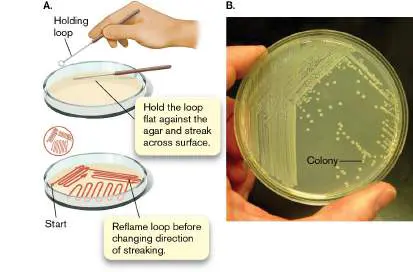
- Figure 2. Dilution streaking: the loop is flamed between areas, so each streak deposits fewer cells than the last.
- Source: Slonczewski & Foster, Microbiology: An Evolving Science, 6e, Fig. 4.13
Method 1: Dilution Streaking (streak plating)
- Goal: separate a mixture into single cells → single colonies
- Loop grabs a drop of liquid culture
- Streak across plate in 3–4 areas, flame the loop between each area
- Cells fall off the loop as you drag → fewer and fewer remain
- By the last streak, only individual cells are deposited
- One cell → millions of offspring → microcolony (microscope only) → colony (visible droplet)
- Touch one colony with a sterile loop → into fresh broth = pure culture
Method 2: Spread Plate
- Goal: same isolation, but also lets you count
- Make tenfold serial dilutions (1 ml culture → 9 ml diluent = 1/10, repeat)
- Spread 0.1 ml of each dilution on its own plate
- Spread with: flame-sterilized bent glass rod, sterile disposable spreader, or shaken glass beads
- Early (concentrated) dilutions → confluent growth (lawn, TNTC = too numerous to count)
- Later dilutions → countable separate colonies
Viable counts / CFUs
- Viable = culturable = successfully replicates into a colony
- 1 colony = 1 CFU in the original sample
- Countable range: 30–300 colonies. Below 30 = statistically shaky; above 300 = colonies merge
The math (from Fig. 4.14):
- 107 colonies on the 10⁻⁵ plate
- 107 × 10¹ (because you only plated 0.1 ml, so ×10 to get per-ml) × 10⁵ (reciprocal of dilution factor) = 1.1 × 10⁸ CFU/ml
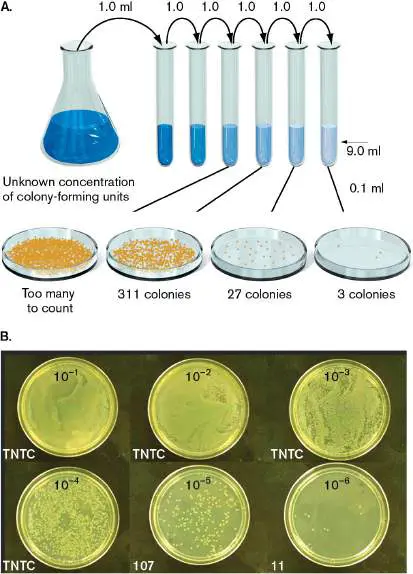
- Figure 3. Tenfold serial dilution and plating: how a colony count on one plate becomes cells per ml in the original culture.
- Source: Slonczewski & Foster, Microbiology: An Evolving Science, 6e, Fig. 4.14
The big catch: 1 cell ≠ 1 colony
- Streptococcus (chains) and Staphylococcus (clusters) don’t live as single cells
- A clump of 10 Staph cells → one colony
- That’s the real reason it’s called a colony-forming UNIT, not “colony-forming cell”
Complex versus Synthetic Media
The two media types
Complex (rich) medium
- Nutrient-rich, poorly defined. You don’t know exact chemical composition
- Built from extracts: yeast extract, beef extract, tryptone
- Those extracts dump in a grab-bag of amino acids, peptides, nucleosides, vitamins, sugars
- Bacteria grow fast here
Defined (synthetic) medium
- Every chemical and its exact concentration is known
- Start with water → add precise salts, carbon, nitrogen, energy source
- Bacteria grow slower, they have to build their own parts
- Minimal defined medium = only the nutrients essential for that specific microbe. Nothing extra.
- Enriched medium = complex medium + extra additions (like blood) for fastidious organisms (picky eaters that can’t grow on plain complex media).
Why complex = fast
- The cell scavenges instead of manufacturing.
- Need tryptophan? Instead of running a whole biosynthetic pathway (enzymes, energy, ATP), it just needs a membrane transport system to pull tryptophan in from the medium.
- Fastidious organisms grown on blood steal heme from lysed red blood cells and use it as an enzyme prosthetic group (e.g., the heme in cytochromes).
- Analogy: complex = eating takeout, defined = cooking from raw ingredients. Takeout is faster because someone else did the prep. Cooking from scratch takes longer but you know exactly what’s in it.
The tradeoff (this is the exam point)
- Why complex is useless for metabolism studies: if you grow E. coli in complex medium and it makes tryptophan-containing protein, you can’t tell whether it synthesized tryptophan or just absorbed it from the yeast extract. Defined medium removes the free lunch, so growth proves the organism can make the thing itself.
- The catch: not every microbe that grows on complex medium can grow on defined medium, some have missing pathways nobody has mapped yet.
Who needs what
- Self-reliant (E. coli, Bacillus subtilis wild type) → plain defined medium is enough
- Needs extras (Shigella, mutant E. coli/B. subtilis) → need added growth factors because they lack specific pathways
- Modern fix: whole-genome sequencing reveals missing biosynthetic pathways → predicts which nutrients to add
Table 4.1: what to actually remember
LB (Lysogeny/Luria Bertani) broth: Complex
- Tryptone 10 g, yeast extract 5 g, NaCl 10 g, pH 7
- Grows lots of Gram-neg and Gram-pos (E. coli, S. aureus)
- Tell: “extract” in the ingredient list = complex
M9: Defined
- Glucose (carbon/energy) + phosphates + NH₄Cl (nitrogen) + salts (Mg, Ca, Na), pH 7
- Gram-negatives like E. coli
- Tell: everything is a named chemical formula = defined
Sulfur oxidizer medium: Defined, extreme
- Elemental sulfur as the energy source, 5% CO₂ atmosphere, pH 3
- Acidithiobacillus thiooxidans
- Note: no organic carbon, it’s an autotroph living on rock chemistry at acid-bath pH
Selective, Differential, and Enrichment Media
The three media types
Selective media
- Principle: exploit a resistance difference.
- Gram-negative = outer membrane → resistant to bile salts and crystal violet dye
- Gram-positive = no outer membrane → killed by them
- Plate with bile salts + crystal violet = selects for Gram-negatives
- Analogy: a bouncer at the door. Some organisms don’t get in at all.
Differential media
- Principle: both organisms grow fine, you’re reading a biochemical difference, not a survival difference.
- Analogy: everyone gets in, but they’re wearing different colored wristbands.
MacConkey agar (the classic: it’s BOTH)
Ingredients and what each does:
The logic chain:
- E. coli (fermenter): lactose → ferments it → acidic end products → pH drops → neutral red stays red and enters the cells → RED/PINK colonies
- Salmonella enterica (nonfermenter): can’t touch lactose → eats peptone instead → alkaline products → neutral red is colorless at high pH → WHITE colonies (their natural color)
- Mnemonic: “Acid = Red, Alkaline = Absent (of color).”
- Or: “Fermenters Flush red.”
Why clinicians love MacConkey for diarrhea
- Most normal microbiota on this plate = lactose fermenters → red
- Two big Gram-negative pathogens, Salmonella and Shigella = lactose nonfermenters → white
- So a white colony on MacConkey = suspicious, investigate. It stands out against a sea of red normal flora.
- Mnemonic: “Salmonella and Shigella Stay White.” (S, S, S)
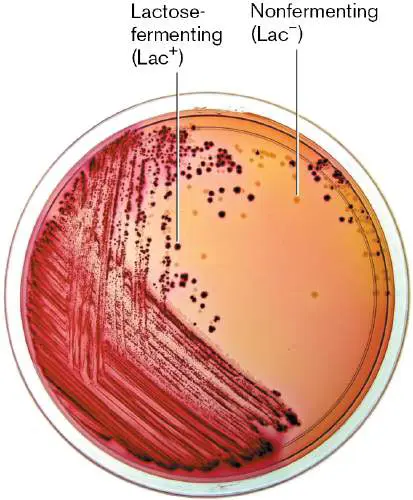
- Figure 4. MacConkey medium, selective and differential at once: only Gram-negatives grow, and only lactose fermenters turn pink.
- Source: Slonczewski & Foster, Microbiology: An Evolving Science, 6e, Fig. 4.15
Enrichment media
- Same goal as selective (favor one organism), different format and purpose.
- Selective = agar plate. Enrichment = liquid broth.
- Purpose: the target is too rare to find by direct plating, it’d be buried under environmental bacteria or normal microbiota
- Solution: grow it in broth first so its numbers multiply, then subculture onto a plate
- Example 1, inhibit the competition: Selenite broth for Salmonella. Selenite blocks everything else; the few Salmonella cells multiply until they’re findable.
- Example 2, starve the competition: Broth with a specific hydrocarbon as sole carbon source. Only species that can metabolize that hydrocarbon grow. Everyone else has nothing to eat.
- Analogy: enrichment is turning up the volume on one quiet voice before you try to identify it. Or: a fishing net that only holds one species. You don’t identify the fish yet, you just concentrate them.
The whole set in one mnemonic
- “Select who Survives, Differentiate what they Do, Enrich what’s Rare.”
Quick sorting rule for exam questions:
- Sees a dye/inhibitor killing a group → selective
- Sees a color change from metabolism → differential
- Sees a broth used before plating → enrichment
Growth Factors and Uncultured Microbes
Why growth factors exist: the evolutionary logic
The chain:
- Niche reliably supplies a compound (e.g., amino acids in the human mouth)
- The organism’s biosynthetic pathway for it becomes unnecessary
- Random mutations degrade the pathway, no selective pressure to keep it
- Genes are lost permanently
- Pull the organism out of that niche → it now requires that compound from outside
- That required compound = a growth factor
- Definition: a growth factor is a specific nutrient one species needs but others don’t.
- Example: Streptococcus pyogenes lives in the human oral cavity, which is swimming in glutamate and alanine. It lost the genes to make them. In lab culture you must add glutamate + alanine on top of normal macro/micronutrients.
- Mnemonic: “Use it or lose it.”
- Analogy: a person who moves to a city with great restaurants and never cooks again. After 20 years the kitchen skills are gone. Move them to a cabin in the woods and they starve, not because food doesn’t exist, but because they can’t make it themselves. Growth factors are the “meals” you have to hand them.
Table 4.2: the ones worth memorizing
- Pattern to notice: cysteine shows up constantly (Abiotrophia, Bordetella, Francisella, Legionella). Mnemonic: “Fastidious bugs are Cysteine-Sissies.”
- NAD is the other repeat (Haemophilus, Mycobacterium, Shigella).
Uncultured organisms (“microbial dark matter”)
- 85–99% of bacterial species in water, soil, or on animals will not form colonies on agar
- Old term “unculturable” → now “uncultured” (the point: it’s our failure, not a permanent property)
- Why: many depend on growth factors supplied by neighboring species, e.g., siderophores (iron scavengers)
- Some of these factors act hormone-like, stimulating replication
- Analogy: you can’t raise a wolf pup alone in a box, it needs the pack. These bacteria need their community’s chemical signals.
How we know they exist if we can’t grow them
- PCR on ribosomal RNA genes.
- Every known microorganism has genes encoding ribosomal RNA
- rRNA is highly conserved across the whole phylogenetic tree → universal barcode
- PCR-amplify those genes straight out of soil/water
- Compare sequences to known culturable organisms → reveals tons of undiscovered microbes
- Modern genomics can even predict their physiology from sequence alone
- Figure 5. Co-occurrence analysis of Candidatus Roizmanbacterium ADI133: finding an uncultured organism's partners by who it is always found with.
- Source: Slonczewski & Foster, Microbiology: An Evolving Science, 6e, Fig. 4.17
Fix #1: the iChip (Kim Lewis, Northeastern)
- The trick: don’t bring the bug to the lab, bring the lab to the bug.
Steps:
- Dilute soil so one cell per channel of the multichannel iChip (isolation chip)
- Cover both sides with semipermeable membranes
- Put the chip back into the soil
- Soil nutrients + growth factors diffuse in; the cell forms a colony
- Weird bonus: once cultured this way, many then grow fine on their own afterward, mechanism unknown
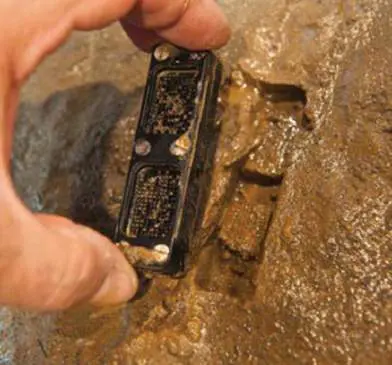
- Figure 6. In situ culturing of the uncultured: Kim Lewis's iChip, and Eleftheria terrae, the source of teixobactin.
- Source: Slonczewski & Foster, Microbiology: An Evolving Science, 6e, Fig. 4.16
Fix #2: Co-occurrence analysis (“guilt by association”)
- Kusel + Geesink. Idea: if two organisms always show up together, they’re probably partners.
Candidate Phyla Radiation (CPR):
- “Radiation” = an evolutionary offshoot of bacterial lineages
- Up to 26% of Earth’s bacterial diversity
- Abundant in groundwater, key in sulfur and nitrogen recycling
- Metabolically crippled: no genes for amino acid, nucleotide, or lipid biosynthesis; incomplete TCA cycle and electron transport chain
- That crippling explains why they’re uncultured, they must partner with someone
- The study: sequenced Candidatus Roizmanbacterium ADI133 genome, used qPCR + 16S rRNA amplicon sequencing across 29 groundwater samples over a year → found striking co-distribution with Thermodesulfovibrionia (also uncultured), and a second co-occurrence with Candidatus Parcubacteria.
- Note: “Candidatus” = the official label for a species we’ve detected but never cultured.
- Analogy: detective work. You can’t interrogate the suspect, but you notice he’s photographed with the same guy at every crime scene. Guilt by association.
Obligate intracellular bacteria: a different kind of uncultured
- These won’t grow on lab media either, but for a different reason: they evolved to grow only inside a eukaryotic cell.
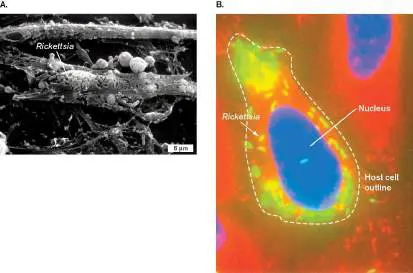
Rickettsia prowazekii (epidemic typhus):
- Figure 7. Rickettsia prowazekii growing inside eukaryotic cells. It cannot be grown axenically, only inside a host cell.
- Source: Slonczewski & Foster, Microbiology: An Evolving Science, 6e, Fig. 4.18
- Ancestor adapted to grow in eukaryotic cytoplasm
- Lost key biochemical pathways because the host supplied them, same “use it or lose it” logic, taken to the extreme
- We still don’t know which factors it’s missing
- Can grow it in: animal cell tissue culture, or chicken eggs (inside endothelial cells of blood vessels in fertilized eggs)
- Cannot grow it axenically (= outside a host cell, pure culture) despite extensive effort
- Grows only in the cytoplasm, not the nucleus
- Key vocab: axenic = growth free of any other organism. “A-xenic” = “no strangers.”
Master mnemonic for this whole section
- “Lost the recipe, need the neighbor, or need the house.”
- Lost the recipe → growth factors (add the compound → it grows)
- Need the neighbor → uncultured/CPR (needs community signals → iChip, co-occurrence)
- Need the house → obligate intracellular (needs a host cell → tissue culture, chicken eggs)
Special Topic 4: Sponge factors that “resuscitate” dark matter
- The gap this study filled: Lewis’s iChip works, but nobody knew why. Aoi’s team asked what the environment is actually supplying.
Setup:
- Organism: marine sponge Theonella swinhoei
- Device: a diffusion chamber (DC), like an iChip but single chamber, just a thin agar slab
- Agar contained: nutrients + sea salt + homogenized sponge extract (carrying the uncultured bacteria)
- Covered both sides with 0.1 µm filters, too small for organisms to cross, big enough for small molecules to diffuse in
- Implanted the DC into a living sponge for 1 week
- Then removed it and subcultured colonies onto plain agar with no sponge extract
Results (DC vs. SDP = standard direct plating):
- Of 37 species total, only one (Ruegeria atlantica) showed up in both methods → the two methods catch almost completely different organisms
The key finding, it’s a Starter, not FUEL:
- Once activated, most novel species no longer needed the factor
- Extract did not change growth rate or growth yield
- It was needed only to initiate growth on artificial media
Starvation experiment (the follow-up):
- Starved isolates for several days → dilution-plated ± sponge extract
- 15 of 28 in situ isolates plated better with extract
- 8 of those 15 plated 2–5× better
- On SDP isolates: extract had little effect, sometimes lowered efficiency
- Property of the factor: thermostable, survives autoclaving. (So it’s a small heat-stable molecule, not a protein.)
- Conclusion: the extract contains a growth-initiation factor that triggers regrowth of dormant bacteria but doesn’t continually promote growth.
- Analogy: it’s a spark plug, not gasoline. The engine won’t turn over without it, but once running, the spark plug isn’t what keeps it going. That’s the whole finding in one image.
- Or: a starter culture for yogurt/sourdough. You need it to begin fermentation; after that the culture sustains itself.
- Mnemonic: “The sponge sends a wake-up call, not a meal.”
If asked the Research Question, reasonable next steps:
- Identify the molecule, fractionate the extract (it’s heat-stable, so start with small-molecule fractions), run MS/NMR, test each fraction for initiation activity
- Find the receptor/mechanism, what signal transduction pathway does it hit? Compare transcriptomes of dormant vs. awakened cells
- Test generality, does the sponge factor wake soil or groundwater dark matter too, or is it host-specific?
- Source question, is the sponge making it, or its symbionts? (Test extracts from sponges with the microbiome depleted.)
Counting bacteria: the framing
- Why it matters practically: is a lake fecally contaminated? Is the peanut butter carrying Salmonella?
- The critical caveat (this is the exam point): Every counting method measures a different physical or biochemical aspect of growth. So cells/ml from one method will not match another method’s number. There is no single “true” count. You have to know what your method is actually detecting.
- Analogy: counting a crowd. Turnstile clicks, aerial photo, and ticket sales all give different numbers for the same event, none is wrong, they measure different things.
Method 1: Direct counting (living AND dead)
- Dilute the culture, load onto a counting chamber
- Hemocytometer = general
- Petroff-Hausser counting chamber = the bacteria-specific version
- Slide has an etched grid of precise dimensions
- Coverslip creates a space of precise volume
- Count cells in that volume under the microscope → calculate cells/ml in the original culture
Live/Dead staining (fixes the direct-count problem)
- Propidium iodide intercalates between DNA bases
- Combine both → live = green, dead = red/orange
- Dead cells get both dyes, but red overrides → orange/red
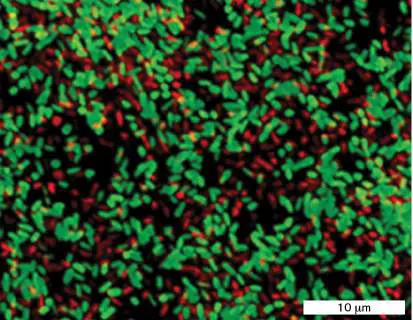
- Figure 8. LIVE/DEAD stain. Live cells fluoresce green; dead cells take up propidium iodide and fluoresce orange.
- Source: Slonczewski & Foster, Microbiology: An Evolving Science, 6e, Fig. 4.19
Flow cytometry / FACS
- Direct counting without a microscope.
How it works:
- Cells are labeled, fluorescent protein (GFP, CFP), fluorescent antibody, or chemical
- Passed single file through a small orifice
- Through a laser beam
- Three detectors read each cell:
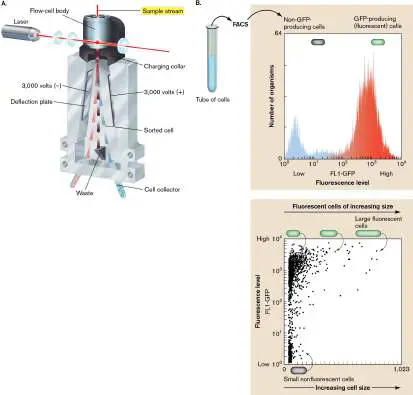
- Figure 9. Fluorescence-activated cell sorting: cells pass single file through a laser, and charged droplets are deflected by fluorescence.
- Source: Slonczewski & Foster, Microbiology: An Evolving Science, 6e, Fig. 4.20
The killer application, gene expression at single-cell resolution:
- Make a gene fusion: put gfp under control of the gene you care about
- Now GFP brightness = that gene’s expression level
- Count and sort cells by expression
- Answers: which conditions trigger the gene? and, the important one, does every cell in the population express it equally?
- Sorted cells can be reused (e.g., selecting recombinant clones)
- Analogy: an airport security line with a scanner. Everyone files past one at a time; the machine measures each person’s size, build, and whether they’re carrying something flagged. Then FACS is the guard who physically pulls flagged people into a separate room.
- Fig 4.20B note: the blue peak = baseline autofluorescence (background, not GFP). The red peak = actual GFP expressers. Larger cells on the scatterplot are likely about to divide.
Viable counts: pour plate technique
Two ways to do a viable count:
- Spread plate, dilutions onto the agar surface
- Pour plate, cells mixed into liquid agar cooled to 42–45°C, then poured into an empty Petri dish and left to solidify
- The 42–45°C exposure is short, and most bacteria survive it → colonies form on AND in the agar
- This is exactly why the agar hysteresis gap matters, see the earlier agar section.
- The math example: 100 colonies from 100 µl (0.1 ml) of a 10⁻³ dilution → 100 ÷ 0.1 ml = 1,000/ml in the dilution → 1,000 × 10³ = 10⁶ organisms/ml in the original
Why viable counts Underestimate (two reasons)
- 1. Damaged cells. Cells can be metabolically active and alive but too compromised to divide. No colony → not counted.
- How you detect this: compare a viable count to a direct count from live/dead stain. A big gap = damaged/dormant cells present.
- 2. Chains and clusters. Streptococcus etc. One colony comes from a group of cells.
- This is why results are reported as CFUs, not cells.
- Mnemonic: “Plates are Pessimists.” They always report fewer than are really alive.
Biochemical assays (measure the Population, not individuals)
Optical density (OD): the workhorse
- Cells scatter light; the drop in beam intensity = optical density
- Fast, easy, real-time, the main reason it’s used constantly
Limitations:
- Light scattering is a complex function of cell number, composition, AND volume → only approximate
- Cell scattering properties change as cells grow (size/shape shifts)
- Dead cells scatter light too
- Worst in stationary phase, where dead cells accumulate → OD stays high while viable count is falling
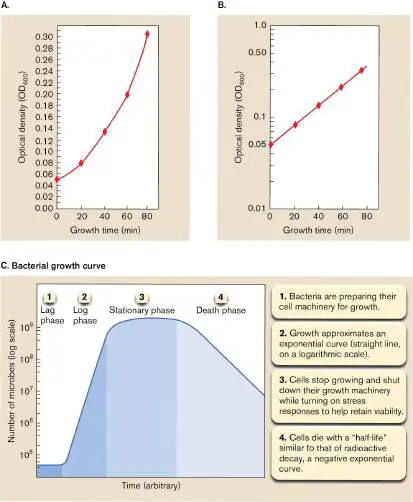
- Figure 10. Growth measured by optical density. OD tracks cell mass, and it keeps reading high in stationary phase while the viable count falls.
- Source: Slonczewski & Foster, Microbiology: An Evolving Science, 6e, Fig. 4.22
PCR-based counting
Plain PCR problems (it Overestimates):
- Dead cells still contain DNA
- Fast-growing cells contain more than one chromosome copy → one cell counted multiple times
Viability PCR, the fix:
- Add propidium dye → penetrates only dead cells, binds their DNA
- Photoactivate the dye → cross-links dead-cell DNA
- Cross-linked DNA cannot be amplified
- qPCR now amplifies only living cells’ DNA
- Mnemonic: “Propidium locks the dead out, of the stain AND of the PCR.” Same dye, same live/dead logic, two different techniques.
Master comparison table
- Overall mnemonic: “Plates undercount, OD and PCR overcount, stains and FACS tell you who’s actually alive.”
Section 4.2: condensed review sheet
The one distinction the glossary almost hides
- Your glossary repeats “enriched medium” three times (a copy-paste glitch), which buries the pair students actually mix up:
- Mnemonic: “Enriched feeds the picky. Enrichment finds the rare.”
Media, fully sorted
By composition:
- Defined/synthetic, every chemical known → slower growth, but proves metabolism
- Minimal defined, only what’s essential for that organism
- Complex/rich, undefined extracts (beef broth, yeast extract) → fast growth
- Enriched, complex + additives for fastidious bugs
By function:
- Selective, only some grow
- Differential, all grow, but look different
- Both, MacConkey
- Enrichment, broth that amplifies the rare one
Terms worth locking down
- Note the glossary defines viable purely as able to replicate, not “alive.” That’s the loophole that makes plate counts undercount: damaged cells are alive but not viable by this definition.
Counting: direct vs. indirect (the summary’s own split)
Direct (see/detect individual cells):
- Microscope count (± stain)
- Flow cytometry / FACS
- Quantitative PCR
Indirect (measure the population as a whole):
- Viable counts / CFU
- Dry weight
- Protein levels
- Optical density
- Notice qPCR is grouped as direct (it detects individual genome copies) while CFU counts are indirect (you infer cells from colonies). That’s counterintuitive, likely a test question.
- Fig. 2.3 callback: tube of Rhodospirillum rubrum = you detect bacteria without resolving them (that’s OD). Light microscopy of Oenococcus oeni = you resolve individual cells (that’s direct counting). Detection ≠ resolution.
The evolutionary throughline of this whole section
- Everything about growth factors, uncultured organisms, and obligate intracellular bacteria is one idea repeated at three intensities:
- “A niche that gives you something takes away your ability to make it.”
Five mnemonics that cover the section
- “Liquid = Learn, Solid = Separate”: media format
- “Complex is Cloudy, Defined is Documented”: composition
- “Select who Survives, Differentiate what they Do, Enrich what’s Rare”: function
- “Use it or lose it”: growth factors / uncultured / intracellular
- “Plates undercount, OD and PCR overcount”: counting bias
Lecture 2 Companion — What the Professor Emphasized in Class (Aug 26, 2026)
- This section merges the Lecture 2 “Methods Part 1” slides with the in-class lecture recording. Bold orange text = the blanks from the student slides, filled in from what the professor said. In-class questions he posed (likely exam material) are collected at the end.
Culturing microbes — the lecture framing
- Growing microbes in lab can be easy for some, quite difficult for others
- Microbes vary in required growth conditions
- We try to grow a pure culture (a single species/strain in or on media)
- Most microbes in nature exist in complex, multispecies communities — some cannot grow alone because other organisms supply something they need (symbiotic relationships)
- Only about 0.1% of bacteria have been successfully grown in lab (prof: “that’s what’s been reported” — hundreds of different media have evolved trying)
Liquid (broth) culture — filled in
- Nutrients and minerals dissolved in water; non-photosynthetic microbes also need a carbon/food source (e.g. glucose)
- Sterilize using an autoclave, then inoculate
- Often shake the culture to keep everything mixed and aerated — aerobes reach higher density; some instead grown anaerobically
- All cells are subjected to the same conditions during growth (key contrast with colonies on a plate)
- Initially food is abundant — but an overnight culture grows only ≈10–12 hours before nutrients are consumed and growth stops (this is the batch-culture story of section 4.4)
Solid media — filled in
- Add agar (derived from seaweed — sometimes expensive) or another agent to broth to make it semi-solid (“a hard Jell-O”)
- Place cells on the surface of the media (they can also be grown within it — pour plate)
- Colonies appear — each can arise from a single cell
- Cells in a colony experience different conditions — center vs. edge cells differ (edge cells may still be growing when center cells have stopped); in broth every cell sees the same environment
- Colony morphology differs between species — shape/appearance can help identify bacteria
The five media types — with the lecture examples
In-class question: what terms apply to MacConkey agar?
- It is Selective (bile salts keep most Gram-positives from growing — only Gram-negatives grow)
- It is Differential (lactose fermenters stain red, non-fermenters stay whitish)
- It is also Complex (peptone = a digest of gelatin — you cannot define its exact composition)
- It is NOT enriched — nothing like blood or a special growth agent is added
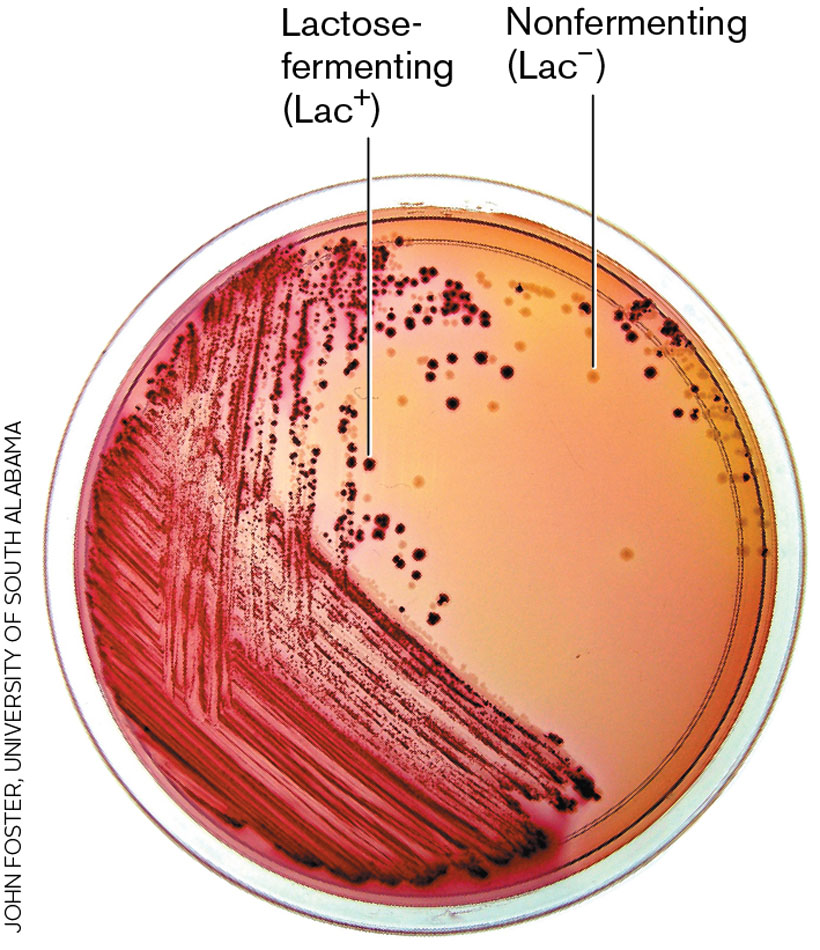
- MacConkey agar from the Lecture 2 slides: Lac+ (red) vs. Lac- (unstained) colonies — selective AND differential at once.
Isolation techniques — filled in
Dilution streaking (streak to single colony)
- Pick up a large number of cells on a loop or toothpick, drag across the agar surface
- Sterilize (flame/incinerator or fresh sterile loop) between passes, and pick up cells from the Previous streak, not the original sample; repeat 3–4 times
- Eventually you lay down single (isolated) cells in different spots on the plate
- Each cell (or clump) can form an isolated colony separated from the other
- Touch one colony with a sterile loop into fresh medium -> pure culture
- Caveat from the textbook narration: “1 cell = 1 colony” fails for chain/cluster formers (Streptococcus, Staphylococcus) — a clump of ≈10 cells = one colony-forming unit (CFU)
Spread plate
- Do serial (tenfold) dilutions — e.g., 1 ml into 9 ml = 1/10, repeated (a broth can need at least a 10^6 = million-fold dilution)
- Spread dilutions on the agar surface
- Each colony comes from a single cell (or CFU)
- Also used for determining the concentration of organisms in the sample (viable plate count)
- Volume limit: ≈200 ul max on a plate or the liquid pools and cells swim/move around before absorbing -> no isolated colonies. In our lab we plate 100 ul.
Counting cells — why and how (filled in)
- Usually done to determine the concentration of cells in a liquid (cells/ml)
- Only want to count LIVE cells; matters for research and diagnosis — e.g., the classic urine “clean catch” UTI count: skip the initial flow (skin/surface bacteria), catch midstream; delays let bacteria keep growing in the sample and inflate the count. Now labs mainly culture and check whether it is primarily ONE species.
- Scientists want the same number or same concentration of cells for experiments (e.g., antibiotic susceptibility testing)
Method comparison — the lecture pros & cons
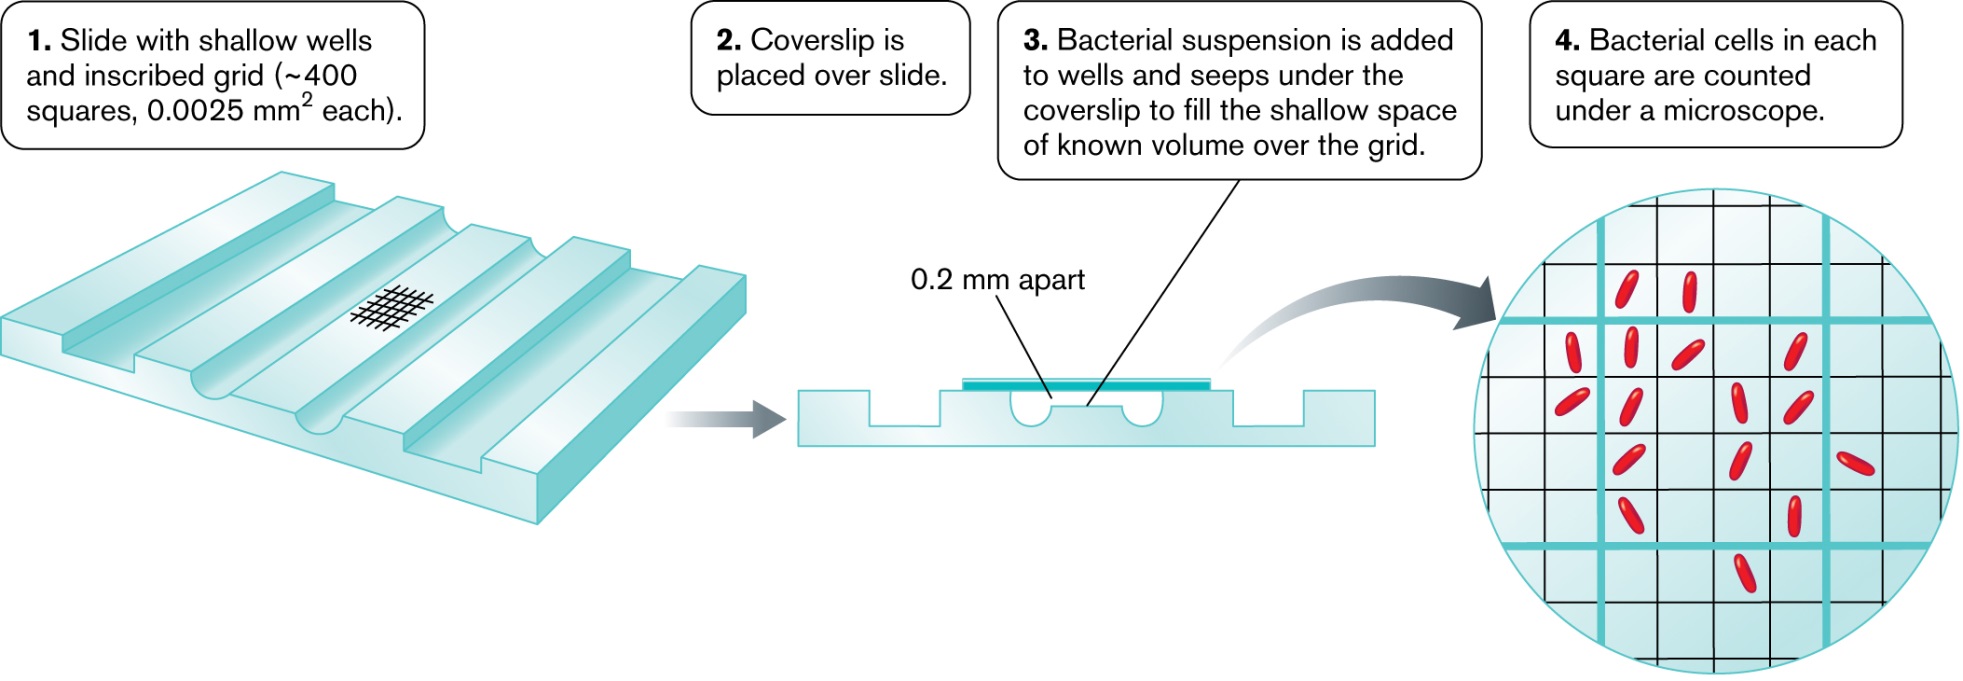
- Counting chamber from the Lecture 2 slides: grid of known area, coverslip at known height -> known volume per square; count under the microscope.
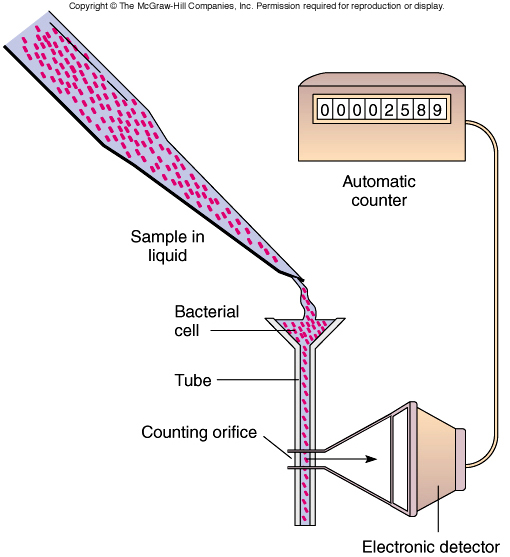
- Coulter counter (Lecture 2 slide only — NOT in Slonczewski 6e; the slide's figure is Cowan Fig 7.18, not a 6e figure): each cell passing the aperture interrupts the current and is counted — live or dead.
Viable plate count — the lecture numbers
- Serial tenfold dilutions -> plate aliquots -> incubate -> count colonies -> calculate CFU/ml
- Countable plate: the professor said aim for roughly 20–200 colonies (textbook says 30–300). >200–250: colonies merge, cannot count. Only ≈2: too much random variability.
- Spread plate = spread up to ≈100–200 ul on the surface (most common in our lab: 100 ul of several tenfold dilutions — remember to account for that 0.1 ml in the math)
- Pour plate = put the aliquot (can be a full 1 ml) in the empty dish, pour cooled molten agar over it, swirl; most colonies grow Within the agar and a few on the surface
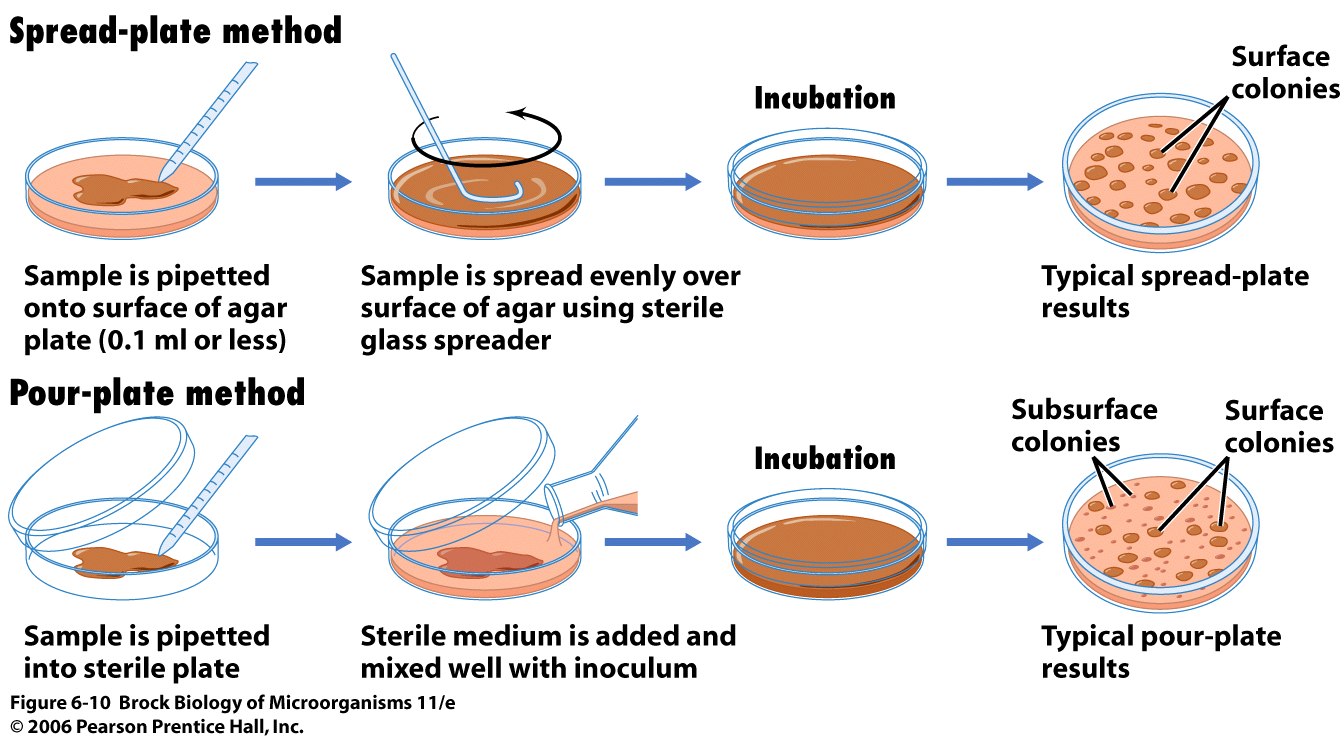
- Spread plate vs. pour plate (Lecture 2 slide): surface colonies vs. colonies embedded in the agar.
Optical density — the lecture numbers
- Cells BLOCK/scatter passage of LIGHT through the sample and Reduce transmittance; we read it like absorbance but it is really optical density (turbidity)
- Measure at 550–650 nm (OD600 typical) on ≈1 ml — a wavelength range where the medium itself does not absorb
- OD correlates with Cell mass per ml, not directly cells/ml -> need a conversion factor (e.g., 1 OD600/ml = 2×10^8 cells/ml) from a standard curve you measure (or look up) — and it differs between species/strains
- Linear only in a range: too high and not every cell is “seen” (curve flattens) -> dilute concentrated samples; too low (< ≈0.02) is noise
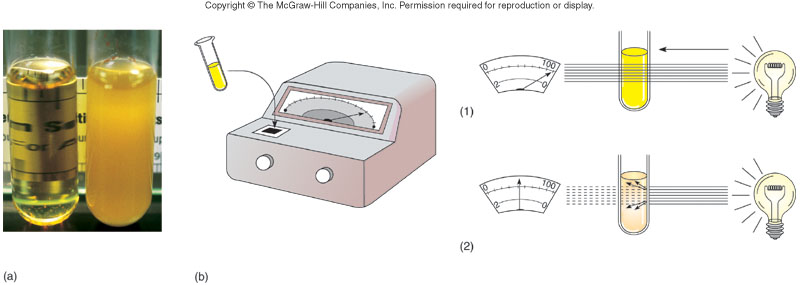
- Turbidity measurement (Lecture 2 slide): light in, cells scatter it, detector reads lower transmittance -> OD.
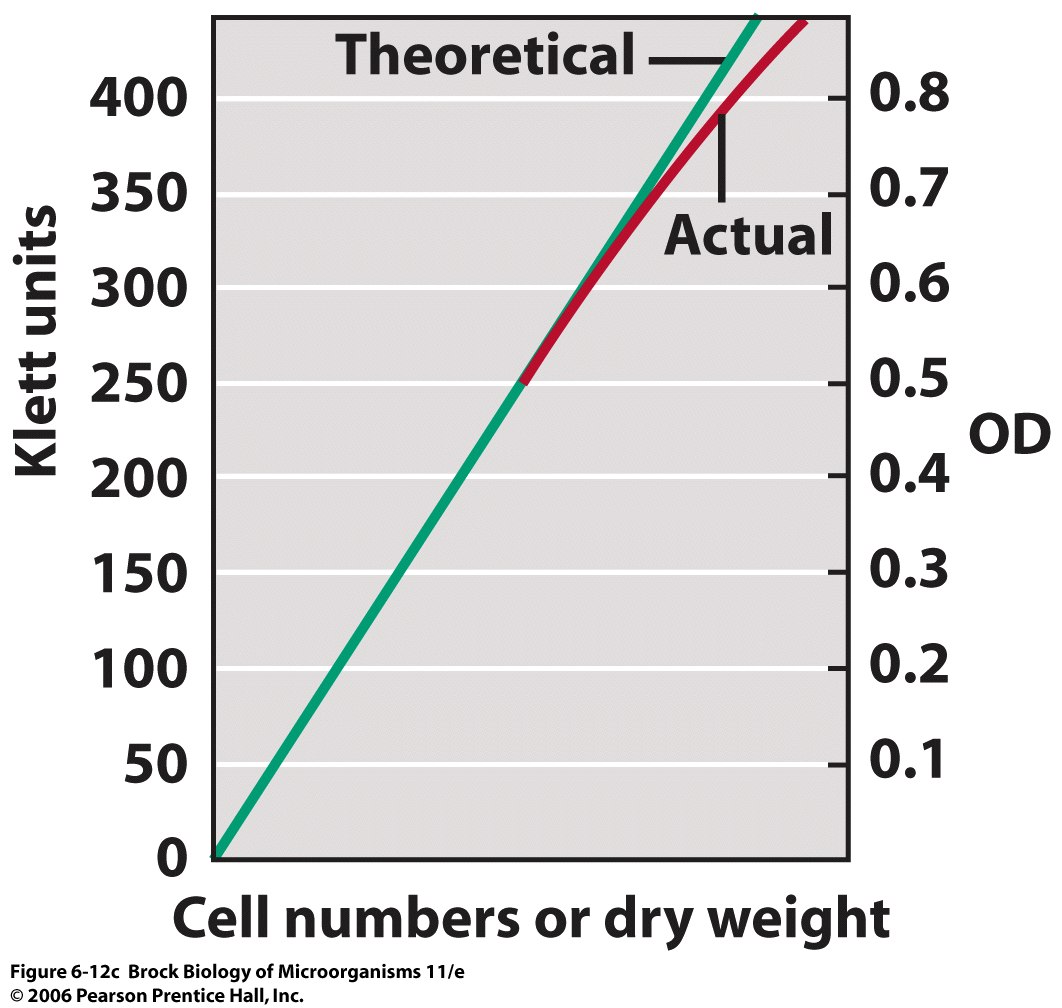
- OD vs. actual cell number: linear at first, then under-reads at high density — the reason you dilute before measuring.
The calculations he worked on the board
1) Diluting a culture: C1V1 = C2V2
- Cells/ml and OD/ml are concentrations — treat dilutions exactly like chemistry molarity problems; usually you solve for V1 (how much stock to add)
- Worked example (from class): overnight stock reads 2.0 OD600/ml; you want 5 ml at 0.1 OD/ml. V1 = (0.1 OD/ml x 5 ml) / 2.0 OD/ml = 0.25 ml = 250 ul of stock, then bring to 5 ml.
2) Converting OD to cells/ml
- Multiply the OD/ml reading by the previously determined conversion factor
- Worked example (from class): factor = 2.0×10^8 cells/ml per 1 OD600/ml; sample reads OD 0.5 -> 0.5×2.0×10^8 = 1.0×10^8 cells/ml. Once you have cells/ml you can dilute to any target count.
In-class questions to expect on the exam
- MacConkey agar: which media terms apply? -> selective + differential (and complex); NOT enriched.
- Clumping bacteria (e.g., Staphylococcus, average clumps of ≈10 cells): is a viable plate count Higher or LOWER than the true number of living cells? -> LOWER — one clump makes one colony. Microscope vs. plate count can differ up to ≈10-fold.
- If strain A cells are twice as large as strain B: 1 OD/ml of A has FEWER cells/ml than 1 OD/ml of B — OD tracks mass, not number.
- Why can’t you microscope-count a water sample directly? -> concentration too low (< 10^6/ml); concentrate it or do a viable plate count.
Lecture 2 Practice Quiz — Culturing & Counting (with Answer Key)
- Answers with explanations are in the key at the end — try the questions cold first. Built from the Lecture 2 slides + the in-class recording.
Multiple choice
- Q1. Roughly what fraction of bacteria have been successfully grown in the lab?
- A) ≈50%
- B) ≈10%
- C) ≈1%
- D) ≈0.1%
- Q2. Which set of terms correctly describes MacConkey agar?
- A) Defined and enriched
- B) Selective, differential, and complex
- C) Selective and synthetic
- D) Enriched and differential only
- Q3. Tryptone, a common ingredient of complex media like LB, is:
- A) A purified sugar
- B) A digest of milk protein
- C) A defined mix of amino acids
- D) An extract of seaweed
- Q4. Blood agar (complex medium + sheep blood) is the classic example of a(n) ________ medium.
- A) enriched
- B) selective
- C) differential
- D) defined
- Q5. During dilution streaking, why do you sterilize the loop and drag it through the Previous streak on each pass?
- A) To kill contaminants on the agar
- B) To progressively dilute cells until single cells are deposited
- C) To spread nutrients evenly
- D) To keep the agar from drying
- Q6. Staphylococcus grows in clusters of ≈10 cells. A viable plate count of a staph culture will be ________ the true number of living cells.
- A) higher than
- B) equal to
- C) lower than
- D) unrelated to
- Q7. Which plate is ideal to count in a viable plate count?
- A) ≈5 colonies
- B) ≈20–200 colonies
- C) ≈500 colonies
- D) A confluent lawn
- Q8. Why is a spread plate limited to about 100–200 ul of liquid?
- A) Larger volumes dilute the agar
- B) The liquid pools and cells move around before absorbing, ruining isolation
- C) The spreader cannot hold more
- D) Colonies would grow too large
- Q9. In a pour plate, most colonies grow:
- A) On the agar surface
- B) Within the agar
- C) On the lid
- D) In a liquid layer on top
- Q10. A microscope counting chamber requires a cell density of at least about:
- A) 10 cells/ml
- B) 10^3 cells/ml
- C) 10^6 cells/ml
- D) 10^12 cells/ml
- Q11. Which is a real limitation of BOTH the Coulter counter and the counting chamber?
- A) They need fluorescent dyes
- B) They cannot distinguish live from dead cells
- C) They take 18+ hours
- D) They only work on solid media
- Q12. Optical density of a bacterial culture is typically read at:
- A) 260–280 nm
- B) 340–380 nm
- C) 550–650 nm
- D) 700–900 nm
- Q13. OD600 most directly measures:
- A) The number of living cells
- B) Cell mass per ml (turbidity)
- C) DNA content
- D) Metabolic rate
- Q14. OD readings are accurate only in roughly what range?
- A) 0.02–1
- B) 1–10
- C) Any value
- D) Below 0.001
- Q15. Strain A cells are twice the size of strain B cells. At the same OD/ml, strain A has:
- A) More cells/ml than B
- B) Fewer cells/ml than B
- C) The same cells/ml
- D) Cannot be compared
Short answer & calculations
- Q16. Your overnight stock culture reads 2.0 OD600/ml. You need 5 ml at 0.1 OD/ml. How much stock do you add?
- Q17. A stock reads 1.6 OD600/ml. You need 4 ml at 0.2 OD/ml. How much stock?
- Q18. Conversion factor: 1 OD600/ml = 2.0×10^8 cells/ml. Your sample reads OD 0.5. Cells/ml?
- Q19. Same factor; the sample reads OD 0.25. Cells/ml?
- Q20. You plated 100 ul of the 10^-5 dilution and counted 150 colonies. What was the original concentration (CFU/ml)?
- Q21. Why was the urine ’clean catch’ protocol used for UTI diagnosis, and what were its two problems?
- Q22. Give two reasons a viable plate count underestimates, and one reason it is still preferred.
Show answer key — try the questions first
- Q1: D. The professor: about 0.1% as reported — most microbes live in multispecies communities and cannot grow alone.
- Q2: B. Bile salts = selective (Gram-negatives only); Lac+ red vs Lac- white = differential; peptone (gelatin digest) = complex. Not enriched — no blood/special agent.
- Q3: B. Digested milk (or soy) protein — supplies amino acids, so E. coli gets both carbon AND nitrogen from it.
- Q4: A. Enriched = complex medium plus a special added component that helps fastidious organisms grow.
- Q5: B. Each pass picks up fewer cells; by the last streak individual cells land in separate spots and grow into isolated colonies.
- Q6: C. One clump forms ONE colony (that is why it is a colony-forming UNIT). Plate vs microscope counts can differ up to ≈10-fold.
- Q7: B. Professor’s range 20–200 (textbook 30–300): above ≈200–250 colonies merge; a handful is statistically shaky.
- Q8: B. If the liquid does not absorb, bacteria swim/move and you do not get isolated colonies. Pour plates accept up to ≈1 ml because agar is poured over the sample.
- Q9: B. The aliquot is overlaid with cooled molten agar, so most cells end up embedded, with a few on the surface.
- Q10: C. You only view ≈10^-8 ml, so dilute samples (like most water samples) show nothing — concentrate them or use viable counts.
- Q11: B. Both count every particle/cell. Live/dead staining (green = live, orange/red = dead) or viable plate counts solve this.
- Q12: C. OD600 is typical — a range where the growth medium itself does not absorb.
- Q13: B. It is an Indirect measure: light blocked/scattered correlates with mass; converting to cells/ml needs a strain-specific conversion factor, and dead cells count too.
- Q14: A. Too high: not every cell is ’seen’ (curve flattens) — dilute first. Too low: signal is noise.
- Q15: B. OD tracks mass. Bigger cells = more mass each = fewer cells for the same OD. This is why conversion factors are species/strain-specific.
- Q16: C1V1 = C2V2 -> V1 = (0.1×5)/2.0 = 0.25 ml = 250 ul (bring to 5 ml total). [Worked in class]
- Q17: V1 = (0.2×4)/1.6 = 0.5 ml = 500 ul.
- Q18: 0.5×2.0×10^8 = 1.0×10^8 cells/ml. [Worked in class]
- Q19: 0.25×2.0×10^8 = 5.0×10^7 cells/ml.
- Q20: 150 colonies / 0.1 ml = 1,500 CFU/ml on that plate; x 10^5 for the dilution -> 1.5×10^8 CFU/ml.
- Q21: All urine picks up surface bacteria, so patients skipped the initial flow and caught midstream to sample the bladder. Problems: (1) contamination from the opening/skin anyway, (2) if the sample sat, bacteria kept growing and inflated the count. Modern practice: culture and check whether growth is primarily ONE species.
- Q22: Underestimates: cell clumping/chains (one clump = one colony) and some species will not grow on the chosen medium. Preferred because: it counts ONLY living cells and needs no expensive equipment.
- | Complex | Defined
- Composition known? | No | Yes
- Growth speed | Fast | Slow
- Good for | Just growing lots of cells | Studying metabolism
- Type | What it does | Format | Question it answers
- Selective | Kills/inhibits unwanted organisms | Agar plate | Who can grow?
- Differential | Both grow, but look different | Agar plate | Who does what?
- Enrichment | Boosts a rare organism’s numbers | Liquid broth | Where is the needle in the haystack?
- Ingredient | Role
- Bile salts + crystal violet | Selective, blocks Gram-positives
- Lactose | Fermentable carbon source
- Peptone | Nonfermentable carbon source (backup food)
- Neutral red dye | Differential, pH indicator
- Organism | Disease | Growth factor | Hook
- Haemophilus | Meningitis, chancroid | Hemin (X) + NAD (V) | Needs blood, grow on chocolate agar
- Legionella | Legionnaires’ disease | Cysteine | Lives in cooling towers, soil
- Bordetella | Whooping cough | Glutamate, proline, cysteine |
- Francisella | Tularemia | Complex + cysteine | From deer/rabbits
- Abiotrophia | Osteomyelitis | Vitamin K, cysteine |
- Mycobacterium | TB, leprosy | Nicotinic acid (NAD), alanine | M. leprae is Unculturable
- Shigella | Bloody diarrhea | Nicotinamide (NAD) |
- S. pyogenes | Pharyngitis, rheumatic fever | Glutamate, alanine |
- | Taxonomic groups | Novel species
- DC (implanted) | 6 | 40% novel
- SDP (direct plating) | 3 | 1 novel
- Dye | Color | Enters live cells? | Enters dead cells?
- Propidium iodide | Red | NO, can’t cross energized membranes | YES
- Syto-9 | Green | YES | YES
- Measurement | What it tells you
- Forward scatter | Particle size
- Side scatter | Shape / granularity
- Fluorescence intensity | Presence/amount of the targeted protein
- Method | How | Problem
- Dry weight | Centrifuge → wash → oven-dry → weigh | Very insensitive (cells weigh almost nothing → need huge volumes) and time-consuming
- Protein content | Sensitive protein assays | More accurate; protein correlates with cell number
- Method | Counts dead? | Bias | Speed
- Direct microscope count | Yes | Overestimates living | Fast
- Live/Dead stain | Distinguishes | Accurate for live/dead | Fast
- Flow cytometry/FACS | Depends on label | Also sorts + measures traits | Fast
- Viable count (CFU) | No | Underestimates (damage, clumps) | Slow (needs incubation)
- Dry weight / protein | Yes | Biomass, not cell number | Slow
- Optical density | Yes | Approximate; bad in stationary phase | Fastest
- Standard PCR | Yes | Overestimates (dead DNA, multi-chromosome) | Fast
- Viability PCR | No | Living only | Fast
- Term | What it is | Format | Purpose
- Enriched medium | Complex medium + extras (blood, etc.) | Usually plate | Grow fastidious organisms that otherwise won’t grow
- Enrichment medium | Composition favors one species over others | Broth | Multiply a rare species so you can find it
- Term | Precise meaning
- Pure culture | One strain/species; all descended from a single cell
- Colony | Visible cluster from one founding microbe, a clone, except for rare mutations
- Confluent | Growth covering the entire surface, a lawn; too dense to count
- Viable | Capable of replicating (that’s the whole definition)
- Uncultured | Culture requirements remain unknown, not “impossible”
- Growth factor | Compound needed by only certain cells
- Intensity | Example | Lab fix
- Mild, lost a few pathways | S. pyogenes needs glutamate + alanine | Add the growth factor
- Severe, needs its community | CPR bacteria, sponge microbes | iChip, diffusion chamber, co-occurrence
- Total, needs a host cell | Rickettsia prowazekii | Tissue culture / chicken eggs; never axenic
- Type | Definition (slide) | Lecture example / detail
- Complex | Nutrient-rich but poorly defined (a digest of a protein) | Tryptone = digested milk (or soy) protein -> supplies amino acids, so E. coli gets both carbon AND nitrogen from it. Yeast extract = yeast cells grown, killed, broken open. LB (used in our lab for E. coli and Pseudomonas) = tryptone + yeast extract.
- Synthetic / defined | Known composition, specific chemicals added | M9: ammonia (N), minerals, glucose (C) — you know exactly what is in it. Also the sulfur-oxidizer medium: CO2 + sulfur for unusual chemautotrophs.
- Enriched | Complex media + additional special components | Blood agar — complex medium + sheep blood; something in blood helps certain fastidious organisms grow. “Enriched” usually means blood or another special agent was added.
- Selective | Certain species can grow, others cannot | Bile salts (from the intestine) inhibit most Gram-positives -> selects for Gram-negatives.
- Differential | Multiple types grow but look different (usually a color change) | Lactose fermenters vs. non-fermenters on MacConkey: Lac+ colonies red, Lac- whitish.
- Method | Pros (blanks filled) | Cons (blanks filled)
- Counting chamber (Petroff-Hausser; hemocytometer for blood) | FAST (minutes). Equipment needs are CHEAP — just a special gridded slide + a standard microscope. Can count Individual cells within an attached cluster. | Counts DEAD cells along with LIVE cells. Needs HIGH density (> 10^6/ml). Can be Inaccurate — you count a tiny aliquot (≈10^-8 ml), so repeat counts vary by chance. Bacterial chambers have a smaller gap than blood ones.
- Live-Dead fluorescent stain | Distinguishes live (green) from dead (orange/red) cells; counting can be automated. | Needs fluorescent dyes + fluorescence microscope.
- Coulter counter (electronic) | Automated; cells passing a narrow opening disrupt conductivity and are counted. | Does not distinguish LIVE vs DEAD. Not all counters can detect bacteria (too small) — used more for larger eukaryotic cells.
- FACS (fluorescence-activated cell sorting) | Counts AND measures properties of each cell (e.g., GFP+ vs GFP-, size), and can SORT into batches. | Expensive; sample must be liquid; more common for eukaryotic cells (e.g., blood).
- Viable plate count (CFU) | Does not require Expensive equipment. Measures only Living cells — usually what you want. | Takes TIME (>= 18 h, overnight ≈12 h; slow growers longer). Count is LOW due to clumping (CFU ≠ cell). Some species/cells will not grow on the medium at all.
- Optical density (spectrophotometer) | Simple, fast, cheap; great for tracking growth. | Indirect measure (really cell MASS/ml). Needs a Conversion factor for cells/ml. Inaccurate below OD ≈0.02 and above ≈1 (dilute high samples). Detects Both live and dead cells. Species differ in size -> different factors.
Microbiology, Section 4.4 study notes
Contents
Right-click here and choose Update Field to build the contents.
Part 1: How cells divide
Binary fission (the standard)
Sequence:
- Cell increases in length and mass
- That expansion lets the nucleoid expand as DNA replicates
- As replication nears completion, complex genetic signals trigger midcell septum synthesis
- Septum separates → two equal daughter cells
- Definition (glossary): one cell → two genetically equivalent daughter cells of equal size.
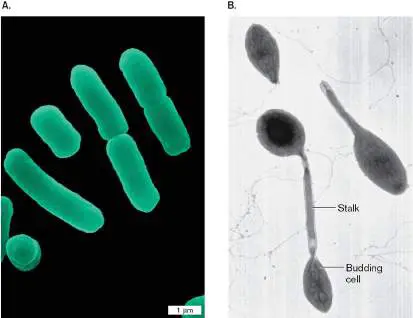
- Figure 11. Symmetrical and asymmetrical cell division: binary fission in Lactobacillus (A) and budding in Hyphomicrobium (B).
- Source: Slonczewski & Foster, Microbiology: An Evolving Science, 6e, Fig. 4.21
Asymmetric division (the exceptions)
Eukaryotic microbes
- Divide by mitosis, segregation of paired chromosomes within a nucleus. Some also have complex life cycles with budding and multiple morphological forms.
Multiple fission (the weird one)
Pleurocapsa minor (cyanobacterium):
- Cell enlarges without dividing
- Then suddenly divides many times without separating
- The cell mass breaks open → releases dozens of daughter cells
- So the “2ⁿ” rule is not universal.
- Analogy: a seed pod bursting vs. a cell splitting in half.
Part 2: Planktonic vs. biofilm (why we study what we study)
- In nature, microbes live in biofilms, complex, mixed-species communities on solid surfaces
- Measuring one species’ growth inside a biofilm is very hard
- Planktonic cells = free-living single cells that separate from the biofilm
- Glossary: an isolated cell growing individually in liquid, no connections to other cells
- All the growth math in this section applies to planktonic cells
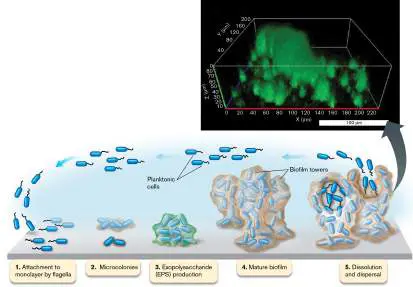
- Figure 12. Biofilms, the state most microbes actually live in outside a flask: a streambed slime biofilm (A) and dental plaque (B).
- Source: Slonczewski & Foster, Microbiology: An Evolving Science, 6e, Fig. 4.29
Part 3: Exponential growth
- The law: growth rate (increase in cell number or biomass) is proportional to the population size at that time.
- That proportionality is what makes the curve exponential, a slope that continually increases.
The core equation:
- n = number of generations
- Example: 1 cell, n = 3 → 1 × 2³ = 8 cells
Exponential vs. linear, know the difference:
- Exponential: 1 → 2 → 4 → 8 (multiplied by a fixed amount)
- Linear: 1 → 2 → 3 → 4 (increased by a fixed amount)
Why we care (memorize these three)
- How fast a pathogen causes disease
- How fast food spoils
- How fast an oil-eating bacterium remediates a spill
- (Biotech) How fast a commercial by-product gets made
Part 4: The math, step by step
Generation time (g) = doubling time
- Definition: the constant interval at which bacteria divide when resources are unlimited.
- Critical caveat from the text: not all cells divide at the same instant. Every cell has an equal generation time, but each divides at a slightly different moment, which is why the curve is smooth, not stair-stepped.
- Varies with: species, medium type, temperature, pH.
- Benchmark to memorize: E. coli in complex medium = 20 minutes. One cell → 8 cells in one hour (3 generations).
Solving for n
- Start with , take log₂:
Base-10 version (since log₁₀2 = 0.301):
- Memorize 3.3. You’ll use it more than the base-2 form on a calculator.
Generation time
- Example: 120 min, 6 generations → g = 20 min
Growth rate constant (k)
- Units: generations per hour
- Mnemonic: g and k are flip sides of the same coin. Long generation time = small k.
Getting k from a graph
- Plot log₂ OD₆₀₀ vs. time → straight line
- k = slope
- Example: slope 0.0452/min × 60 min/h = 2.7 generations/hour
- The steeper the slope, the faster the dividing
- Why units of N don’t matter: you’re always working with ratios (N₁/N₀), so OD, cells/ml, or anything proportional works.
The OD table from the text, note what’s happening:
- OD is curving upward, but log₂ OD rises by ≈0.68 every 15 min, a straight line. That’s the whole point of log plots.
- Fig 4.22 A vs B: Linear scale = curve. Log scale = straight line. Same data.
Part 5: Batch culture, the four phases
- Batch culture = closed system (a flask). No fresh medium added. Nutrients decline, waste accumulates.
- The big idea: deteriorating conditions profoundly change bacterial physiology, membrane composition, cell size, metabolic pathways all shift, and all of it affects generation time. Bacteria have self-preserving mechanisms that slow growth Before cells lose viability.
- Analogy: a car that downshifts and turns off the AC before it runs out of gas, rather than driving flat-out until it dies.
- Figure 13. The growth curve. Linear scale (A) versus logarithmic scale (B), same data: lag, exponential, stationary, death.
- Source: Slonczewski & Foster, Microbiology: An Evolving Science, 6e, Fig. 4.22
① Lag phase
- Cells do NOT divide. They’re retooling.
What causes the delay:
- Cells from an aged culture may be damaged → need repair time
- New carbon/nitrogen/energy sources must be sensed → appropriate enzyme systems synthesized
- Varies with temperature, pH, salt concentration, nutrient richness
The key contrast (exam material):
- Mnemonic: “Lag = Learning the new kitchen.” Bigger the change, longer the lag.
② LOG / Exponential phase
- The linear part of the curve (on a log plot)
- Balanced growth = all cell components synthesized at constant rates relative to each other, this is the assumption behind every generation-time calculation
- Cells growing at the maximum rate possible for that medium and those conditions (temp, pH, osmolarity)
- Cells are Largest at this stage
- Why the curve is smooth, not steps: batch cultures are not synchronous. If they were, you’d see instant doublings as a staircase.
Unbalanced growth: shifts
- If the cell fails to adjust: increased mistakes in RNA, protein, and DNA synthesis, depletion of energy stores, and ultimately death.
- Analogy: a downshift is a pay cut. If you keep spending at the old rate, you go bankrupt. The cell must consciously scale back ribosome production.
The honesty caveat
- The smooth exponential curve doesn’t always hold in nature or in complex media with multiple carbon sources. Some species show odd-looking growth curves as they deplete one carbon source and switch to another. Even E. coli doesn’t have uniform log-phase metabolism in complex medium. It smoothly transitions through a series of metabolic states.
③ Late log phase
- Cell density rises → rate of doubling slows
- A new set of growth-phase-dependent genes is expressed
- Quorum sensing begins, species detect each other by sending and receiving chemical signals
- Analogy: the room getting crowded and people starting to talk to each other about it.
④ Stationary phase
- Cause: lack of a key nutrient or buildup of waste products. Curve levels off, no net increase.
The old model vs. the new model
- OLD (now challenged): rate of division = rate of death. Cells are either dead or alive.
NEW, THREE types of stationary-phase cells:
- This is the single most important conceptual update in the section. It’s also why viable counts undercount and why the death phase drags on forever.
What culturable stationary E. coli actually does
Molecular reprogramming, four changes:
- Decreases its size, minimizes cytoplasm volume relative to nucleoid volume → fewer nutrients needed to sustain the smaller cell
- New stress-resistance enzymes to handle oxygen radicals
- Protects DNA and proteins
- Increases cell wall strength via more peptidoglycan cross-linking
- Result: more resistant to heat, osmotic pressure, pH changes, and other stresses “while waiting for a new supply of nutrients.”
- Alternative strategy: Bacillus subtilis responds to nutrient depletion by differentiating into resistant spores (Section 4.6).
- Mnemonic: “Stationary = Smaller, Stronger, Stress-proof.”
- Analogy: hunkering down for winter. Shrink, thicken the walls, store nothing you don’t need.
Part 6: Growth arrest, the three studies
Study 1: Questembert-Balaban (Hebrew University), E. coli is alive, not dead
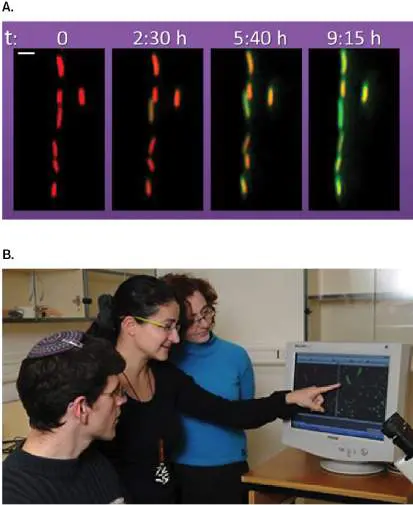
- Figure 14. Dormant stationary-phase E. coli trapped in a microfluidic channel are still making new protein: alive, not dead.
- Source: Slonczewski & Foster, Microbiology: An Evolving Science, 6e, Fig. 4.23
- Claim proven: the vast majority of E. coli thought to have died in stationary phase are alive but growth-arrested, and can still make protein.
Method (Fig 4.23A):
- E. coli expressing a red fluorescent protein grown to stationary phase for 15 hours
- Trapped in a microfluidic channel (t = 0)
- Added a chemical inducer for a second gene encoding green fluorescent protein
- Waited 9 hours
Result:
- ZERO cells had divided
- ≥90% had made the new green protein
- Conclusion: alive + metabolically capable, but growth-arrested. Protein synthesis ≠ replication.
- Elegance of the design: red = “you were here before”; green = “you can still work.” Two colors separate identity from activity.
Study 2: Dworkin (Columbia), the mechanism in B. subtilis
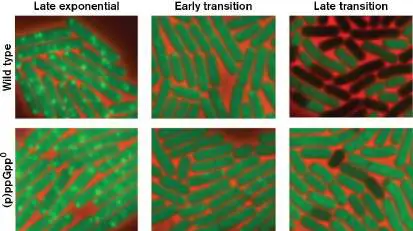
- Figure 15. ppGpp and pppGpp inhibit protein synthesis in Bacillus subtilis stationary-phase cells.
- Source: Slonczewski & Foster, Microbiology: An Evolving Science, 6e, Fig. 4.24
- Molecules: (p)ppGpp = guanosine tetraphosphate (ppGpp) + guanosine pentaphosphate (pppGpp)
- Associated with the stringent response of starved cells (Ch. 10)
- Accumulate during the transition to stationary phase
- Inhibit protein synthesis → produce growth-arrested cells
- Mechanism: at high concentration they competitively bind and inhibit initiation factor IF2, which normally binds GTP
- Payoff: slowing protein synthesis saves considerable energy and helps transition to a quiescent state
- Why it works chemically: ppGpp/pppGpp are GTP look-alikes. IF2 grabs them by mistake, and translation initiation stalls.
- Fig 4.24 design: green fluorescence = active protein synthesis, measured by incorporation of a puromycin analog into nascent chains. Compared wild-type (can make (p)ppGpp) vs. mutant (cannot) at 1.5 h (exponential), 6 h (early stationary), 13 h (late stationary).
- Mnemonic: “ppGpp is the brake pedal, a fake GTP that jams the translation ignition.”
Study 3: Harwood lab (U. Washington), longevity genes in R. palustris
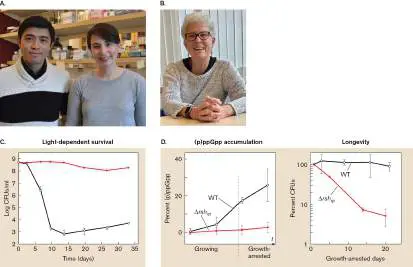
- Figure 16. Identification of longevity genes in growth-arrested Rhodopseudomonas palustris.
- Source: Slonczewski & Foster, Microbiology: An Evolving Science, 6e, Fig. 4.25
- Organism: Rhodopseudomonas palustris, phototrophic Gram-negative, found in aquatic environments incl. marine coastal sediments
- People: Kieran Pechter, Liang Yin, in Caroline Harwood’s lab
- Finding: can stay growth-arrested for months during carbon or nitrogen restriction, but only in the presence of LIGHT (Fig 4.25 °C: red line = light, black line = dark).
The universal rule this reveals:
- Growth-arrested cells of any species must maintain an electrochemical membrane potential to provide energy.
- R. palustris uses photosynthesis to maintain that potential during starvation.
- Why this organism was the perfect tool: it can separate energy production from carbon use. So researchers could ask which genes besides photosynthesis genes are needed for dormancy.
Methods:
- Random insertions into the genome → screen for genes needed to survive dormancy
- RNA sequencing (RNA-seq) → identify RNAs made during growth arrest
- Result: 117 longevity genes.
- The star gene: rshᵣₚ, encodes a (p)ppGpp synthesis/hydrolase enzyme
- The rshᵣₚ mutant made very minimal (p)ppGpp in stationary phase
- Had a severe longevity defect
- Confirms (p)ppGpp’s role in triggering growth arrest, now in a second organism
- Fig 4.25D math: % (p)ppGpp = (ppGpp + pppGpp) / (GTP + ppGpp + pppGpp). Measured at early log, late log, early arrest, arrest.
- Ecological payoff: longevity + light-powered proton motive force = survival advantage in nutrient-depleted water like the ocean.
- The through-line of all three studies: (p)ppGpp is the master switch for dormancy, and dormancy is not death.
Part 7: DEATH / Decline phase
- Cells die as unrepaired free-radical damage accumulates
- Even growth-arrested cells eventually die
- Death rate is logarithmic, the number dying in a period is proportional to the number present at the start
- It’s a negative exponential function (mirror image of growth)
- Expressed as a half-life = time for the population to decline by half
- Why it matters: food preservation and antibiotic development (Ch. 5, 16, 27)
Why exact death rates are hard to define, three reasons:
- Mutations arise that promote survival
- Cannibalization of dead cells by live cells
- Growth-arrested cells that seem dead but aren’t
- Consequence: death phase is extremely prolonged. A portion of cells often survives for months in dormant/growth-arrested states.
- Mnemonic: “Death phase is a long goodbye.” It never cleanly hits zero.
Part 8: Continuous culture & the chemostat
- Problem with batch culture: exponential phase spans only a few generations.
- Solution, open system: fresh medium continuously added, equal amount of culture continuously siphoned away → population held in exponential phase at constant cell mass indefinitely.
- Steady state = all cells at a constant growth rate → permits detailed physiology analysis at different growth rates.
The chemostat
- Definition: a continuous culture system where the diluting medium contains a limiting amount of ONE essential nutrient.
The textbook’s GI tract analogy:
- Nutrient enters at the mouth → passes through intestine → feeds microbiome → exits as fecal waste
- Microbe numbers stay relatively constant
- Differences: intake and exit volumes are not continuous or equal, and water is absorbed
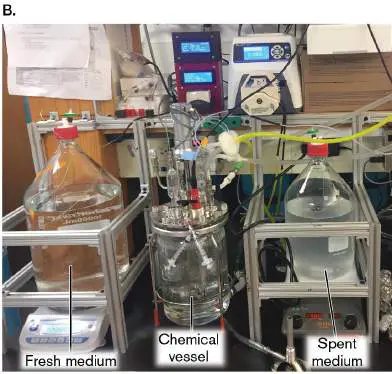
- Figure 17. The chemostat: fresh medium in, culture out, the population held in exponential phase.
- Source: Slonczewski & Foster, Microbiology: An Evolving Science, 6e, Fig. 4.26
Dilution rate relationships (Fig 4.27): read this carefully
- As dilution rate ↑: generation time ↓ and cell mass ↑, until washout.
- Analogy: a sink with the tap running and the drain open. Turn up the tap and the water level rises to a new stable point. Turn it up too far and the water blasts straight out the drain faster than it fills.
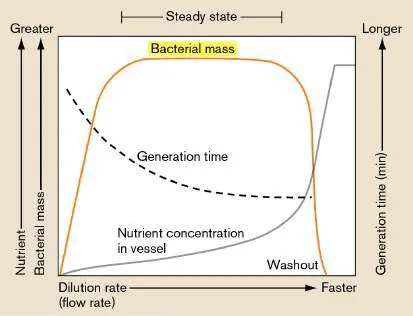
- Figure 18. Steady-state relationships in the chemostat: dilution rate against cell mass and generation time.
- Source: Slonczewski & Foster, Microbiology: An Evolving Science, 6e, Fig. 4.27
Uses
- Key advantage over batch culture: the physiology of the cells is Homogeneous.
- Industry: optimize production of antibiotics, beer, and other microbial products
- Research: study metabolic flux (rate molecules move through pathways) before/after altering a biochemical step; long-term bacterial evolution studies
Part 9: Thought Question answers
4.7: Influenza (800 progeny per infected cell)
- Math: replace the base 2 with 800:
- where n = number of infection cycles (not cell divisions). Generalized: where B = burst size.
Practical limits:
- Finite number of susceptible host cells, the real ceiling
- Many progeny are defective particles that can’t infect
- Host immune response (interferon, antibodies) neutralizes particles
- Host cells die, removing the factory
- Cells must be both susceptible (right receptor) and permissive (right internal machinery)
- Spatial/physical constraints, a virion must physically reach a new cell
4.8: Sinorhizobium meliloti doubling time
- Given: N₀ = 1, Nₜ = 10,000, t = 120 hours
- Sanity check: 2¹³ = 8,192 and 2¹⁴ = 16,384, so ≈13.3 generations is right. This is very slow, typical of a symbiont inside plant cells.
4.9: How E. coli beats its own replication time
- Answer: multifork replication (overlapping replication rounds).
- The chromosome takes 40 min to copy + 20 min to prepare = 60 min of work, but generation time is 20 min. The cell doesn’t wait. It initiates a NEW round of replication before the previous one finishes. Multiple replication forks run on the same chromosome simultaneously.
- Consequence: at fast growth, a cell contains more than one chromosome equivalent of DNA. A newborn cell is already partway through replicating the chromosomes for its grandchildren.
- Analogy: “the cell is born pregnant.”
- Connects back to: this is exactly why standard PCR overestimates cell number, fast-growing cells hold multiple chromosome copies.
4.10: Acidithiobacillus thiooxidans growth curves
(a) Different starting densities (4×10⁵, 10⁶, 10⁷, 10⁸), SAME sulfur:
- Four parallel lines with identical slopes (same growth rate)
- Offset horizontally, lower starting density takes longer to reach plateau
- ALL plateau at the SAME maximum: 10⁹ cells/ml
(b) Same starting density, Different sulfur concentrations:
- All start at the same point with the same slope
- Each plateaus at a Different final density, proportional to the sulfur supplied
The principle both parts test:
- Nutrient concentration sets the growth YIELD (final density). Starting number sets WHEN you get there. Neither changes the slope, until nutrient is so scarce it becomes rate-limiting.
4.11: Two carbon sources (one preferred, growth-limiting)
- Answer: Diauxic growth (diauxie), a two-step growth curve.
- Shape: exponential growth on the preferred source → plateau / intermediate lag → second, usually slower exponential phase on the non-preferred source → final stationary phase.
- Why the middle lag: the cell must sense the switch and synthesize new enzymes for the second substrate.
Mechanism, this is why Fig 10.12 is attached:
- Catabolite repression + inducer exclusion
- Glucose transport via the PTS (phosphotransferase system): PEP feeds phosphate into the PTS, which relays it to glucose during transport
- Glucose continually siphons off the phosphate → unphosphorylated IIA^Glc is high
- Unphosphorylated IIA^Glc inhibits LacY (lactose permease) → lactose can’t enter
- No glucose → phosphorylated IIA^Glc and IIBC^Glc accumulate → can’t inhibit LacY → LacY imports lactose → lac operon induced
- Mnemonic: “Unphosphorylated IIA^Glc = the doorman that locks LacY.”
4.12: Modifying the equations for death
Flip the sign of the exponent:
- g becomes half-life, time for the population to halve
- k becomes negative, the slope of log₂N vs. time points downward
- Everything else is identical; growth and death are the same function with opposite sign
4.13: Why are log-phase cells larger?
Three reasons:
- Balanced growth at maximum rate, nutrients are abundant, so macromolecular synthesis (especially ribosome synthesis) runs flat out. Mass accumulates faster than division can keep up, so cells are simply bigger when they divide.
- Multifork replication (from 4.9), fast growth means more DNA per cell, and a bigger nucleoid needs a bigger cell.
- Stationary-phase cells actively shrink, it’s not passive. E. coli deliberately decreases size to minimize cytoplasm volume relative to nucleoid volume, so fewer nutrients are needed to sustain it.
- Mnemonic: “Rich cells are fat cells. Starving cells downsize on purpose.”
Master mnemonic set for 4.4
- “Lag, Log, Level, Lose”: the four phases (Lag → Logarithmic → Level off/stationary → Lose cells/death)
- “Lag = Learning the new kitchen”: bigger the medium change, longer the lag
- “Stationary = Smaller, Stronger, Stress-proof”: E. coli’s four adaptations
- “ppGpp is a fake GTP that jams IF2”: the growth-arrest brake
- “Dormant ≠ dead”: three cell types in stationary phase; the reason death phase drags for months
- “Inoculum shifts sideways, nutrient shifts the ceiling”: TQ 4.10
- “The cell is born pregnant”: multifork replication, TQ 4.9
- “Chemostat = sink with tap and drain; too much tap = washout”
Lecture 2 Companion — Growth-Cycle Points Made in Class (Aug 26, 2026)
- Lecture 2 “Methods Part 1” was mostly section 4.3 (culturing & counting), but the professor set up section 4.4 with these batch-culture points. Bold orange = blanks from the student slides, filled in from the recording.
Batch (broth) culture — the setup for the growth curve
- In a shaken broth, all cells are subjected to the same conditions — that is why batch cultures are used to study physiological changes in cells
- Initially food is abundant, but a typical overnight culture grows only ≈10–12 hours before the nutrients are consumed and growth stops -> this is exactly the lag -> log -> stationary story of this section
- Contrast with a plate: cells in the Middle of a colony may have stopped growing while cells at the EDGE are still dividing — different microenvironments within one colony
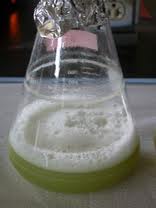
- Broth culture from the Lecture 2 slides: shaken/aerated so every cell sees the same conditions.
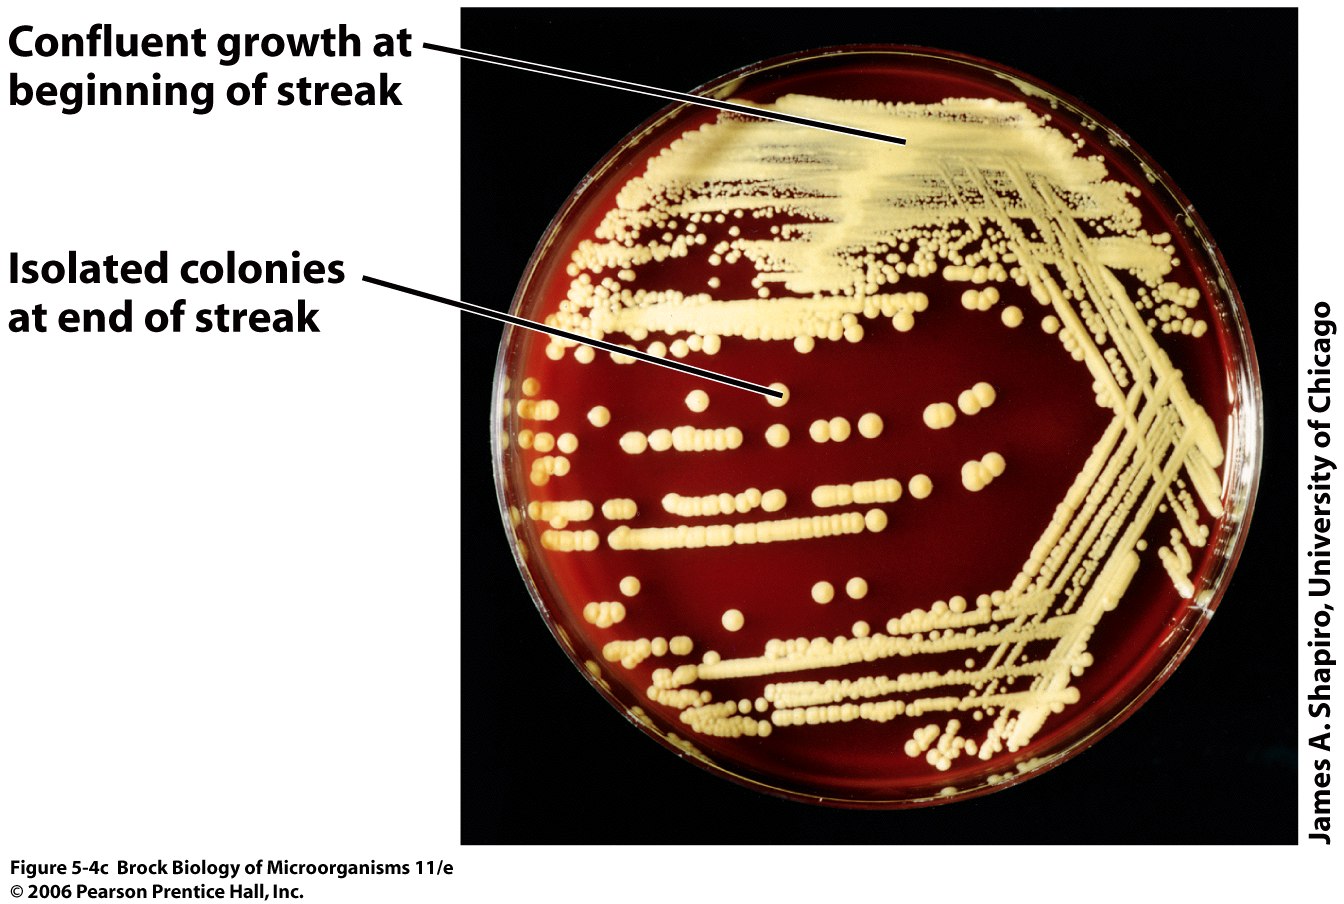
- Colonies on solid media (Lecture 2 slides): each can start from a single cell; distinctive colony morphology helps identify species.
Counting connects to the growth curve
- Colonies need >= 18 h to appear (overnight ≈12 h for fast growers like E. coli) — and some species take much longer; that lag is why viable counts are slow
- OD is the workhorse for Following a growth curve, but it reads cell mass (live + dead) and is only linear between roughly OD 0.02 and 1 — dilute denser samples
- Log-phase cells are larger (this guide, Part 9, Q4.13) — and the lecture point that OD tracks MASS means the OD-to-cells conversion factor even changes with growth phase/species size
Lab heads-up from class
- We will do viable plate counts and use the spectrophotometer in lab; know the C1V1 = C2V2 dilution math and the OD -> cells/ml conversion (worked examples are in the 4.3 study guide companion)
Lecture 2 Practice Quiz — Growth-Cycle Connections (with Answer Key)
- Answers with explanations are in the key at the end — try the questions cold first. Built from the Lecture 2 slides + the in-class recording.
Multiple choice
- Q1. A typical overnight E. coli broth culture actively grows for about:
- A) 1–2 hours
- B) 10–12 hours
- C) 24–36 hours
- D) A week
- Q2. In a shaken batch (broth) culture, all cells experience the same conditions. On an agar plate colony, cells:
- A) Also all experience identical conditions
- B) Differ — e.g., edge cells may still grow while center cells have stopped
- C) Are all dead in the center
- D) Never stop growing
- Q3. Colonies take at least ________ to become countable for fast growers like E. coli.
- A) 30 minutes
- B) 2–3 hours
- C) 12–18 hours
- D) 1 week
- Q4. Why does the OD-vs-cell-number curve flatten at high density?
- A) Cells shrink
- B) Not every cell is detected at high turbidity, so OD under-reads
- C) The spectrophotometer overheats
- D) Cells stop scattering light
- Q5. Log-phase cells are larger than stationary-phase cells. What does that mean for one OD-to-cells/ml conversion factor used across a whole growth curve?
- A) It stays perfectly accurate
- B) It drifts, because OD tracks mass and cell size changes with phase
- C) OD cannot be measured in log phase
- D) Nothing — OD counts cells directly
Show answer key — try the questions first
- Q1: B. Then nutrients are consumed and growth stops — the culture enters stationary phase.
- Q2: B. This is why batch cultures are used to study physiological change — every cell is in the same state at the same time.
- Q3: C. Overnight (≈12 h) for fast growers; the professor said at least 18 h to be safe, and slow growers take much longer.
- Q4: B. That is why you dilute dense cultures into the linear range (≈OD 0.02–1) before reading.
- Q5: B. Conversion factors are strain- AND condition-specific; cell size changes shift the mass-per-cell.
- Organism | Pattern
- Caulobacter | Stalked cell fixed to a surface; buds off small, unstalked motile swarmer cells. Swarmer loses flagellum → grows stalk → divides → makes new swarmer (Fig 3.30)
- Hyphomicrobium (marine) | Buds; releases a smaller cell from a stalked parent
- g | k
- 20 min (0.33 h) | 1/0.33 = 3 gen/h
- 2 hours | 0.5 gen/h
- Time (min) | OD₆₀₀ | log₂ OD₆₀₀
- 0 | 0.05 | –4.32
- 15 | 0.08 | –3.65
- 30 | 0.13 | –2.94
- 45 | 0.20 | –2.32
- 60 | 0.33 | –1.59
- Transfer | Lag length | Why
- Complex → fresh complex | Very short | Everything’s still provided
- Complex → minimal defined | Protracted | Must now synthesize all amino acids, nucleotides, metabolites that were previously handed to it
- Shift | Definition | Consequence
- Nutritional downshift | Good carbon source (glucose) → poorer one (succinate) | Must make different enzymes; must slow generation time because the high rate of macromolecular synthesis (esp. ribosome synthesis) can’t be sustained on a lower-energy source
- Nutritional upshift | Move to a better carbon source | Also unbalanced, must ramp up
- Type | Can form colonies? | Alive?
- Culturable | Yes | Yes
- Growth-arrested / dormant | No | YES
- Truly dead | No | No
- Dilution (flow) rate | What happens
- Very low | Nutrient so limiting → cells divide very slowly, cell mass low
- Increasing | More limiting nutrient available → cells grow faster, cell mass increases, generation time decreases
- Constant | Division rate and cell mass stay constant, the amount of culture removed exactly compensates for the increased division rate
- Too fast | Cells removed faster than they can be replaced → cell density drops = Washout
Figures are from Slonczewski & Foster, Microbiology: An Evolving Science, 6e (the course textbook), plus screenshots from Dr. Rowen's lecture slides where noted.
Contents
Right-click here and choose Update Field to build the contents.
The framing: three words that are not synonyms
Nearly every question this chapter can ask turns on keeping three words apart. Rowen put the distinction on a slide and then asked the class which one matters most.
| Term | Definition | What it buys you |
|---|---|---|
| Detection | The ability to determine that an object is PRESENT | You can see a cloudy culture tube or a spot of mould without resolving a single cell. A hundred million cells per ml reads as haze |
| Resolution | The smallest distance between two objects at which they are still seen as TWO objects | This is the real currency. Without it, magnification adds nothing |
| Magnification | An increase in the APPARENT size of the image | It spreads detail far enough apart for your retina to register it, and nothing more |
The answer to 'which is most important' is RESOLUTION. Magnification without added resolution has its own name, empty magnification: an image made of dots does not gain detail when you enlarge it on a photocopier. Rowen made the same point with pixels on a display.
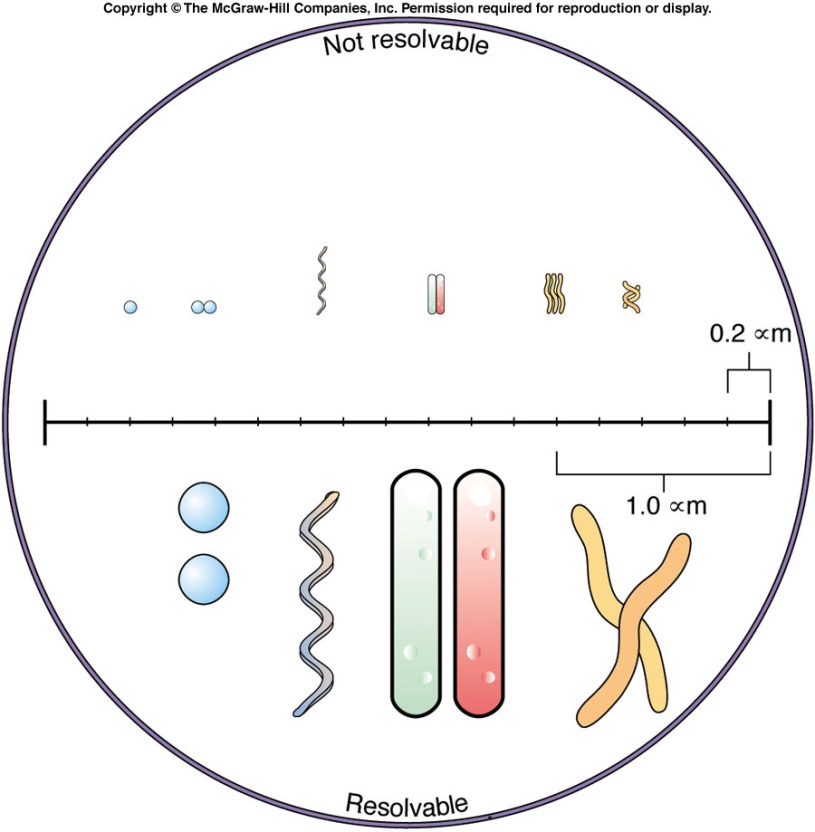
- Figure 19. The slide that poses the question directly: increase magnification, improve resolution, improve detection, which matters most?
- Source: Dr. Rowen, BIOL 4640 Lecture 4 slides (lec04_s43_24.jpg)
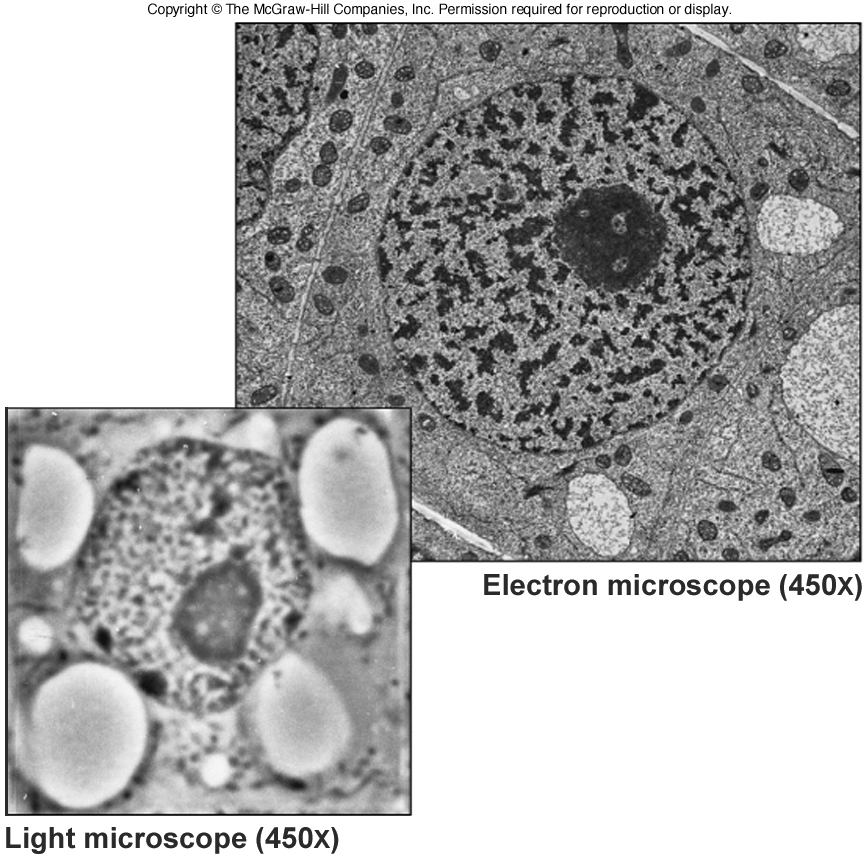
- Figure 20. The answer, shown rather than argued: two images at the SAME magnification, one by light and one by electrons. The electron image is clearer, and the difference is entirely resolution.
- Source: Dr. Rowen, BIOL 4640 Lecture 4 slides (lec04_s44_25.jpg)
Why we cannot see microbes unaided
The limit is in your retina, not in the light. The fovea packs cone cells at the highest density, and a group of cones with its linked neurons acts as one unit of detection, effectively one pixel. The spacing between those units caps human resolution at 100-200 micrometres, roughly a tenth of a millimetre.
- Eagles pack cones more tightly and resolve objects about eight times smaller, which is what 'eagle-eyed' actually means
- Insect compound eyes are worse than ours by about a hundredfold
- So 'microscopic' is a statement about human eyes, not about the organisms
Notice the mismatch: visible light is 400-750 nm, but our retina only resolves 150 micrometres, about 300 times the wavelength. All the information is already in the light entering your eye. Magnification just spreads it far enough apart for the retina to use.
2.1 Observing Microbes: size, shape and which tool reaches them
The size scale you should be able to reproduce
- Eukaryotic microbes span the whole range, from picoeukaryotes at 0.2-2 micrometres to marine xenophyophores at 20 cm
- Most prokaryotes are under 10 micrometres, so their shape resolves under light but their internal structures do not
- Viruses are another one to two orders of magnitude smaller and need electron microscopy
- A ribosome is 20 nm across, which is why it takes EM or crystallography
- Rowen's version in class: bacteria are roughly tenfold smaller than eukaryotic microbes, and viruses another ten- to hundredfold below that
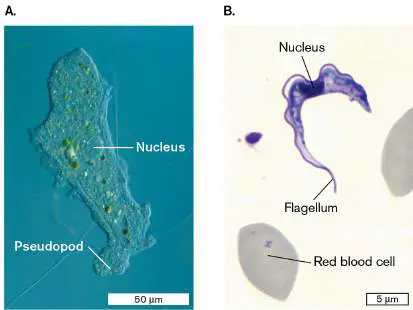
- Figure 21. Relative sizes of different cells, from a eukaryotic cell down to a virus, on one scale.
- Source: Slonczewski & Foster, Microbiology: An Evolving Science, 6e, Fig. 2.4
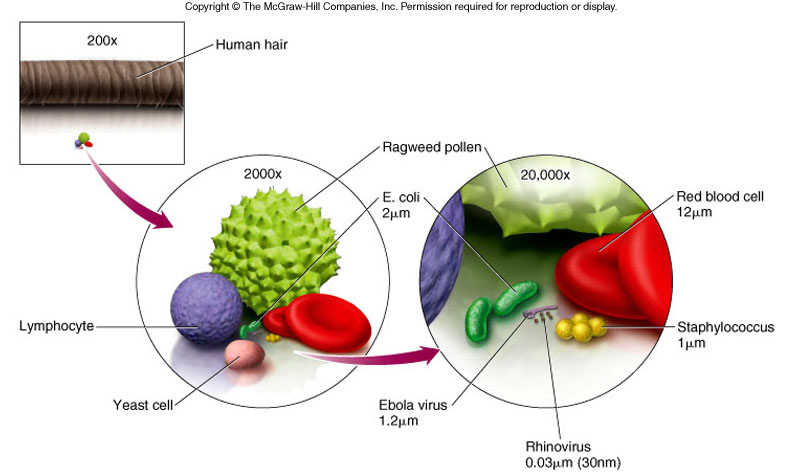
- Figure 22. The size slide as Rowen presented it, with bacteria and viruses set against a red blood cell and a lymphocyte for scale.
- Source: Dr. Rowen, BIOL 4640 Lecture 4 slides (lec04_s41_22.jpg)
Shapes, and which ones are phylogenetically meaningful
- Bacillus (plural bacilli) is any rod-shaped bacterium or archaeon. Do not confuse the shape word with the genus Bacillus
- Coccus (plural cocci) is a sphere
- Rods and cocci evolved independently in many taxa, so shape alone tells you nothing about relatedness
- Spirochete is the exception: a tight, flexible coil held by internal axial filaments, flagella and an outer sheath, and it evolved in only ONE taxon. Syphilis and Lyme borreliosis are spirochetes
- Spirillum is a different thing entirely: a wide, rigid corkscrew, closer to a bent rod, and unrelated to the spirochete
Spirochete versus spirillum is a clean exam discriminator. Tight and flexible and monophyletic versus wide and rigid and unrelated. Some species also grow in clusters or filaments, which is arrangement rather than shape.
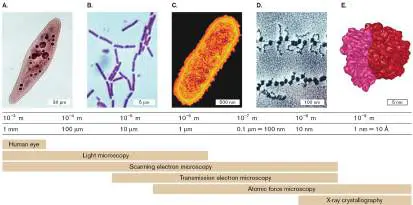
- Figure 23. Common bacterial shapes by light microscopy (A, C, E) and by SEM (B, D, F). The SEM panels show the surface detail light cannot reach.
- Source: Slonczewski & Foster, Microbiology: An Evolving Science, 6e, Fig. 2.6
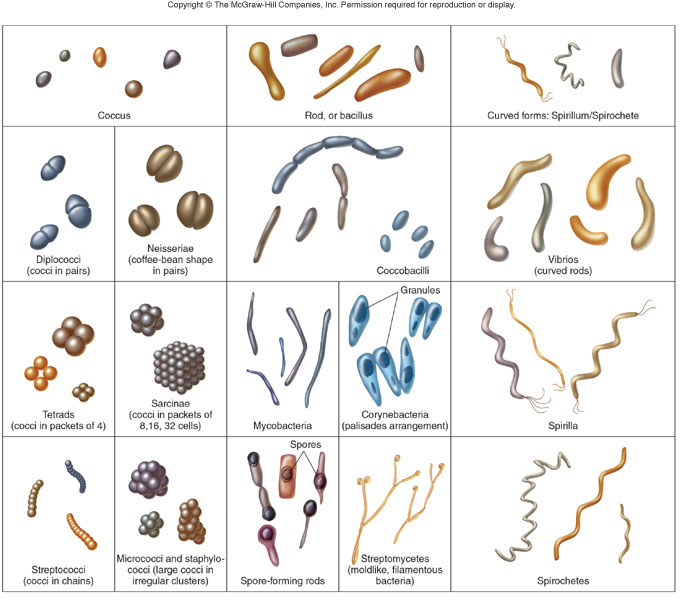
- Figure 24. Bacterial shapes and arrangements, from the slide deck. Rowen notes some grow in clusters or filaments.
- Source: Dr. Rowen, BIOL 4640 Lecture 4 slides (lec04_s46_26.jpg)
Which instrument reaches which scale
| Method | What it does | Reaches |
|---|---|---|
| Light microscopy (LM) | Resolves by light absorption; the specimen is dark against a bright field | Whole cells, roughly 0.2 micrometres and up |
| Phase contrast | Converts refractive-index differences into brightness | LIVE, unstained cells and eukaryotic organelles |
| Fluorescence | A fluorophore absorbs short wavelength, emits longer | Specific molecules; super-resolution gets to 20-40 nm |
| TEM | Electron beam THROUGH a thin section stained with heavy metal | Internal structure, down to nanometres |
| SEM | Electron beam SCATTERED off a metal-coated surface | 3D surface topography |
| Chemical imaging | Spectrometry maps chemical content | Element and compound distribution |
| X-ray crystallography | Diffraction from a crystal lattice | Atomic coordinates of a single molecule or complex |
- Figure 25. The range of resolution laid out across methods, from a paramecium under LM to a ribosome model built from X-ray crystallography.
- Source: Slonczewski & Foster, Microbiology: An Evolving Science, 6e, Fig. 2.7
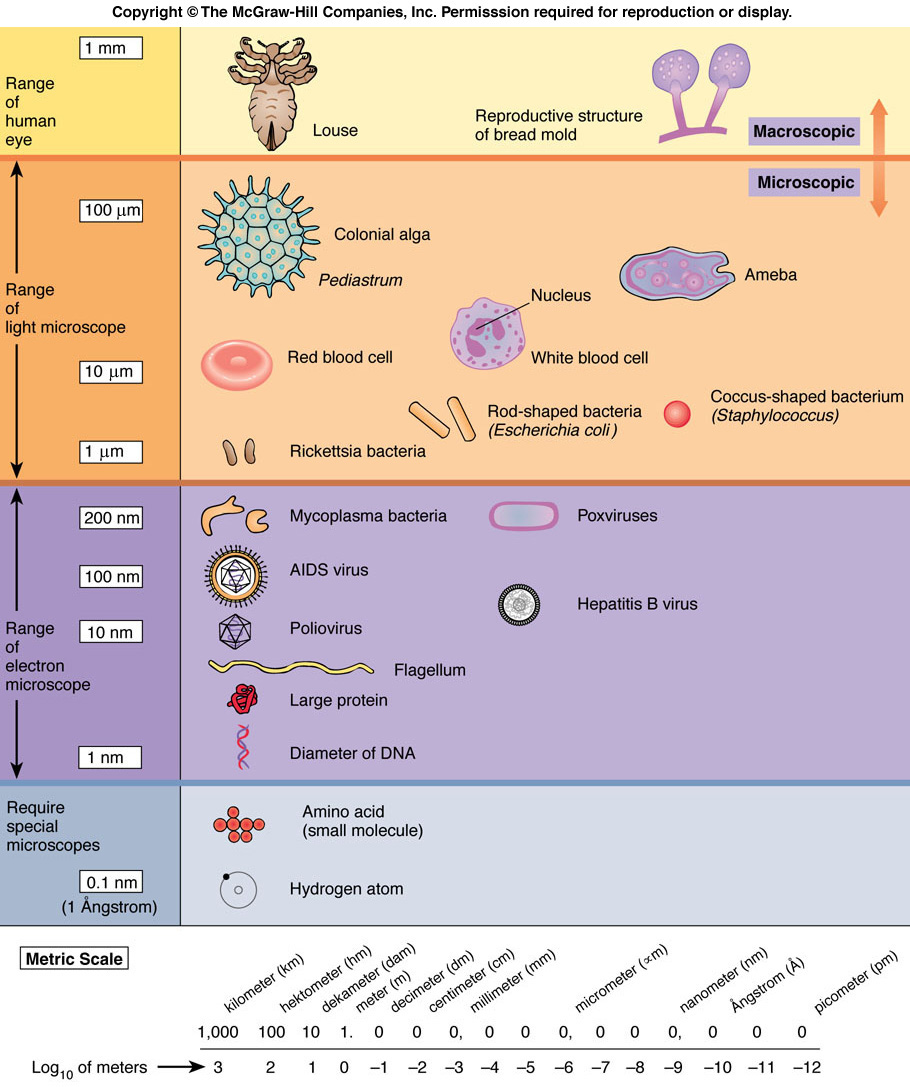
- Figure 26. The same idea from the lecture deck: light, electron and atomic force microscopy against the scale of what each can see.
- Source: Dr. Rowen, BIOL 4640 Lecture 4 slides (lec04_s42_23.jpg)
2.2 Optics: why 0.2 micrometres is the wall
Light as wave and particle
- Visible light is 400-750 nm of the electromagnetic spectrum
- All electromagnetic radiation travels at c = 3 x 10^8 m/s in vacuum
- c = wavelength x frequency, so longer wavelength means lower frequency
- The particle description is the photon; each photon has a wavelength that determines how it interacts with matter
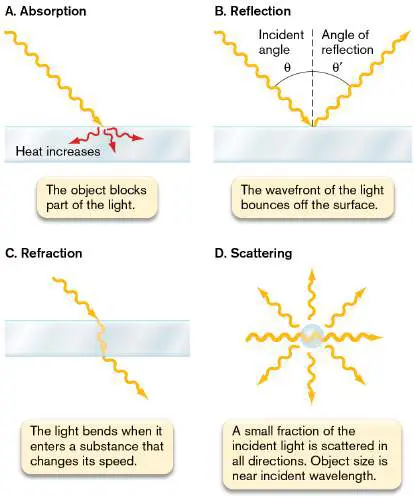
- Figure 27. Electromagnetic energy. A. Electrical and magnetic waves perpendicular to each other. B. The spectrum, with the visible range marked.
- Source: Slonczewski & Foster, Microbiology: An Evolving Science, 6e, Fig. 2.8
Three requirements for resolution
- Contrast. If object and surroundings absorb or reflect equally, the object is undetectable. Watery cytoplasm in water is the classic failure
- Wavelength smaller than the object. If the wave is bigger than the object it passes around it, like an ocean wave around a dock post. This is why radar, at 1-100 cm, resolves cars but not microbes
- Magnification. To use the detail already carried in the light, the rays have to be spread wider than your retina's pixel spacing
Four ways light interacts with an object
| Interaction | What happens | Where it is used |
|---|---|---|
| Absorption | The object gains the photon's energy, usually as heat | Bright-field: the specimen is a dark spot on a bright field. Also why a live specimen cooks on the slide if you watch too long |
| Reflection | The wavefront leaves the surface at the incident angle | Mirrors and glass surfaces inside the microscope's optics |
| Refraction | Light bends as it enters a substance that slows it | THE key property. It is what lets a lens magnify at all |
| Scattering | Part of the wavefront becomes a spherical wave from the object | The haze of a culture tube. Dark-field microscopy images only scattered light, which detects objects smaller than the wavelength without resolving them |
- Figure 28. Interaction of light with matter: absorption, reflection, refraction and scattering.
- Source: Slonczewski & Foster, Microbiology: An Evolving Science, 6e, Fig. 2.9
Fluorescence is a special case of absorption: some molecules absorb at one wavelength and re-emit at a longer one.
How a lens magnifies, and where the wall comes from
A wavefront entering glass is slowed on the side that arrives first, so the whole front bends. Shape the glass into a parabolic curve and parallel rays all converge at the focal point. Beyond it they spread again, and that expansion is magnification. Focal distance is set by curvature and refractive index.
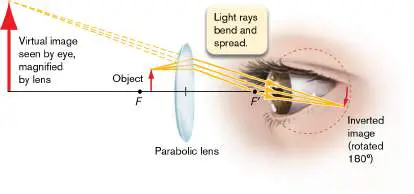
- Figure 29. Refraction of light waves. A. Wavefronts shift direction entering glass. B. A parabolic lens bends parallel rays to a focal point.
- Source: Slonczewski & Foster, Microbiology: An Evolving Science, 6e, Fig. 2.10
So why can we not simply magnify more? Because a lens is finite. Only part of an infinite wavefront enters it, and the converging edges interfere with each other. A single point of light therefore images as a bright central peak ringed by alternating light and dark. The WIDTH of that central peak is what sets how close two points can be and still read as two.
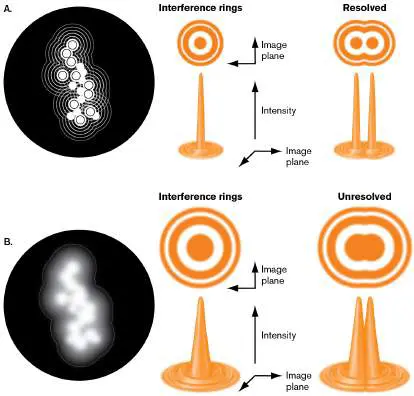
- Figure 30. Interference at the focal point makes concentric rings around the peak. A. Broad wavefronts, narrow rings, points resolved. B. Narrow wavefronts, wide rings, points unresolved.
- Source: Slonczewski & Foster, Microbiology: An Evolving Science, 6e, Fig. 2.12
Bright-field light microscopy resolves detail only above HALF the wavelength of light: about 200 nm, or 0.2 micrometres.
Rowen's version of the limit, from slide 50: the wave must be able to fit between two items to resolve them. Light is 0.4-0.7 micrometres, so the limit lands at 0.2 micrometres. Since our eyes resolve 100-200 micrometres and light bottoms out at 0.2, useful magnification tops out near 1000x. Anything beyond that is empty magnification.
2.3 Bright-field microscopy and the compound microscope
Numerical aperture: the number that actually sets resolution
An object at the focal point sits at the tip of a cone of light. The half-angle of that cone is theta, the angle of aperture. A wider cone means less interference between wavefronts, a narrower peak intensity, and therefore finer resolution.
NA = n sin(theta) and R is proportional to lambda / NA
- n is the refractive index of the medium in the light cone. Air is about 1, water 1.33, lens glass 1.4-1.6, immersion oil 1.5
- Higher NA gives narrower peaks and a smaller minimum resolvable distance R
- R varies INVERSELY with NA, and the equation floors out near lambda/2
- Which is the same 0.2 micrometre wall, arrived at from the lens side
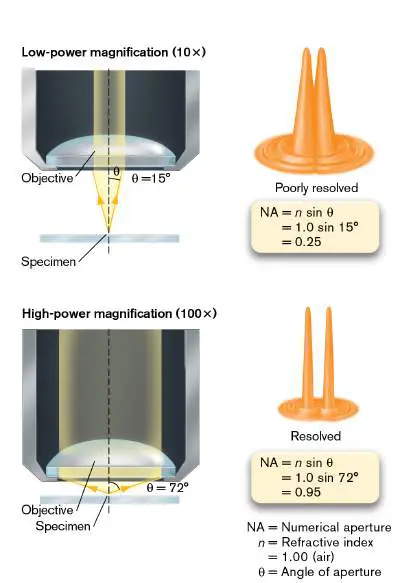
- Figure 31. Numerical aperture and resolution. NA is the refractive index of the medium times the sine of the light-cone angle, worked here for a 10x and a 100x objective.
- Source: Slonczewski & Foster, Microbiology: An Evolving Science, 6e, Fig. 2.13
Why immersion oil exists
As the lens gets stronger the cone gets wider and it must sit closer to the specimen. At wide angles, too much light is lost by refraction at the glass-to-air boundary. Replacing that air with immersion oil, refractive index 1.5, close to glass, stops the rays bending away. That is what makes a usable 100x objective possible.
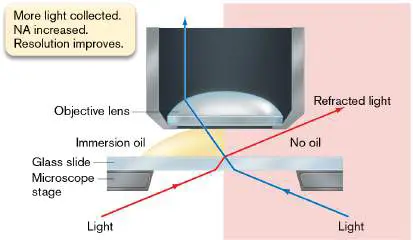
- Figure 32. Immersion oil, with a refractive index near that of glass, keeps light rays from bending away from the objective lens.
- Source: Slonczewski & Foster, Microbiology: An Evolving Science, 6e, Fig. 2.14
The lens train
| Component | Job | Contributes magnification? |
|---|---|---|
| Light source | Illuminates from below | No |
| Diaphragm | Cuts the diameter of the light column. Low power needs LESS light or absorbance washes out; high power needs it open | No |
| Condenser | Collects rays onto a small area of the slide | No |
| Objective lens | Forms the first, inverted image (I) | Yes, 4x to 100x |
| Ocular lens (eyepiece) | Second magnification step, forming I-prime | Yes, usually 10x |
Total magnification = objective power x ocular power. 40x objective x 10x ocular = 400x. 100x oil x 10x = 1000x.
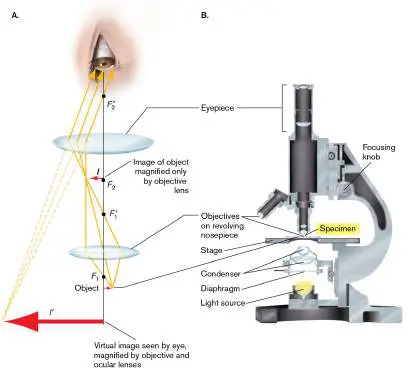
- Figure 33. Anatomy of a compound microscope. A. The light path. B. Cutaway view.
- Source: Slonczewski & Foster, Microbiology: An Evolving Science, 6e, Fig. 2.15
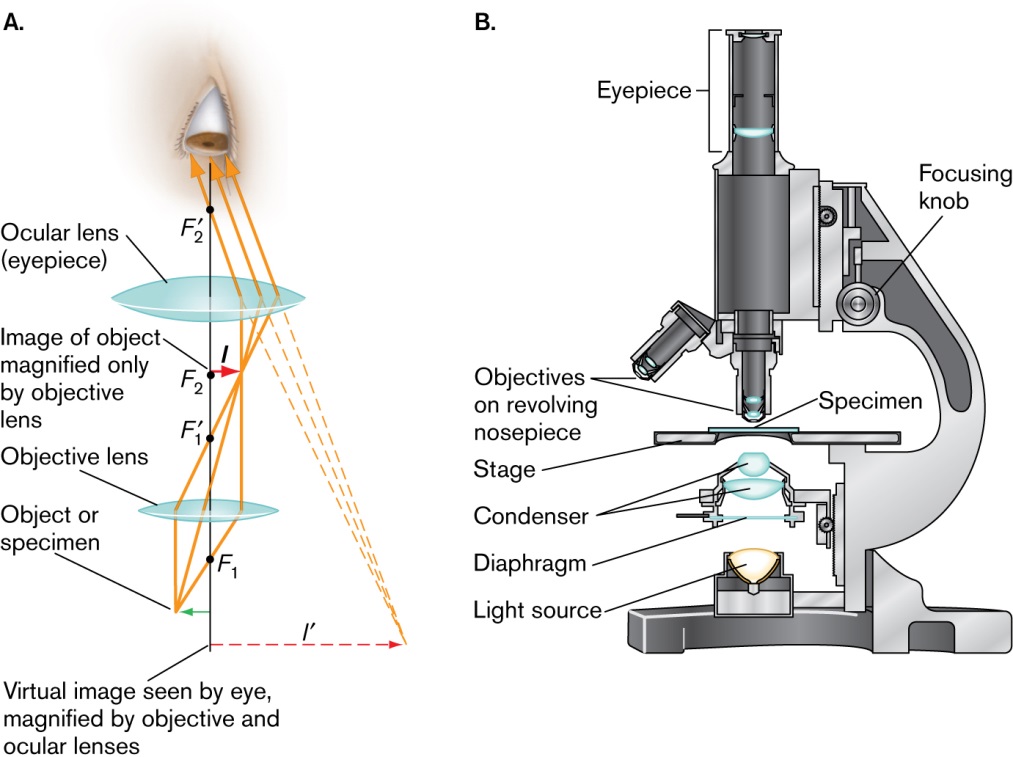
- Figure 34. The same diagram from slide 48, where Rowen lists eyepiece, objective, stage, condenser, diaphragm and light source, with the total-magnification formula.
- Source: Dr. Rowen, BIOL 4640 Lecture 4 slides (lec04_s48_29.jpg)
Why a compound microscope instead of one perfect lens
- As glass curvature rises, aberration grows faster than magnification does
- A series of lower-power lenses multiplies magnification while each corrects the others' aberrations
- Parfocal means the objectives are set at heights such that switching lenses keeps the specimen nearly in focus
- Lens grades worth knowing: 'plan' corrects field curvature to give a flat field; 'apochromat' corrects spherical and chromatic aberration
Using it: the three steps and the trade-off
- Centre the specimen. Higher magnification means a smaller field of view
- Optimize light. Too much at low power washes out absorbance; too little at high power leaves everything dark. Set the condenser height, then the diaphragm
- Focus low power first. Low power has greater depth of field, the range of planes in acceptable focus, so find it there and then rotate up
The trade-off worth stating on an exam: the higher the magnification, the NARROWER the depth of field. That is exactly why motile bacteria swimming in and out of the focal plane are so hard to follow at 1000x.
Specimen preparation and focus artifacts
- Wet mount: a drop of water under a coverslip. Advantage, the organism is alive and you can watch it swim. Disadvantage, transparent cytoplasm gives almost no contrast, and the slide overheats and dries
- Flow cell: a temperature-controlled chamber with medium flowing through, so adherent cells can be watched for a long time and even grow as a biofilm
Focus artifacts are worth recognising because they look like biology. A cell too close to the lens simply blurs. In the focal plane it is sharp with a bright edge line. Too far past the plane, the bright interference lines collapse inward and the cell looks bright or hollow, ringed with light. The cell is not hollow. Only the image changed.
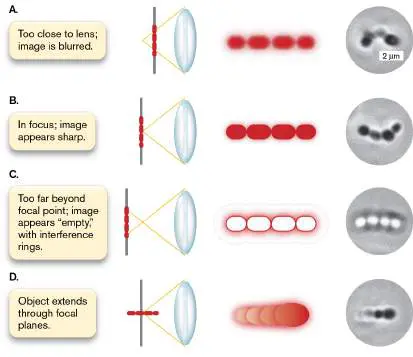
- Figure 35. The same bacteria at different levels of focus. Note the apparently hollow cells in the panel focused past the plane.
- Source: Slonczewski & Foster, Microbiology: An Evolving Science, 6e, Fig. 2.17
Phase contrast: seeing live cells without killing them
Zernike's system, invented in the 1930s and worth the 1953 Nobel Prize in Physics, converts refractive-index differences into brightness differences. The physical basis is that light passing through a cell is retarded by about a quarter wavelength relative to light passing through the medium alongside.
- An annular ring makes a hollow cone of light. Light going through the specimen is refracted into the centre of that cone, separating it from the transmitted light
- The phase plate is thinner where the transmitted cone hits it, so it retards the refracted centre by ANOTHER quarter wavelength
- Total offset is now half a wavelength: fully out of phase
- Recombined at the ocular, the two cancel by destructive interference, and the specimen appears dark against a bright field
- Payoff: high contrast on LIVE, unstained cells and on eukaryotic organelles
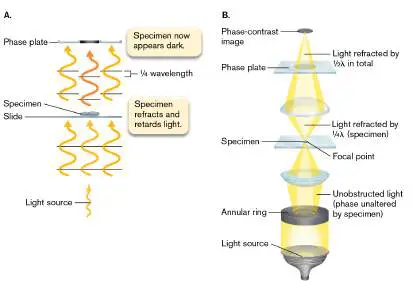
- Figure 36. Phase-contrast optics. The specimen retards light a quarter wavelength; the phase plate adds another quarter; the two cancel.
- Source: Slonczewski & Foster, Microbiology: An Evolving Science, 6e, Fig. 2.20
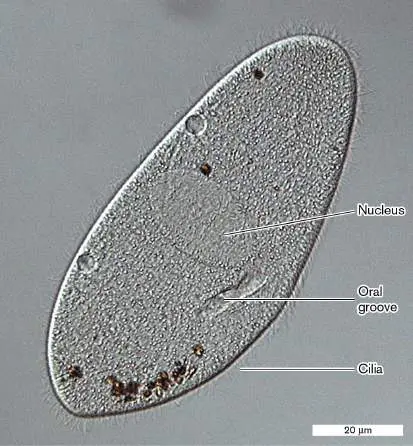
- Figure 37. Phase-contrast microscopy of a paramecium. Refractive-index differences reveal the nucleus, oral groove and cilia.
- Source: Slonczewski & Foster, Microbiology: An Evolving Science, 6e, Fig. 2.18
Two relatives worth naming
- Differential interference contrast (DIC), Nomarski optics: superimposes interference bands to accentuate small refractive-index differences, giving a pseudo-3D look
- Dark field: only SCATTERED light reaches the observer; direct rays are bent aside. A bright object on a dark background, and the standard way to see thin spirochetes
2.4 Fixation and staining
Why stain at all, and what it costs
- Fixation makes cells adhere to the slide in a fixed position, by methanol or by heat, both of which denature proteins so exposed side chains grip the glass
- Staining adds a molecule that absorbs light strongly over a wavelength range
- The cost is stated plainly by the book: fixation and staining usually KILL the cell. Contrast is bought with life
- Most stains carry conjugated double bonds or aromatic rings that absorb visible light, plus POSITIVE charges that bind the negatively charged cell surface, such as phospholipid phosphoryl groups
The historical detail is a good hook: chemical stains came out of the nineteenth-century German dye industry. Substances invented to dye cotton and wool turned out to bind biological specimens too.
The Gram stain, step by step and why each step is there
| Step | Reagent | What it does |
|---|---|---|
| 1 | Crystal violet (primary stain) | A cationic dye binds the bacteria; it binds human cells too, but less strongly |
| 2 | Iodine (mordant) | Iodide complexes with the trapped crystal violet, making a larger complex held more strongly inside the wall. The thicker the wall, the more is held |
| 3 | Ethanol (decolorizer), about 10 seconds | Removes loosely bound complex. Gram-positives hold on; Gram-negatives go colourless. TIMING IS CRITICAL |
| 4 | Safranin (counterstain) | Stains the now-colourless Gram-negatives pale pink. Gram-positives take it up too, but the purple dominates |
The exam question is almost always about the decolorizer. Leave ethanol on too long and the Gram-positives also release their crystal violet, then take up safranin, and EVERYTHING looks pink. Over-decolorizing turns a Gram-positive into a false Gram-negative, never the reverse.
The structural reason it works
- Gram-positive walls carry five or more layers of peptidoglycan, enough to retain the crystal violet-iodide complex
- Gram-negative walls carry only one to three layers and are more porous, so the complex leaks out during decolorization
- Taxonomically: Firmicutes (Bacillota) stain Gram-positive; Proteobacteria (Pseudomonadota) and Bacteroidetes (Bacteroidota) stain Gram-negative
- Human tissue stains Gram-negative, which is exactly why Hans Christian Gram invented it in 1884: to pick Streptococcus pneumoniae out of lung tissue
- Other bacteria and archaea may be Gram-negative or Gram-variable
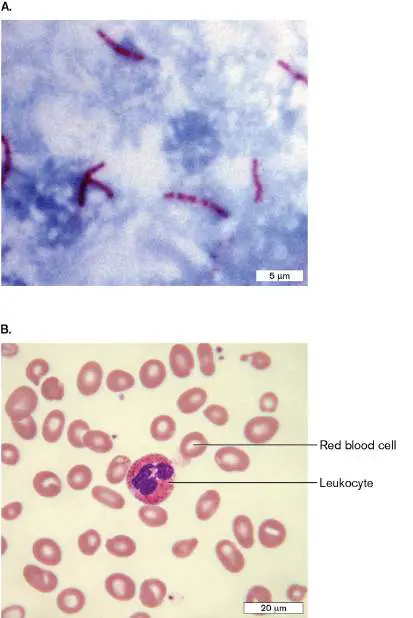
- Figure 38. The Gram stain. A. The four-step procedure. B. Why it works: many peptidoglycan layers retain the complex, few let it leak out.
- Source: Slonczewski & Foster, Microbiology: An Evolving Science, 6e, Fig. 2.24
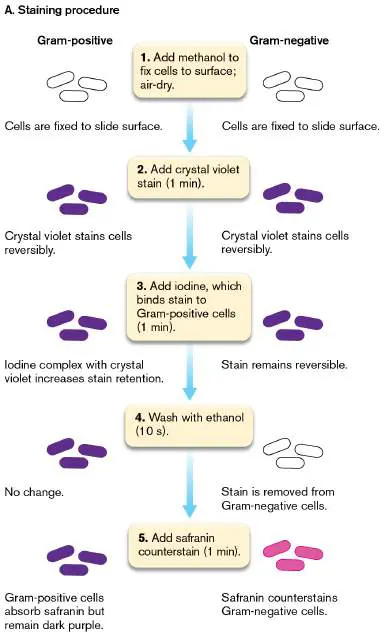
- Figure 39. Gram staining in practice. A. Gram-positive S. pneumoniae as purple diplococci in sputum. B. Gram-negative Proteus mirabilis as pink rods.
- Source: Slonczewski & Foster, Microbiology: An Evolving Science, 6e, Fig. 2.23
The rest of the stain family
| Stain | Type | What it distinguishes |
|---|---|---|
| Methylene blue | Simple | Colours cells but not the surrounding medium or tissue. Koch's original |
| Gram | Differential | Gram-positive versus Gram-negative cell walls |
| Acid-fast | Differential | Mycolic-acid-rich walls that resist acid-alcohol decolorization: Mycobacterium tuberculosis stains red |
| Giemsa | Differential | Blood cell types and blood parasites |
| Antibody stain | Highly specific | One cell type or one component; the antibody is conjugated to an enzyme or a fluorophore |
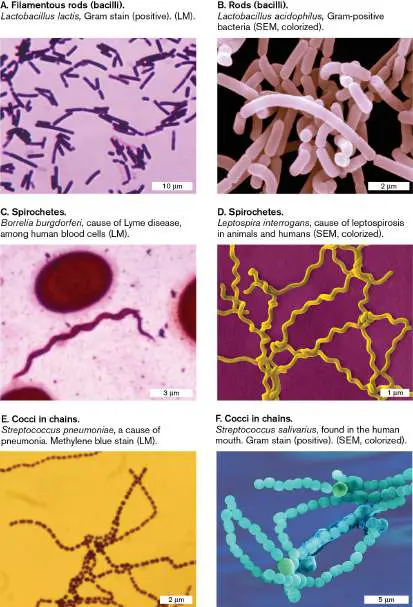
- Figure 40. Differential stains. A. Acid-fast stain of Mycobacterium tuberculosis in sputum. B. Giemsa stain.
- Source: Slonczewski & Foster, Microbiology: An Evolving Science, 6e, Fig. 2.25
2.5 Fluorescence microscopy, FISH and chemical imaging
The principle
- A fluorophore absorbs light at a short, high-energy wavelength and re-emits at a longer, lower-energy one. The energy difference leaves as heat
- Colour filters do the separating: one lets only excitation light reach the specimen, another lets only emitted light reach the detector
- That separation is why a fluorescent signal appears against a black field
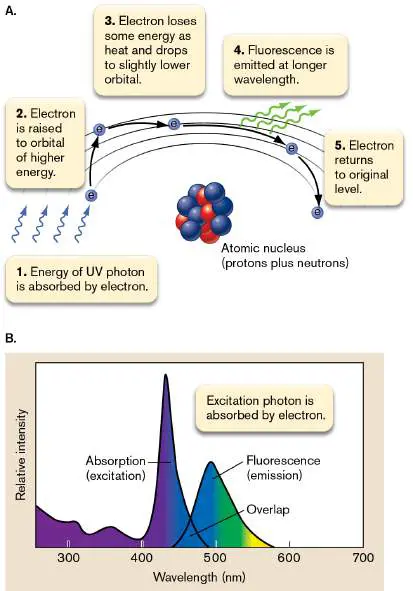
- Figure 41. Fluorescence: energy gained by absorption is released partly as heat and partly as a photon of longer wavelength.
- Source: Slonczewski & Foster, Microbiology: An Evolving Science, 6e, Fig. 2.27
Four ways to attach a fluorophore, in increasing specificity
- Chemical affinity for a cell component such as a membrane or nucleic acid. DAPI staining all DNA is the standard example
- Antibody conjugate, for one specific antigen
- Short nucleic acid probe that hybridizes to a target sequence. This is FISH
- Genetic fusion: GFP fused to a protein the cell expresses, so brightness reports that protein's location or its expression level
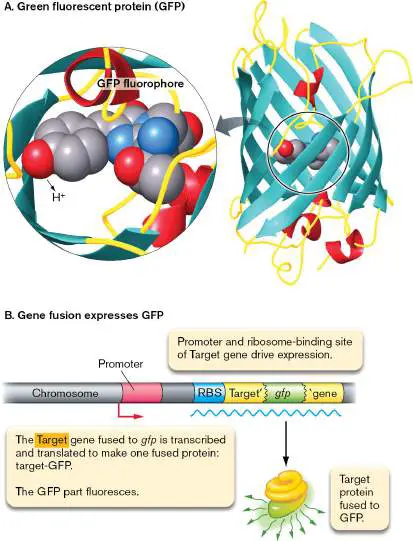
- Figure 42. Green fluorescent protein. Endogenous GFP-type proteins can track cell parts and report environmental stress responses.
- Source: Slonczewski & Foster, Microbiology: An Evolving Science, 6e, Fig. 2.29
Super-resolution and FISH, the two payoffs to remember
- Super-resolution imaging uses computation to locate a fluorophore to 20-40 nm, about tenfold better than the 200 nm optical limit. It does not beat the diffraction limit by better optics; it beats it by calculating where the peak centre must be
- FISH uses fluorophore-labelled DNA probes against rRNA to identify and map UNCULTURED organisms in place, in the environment or inside a host. This is the direct link back to the 85-99% of bacteria that will not grow on a plate in section 4.3
- Chemical imaging / NanoSIMS maps compounds by mass spectrometry, using heavy-isotope labels
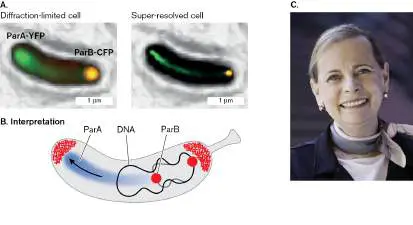
- Figure 43. Single-molecule localization: computing the centre of a peak to a precision far finer than the peak's own width.
- Source: Slonczewski & Foster, Microbiology: An Evolving Science, 6e, Fig. 2.31
2.6 Electron, scanning probe and X-ray methods
Electron microscopy
- Electrons have a far shorter wavelength than light, so resolution improves by orders of magnitude. The lenses are magnetic, not glass
- Specimens are stained with heavy-metal salts, which scatter electrons
- TEM: the beam passes THROUGH a thin section, revealing internal structure
- SEM: the beam is SCANNED across a metal-coated surface and scattered, giving 3D surface topography
- The cost is that classic EM requires fixing, sectioning and staining, so the specimen is dead and artifacts are possible
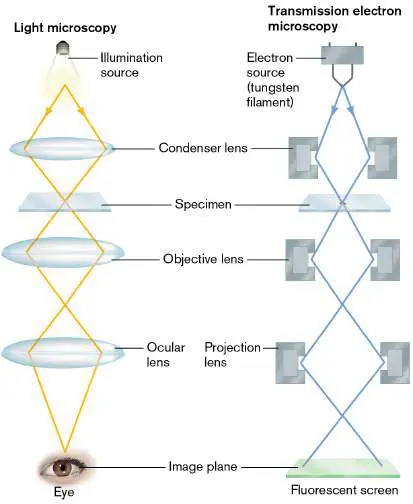
- Figure 44. Transmission electron microscopy: the beam travels through the specimen and magnetic lenses focus it.
- Source: Slonczewski & Foster, Microbiology: An Evolving Science, 6e, Fig. 2.37
- Figure 45. Scanning electron microscopy: the beam scans the surface, and scattered electrons build a 3D image.
- Source: Slonczewski & Foster, Microbiology: An Evolving Science, 6e, Fig. 2.38
The three methods that avoid fixation artifacts
- Cryo-EM flash-freezes the sample in water solution, so there is no chemical fixation to distort it. Tomography then combines images taken in many focal planes into one high-resolution 3D reconstruction
- Atomic force microscopy (AFM), a scanning probe method, drags a fine tip across the specimen and measures intermolecular force, so cells can be observed in water and untreated
- Cryocrystallography freezes crystals to cut thermal vibration and diffusion, which is what made structures as large as the ribosome solvable
- Figure 46. Cryo-electron tomography of bacterial flagellar motors, a structure no chemical-fixation method images intact.
- Source: Slonczewski & Foster, Microbiology: An Evolving Science, 6e, Fig. 2.44
X-ray crystallography
- Also called X-ray diffraction analysis
- X-rays diffract off the crystal lattice of many identical molecules, and the interference pattern is computed back into atomic coordinates
- It is the only method on this list that reaches individual molecules, and it requires a crystal, which is why thermophilic proteins get used so often: they are more stable and easier to crystallize
- Figure 47. Visualizing molecules by X-ray crystallography: the apparatus and the diffraction it records.
- Source: Slonczewski & Foster, Microbiology: An Evolving Science, 6e, Fig. 2.47
Lecture Companion: what was covered, and what is still coming
Covered at the end of Lecture 4 (Aug 31, 2026)
- Why they are called microorganisms: normally invisible to the naked eye, covering eukaryotic microbes, bacteria and viruses
- Sizes: bacteria roughly tenfold smaller than eukaryotic microbes, viruses another ten- to hundredfold below that; the eye resolves down to about 150 micrometres
- Most viruses are too small for a light microscope, so electron microscopy is required. He also named atomic force microscopy as what lets us see the shape of protein molecules
- Magnification versus resolution, with resolution defined as the ability to tell whether two objects are separate or touching
- The side-by-side comparison at the same magnification, light against electrons, and his display-pixel analogy for resolution
- He stopped at the slide about physics limiting how powerful light microscopes can be, saying he was running out of time
Still to come, scheduled for Lecture 6 on 9/4
- Slides 45 to 52: standard light microscopy features, maximum magnification and the 0.2 micrometre resolution limit
- Bacterial shapes and arrangements
- Bright-field appearance, dark cells on a white-to-grey background
- The modern compound microscope and the total-magnification formula
- The factors limiting light microscopy: wavelength as a wave that must fit between two items, refraction bending different wavelengths differently, and the fact that many microbes are translucent and lack contrast
- That last point is the hinge into phase contrast and staining, which is why sections 2.3 and 2.4 are worth reading before that lecture
Practical note for the exam: the Lecture 4 deck poses two discuss-with-your-neighbour questions in this chapter, 'which is most important' (slide 43) and the light-versus-electron comparison (slide 44). Rowen's in-class questions have a strong record of reappearing on exams in the same form.
Practice Quiz: microscopy (with answer key)
Multiple choice
- Q1. Enlarging an image without gaining detail is called: (A) refraction (B) empty magnification (C) resolution (D) interference
- Q2. The resolution limit of bright-field light microscopy is about: (A) 20 nm (B) 200 nm (C) 2 micrometres (D) 150 micrometres
- Q3. Numerical aperture equals: (A) n / sin(theta) (B) n sin(theta) (C) sin(theta) / n (D) lambda / 2
- Q4. Immersion oil improves resolution because it: (A) magnifies the specimen (B) has a refractive index near that of glass, so fewer rays bend away (C) increases the wavelength of light (D) increases the ocular power
- Q5. A 40x objective with a 10x ocular gives a total magnification of: (A) 50x (B) 400x (C) 4000x (D) 1000x
- Q6. Which method shows LIVE, unstained cells with high contrast? (A) Gram stain (B) TEM (C) phase contrast (D) X-ray crystallography
- Q7. In the Gram stain, the mordant is: (A) crystal violet (B) iodine (C) ethanol (D) safranin
- Q8. A Gram-positive organism appears pink after staining. The most likely error is: (A) too little crystal violet (B) the ethanol step ran too long (C) safranin was omitted (D) the iodine was omitted
- Q9. Which technique identifies UNCULTURED organisms in place, inside a host or environment? (A) SEM (B) FISH (C) dark field (D) Giemsa stain
- Q10. SEM differs from TEM in that SEM: (A) passes electrons through a thin section (B) scatters electrons off a coated surface for 3D topography (C) uses visible light (D) requires a crystal
Short answer
- S1. Distinguish detection, resolution and magnification, and say which is limiting when you look at a cloudy culture tube.
- S2. Why does useful light magnification stop near 1000x? Use two numbers.
- S3. Explain, in phase terms, why a phase-contrast specimen looks dark.
- S4. A cell appears hollow under high power. Give two possibilities and how to tell them apart.
- S5. Why is a compound microscope built from several lower-power lenses instead of one very strong one?
Answer key
- Q1 B. Detail expands in proportion to the image, so nothing is gained.
- Q2 B. About half the wavelength of visible light, 200 nm or 0.2 micrometres.
- Q3 B. Refractive index times the sine of the aperture half-angle.
- Q4 B. Oil at n = 1.5 matches glass, so rays are not lost by refraction at a glass-to-air boundary at wide angles.
- Q5 B. 40 x 10 = 400x.
- Q6 C. Phase contrast converts refractive-index differences into contrast, so nothing needs to be fixed or stained.
- Q7 B. Iodide complexes with crystal violet so the larger complex is retained by thick walls.
- Q8 B. Over-decolorization strips crystal violet from Gram-positives too, and they then take up safranin. The error only ever runs positive to negative.
- Q9 B. Fluorescence in situ hybridization, with rRNA-targeted probes.
- Q10 B. TEM transmits through a thin section for internal structure; SEM scatters off the surface for topography.
- S1. Detection is knowing something is there; resolution is separating two things; magnification is apparent enlargement. A cloudy tube is pure detection: about 10^8 cells per ml register as haze, but no individual cell is resolved.
- S2. The eye resolves 100-200 micrometres and light bottoms out at 0.2 micrometres, a 500- to 1000-fold gap. Magnify beyond closing that gap and you get empty magnification.
- S3. Light through the specimen is retarded about a quarter wavelength; the phase plate retards it another quarter; the total half-wavelength offset means the specimen light and the transmitted light cancel by destructive interference, giving darkness.
- S4. Either it really is hollow, for instance a Bacillus that has sporulated and left an empty wall behind, or it is simply focused past the focal plane, where the bright interference edge collapses inward. Rack the fine focus: a focus artifact changes as you move through the plane, a real empty cell does not.
- S5. Aberration grows faster than magnification as glass curvature increases, so a single very strong lens is worse than a series of weaker ones whose magnifications multiply while their corrections compensate for each other.
Mnemonic set for Chapter 2
- Detect, resolve, magnify: only the middle one is real. Magnification without resolution has a name and it is not a compliment.
- Half the wavelength, and no further. 0.4-0.7 micrometre light gives a 0.2 micrometre limit, hence 1000x.
- Wide cone, fine detail. Bigger NA, smaller R. Oil widens the usable cone.
- Come In And Stain Safely. Crystal violet, Iodine, Alcohol, Safranin, in order, and the alcohol is the step you can ruin.
- Through for inside, off for outside. TEM transmits through a section, SEM scatters off a surface.
- Phase for the living, stain for the dead. Phase contrast and DIC keep cells alive; fixation and staining do not.
Figures are from Slonczewski & Foster, Microbiology: An Evolving Science, 6e (the course textbook), plus screenshots from Dr. Rowen's lecture slides where noted.
Contents
Right-click here and choose Update Field to build the contents.
The framing: why this section exists
Section 4.4 taught you to measure a growth rate. This section answers the question that measurement immediately raises: growth rate under what conditions? A doubling time is meaningless without the temperature, pH, salt and oxygen level it was measured at, which is why the two sections are taught back to back.
The single idea underneath all four sections is this. A microbe cannot regulate its own internal temperature, and only partly regulates its internal pH and osmolarity. So the environment acts directly on every protein and membrane in the cell. An organism's niche is therefore defined by the tolerance of its macromolecules, not by any preference of the organism.
Exam framing: every classification term in this section (thermophile, acidophile, halophile, barophile, obligate anaerobe) is a statement about protein and membrane chemistry, not about where the organism happens to have been found.
A second idea worth carrying: an organism extreme in one parameter is very often extreme in another. Sulfolobus acidocaldarius is both a thermophile and an acidophile. Alkaliphiles in soda lakes are usually halophiles too. The book's word for this is polyextremophile.
What counts as extreme
Our human frame of reference calls a habitat normal if it sits near sea level, between 20 C and 40 C, near neutral pH, around 0.9% salt, with ample nutrients. Anything outside that window gets called extreme, and the organisms living there get called extremophiles. The term was coined by NASA biochemist Robert MacElroy while looking for life forms that might inhabit other planets.
- The early Earth was hot, acidic, high-osmolarity, low-oxygen, high-CO2, so the earliest microbes were probably what we would now call extremophiles
- Species that adapted as Earth changed became today's normalophiles; species that did not were confined to the habitats that stayed extreme
- So extremophile is a label relative to us, not a description of a strange lifestyle
- Figure 48. Hot spring in Yellowstone. An acid pool can sit next to an alkali pool, both extremely hot, which is why polyextremophiles exist.
- Source: Slonczewski & Foster, Microbiology: An Evolving Science, 6e, Fig. 5.1
Two applied consequences the book flags. Do not assume irradiation will sterilize samples returned from other planets, because it does not even kill Deinococcus radiodurans, which lives here. And in the other direction, components of the Mars rovers were heated above 110 C for up to 144 hours so we would not seed Mars with Earth microbes.
Table 5.1: the classification scheme to memorize
This is the table Rowen put on the board. Every one of these terms will show up in your Microbe Project write-up and in the exam's descriptive questions. An asterisk in the book marks the classes considered extremophiles.
| Parameter | Class | Optimal condition | Extremophile? |
|---|---|---|---|
| Temperature | Hyperthermophile | above 80 C | yes |
| Thermophile | 50-80 C | yes | |
| Mesophile | 15-45 C | no | |
| Psychrophile | below 15 C | yes | |
| pH | Alkaliphile | above pH 9 | yes |
| Neutralophile | pH 5-8 | no | |
| Acidophile | below pH 3 | yes | |
| Osmolarity | Halophile | high salt, above 2 M NaCl | yes |
| Halotolerant | does not require salt, grows up to 2 M NaCl | no | |
| Oxygen | Strict aerobe | only with O2 | no |
| Facultative microbe | with or without O2 | no | |
| Microaerophile | only small amounts of O2 | no | |
| Strict anaerobe | only without O2 | no | |
| Pressure | Barophile | high pressure, above 380 atm | yes |
| Barotolerant | 10-500 atm | no |
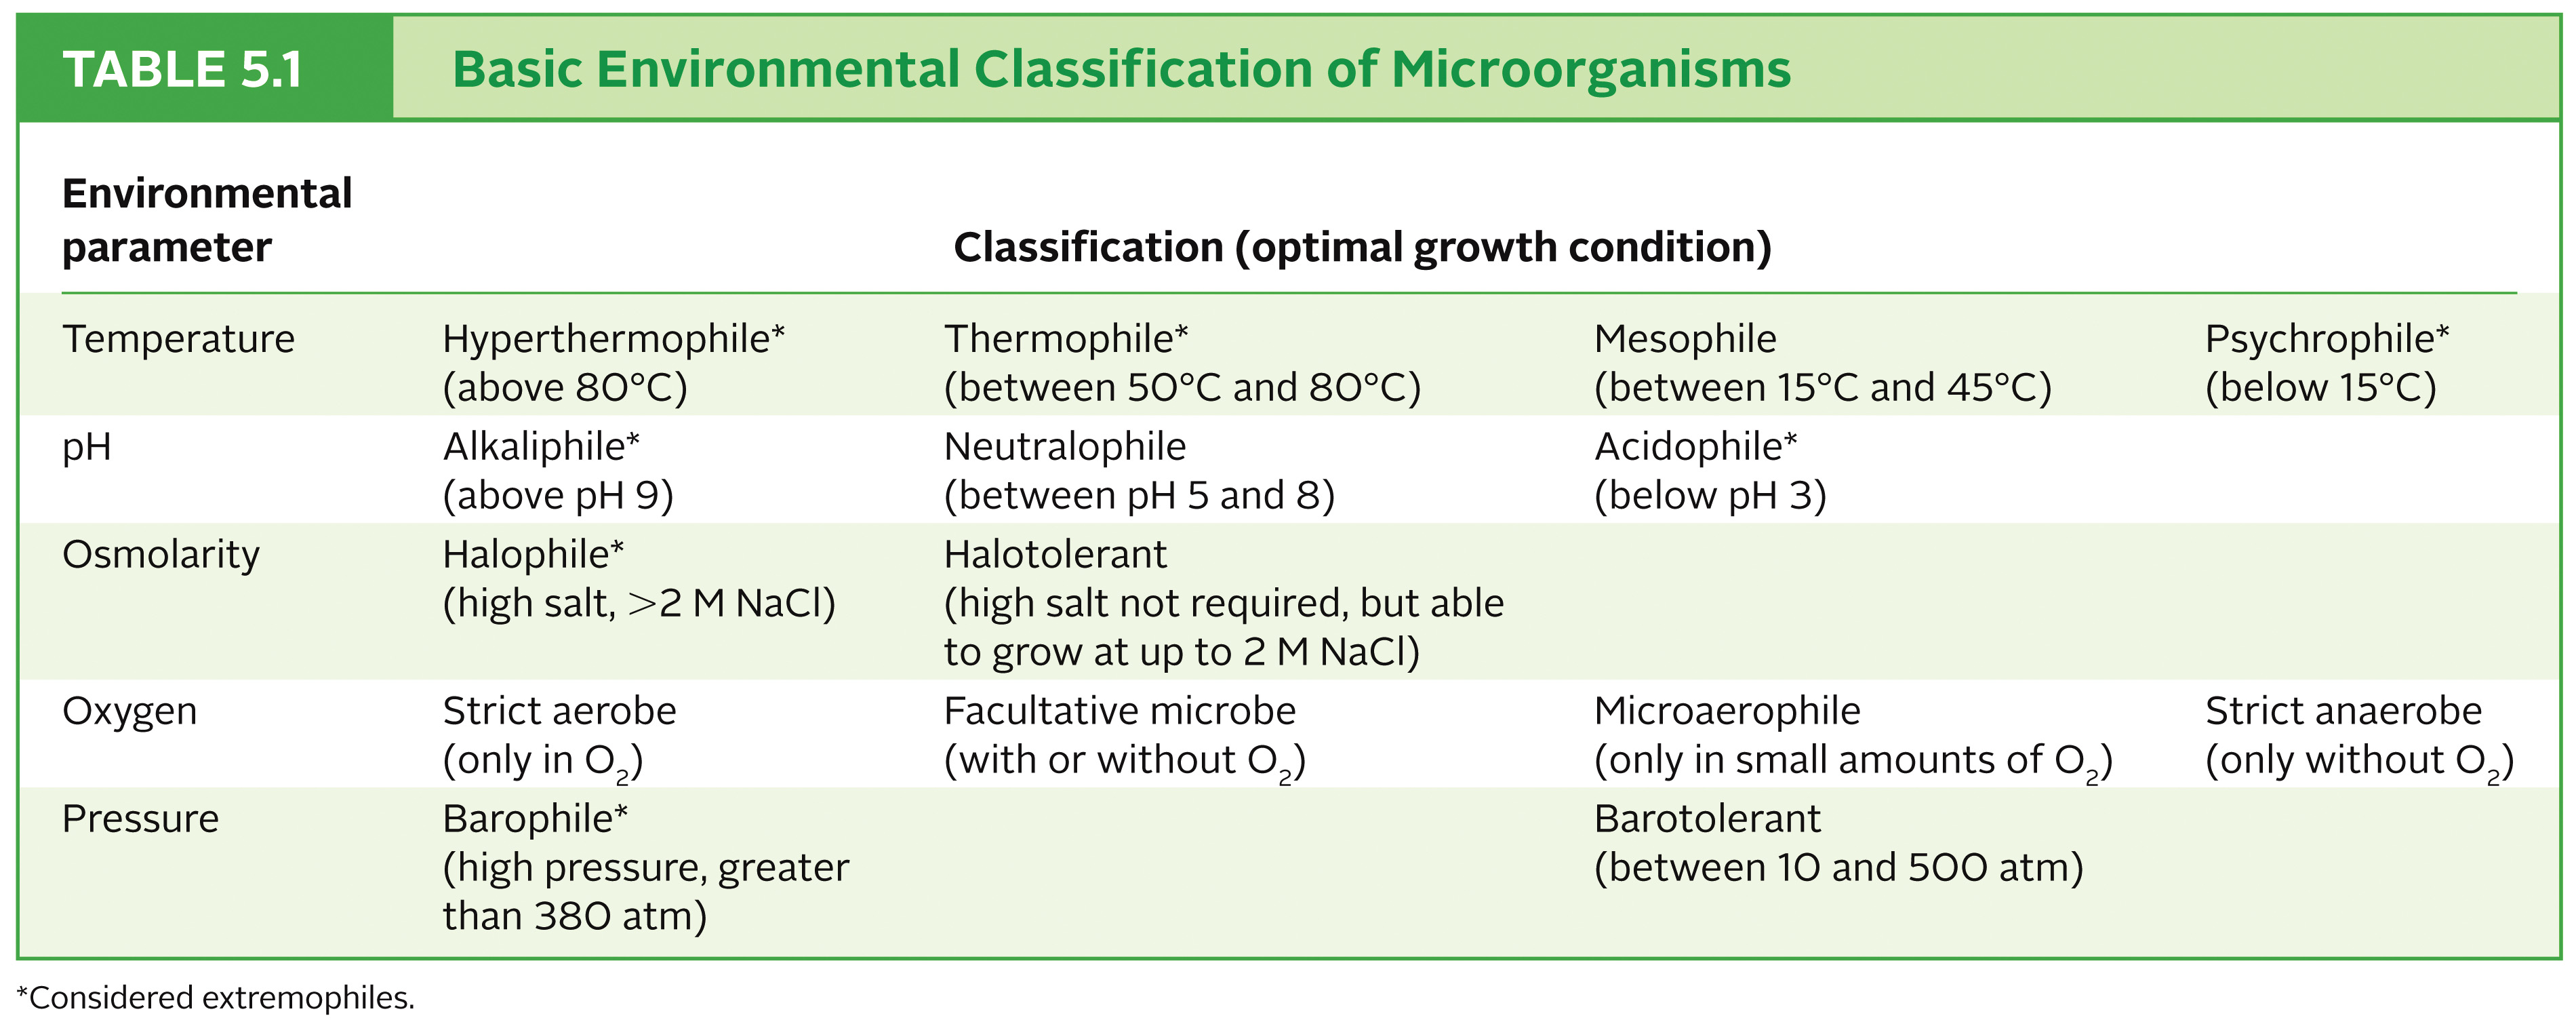
- Figure 49. Table 5.1 as Rowen showed it in class. He said explicitly that you will meet these terms while researching your Microbe Project organism.
- Source: Dr. Rowen, BIOL 4640 Lecture 4 slides (lec04_s34_17.jpg)
Naming convention worth knowing: you normally only state the class when it is unusual. Nobody calls E. coli a neutralophile in casual writing. You do say acidophile or alkaliphile, because those are notable.
Temperature (Section 5.1)
Why temperature acts on everything at once
Microbes cannot thermoregulate, so cell temperature equals environment temperature. Since temperature sets the average rate of molecular motion, it touches membrane fluidity, nutrient transport, DNA and RNA stability, and enzyme structure and function simultaneously.
- Every organism has a temperature optimum (fastest growth) plus a minimum and maximum that bound growth entirely
- The limits are set collectively: thousands of proteins must all work in the same range at the same time
- Too hot, and critical enzymes or the membrane fail. Too cold, and enzyme reactions become too sluggish while the membrane stiffens
- The membrane must stay fluid so it can expand as the cell grows and so transport proteins can be inserted into it
Across the domains, tolerance narrows as you move toward us. Archaea span the widest range. Bacteria mostly sit between the archaeal extremes. Eukaryotes are the least tolerant, roughly 10 C to 65 C, though some unicellular eukaryotes reach -20 C. Protists top out near 50 C, some fungi near 60 C, and prokaryotes run from below 0 C to above 100 C.
The Arrhenius relationship, and where it breaks
Within the growth range, the relationship between temperature and the growth rate constant k obeys the Arrhenius equation, the same equation that describes simple chemical reaction rates.
Growth rate roughly DOUBLES for every 10 C rise in temperature.
- This matches most chemical reactions with an activation energy near 50 kJ/mol
- It holds only in the middle of the range
- At the top, proteins denature. At the bottom, the membrane stiffens. Both restrict the conformational mobility enzymes need, so activity collapses
- That is why the real curve falls off faster than Arrhenius predicts at both ends: a long slow rise, then a sharp cliff on the hot side
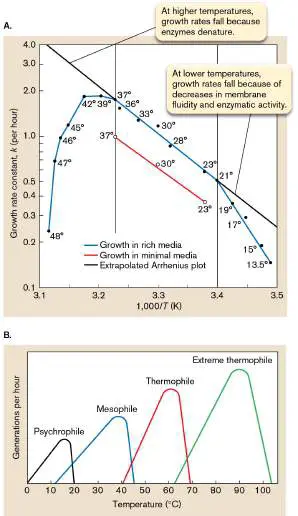
- Figure 50. Temperature and growth rate. A. The growth rate constant k for E. coli plotted against 1000/T in Kelvin, so higher temperature is to the LEFT. B. Growth rate versus temperature for psychrophiles, mesophiles, thermophiles and hyperthermophiles.
- Source: Slonczewski & Foster, Microbiology: An Evolving Science, 6e, Fig. 5.2
Read the axis before you answer. Panel A plots 1000/T on the x-axis, so the left side is HOT and the right side is COLD, the reverse of what you expect. Rowen pointed this out in class specifically because it is an easy exam trap. The optimum in that figure lands around 39-42 C.
The typical growth range spans the optimum by about 30-40 C, though some organisms are much narrower. Within a species you can isolate heat-sensitive or cold-sensitive mutants whose altered proteins work at one end of the range and fail at the other. Because of that, temperature-sensitive mutations have been a standard tool for identifying genes essential to cell physiology.
The three classes, with the organisms that matter
Mesophiles: optimum 20-40 C, min 15 C, max 45 C
- Escherichia coli and Bacillus subtilis, the two workhorse model bacteria
- Most human pathogens are mesophiles, because we are 37 C
- Much of what we know about protein, membrane and DNA structure came from this group simply because it is easy to grow
Psychrophiles: optimum near 15 C, growth down to -10 C
The book makes a point that is easy to miss: Earth's biosphere is predominantly cold and permanently below 5 C. Psychrophiles are not a curiosity, they are the majority habitat.
- Found under Arctic icebergs, in Antarctic soil and subglacial lakes, and in the brine between polar sea-ice crystals down to -20 C
- Distinguish true psychrophiles from psychrotrophs (psychrotolerant): those grow below 7 C but have optima at 20-35 C
- Psychrotrophs are why milk spoils in your refrigerator, and Listeria monocytogenes grows at refrigeration temperature
Three mechanisms explain the cold tolerance. Their proteins are more flexible and need less heat to work, which is exactly why they denature easily above 20 C, an evolutionary trade-off. Their membranes carry a high proportion of unsaturated fatty acids such as oleic acid, so they stay fluid in the cold and become too fluid when warm. And glacier organisms carry antifreeze proteins and cryoprotectants such as trehalose that lower the freezing point by about 2 C, so they grow in ice without freezing.
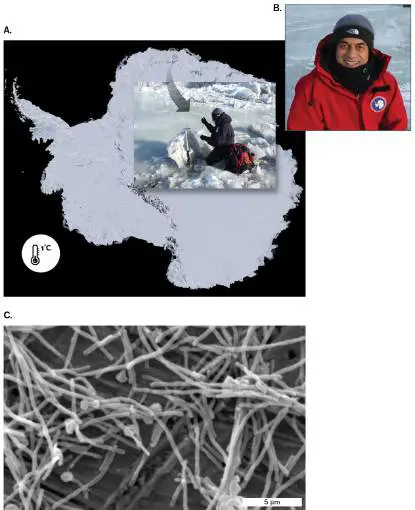
- Figure 51. Psychrophilic environments. Antarctica is cold, nutrient-poor and under high UV. Psychrotolerant Flavobacterium from a South Pole meltwater lake grows between 0 C and 22 C.
- Source: Slonczewski & Foster, Microbiology: An Evolving Science, 6e, Fig. 5.3
Thermophiles (50 C and up) and hyperthermophiles (above 80 C, up to 121 C)
- Found at thermal vents on the ocean floor and in hot springs on land
- 121 C is autoclave temperature, which is the point of the number
- Deep vent water can reach 400 C and stay liquid because of the pressure
- Thermus aquaticus, found in a Yellowstone hot spring by Thomas Brock, gave us Taq polymerase and therefore PCR
Four structural tricks keep a thermophile from falling apart. Their enzymes (thermozymes) contain relatively little glycine, the small flexible residue with no side chain, so the fold is stiffer; protein amino termini are often hydrogen-bonded down to the rest of the protein. They carry chaperones that refold thermally damaged proteins. Their genomes are packed with DNA-binding proteins and their gyrases coil DNA tightly, which makes it harder to denature. And their membranes use more saturated, straight-chain lipids that pack into an ordered, heat-stable layer.
The best structural answer on this topic: hyperthermophilic archaea use a lipid MONOLAYER, not a bilayer. Forty-carbon isoprenoid chains are ether-linked to glycerol phosphate on both faces, tethering the two sides together. A bilayer peels apart under heat; a monolayer cannot.
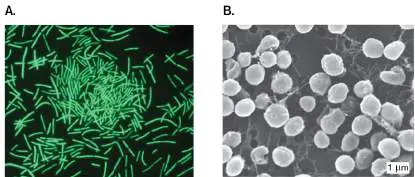
- Figure 52. Thermophiles. A. Thermus aquaticus, the source of Taq polymerase. B. Methanocaldococcus jannaschii grown at 80 C and 114 psi.
- Source: Slonczewski & Foster, Microbiology: An Evolving Science, 6e, Fig. 5.4
A practical footnote worth remembering because it inverts the usual mesophile bias: thermophilic proteins are easier to crystallize than mesophilic ones, so many of the 3D protein structures in your textbook come from thermophiles and psychrophiles rather than from E. coli.
The heat-shock response
- Triggered when a cell encounters a temperature above its comfort zone
- The response is a batch of stress-response genes switched on fast (regulation covered later, in Chapter 10)
- Products include chaperones that hold proteins in shape, plus enzymes that change membrane lipid composition
- First identified in E. coli by Tetsuo Yamamori and Takashi Yura in 1982, and since found in almost every organism examined
- The known exception: Antarctic marine organisms living at a rock-steady -1.9 C, which never need it
Pressure (still Section 5.1)
- Sea level is 1 atm = 0.101 MPa = 14.7 psi
- Deep ocean averages about 400 atm and reaches 1,000 atm (101 MPa, 14,700 psi) in trenches
- Barophile (= piezophile) REQUIRES elevated pressure to grow
- Barotolerant grows well from 1 to 50 MPa and falls off above that
The distinction is required-versus-tolerated, and it is the same distinction as halophile versus halotolerant. Reading Fig. 5.7 the right way is the exam skill: a barophile's curve PEAKS at high pressure, a barotolerant organism's curve peaks low and merely extends.
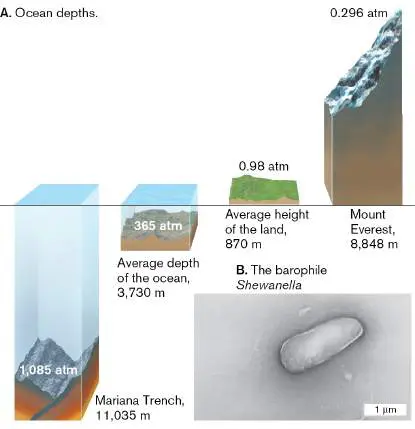
- Figure 53. Barophilic environments. The Challenger Deep in the Mariana Trench is 11,035 m down, at 110 MPa, over a thousand times surface pressure. B. A barophilic Shewanella from sediment 6.8 miles down.
- Source: Slonczewski & Foster, Microbiology: An Evolving Science, 6e, Fig. 5.6
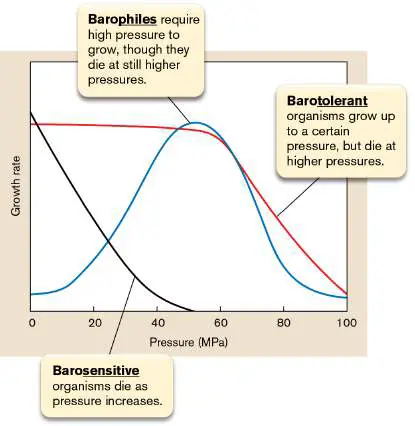
- Figure 54. Growth rate against pressure. Barophiles require the pressure; barotolerant organisms merely survive it.
- Source: Slonczewski & Foster, Microbiology: An Evolving Science, 6e, Fig. 5.7
Most barophiles are also psychrophiles, because the ocean floor averages 2 C. The exception that proves the range: barophilic hyperthermophiles support the thermal vent communities of tube worms and giant clams. Thermococcus piezophilus, isolated in 2016 from a vent 4,969 m down, has the broadest known pressure range of any organism, 1 to 120 MPa, with an optimum at 50 MPa that matches its habitat.
Mechanism is still partly unknown. What is known: pressure and cold both decrease membrane fluidity, so deep-sea bacteria load their phospholipids with polyunsaturated fatty acids to compensate. Internal structures matter too. E. coli ribosomes dissociate above 60 MPa, which caps its growth at 50 MPa, so barophile ribosomes must be built differently. In Pyrococcus yayanosii CH1, moving either above or below the 50 MPa optimum changes the expression of many ribosomal genes.
Osmolarity and halophiles (Section 5.2)
Water activity: the quantity that actually matters
Water is not simply present or absent. What matters is how much of it is free rather than bound to solutes, and that is water activity (a-w), measured as the ratio of the solution's vapor pressure to that of pure water. If the air above a sample is 97% saturated, a-w is 0.97.
- More solutes means lower water activity, so a-w and osmolarity move in opposite directions
- Most land and freshwater bacteria need a-w above 0.95
- Seawater is 3.5% NaCl (0.6 M), a-w about 0.95
- Halophiles work down to a-w 0.75, the solubility limit of NaCl, about 30% w/v or 5 M
- Extreme halophiles require 15-30% NaCl; moderate halophiles prefer 6-15%; most bacteria manage only 0.05-1 M (0.2-5%)
This is the whole basis of food preservation by salting, sugaring and drying. You are not removing water, you are lowering its activity, so spoilage organisms cannot use what is there.
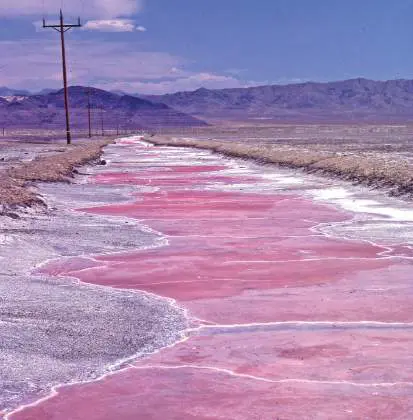
- Figure 55. Halophilic salt flats east of Fallon, Nevada, coloured pink-red by the sheer number of halophiles living in them.
- Source: Slonczewski & Foster, Microbiology: An Evolving Science, 6e, Fig. 5.8
Three defences against osmotic stress
A cell membrane is semipermeable, so internal and external osmolarity can differ. Water then moves from the low-solute side to the high-solute side. Too much movement either way is destructive: even a walled bacterium that cannot burst can have its membrane transport systems inactivated by the force.
1. Aquaporins, for speed
- Protein water channels that let water cross far faster than plain diffusion
- Speed is protective: it lets the cell equalize before the pressure difference does damage
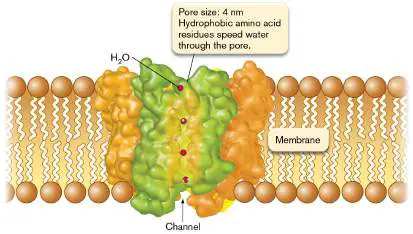
- Figure 56. Aquaporin, viewed down the channel that water molecules move through.
- Source: Slonczewski & Foster, Microbiology: An Evolving Science, 6e, Fig. 5.9
2. Compatible solutes, for hypertonic conditions
- When outside osmolarity is higher, the cell raises its own internal osmolarity so water has no reason to leave
- Compatible means the solute does not disrupt metabolism even at high intracellular concentration: proline, glutamic acid, potassium, betaine
- Na+ is NOT a compatible solute. High internal sodium disturbs metabolism, which is why even halophiles pump sodium out and swap in potassium
3. Mechanosensitive channels, for hypotonic conditions
- When outside osmolarity is lower, water floods in and internal pressure rises
- Pressure-gated channels open and leak small solutes out, lowering internal osmolarity and stopping the influx
- Think of it as a pressure-relief valve
Beyond a certain range, none of the three is enough and the cell mounts a global response: chaperone synthesis much like heat shock, plus changes to outer membrane pore composition in Gram-negatives.
How halophiles actually do it
- Halophilic bacteria rely mainly on organic compatible solutes: proline, betaine, glutamic acid
- Extreme halophilic archaea rely instead on accumulating inorganic ions, mostly potassium, at molar concentrations
- Their proteins and ribosomes have evolved to require that potassium, which is why halophilic archaea cannot grow at low salt: it is a requirement, not a tolerance
- Halophile proteins carry unusually many acidic side chains, and water forms a cage around those charges that protects the protein from dehydration
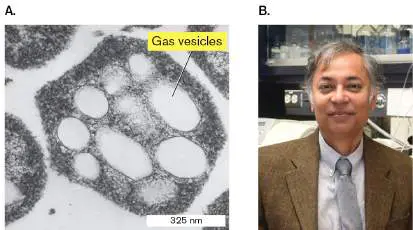
- Figure 57. Halophilic archaea. A. Halobacterium in cross section; the gas vesicles let it float up to better-oxygenated water. B. Shiladitya DasSarma's group, who sequenced Halobacterium NRC-1.
- Source: Slonczewski & Foster, Microbiology: An Evolving Science, 6e, Fig. 5.10
pH (Section 5.3)
The surprising headline
Cells tolerate a wider range of hydrogen ion concentration than of virtually any other chemical. E. coli survives pH 2 to 10, a hundred-million-fold range in concentration, though it only grows between 4.5 and 9. Across all microbes the range runs from pH 0 to 11.5.
The mechanism question and the classification question have different answers, and mixing them up is the classic error here. Enzymes from acidophiles, neutralophiles and alkaliphiles all work best around pH 5 to 8.5. What differs between the classes is not enzyme chemistry, it is pH homeostasis: how well the cell holds its cytoplasm near neutral while the outside is not.
Unlike temperature, internal pH need not match external pH, because membranes are relatively impermeable to protons. That impermeability is the whole trick.
Weak acids: the loophole
- A charged proton cannot cross the membrane, but the uncharged form of an organic acid (HA) crosses freely
- Once inside, it dissociates and releases the proton, acidifying the cytoplasm
- Lactic acid from lactobacilli making yogurt is self-imposed acid stress, and the acid buildup is what stops growth and leaves the food value intact
- The food industry weaponizes this by adding citric or sorbic acid, controlling growth at a pH that does not ruin flavour
The three classes
| Class | Growth pH | How it copes | Example |
|---|---|---|---|
| Neutralophile | pH 5-8 | Holds internal pH just above neutral, or lets it drift while keeping about 0.5 unit of delta-pH across the membrane | E. coli, Salmonella enterica, most human pathogens |
| Acidophile | pH 0-5 | Tetraether lipids cut proton permeability; proton extrusion; a net positive internal charge that repels external H+. Internal pH stays more acidic than a neutralophile's but far less acidic than outside | Sulfolobus acidocaldarius (also a thermophile) |
| Alkaliphile | pH 9-11 | Cell-surface barrier with acidic polymers and excess hexosamines in the peptidoglycan; diether lipids stop protons leaking out; Na+/H+ antiporters pull protons IN; runs on a sodium motive force | Natronobacterium gregoryi, Spirulina, from soda lakes |
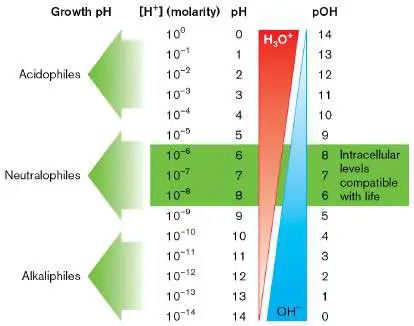
- Figure 58. Classification of organisms by optimal growth pH, with the pOH scale alongside. Remember pH + pOH = 14.
- Source: Slonczewski & Foster, Microbiology: An Evolving Science, 6e, Fig. 5.11
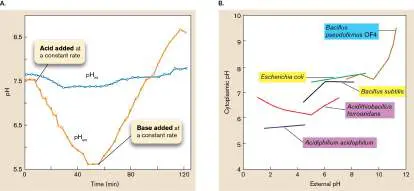
- Figure 59. pH homeostasis. A. Internal pH of E. coli as external pH is swung by acid then base. B. Cytoplasmic pH versus external pH for acidophiles, neutralophiles and alkaliphiles: three offset lines, all much flatter than the diagonal.
- Source: Slonczewski & Foster, Microbiology: An Evolving Science, 6e, Fig. 5.12
Two details that make good short-answer material. Alkaliphiles are usually halophiles as well, because their Na+/H+ antiporters expel sodium while pulling protons in, which incidentally confers salt resistance. And secreted enzymes from alkaliphiles genuinely do work at extreme pH, which is why base-resistant proteases, lipases and cellulases from alkaliphiles go into laundry detergent used at pH 10.
One nutrient consequence worth knowing: pH controls nutrient availability. Ferric hydroxide, the dominant form of iron in nature, is very insoluble above pH 7, so alkaliphiles need unusually efficient iron transport systems (the siderophores from Section 4.2).
Oxygen (Section 5.4)
This is the part of the section Rowen said to know cold. His words in class were that you will meet these terms as soon as you start reading about your Microbe Project organism, and that the oxygen ones in particular are fundamental.
Why oxygen is both a benefit and a risk
The benefit: a terminal electron acceptor
- Some microbes get ATP only by fermenting carbohydrate, which needs no oxygen
- Others run an electron transport system (ETS, also called the cytochrome system), pulling energy out of electrons taken from an energy source
- Energy released as electrons move down the ETS pumps H+ out, creating the proton motive force, the cell's biobattery
- The process is called respiration if the electron donor is organic and lithotrophy if it is inorganic
- At the end of the chain the electron must be handed to a terminal acceptor. If that acceptor is O2, the product is water, it diffuses away, and the path is clear for the next electron. That is aerobic respiration
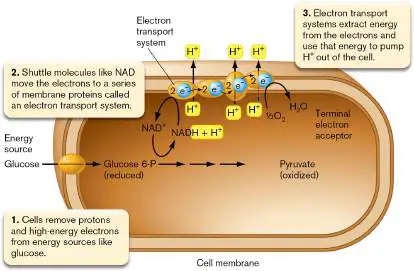
- Figure 60. Oxygen as the terminal electron acceptor. Protons pumped out by the ETS build the gradient; O2 at the end of the chain clears the path for the next electron.
- Source: Slonczewski & Foster, Microbiology: An Evolving Science, 6e, Fig. 5.17
The risk: reactive oxygen species
The damage pathway does not require the organism to use oxygen at all. Any organism carrying NADH dehydrogenase 2, aerobe or anaerobe, will autooxidize the enzyme's FAD cofactor in the presence of oxygen.
FAD autooxidation -> superoxide (O2-) -> hydrogen peroxide (H2O2) -> [Fenton reaction with Fe2+] -> hydroxyl radical (OH-)
- All three reactive oxygen species strip electrons from DNA, RNA, protein and lipid
- The Fenton step needs ferrous iron, which comes from the cell's own cytochromes
- Autooxidation and the Fenton reaction happen spontaneously; the detoxifying steps need enzymes
- Superoxide dismutase removes superoxide. Catalase and peroxidase remove hydrogen peroxide
- Aerobes also carry repair systems for oxidatively damaged macromolecules
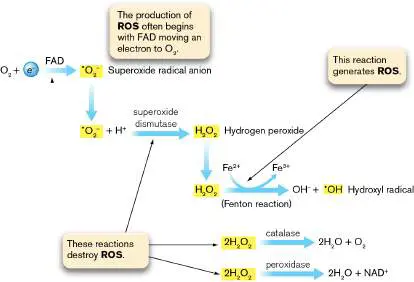
- Figure 61. Generation and destruction of reactive oxygen species. The two spontaneous steps are FAD autooxidation and the Fenton reaction; everything that removes ROS is enzymatic.
- Source: Slonczewski & Foster, Microbiology: An Evolving Science, 6e, Fig. 5.18
The clean answer to 'why do anaerobes die in oxygen' has three parts, and the book gives all three. (1) Some lack the enzymes to destroy the ROS their own metabolism makes. (2) Some have the enzymes but dissolved O2 raises the redox potential far enough to block the alternative electron acceptors they need. (3) Oxygen directly oxidizes metal cofactors and inactivates key enzymes. Only answer (1) is the usual guess, so the other two are where the points are.
The five classes
| Class | Grows where | Energy metabolism | ROS enzymes | Examples |
|---|---|---|---|---|
| Strict (obligate) aerobe | Only in O2 | Aerobic respiration only | Full set | Azotobacter, Neisseria, Pseudomonas fluorescens, Rhizobium |
| Facultative anaerobe | With or without O2 | Both fermentative and respiratory; picks by what is available | Full set | E. coli, Bacillus anthracis, Saccharomyces cerevisiae, Staphylococcus, Vibrio cholerae |
| Microaerophile | Only at low O2 | Respiratory, needs some O2 | Reduced superoxide dismutase and/or catalase | Campylobacter, Helicobacter pylori, Lactobacillus, Treponema pallidum |
| Aerotolerant anaerobe | Throughout, but indifferent to O2 | Fermentation only | Superoxide dismutase and peroxidase, sometimes a little catalase | Streptococcus pneumoniae |
| Strict (obligate) anaerobe | Only without O2 | Anaerobic respiration (non-O2 terminal acceptor such as nitrate) or fermentation | Missing or inadequate | Actinomyces, Bacteroides, Clostridium, Desulfovibrio |
The distinction students lose points on is facultative anaerobe versus aerotolerant anaerobe, because both grow up and down the tube. Rowen gave the discriminator in class: the facultative anaerobe grows to a HIGHER DENSITY at the top, because with oxygen it can respire and extract more energy per unit of food. The aerotolerant anaerobe ferments either way, so oxygen buys it nothing and its growth is even.
A nuance the book adds and most study sheets omit: some organisms long classified as strict anaerobes, Bacteroides fragilis for one, are really transiently aerotolerant. They carry low levels of protective enzymes and can even use very low oxygen as a terminal acceptor.
The book also makes an evolutionary point worth quoting back on an essay. The basic composition of all cells reflects an anaerobic origin: lipids, nucleic acids and amino acids are all highly reduced, which is why our bodies are combustible. We could not have evolved that chemistry if O2 had been present from the start. Even now most microbes are anaerobic, living in soil, in our gut, and in the biofilms on our teeth.
Reading the standing test tube
The tube is a thioglycolate or plain broth tube left unshaken, so oxygen diffuses in from the top and a gradient forms: oxygenated at the surface, 5 micromolar or less at the bottom.
| Growth pattern in the tube | Class | Why |
|---|---|---|
| Band at the very top only | Strict aerobe | Needs O2 as terminal acceptor |
| Band just below the surface | Microaerophile | Needs O2 but is poisoned by atmospheric levels |
| Growth throughout, densest at the top | Facultative anaerobe | Respires where there is O2 (more energy, higher density), ferments where there is not |
| Growth evenly throughout | Aerotolerant anaerobe | Ferments regardless; O2 neither helps nor harms |
| Bottom only | Strict anaerobe | O2 is toxic |
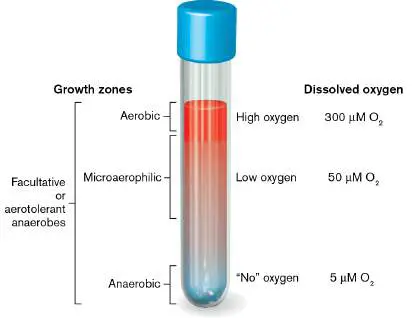
- Figure 62. Oxygen-related growth zones in a standing test tube. The five patterns map one to one onto the five classes.
- Source: Slonczewski & Foster, Microbiology: An Evolving Science, 6e, Fig. 5.19
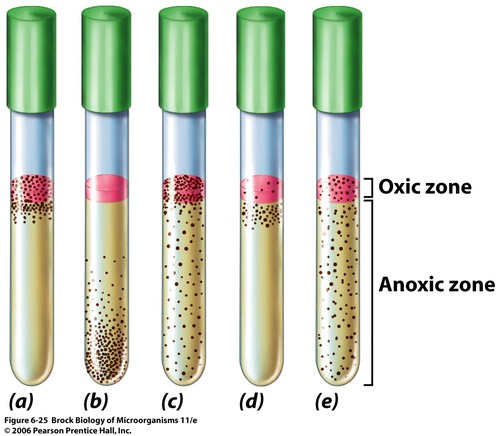
- Figure 63. The in-class exercise: five tubes, classify each. This is very likely to reappear on the exam in exactly this form.
- Source: Dr. Rowen, BIOL 4640 Lecture 4 slides (lec04_s39_21.jpg)
Rowen's honest caveat from class, worth keeping in mind for lab but not for the exam: these tubes work far less cleanly in practice than in the figure. Inoculating without stirring oxygen through the medium is hard, and his lab's supposed obligate anaerobes often grow down the whole tube. The exam will use the idealized figure.
Culturing anaerobes: three techniques
- Reducing agents or enzymes in liquid medium. Thioglycolate, or an enzyme system such as Oxyrase, strips dissolved O2 so anaerobes grow below the surface
- Anaerobe jar. Streaked plates go into a sealed jar with a foil packet that releases H2 and CO2; a palladium catalyst in the lid combines the H2 with the jar's O2 to make water. The CO2 is needed by some organisms for key metabolic intermediates. A different packet gives the low-O2, high-CO2 mix that Helicobacter pylori and Campylobacter jejuni need
- Anaerobic glove box. For strict anaerobes: the atmosphere is pulled out under vacuum and replaced with a defined N2/CO2 mixture
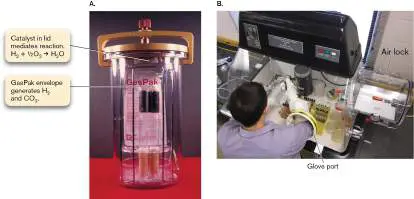
- Figure 64. Anaerobic growth technology. A. An anaerobe jar. B. An anaerobic chamber with glove ports.
- Source: Slonczewski & Foster, Microbiology: An Evolving Science, 6e, Fig. 5.20
Why anyone bothers: the anaerobes include tetanus, botulism and gangrene, and Clostridium botulinum is a potential bioterror agent. Looking forward, mass spectrometry of proteins released from lysed cells is starting to identify anaerobes from blood without culturing them at all.
Lecture 4 Companion: what the professor emphasized in class (Aug 31, 2026)
Rowen reached this material in the last third of Lecture 4, after finishing the growth-rate calculations, and ran out of time partway into Chapter 2. What he did cover here he covered deliberately.
How he framed the whole block
- He introduced it as 'a variety of things that can affect the growth of organisms', listing nutrients (type and level), temperature, oxygen availability, pressure, osmotic/salt level, and pH
- Then the key move: these same parameters are used to classify and describe microbes, not just to set conditions
- He said explicitly that these terms will come up in your descriptions of bacteria for the Microbe Project, and that you should know them, 'particularly these oxygen ones'
Temperature, as he taught it
- Grow the organism at different temperatures, measure growth rate at each, plot it, and report the optimum
- The curve rises gradually and then falls off sharply above the optimum
- Human pathogens sit near 37 C and are mesophiles; they cannot grow at 50 C
- Thermophiles come from environments like hot springs
- Some psychrophiles grow in your refrigerator
- On the 1000/T plot he stressed that low values are at high temperature: the axis is inverted. He read the optimum off at roughly 39-42 C
- You can run the same experiment varying pH instead of temperature
Oxygen, as he taught it
- He listed the five terms and defined each: aerobe usually means obligate aerobe and requires O2; anaerobe usually means obligate anaerobe; facultative grows in presence or absence; microaerophile grows only at low O2; aerotolerant anaerobe does not use O2 but grows in its presence
- He walked through how the gradient tube is made: autoclaving drives oxygen out, then the cap lets oxygen diffuse back in from the top
- He then set the five-tube classification exercise as a talk-to-your-neighbour problem
- His discriminator for facultative versus aerotolerant: higher density in the presence of oxygen, because respiration extracts more energy from the same food than fermentation does. E. coli is his example
What he did NOT get to
- He stopped partway into the Chapter 2 microscopy slides, at the point about physics limiting how powerful a light microscope can be
- Slides 45 to 52 (standard light microscopy, the compound microscope, the four factors limiting light microscopy) were not covered and are scheduled for Lecture 6 on 9/4
- Section 5.5 (starvation) and 5.6 (control of microbes) were not assigned here; they belong to Unit 5 and Exam 4
Slide erratum to note in your own copy: slide 35 says 'Temperature (see section 5.2)'. Temperature is section 5.1. Section 5.2 is Osmolarity and Halophiles. Slide 37 cites 5.4 for oxygen, which is correct.
Lecture 4 Practice Quiz: environmental factors (with answer key)
Try these cold before looking at the key. Built from the Lecture 4 slides, the class recording, and sections 5.1-5.4.
Multiple choice
- Q1. On a plot of growth rate constant against 1000/T (Kelvin), moving to the RIGHT along the x-axis means: (A) higher temperature (B) lower temperature (C) higher pressure (D) lower pH
- Q2. An organism grows evenly from top to bottom of a standing broth tube, with no density difference. It is most likely: (A) facultative anaerobe (B) aerotolerant anaerobe (C) microaerophile (D) strict aerobe
- Q3. The Arrhenius relationship predicts that a 10 C rise in temperature will: (A) halve the growth rate (B) roughly double the growth rate (C) leave it unchanged (D) increase it tenfold
- Q4. Which is NOT a compatible solute? (A) proline (B) betaine (C) sodium ion (D) potassium ion
- Q5. An organism requires 380 atm or more to grow. It is a: (A) barotolerant organism (B) barophile (C) halophile (D) psychrophile
- Q6. Hyperthermophilic archaea resist heat partly because their membrane is: (A) a bilayer of unsaturated fatty acids (B) a lipid monolayer of ether-linked isoprenoid chains (C) a peptidoglycan sheet (D) an outer membrane of LPS
- Q7. The Fenton reaction produces: (A) superoxide (B) hydrogen peroxide (C) hydroxyl radical (D) water
- Q8. Enzymes from acidophiles typically have pH optima of about: (A) 0-1 (B) 2-3 (C) 5-8.5 (D) 10-11
- Q9. Milk spoiling in a refrigerator is usually caused by: (A) true psychrophiles (B) psychrotrophs (C) thermophiles (D) halophiles
- Q10. Alkaliphiles are often also halophiles because: (A) soda lakes are cold (B) their Na+/H+ antiporters expel sodium while importing protons (C) they use salt as an energy source (D) high pH dissolves more salt
Short answer
- S1. Two tubes both show growth from top to bottom. How do you tell the facultative anaerobe from the aerotolerant anaerobe, and what is the underlying reason?
- S2. Give the three distinct reasons an obligate anaerobe fails to grow in oxygen.
- S3. Why does the growth-rate curve fall off faster on the hot side than the Arrhenius equation predicts?
- S4. Salting meat preserves it. State the mechanism using the correct term.
- S5. Enzymes from an acidophile and from an alkaliphile both work best near neutral pH. So what actually differs between the two organisms?
Answer key
- Q1 B. The x-axis is the inverse of temperature, so right is colder. This is the axis trap Rowen flagged.
- Q2 B. Even growth with no density gradient means oxygen changes nothing, which is fermentation only. A facultative anaerobe would be visibly denser at the top.
- Q3 B. Roughly double per 10 C, within the growth range only.
- Q4 C. Sodium disturbs metabolism at high internal concentration; even halophiles pump it out and substitute potassium.
- Q5 B. Requires the pressure. Barotolerant merely survives 10-500 atm.
- Q6 B. Forty-carbon isoprenoid chains ether-linked to glycerol phosphate on both faces. A bilayer peels apart under heat; a monolayer cannot.
- Q7 C. Fe2+ plus hydrogen peroxide gives the hydroxyl radical. Superoxide comes from FAD autooxidation; hydrogen peroxide comes from reducing superoxide.
- Q8 C. This is the point of the section: enzyme optima are ordinary across all three classes. What differs is pH homeostasis, not enzyme chemistry.
- Q9 B. Psychrotrophs (psychrotolerant) grow below 7 C but have optima at 20-35 C. True psychrophiles optimum near 15 C and grow poorly above 20 C.
- Q10 B. The antiporter that keeps their internal pH down happens to expel sodium, which confers salt resistance as a side effect.
- S1. The facultative anaerobe grows to higher density at the top. With oxygen it respires, and respiration extracts far more energy per unit of substrate than fermentation, so it builds more biomass. The aerotolerant anaerobe ferments whether oxygen is there or not, so density is uniform.
- S2. (1) It lacks the enzymes to destroy the ROS its own metabolism generates. (2) Dissolved O2 raises the redox potential enough to interfere with the alternative terminal electron acceptors it needs. (3) O2 directly oxidizes metal cofactors and inactivates key enzymes.
- S3. Arrhenius describes reaction rate, and it holds while proteins stay folded. Above the optimum, critical enzymes denature and the failure is catastrophic rather than gradual, so the real curve drops off a cliff. On the cold side the analogous limit is membrane rigidity, which comes on more gradually.
- S4. Salt lowers the water activity of the food. The water is still present but bound to solute and unavailable, and spoilage organisms cannot grow below their minimum a-w. Most need a-w above 0.95.
- S5. Their pH homeostasis machinery, not their enzymes. The acidophile uses tetraether lipids to cut proton permeability, proton extrusion, and a net positive internal charge. The alkaliphile uses an acidic cell-surface barrier, diether lipids, Na+/H+ antiporters that import protons, and a sodium motive force. Both end up with a cytoplasm near neutral.
Mnemonic set for 5.1-5.4
- Philes require, tolerants merely survive. Halophile needs salt, halotolerant puts up with it. Barophile needs pressure, barotolerant puts up with it. This one distinction is worth two or three questions.
- Ten up, twice as fast. Arrhenius, within range only.
- Cold is flexible, hot is stiff. Psychrophile proteins are flexible and membranes unsaturated. Thermophile proteins are low-glycine and stiff, membranes saturated, archaeal ones a monolayer.
- Enzymes are ordinary, plumbing is not. Every pH class runs enzymes with near-neutral optima. Only the homeostasis differs.
- FAD makes it, Fenton finishes it, SOD and catalase clean it. Superoxide from FAD autooxidation, hydroxyl radical from Fenton, removal by superoxide dismutase then catalase/peroxidase.
- Top, just-below, everywhere-heavy-on-top, everywhere-even, bottom. The five tube patterns in order: strict aerobe, microaerophile, facultative anaerobe, aerotolerant anaerobe, strict anaerobe.
Figures are from Slonczewski & Foster, Microbiology: An Evolving Science, 6e (the course textbook), plus screenshots from Dr. Rowen's lecture slides where noted.
Contents
Right-click here and choose Update Field to build the contents.
Why this is on the exam at all
The syllabus lists Unit 1 as "lecture notes, 2.1-2.6, 4.3, 4.4". The lecture-notes item is not filler. It is Lecture 1's course introduction plus Lecture 2 Part A, and none of it appears in Slonczewski. If you revise only from the textbook you will walk into Exam 1 having never seen this material.
Two reasons to take it seriously. First, it is the only part of Unit 1 with an assigned outside reading, the Hierarchy of Evidence article. Second, it is the material the Microbe Project is graded against, so you will use it whether or not it is examined.
Where to search (Lecture 2, slide 7)
| Tool | What it is good for | What it costs you |
|---|---|---|
| Browser search, with or without AI | Orientation, and finding the vocabulary of a field you do not know yet | No quality filter at all. Everything is mixed together |
| AI directly | Fast, formatted, and good at turning a vague question into search terms | It fabricates citations. Every reference has to be confirmed against a real record before you use it |
| Wikipedia | A fast orientation to a genus and a starting reference list | Not citable as a source. Follow its references to the primary literature |
| PubMed | The biomedical database. Indexed, has PMIDs, links to full text | Biomedical bias, so environmental microbiology is under-represented |
| Google Scholar | Broadest coverage, catches preprints, theses and non-biomedical journals | No quality control on what it indexes; citation counts flatter old papers |
The pairing that actually works, and the one Assignment 1 grades: use AI to GENERATE candidates, then use PubMed or Google Scholar to VERIFY each one. Speed from the first, credibility from the second. Answering the assignment's part (d) honestly means saying exactly that.
A search-term trick worth carrying
- Adding "sp. nov." to a query restricts results to papers formally naming a NEW species. Species nova appears in the title of a species description
- That turns a vague search into primary species descriptions rather than papers that merely mention the organism in passing
- Same logic for "gen. nov." (new genus) and 16S rRNA, which pulls papers that did the phylogenetic identification rather than just citing it
Types of papers (slides 8 and 9)
Basic research, the three kinds
| Category | What it reports | Microbiology examples |
|---|---|---|
| Primary observational | What is there, without an intervention | Genome reports. Metagenomic or biome studies that list the organisms present in a habitat |
| Primary experimental | The researchers changed something and measured the result | Mutant versus wild-type growth rates; a knockout's effect on resistance |
| Secondary review | No new data. It synthesizes what other papers found | A review of thermophile adaptations; a book chapter |
The distinction that gets tested is PRIMARY versus SECONDARY, and it is about whether the paper generated the data it reports, not about how long or how authoritative it is. A genome report with no hypothesis is still primary. A magisterial 60-page review is still secondary.
Medical study designs, weakest to strongest
| Design | What it does | Main weakness |
|---|---|---|
| Case report | One patient described in detail | n = 1. No comparison group, so no rate and no causation |
| Case series | Several similar patients | Still no control group. Selection is by whoever showed up |
| Cross-sectional study | A population sampled at ONE point in time | A snapshot, so exposure and outcome are measured together and you cannot tell which came first |
| Case-control study | Start with people who HAVE the outcome, look backwards for exposure | Recall bias, and control selection decides the answer |
| Cohort study, retrospective or prospective | Start with EXPOSURE, follow forward to see who develops the outcome | Slow and expensive if prospective; confounding is never fully removed |
| Randomized controlled trial (RCT) | The investigator ASSIGNS the exposure at random | Expensive, sometimes unethical, and trial populations can be unlike real patients |
| Systematic review (SR) | A reproducible search and appraisal of every study on a question | Only as good as the studies it finds. Garbage in, garbage out |
| Meta-analysis (MA) | A systematic review that also pools the results statistically | Pooling heterogeneous studies can manufacture a precise wrong answer |
The single fact that separates an RCT from everything below it: RANDOM ASSIGNMENT by the investigator. Randomization is what balances the confounders you did not think to measure. Every observational design, however large, can only adjust for confounders someone anticipated.
The hierarchy of evidence (slide 11)
Rowen's slide gives a five-rung version of the pyramid. Learn it in this order, top down, because the exam question is usually "which of these is the strongest evidence".
| Rank | Level | Why it sits there |
|---|---|---|
| 1 (strongest) | Systematic reviews and meta-analyses | They aggregate all the RCTs, so random error shrinks and publication bias can at least be looked for |
| 2 | Randomized controlled trials | Random assignment balances known AND unknown confounders |
| 3 | Cohort studies | Exposure is measured before outcome, so the time order is right, but assignment is not random |
| 4 | Cross-sectional studies | One time point, so exposure and outcome are simultaneous and causation is unavailable |
| 5 (weakest) | Case studies | No comparison group at all |
- Case-control studies sit between cross-sectional and cohort on most versions of the pyramid; the slide's five-rung version folds them in
- Expert opinion and editorials sit BELOW case studies on the standard pyramid, which is the point most people find surprising
- The hierarchy ranks protection against BIAS, not importance. A case report of a novel resistance mechanism can matter enormously and still be rung 5
- It is a hierarchy for questions about EFFECT. For a question like "does this organism exist in this habitat", a single good observational genome report is the right evidence and an RCT would be meaningless
Carry the reason, not just the ladder: as you climb, you gain control over confounding and lose feasibility and generalizability. That trade-off is what the whole pyramid encodes.
Evaluating what you find (slide 10)
The slide gives four checks. They are worth expanding, because "assess quality and likely accuracy" is the actual skill.
| Check | What to ask | Red flag |
|---|---|---|
| Authors | Who did the work, and do they work in this field? | No institutional affiliation; a single author on a large empirical claim |
| Where published | Peer-reviewed journal, preprint server, conference abstract, or a website? | A journal you cannot find indexed anywhere; a publisher that solicits by email |
| Methods and results | Are the methods described well enough to repeat? Do the results shown support the claim made? | Conclusions in the abstract that the data never test; no sample sizes; no controls |
| Type of study | Where does it sit on the hierarchy? | A case report or a review being cited as though it demonstrated causation |
The AI-specific check
- AI models fabricate citations that look perfectly formed: real-sounding authors, plausible journal, plausible volume and pages
- So the verification step is not optional and not a formality. Look the reference up in PubMed and confirm the authors, title, volume, pages and DOI all match
- A PMID is the cheapest proof a paper exists. If you cannot find one and the paper is biomedical and post-1950, treat the citation as unverified
- This is graded: Assignment 1 asks you to "Confirm they are real articles"
The genomics databases the project requires (Assignment 2)
Assignment 1 is about literature. Assignment 2 moves to sequence databases, and the workflow is the same: ask AI first, then verify by hand.
| Database | What it holds | What you check there |
|---|---|---|
| NCBI Genome | Assembled genomes, with assembly accessions (GCF_...) | Whether a high-quality genome exists. Filter to complete or chromosome-level assemblies, and record 2-4 strain names |
| JGI IMG (Integrated Microbial Genomes and Microbiomes) | DOE's genome and metagenome collection, with its own annotation pipeline | Whether the SAME strain you found at NCBI is also present here. You want one strain in both |
| MetaCyc | Curated metabolic pathways and enzymes | Whether the organism's pathways are curated, which is what makes a metabolic prediction possible |
| Bergey's Manual of Systematics of Archaea and Bacteria (BMSAB) | The authority on prokaryotic taxonomy and description | Whether the GENUS is formally described there |
Why the assignment insists on a genome that is complete or chromosome-level and present in more than one database: course objective 2 asks you to predict an organism's properties from its genome. A fragmentary draft assembly full of contigs cannot support that, and a genome only one database has seen has not been independently curated.
The Microbe Project, and how these lectures feed it
- Step 1, choose a biome. Rowen's suggestions: hot spring or deep-sea vent, ocean water, soil from a named place, animal gut microbiome (particularly short-chain-fatty-acid producers), or bioremediation, using bacteria to remove toxins or waste such as plastic
- You are then grouped with others working the same or a similar biome
- Assignment 1, due 8/28. Find four bacterial species reported in the literature to occur in your biome, by two different search routes, and report at least two sources per route
- Assignment 2, due 9/4. Check at least two of those species for a high-quality genome, then select ONE organism for your project
- Check with your group so nobody duplicates an organism. Rowen said in class he double-checks for duplication and will ask someone to switch
- You may enter two species with different genera in the Excel file and select one of them afterwards
The reason the project forces a genome check before you commit: your organism has to be one you can actually answer course objective 2 about. Picking a charismatic microbe with no finished genome makes the rest of the semester harder.
Practice Quiz: finding and evaluating information (with answer key)
Multiple choice
- Q1. Which sits at the TOP of the hierarchy of evidence? (A) a randomized controlled trial (B) a systematic review or meta-analysis (C) a cohort study (D) expert opinion
- Q2. A study starts with people who already have the disease and looks backwards for exposure. It is a: (A) cohort study (B) cross-sectional study (C) case-control study (D) RCT
- Q3. A genome report listing the organisms found in a hot spring is: (A) primary observational (B) primary experimental (C) secondary review (D) a meta-analysis
- Q4. What single feature separates an RCT from every observational design? (A) sample size (B) random assignment by the investigator (C) publication in a high-impact journal (D) statistical significance
- Q5. An AI gives you a citation with authors, journal, volume and pages. The correct next step is: (A) cite it (B) confirm it against PubMed or the journal (C) ask the AI whether it is real (D) cite it and add "as reported by AI"
- Q6. Adding "sp. nov." to a search restricts results to: (A) reviews (B) papers formally naming a new species (C) open-access papers (D) metagenomic surveys
- Q7. Which database would you use to check whether a genus is formally described in prokaryotic taxonomy? (A) NCBI Genome (B) MetaCyc (C) Bergey's Manual (D) Google Scholar
- Q8. Why does Assignment 2 want a complete or chromosome-level assembly? (A) the files are smaller (B) a fragmentary draft cannot support predicting the organism's properties from its genome (C) NCBI only stores complete genomes (D) it is required for a PMID
Short answer
- S1. A case report describes a novel antibiotic-resistance mechanism in one patient. It is rung 5 of the hierarchy. Explain why it can still be important, and what the hierarchy is actually ranking.
- S2. Give the honest trade-off between an AI search and a database search, and say how you would combine them.
- S3. Distinguish a cohort study from a case-control study by the direction each one runs in.
- S4. Why is Wikipedia useful but not citable?
Answer key
- Q1 B. Systematic reviews and meta-analyses aggregate the trials below them.
- Q2 C. Case-control runs backwards from outcome to exposure. Cohort runs forwards from exposure to outcome.
- Q3 A. It reports what is there without an intervention, so it is primary and observational.
- Q4 B. Random assignment is what balances unmeasured confounders. Nothing below the RCT can do that at any sample size.
- Q5 B. Fabricated citations are formatted exactly like real ones, so format proves nothing. Asking the AI is not verification either.
- Q6 B. Species nova appears in the title of a formal species description.
- Q7 C. Bergey's Manual of Systematics of Archaea and Bacteria is the taxonomic authority. NCBI holds sequence, MetaCyc holds pathways.
- Q8 B. Course objective 2 is prediction from the genome, and a draft full of contigs will not carry that weight.
- S1. The hierarchy ranks protection against BIAS for questions about effect, not importance or novelty. A single case can establish that a phenomenon EXISTS, which is a different claim from establishing how often it happens or what causes it. Existence claims need one good observation; effect claims need controls.
- S2. AI is fast and returns formatted citations immediately, but every one has to be checked because models fabricate plausible references. A database search is slower and less convenient but everything it returns is real and indexed. Combine them by generating candidates with AI and verifying each in PubMed or Google Scholar before use.
- S3. A cohort study starts from EXPOSURE and follows forwards to see who develops the outcome. A case-control study starts from the OUTCOME and looks backwards for exposure. Direction is the whole distinction.
- S4. It is a fast orientation to a topic and its reference list is a good entry into the primary literature. It is not citable because it is unsigned, editable by anyone, and is itself a tertiary source. Follow its references and cite those.
Mnemonic set
- SR, RCT, Cohort, Cross, Case. Rowen's five rungs, top to bottom. First letters: *S R C C C*, and the three Cs run in decreasing size of design.
- Cohort goes forward, case-control goes back. Exposure-first versus outcome-first.
- Random assignment is the whole ladder. Everything above the line has it; everything below adjusts for the confounders it happened to measure.
- Primary made the data, secondary read it. Length and authority are irrelevant to the distinction.
- Generate with AI, verify with PubMed. And a PMID is the cheapest proof a paper exists.
Unit 2 · Genomes, genome evolution & phylogeny
Course objective 2 lives here: "predict the properties of a bacterium based on an analysis of its genome." Expect to be handed an annotation and asked what the organism can do.
- Bacterial genome
- Usually one circular chromosome in the cytoplasm (nucleoid); supercoiled by gyrase + Topo I. Typically a few Mbp. Some genera carry multiple chromosomes or linear ones (Borrelia, Streptomyces).
- Plasmid
- Extrachromosomal replicon, usually circular dsDNA, replicating independently. Carries optional genes — resistance, virulence, conjugation, catabolic pathways.
- Origin of replication (oriC)
- Site where replication initiates; DnaA binds DnaA boxes; helicase loads. Bidirectional replication from a single origin, meeting at ter.
- Replication enzymes
- DnaB helicase, DnaG primase, DNA pol III holoenzyme (replicative), DNA pol I (Okazaki primer removal), ligase.
- Topoisomerases
- Type I makes single-strand cuts (Topo I); Type II makes double-strand cuts (DNA gyrase introduces negative supercoils, Topo IV decatenates daughters). Quinolone target.
- Open reading frame (ORF)
- Start codon → stop codon in one frame, long enough to be unlikely by chance. Annotation pipelines call ORFs, then assign function by homology.
- Genome annotation
- Structural annotation finds features (ORFs, rRNA, tRNA, ncRNA); functional annotation assigns them meaning via BLAST/HMM hits to Pfam, COG, KEGG. Homology-based function is a hypothesis, not a fact — "hypothetical protein" is often 30–40% of a genome.
- GC content & codon usage
- Genus-characteristic. A region whose GC% or codon bias departs sharply from the rest of the chromosome is a signature of recent horizontal acquisition.
- Genomic islands
- Large acquired blocks — pathogenicity islands, symbiosis islands, catabolic islands. Often flanked by direct repeats and inserted at tRNA genes, with an integrase nearby.
- Sequencing technologies
- Sanger (long-accurate, low throughput) → Illumina short reads (cheap, high accuracy, hard to assemble across repeats) → nanopore/PacBio long reads (span repeats, close a circular chromosome in one contig). Hybrid assemblies are the current default for a finished genome.
- Pan-genome
- Core genes shared by all strains of a species + accessory genes present in some. An open pan-genome (e.g. E. coli) signals heavy ongoing HGT.
- Transposable elements
- IS elements (insertion sequences) + composite transposons. Encode transposase, flanked by inverted repeats. Drive gene inactivation, inversions, and resistance-gene mobilization.
- Integrons
- Site-specific gene-capture systems: integrase + attI site + promoter, collecting gene cassettes in tandem. The main engine assembling multidrug-resistance arrays.
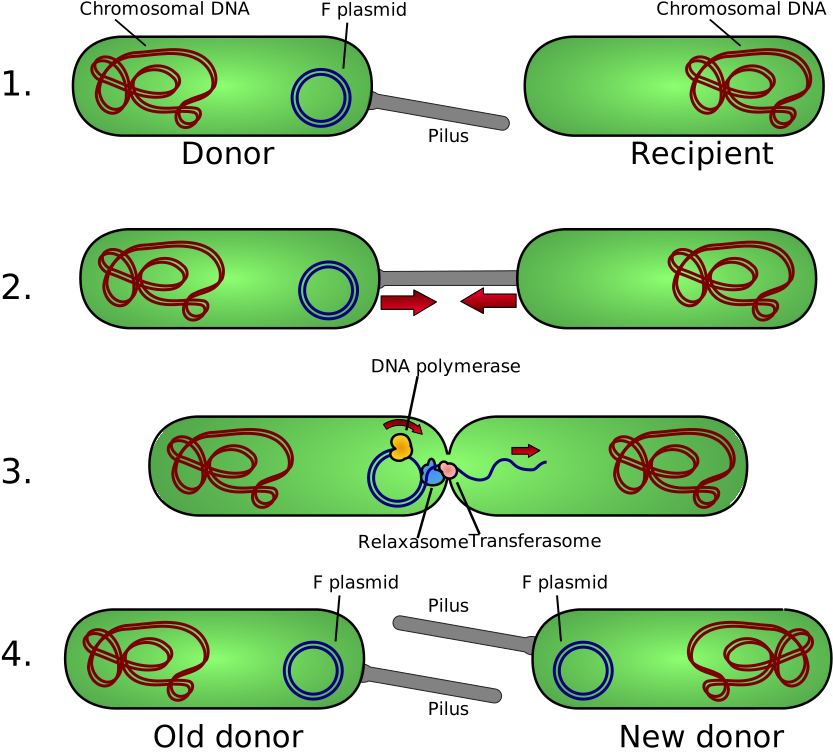
- Transformation
- Uptake of naked DNA from the environment by competent cells. Natural competence in Streptococcus pneumoniae, Bacillus subtilis, Neisseria; artificial via heat shock or electroporation.
- Transduction
- Phage-mediated DNA transfer. Generalized: any host DNA mispackaged. Specialized: imprecise prophage excision carries flanking genes.
- Conjugation
- Cell-to-cell DNA transfer through a pilus/T4SS. F+ donor transfers the F plasmid; Hfr strains have F integrated and transfer chromosomal genes in a time-ordered way — the basis of classic genetic mapping.
- Homologous recombination
- RecA-mediated strand exchange between similar sequences; how incoming DNA is stably integrated. RecBCD processes double-strand ends to generate the substrate.
- Site-specific recombination
- Integrase acting between defined sites (λ attP × attB); no sequence homology needed beyond the sites.
- Restriction–modification
- Innate defense: restriction endonuclease cuts unmethylated foreign DNA; cognate methylase protects the host's own. Type II enzymes are the cloning workhorses.
- CRISPR-Cas
- Adaptive prokaryotic immunity. Spacers acquired from past invaders → crRNA guides Cas nuclease → cleaves matching foreign DNA. Also a genome record of what has attacked this lineage.
- Genome reduction
- Obligate endosymbionts and intracellular pathogens lose genes their host supplies — Buchnera ~0.64 Mbp, Mycoplasma ~0.58 Mbp. Predicting phenotype from such genomes means reading what is missing.
- 16S rRNA
- Universal phylogenetic marker: conserved regions for priming, variable regions for discrimination. Basis of both taxonomy and culture-free community surveys. Poor at species-level resolution.
- Phylogenetic tree terms
- Node = inferred common ancestor; branch length = evolutionary distance; monophyletic clade = ancestor + all descendants; rooting requires an outgroup. Bootstrap values measure support, not truth.
- Species definition in bacteria
- No biological species concept. Operational thresholds: ~70% DNA–DNA hybridization, ~95–96% average nucleotide identity (ANI), ~98.7% 16S identity. All are conventions.
- Horizontal transfer vs the tree
- Extensive HGT makes a single "tree of life" an approximation — different genes give different trees. Core, rarely-transferred genes (ribosomal proteins) give the most stable phylogeny.
- Major bacterial lineages
- Pseudomonadota/Proteobacteria (α Rhizobium, γ E. coli, Pseudomonas, ε Helicobacter) · Bacillota/Firmicutes (Gram-positive low-GC) · Actinomycetota (high-GC; Mycobacterium, Streptomyces) · Cyanobacteria (oxygenic photosynthesis) · Spirochaetota · Bacteroidota. Note the 2021 phylum renaming — Rowen may use either set of names.
- Archaea as a domain context — ch 19 not assigned
- You get archaea through 18.1 and the Bacteria/Archaea contrasts, not through the archaeal-diversity chapter. Ether-linked isoprenoid membrane lipids; pseudopeptidoglycan or S-layer walls; multi-subunit RNA polymerase and histones resembling eukaryotes. Major groups: Euryarchaeota (methanogens, extreme halophiles), TACK/Crenarchaeota (thermoacidophiles, ammonia-oxidizing Thaumarchaeota), Asgard archaea (closest known relatives of eukaryotes).
Figures are from Slonczewski & Foster, Microbiology: An Evolving Science, 6e (the course textbook), plus screenshots from Dr. Rowen's lecture slides where noted.
Contents
Right-click here and choose Update Field to build the contents.
The framing: what this unit is actually for
The syllabus states course objective 2 as: predict the properties of a bacterium based on an analysis of its genome. Expect to be handed an annotation on the exam and asked what the organism can do. Everything in this chapter is machinery in service of that one skill.
The chapter answers a stack of questions the book poses up front and then returns to. Why do some organisms split their genome across several chromosomes while others use one? How does a microbe acquire a second chromosome? What is the advantage of putting a gene on a plasmid rather than a chromosome? How is replication coordinated with cell division? And do the answers differ between bacteria and archaea?
Reading genomes runs in both directions, and the second direction is what students forget. Sometimes you predict a capability from a gene that is present. For a reduced genome you predict a requirement from a gene that is absent, because the organism has stopped making something its partner supplies.
7.1 DNA: the genetic material
This is the shortest section in the chapter, a page of history, and it is the kind of section that supplies one or two easy exam points.
- For years the protein hypothesis was favoured, on the reasonable argument that 20 amino acids give a larger genetic alphabet than 5 nucleic acid bases
- Studies in bacteria provided the critical evidence that the genetic material is DNA, not protein
- RNA serves as the genetic material for some viruses, including SARS-CoV-2
- Three properties make DNA suitable: it stores information in its base sequence, it can change heritably so the organism can evolve, and being double-stranded it is easily replicated using the original strands as templates
7.2 Genome organization
Size, number and shape
| Question | Answer | Worth remembering because |
|---|---|---|
| How big? | Bacterial and archaeal genomes span about 106 to 16,000 kb. Eukaryotes run 2,900 kb (Microsporidia) to over 100,000,000 kb (flowering plants). Humans are over 3,000,000 kb | Lets you sanity-check any genome size you are handed |
| How many chromosomes? | Most sequenced prokaryotic genomes have ONE. About 10% have more than one | Vibrio cholerae is the standard two-chromosome example |
| Circular or linear? | Most bacteria and archaea are circular. Some are linear or mixed: Borrelia burgdorferi (Lyme), Agrobacterium tumefaciens, and Streptomyces plasmids | Researchers first expected linear, by analogy with eukaryotes, and the E. coli genetic maps refused to fit a linear model |
A tempting wrong answer: that genomes split into two chromosomes because of a size ceiling. The book kills it directly. Myxococcus xanthus carries over 9,000 kb on ONE chromosome, larger than the whole 4,033 kb of V. cholerae split across two. Size is not the reason.
The genome-reduction case worth memorizing
- Tremblaya princeps, one of the smallest cellular genomes known: 139 kb, only 120 proteins
- It lacks genes for many biosynthetic functions, including several needed to translate mRNA into protein
- It survives because it is an endosymbiont inside mealybug cells AND is itself host to Moranella endobia living in its own cytoplasm
- Evolution permitted the loss because the symbiotic partners supply the missing functions. This is the same use-it-or-lose-it logic as growth factors in section 4.3
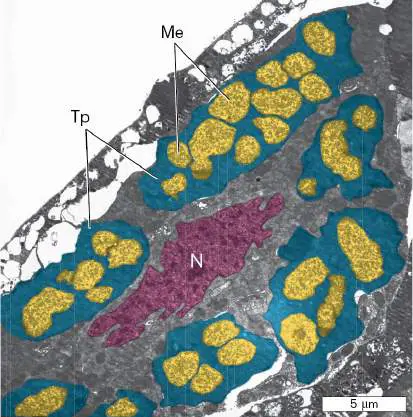
- Figure 65. The mealybug endosymbiont Tremblaya princeps, itself host to Moranella endobia inside its own cytoplasm.
- Source: Slonczewski & Foster, Microbiology: An Evolving Science, 6e, Fig. 7.1
Contrast that with free-living bacteria, which carry larger genomes and spend many genes on making or acquiring amino acids and TCA cycle intermediates.
DNA chemistry, only the parts that are asked
- Four nucleotides on a phosphodiester backbone; each nucleotide is a nucleobase attached through a ring nitrogen to carbon 1 of 2-deoxyribose
- Phosphodiester links join the 3' carbon of one deoxyribose to the 5' carbon of the next
- The two backbones are ANTIPARALLEL: one end of a linear duplex has a 3' hydroxyl on one strand and a 5' phosphate on the other. This is required for the bases to pair
- Purines (A, G) pair with pyrimidines (T, C). A-T is TWO hydrogen bonds, G-C is THREE
- Specificity comes from hydrogen bonding, but thermal STABILITY comes predominantly from base stacking, which excludes water from the hydrophobic interior while the charged phosphate backbone stays hydrated
- The helix has a wide MAJOR groove and a narrow MINOR groove, which is how DNA-binding proteins read the sequence without separating the strands
The classic calculation-free exam question: which denatures at a higher temperature, high-GC or high-AT DNA? HIGH GC, because three hydrogen bonds per pair take more energy than two. Renaturation is far SLOWER than denaturation, because it is a random hit-or-miss search for a complementary partner. This melt/reanneal behaviour is the basis of PCR and cloning.
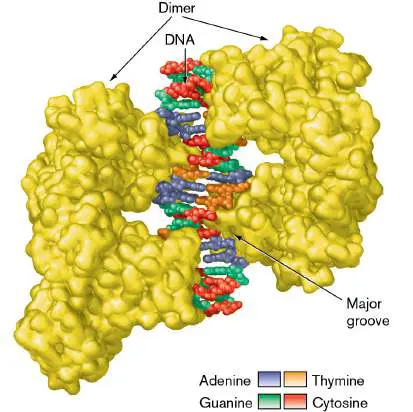
- Figure 66. DtxR repressor of Corynebacterium diphtheriae bound in the MAJOR groove at the diphtheria toxin promoter. Toxin expression is repressed when iron is high, which signals the cell it is outside a human host.
- Source: Slonczewski & Foster, Microbiology: An Evolving Science, 6e, Fig. 7.5
RNA versus DNA, and why the differences exist
- RNA uses ribose instead of deoxyribose, and uracil instead of thymine
- Functionally, those two changes keep the enzyme sets separate: DNA polymerases will not act on RNA, and RNases will not degrade DNA
- But uracil still pairs with adenine, so RNA-DNA hybrids form, and that hybridization is a necessary step in decoding genes
- Single-stranded RNA folds back on itself into hairpins wherever internal sequences are complementary
- Division of labour: DNA is the stable archive, RNA is the working copy
Packing: the nucleoid and supercoiling
The scale of the problem is the thing to remember. The E. coli chromosome laid out is 1,500 times longer than the cell. DNA is the second largest molecule in the cell after peptidoglycan, is 3-4% of dry mass, and because it is excluded from ribosome-occupied space its local packing density reaches about 15 mg/ml, which in a test tube is nearly a gel.
- Bacteria have no nuclear membrane. They pack DNA into protein-anchored domains collectively called the nucleoid
- A gently released nucleoid shows 30-100 tightly wound loops or domains
- Loop boundaries are set by histone-like proteins, named for their resemblance to eukaryotic histones
- Within each domain the double helix is itself helical: supercoiled, which takes up far less space than relaxed DNA
- A single-strand nick relaxes only ONE loop, not the whole chromosome. That is the functional point of domains
Topoisomerases: the two types and why one is a drug target
| Type | Cuts | Does what | Needs ATP? |
|---|---|---|---|
| Type I (Topo I) | ONE strand | Relieves negative supercoiling | No |
| Type II (DNA gyrase) | BOTH strands | INTRODUCES negative supercoils | Yes |
| Type II (Topo IV) | BOTH strands | Decatenates the interlocked daughter chromosomes after replication | Yes |
Bacteria, eukaryotes and most archaea keep their DNA NEGATIVELY supercoiled. Archaea living in extreme environments are the exception and carry POSITIVELY supercoiled genomes, which resists denaturation at high temperature. That exception is exactly the kind of detail this course likes. Clinically, DNA gyrase is the quinolone target.
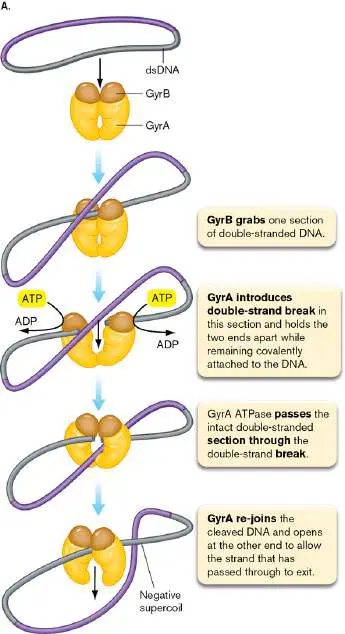
- Figure 67. Mechanism of a type I topoisomerase: a single-strand cut relieves negative supercoiling.
- Source: Slonczewski & Foster, Microbiology: An Evolving Science, 6e, Fig. 7.9
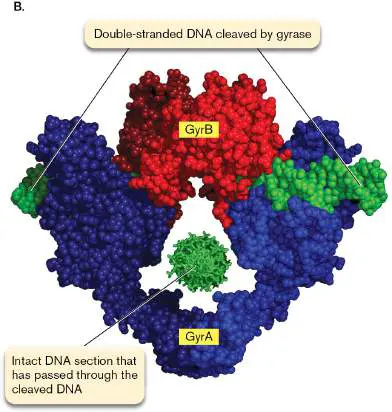
- Figure 68. Mechanism of type II topoisomerases, including DNA gyrase.
- Source: Slonczewski & Foster, Microbiology: An Evolving Science, 6e, Fig. 7.10
7.3 DNA replication
The three facts everything else hangs on
- Semiconservative. Each daughter duplex keeps one parental strand and one new strand, which is what makes accuracy checkable against the parent
- Bidirectional from a single fixed origin. In bacteria, replication starts at oriC and two forks run in opposite directions until they meet at ter sites on the far side
- 5' to 3' only. Polymerases add to the 3' end, forming a phosphodiester link between the growing chain's 3' OH and the alpha-phosphate of the incoming nucleoside triphosphate, releasing pyrophosphate
Pyrophosphatase then cleaves the released pyrophosphate, and that removal is what stops the reaction running backwards. Chain elongation is expensive: both phosphoryl bonds of the triphosphate are ultimately broken.
The puzzle the whole mechanism exists to solve: polymerases go 5' to 3' only, but the two strands are antiparallel. One new strand can therefore run continuously toward the fork (the LEADING strand), and the other must be built backwards in pieces (the LAGGING strand). Those pieces are Okazaki fragments, named for Reiji and Tsuneko Okazaki.
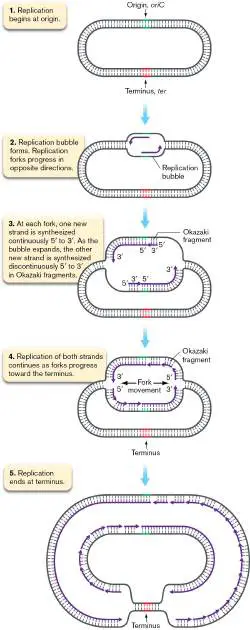
- Figure 69. Chain elongation. A new phosphodiester link forms between the 3' OH of the growing strand and the alpha-phosphate of the incoming nucleoside; pyrophosphate is released.
- Source: Slonczewski & Foster, Microbiology: An Evolving Science, 6e, Fig. 7.12
- Figure 70. Fork movement versus direction of synthesis: the leading strand runs continuously, the lagging strand in fragments.
- Source: Slonczewski & Foster, Microbiology: An Evolving Science, 6e, Fig. 7.13
Initiation, and how the cell times it
Once replication starts, the cell is committed to a full round. Start too early and you accumulate chromosome copies you do not need; start too late and the division septum cuts the chromosome, killing both daughters. So the timing machinery is elaborate.
| Step | Player | What happens |
|---|---|---|
| 1 | DnaA-ATP | The initiator. Recognizes 9-bp repeats in the 245-bp oriC. Its level rises as the cell grows, so initiation is tied to cell MASS |
| 2 | Housekeeping RNA polymerase | Transcribes at oriC, which helps separate the strands |
| 3 | DnaB helicase + DnaC loader | DnaC places the ring-shaped DnaB helicase around one strand at each fork, then disengages and leaves. DnaB unwinds using ATP |
| 4 | SSB proteins | Coat the exposed single strands, protecting them from nucleases and preventing re-annealing |
| 5 | Primase (DnaG) | An RNA polymerase, so it needs no primer itself. Lays down 10-12 nucleotide RNA primers, one primase per fork |
| 6 | Beta sliding clamp + clamp loader | Tethers Pol III to the template so it does not fall off |
| 7 | DNA Pol III | Binds the 3' OH of the RNA primer and starts synthesizing DNA |
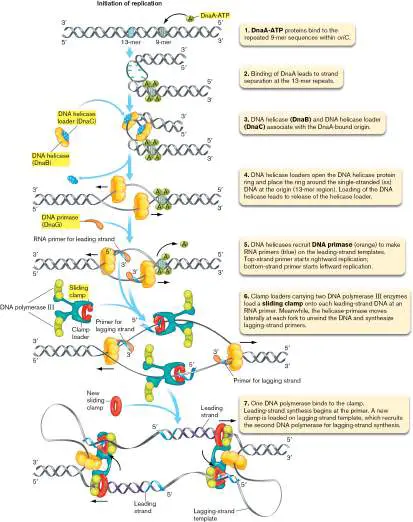
- Figure 71. DnaA monomer with its helix-turn-helix DNA binding motif and bound ATP.
- Source: Slonczewski & Foster, Microbiology: An Evolving Science, 6e, Fig. 7.14
The methylation timer: how re-initiation is blocked
- Dam (DNA adenine methyltransferase) methylates the N-6 of adenine in GATC sequences, which are scattered along both strands
- Right after the origin replicates there is a lag before the NEW strand is methylated, so the origin is briefly hemimethylated, methylated on one strand only
- SeqA has high affinity for hemimethylated origins, so it binds hardest exactly when re-initiation would be most damaging, and blocks it
- Once Dam methylates the new strand, SeqA affinity drops and it dissociates
- A second round can start only after SeqA is off AND DnaA-ATP has rebuilt
Two independent brakes, and exams like asking for both: falling free DnaA-ATP, and SeqA bound to the hemimethylated origin. Naming only one is a half answer.
Why RNA primers at all
- No DNA polymerase can start from nothing; it can only extend a 3' OH. RNA polymerases can start from nothing
- The book gives two reasons for using RNA specifically. It may be a holdover from the RNA world
- More practically, the first nucleotides laid down are relatively inaccurate, and marking them as RNA lets the cell find and replace them with high-fidelity DNA later
Elongation, proofreading and termination
- E. coli has five DNA polymerases, Pol I through Pol V. Pol III is the replicative enzyme; Pol I removes the RNA primers and fills the gaps
- Pol III proofreads with a 3'-to-5' exonuclease activity, correcting errors as it goes
- DNA ligase seals the nicks between Okazaki fragments into one continuous lagging strand
- Two replisomes travel in opposite directions, each containing three DNA Pol III complexes
- Termination happens at ter sites roughly halfway around, so the forks stop rather than run past each other
- Termination also restores the negative supercoils and methylates the new sequence
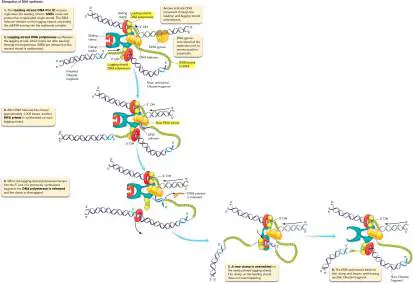
- Figure 72. The DNA polymerase dimer at a replication fork, leading and lagging strands synthesized simultaneously in the 5'-to-3' direction.
- Source: Slonczewski & Foster, Microbiology: An Evolving Science, 6e, Fig. 7.17
The two problems left at the end
- Catenanes: the two finished circular chromosomes come out interlocked like rings in a chain. Topoisomerase IV decatenates them
- Dimers: sometimes the two chromosomes are fused into one double-size circle. XerC and XerD resolve the dimer by site-specific recombination at the dif locus
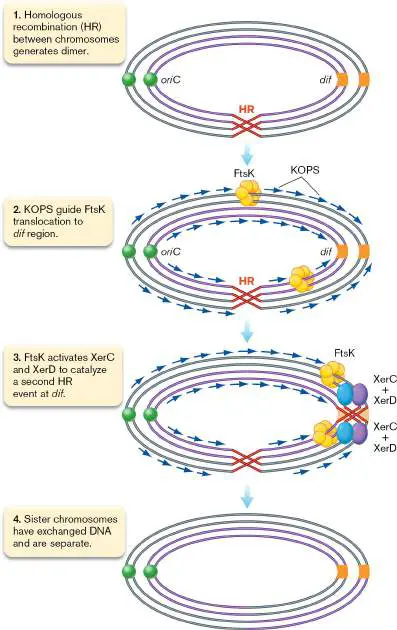
- Figure 73. Terminating replication of the chromosome at the ter regions.
- Source: Slonczewski & Foster, Microbiology: An Evolving Science, 6e, Fig. 7.19
- Figure 74. Resolution of chromosome dimers by XerC and XerD at the dif locus.
- Source: Slonczewski & Foster, Microbiology: An Evolving Science, 6e, Fig. 7.20
7.4 Plasmids and secondary chromosomes
What a plasmid is, and the one line that defines it
- An extrachromosomal replicon found in bacteria, archaea and eukaryotic microbes; usually circular and negatively supercoiled
- Typically thousands of base pairs against the chromosome's millions, sometimes only a few genes
- Copy number ranges from a single copy to over 500 per cell
- High copy number means dramatic overexpression relative to a chromosomal gene, which is an advantage when a lot of the product is needed
- Plasmids control their OWN replication and copy number, using their own origin and initiator proteins even while borrowing the host's machinery
The defining distinction, and the one most likely to be tested: a secondary chromosome carries at least one ESSENTIAL gene, one required for viability under all conditions. A plasmid does not. Everything else about them, size, circularity, replication style, overlaps.
What plasmids carry
- Antibiotic resistance. The hospital problem: multidrug-resistance plasmids moving from harmless bacteria into pathogens
- Resistance to toxic metals
- Toxins that aid pathogenesis
- Symbiosis genes. Most of the Rhizobium nitrogen-fixation genes are plasmid-borne
- Antibiotic SYNTHESIS genes, in Streptomyces, and notably those plasmids are LINEAR
- And on the useful side, pBR322 with its ampicillin and tetracycline resistance markers is the workhorse cloning vector
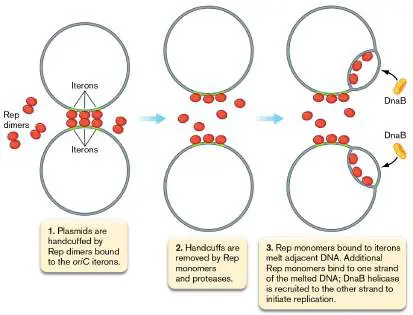
- Figure 75. Rolling-circle plasmid replication.
- Source: Slonczewski & Foster, Microbiology: An Evolving Science, 6e, Fig. 7.22
Four ways a plasmid moves between cells
| Route | Requires | Note |
|---|---|---|
| Conjugation, self-transferable | Cell-to-cell contact | The plasmid encodes its own transfer machinery |
| Conjugation, mobilizable | A co-occurring helper plasmid | It cannot conjugate alone but the helper's machinery recognizes and moves it |
| Transformation | A competent recipient | Free plasmid released from dead cells is taken up |
| Transduction | A bacteriophage | The plasmid is accidentally packaged into a phage head coat |
Nontransmissible plasmids do none of these and simply propagate with the host when the host genome replicates. The ease of movement is why plasmids matter for evolution, and it is what makes antibiotic resistance spread so fast. It also, as the book notes, undermines the idea that a microbial species is defined by a genome all its members share.
Two replication modes
| Rolling circle | Bidirectional | |
|---|---|---|
| Direction | UNIdirectional | Bidirectional from one origin, both forks ending at one terminus |
| Initiator | RepA nicks one strand and holds the 5' phosphate end | Plasmid-encoded Rep protein binds iterons and melts the origin |
| Priming | The nicked strand's 3' OH is the primer | As with the chromosome, including SeqA and Dam methylation; DnaA is involved near the origin but is not the master initiator |
| Product | The nicked strand peels off undamaged, is re-joined by RepA and released as a single-stranded circle, then made double-stranded by host enzymes | Two double-stranded daughters |
Handcuffing: how copy number is limited
- Iterons are direct repeats of 17-22 bp, present in two to seven copies
- Rep exists as both monomers and dimers, and both bind iterons, but only MONOMERS initiate replication
- Dimers block replication two ways: by sequestering monomers, and by bridging the iterons of two plasmids together, which is called handcuffing
- Initiation resumes when excess monomers and dimer-targeting proteases break the handcuffs
Four tricks that stop a plasmid being lost
- Carry a gene the host needs right now. With antibiotic present, any cell that drops the resistance plasmid dies or stops growing, so selection does the retention
- Flood the cytoplasm. At high copy number, random partition of the cytoplasm almost guarantees both daughters get a copy
- Integrate into the host chromosome, after which it is inherited automatically
- Actively partition. Low-copy plasmids cannot rely on chance, and burning energy on extra copies would lose them the competition against plasmid-free cells, so they push copies apart mechanically
The R1 partition system, worth knowing in detail
- Three plasmid genes: parC, parM, parR
- parC is a DNA sequence analogous to a eukaryotic centromere
- ParR protein binds parC, forming a ParR-parC-plasmid complex
- ParM is an ACTIN-like protein that forms filaments as it hydrolyses ATP; the filaments are dynamically unstable, constantly growing and shrinking
- When BOTH ends of a ParM filament happen to catch a ParR-parC complex, the filament stabilizes and elongates, pushing the two plasmids to opposite poles
- The plasmids are then dislodged and the filament rapidly dissociates
Note the parallel worth stating on an essay: a plasmid partition system is a miniature mitotic spindle built from a bacterial actin homolog rather than tubulin, using a centromere-analogous DNA site. Convergent solution to the same problem.
Secondary chromosomes: where they come from
- Vibrio cholerae has a 4,033-kb genome as two chromosomes, 2,961 and 1,072 kb
- Replication is SYNCHRONIZED so both terminate together. Chr1 initiates first on activated DnaA; replicating a locus called crtS downstream of the Chr1 origin then triggers Chr2, apparently by changing the binding affinity of the Chr2 initiator RctB so it moves off the inhibitor region and onto the activator region of its own origin
- Two hypotheses for the origin of secondary chromosomes: a split off the primary chromosome, or a plasmid that captured essential genes
- The EVIDENCE supports the plasmid hypothesis: every secondary chromosome examined carries plasmid-type replication and segregation machinery, and none carries primary-chromosome-type replication proteins
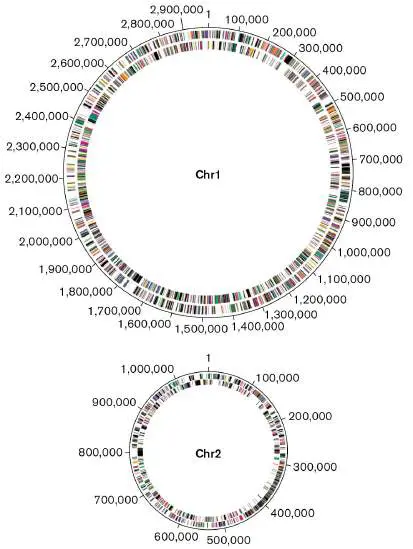
- Figure 76. The two chromosomes of the Vibrio cholerae genome, mapped from their origins.
- Source: Slonczewski & Foster, Microbiology: An Evolving Science, 6e, Fig. 7.2
7.5 Eukaryotic and archaeal chromosomes
Eukaryotes
- Linear, double-stranded, segregated to daughters by MITOSIS after replication
- Linear ends create the end-replication problem, solved by telomerase, a REVERSE TRANSCRIPTASE that prevents net loss of DNA at the chromosome ends
- Histones compact the chromosome
- Large amounts of NONCODING DNA: introns and pseudogenes. Prokaryotes have very little noncoding DNA
Two clean discriminators. Bacteria with linear chromosomes, such as Borrelia, do NOT have telomerases; they solve the end problem other ways. And pseudogenes differ from ordinary noncoding DNA in that a pseudogene was once a functional gene, which is why it still looks like one.
Archaea: bacterial on the outside, eukaryotic on the inside
| Feature | Archaea resemble | Detail |
|---|---|---|
| Chromosome size and shape | Bacteria | Similar size, usually circular |
| Replication machinery | EUKARYOTES | The archaeal replication enzymes are more closely related to eukaryotic ones than to bacterial ones |
| Origins of replication | Neither, uniquely | Archaeal chromosomes often have MULTIPLE origins, unlike the single bacterial oriC |
| Packing proteins | Eukaryotes | Some archaea use true histones |
| Supercoiling | Split | Most archaea are negatively supercoiled like everyone else, but extremophile archaea are POSITIVELY supercoiled |
This split is the single most exam-worthy fact in 7.5, because it is the molecular evidence behind Woese's tree: archaea are sister to eukarya, not to bacteria, and the information-processing machinery is where that shows.
eAppendix A3.6: DNA sequencing by Sanger, Illumina and nanopore
Sanger (dideoxy) sequencing
- A dideoxynucleotide lacks the 3' OH, so incorporating one HALTS elongation of that chain
- Only a small amount of terminator is mixed with normal deoxynucleotides, so chains stop at many different positions and some run to completion
- Four dideoxy bases, each tagged with a different fluorescent dye. Four separate reactions in principle, all in one tube in an automated sequencer
- Fragments are separated BY SIZE by electrophoresis, and a laser and detector at the bottom read each fragment's colour as it passes
- The computer displays coloured peaks whose order is the sequence
- Modern automated Sanger machines use capillary tube gels rather than slab gels
- Accuracy 99.99%, the most accurate method. Read length about 1,000 bp per template, but slow and space-hungry
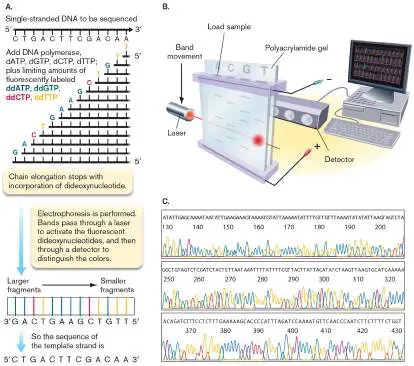
- Figure 77. Sanger sequencing. A. Tagged strands are synthesized with dideoxynucleotides that randomly stop elongation. B. Fragments are separated by size past a laser and detector. C. The bases are read out as coloured peaks.
- Source: Slonczewski & Foster, Microbiology: An Evolving Science, 6e, Fig. A3.12
Illumina: sequencing by synthesis
Developed by Solexa, now part of Illumina. It is the workhorse for genomes and metagenomes.
| Phase | Steps | What happens |
|---|---|---|
| Library prep | 1-2 | The genome is fragmented SONICALLY into 100-300 bp pieces (small, because only 100-500 bp can be read from any one fragment), and different linker oligonucleotides are ligated to each end |
| Attach | 3 | Strands are separated and millions of fragments are randomly fixed to an optical flow cell whose surface carries a dense lawn of oligonucleotides complementary to the linkers |
| Bridge amplification | 4-6 | Each fragment's end anneals to a nearby fixed oligonucleotide, which primes amplification. Repeated, this turns each single fragment into a tight CLUSTER of identical copies |
| Sequencing by synthesis | 7-10 | Reversible fluorescent chain terminators are added one base at a time. Every molecule in a cluster adds the same base and fluoresces the same colour. A snapshot records the colours, the fluor is removed, chain termination is reversed, and the cycle repeats |
- Each flow-cell lane produces 10-120 million fragments, up to 1,800 gigabases per run
- Reads are SHORT, up to about 300 bases, but massively parallel
- Software finds the overlaps and assembles them into a chromosome
- Cost of a human genome can be as low as $1,000
- The clustering step exists for one reason: a single molecule's fluorescence is too faint to photograph, so it is amplified into a bright spot
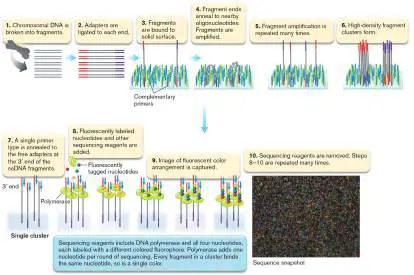
- Figure 78. Illumina sequencing by synthesis. Steps 1-6 generate clusters by bridge amplification; steps 7-10 sequence them with reversible fluorescent terminators.
- Source: Slonczewski & Foster, Microbiology: An Evolving Science, 6e, Fig. A3.14
Nanopore (MinION)
- A completely different principle: NO DNA synthesis at all. A single strand is ratcheted through a nanopore by an enzyme, and the changing electric current is read
- It cannot recognize single bases. It recognizes short strings of three to six bases by their signature current profile, and machine-learning algorithms convert current traces into sequence
- Palm-sized, laptop-powered, fast prep, a few hours of run time. Used in Antarctica, on the International Space Station, and for real-time field data during Ebola outbreaks
- Because it reads current rather than synthesis, it can sequence RNA DIRECTLY, with no reverse transcription
- Single reads can exceed 800 kb, which is what lets it read through repetitive regions that Illumina reads cannot be assembled across
- The drawback is error rate. Single-read accuracy is now above 99% but still unsuitable where single-base calls matter. Multiple reads aligned to a consensus improve it
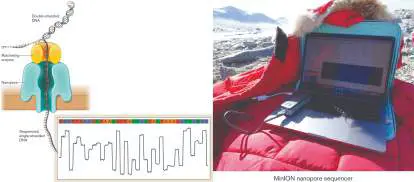
- Figure 79. Nanopore sequencing. An enzyme ratchets one strand through the pore and the passing bases change the electric current, which a computer translates into sequence. Inset: a MinION in Antarctica.
- Source: Slonczewski & Foster, Microbiology: An Evolving Science, 6e, Fig. A3.15
The comparison question is nearly guaranteed, so hold the trade-off in one line: Sanger is the most accurate but lowest throughput; Illumina is cheap, accurate and massively parallel but SHORT-read, so repeats defeat assembly; nanopore gives enormous LONG reads that span repeats but with the highest error rate. A finished genome today is usually a hybrid assembly, using long reads for structure and short reads for accuracy.
| Sanger | Illumina | Nanopore | |
|---|---|---|---|
| Principle | Chain termination by dideoxy nucleotides | Sequencing by synthesis, reversible terminators | Current change through a pore, no synthesis |
| Read length | ~1,000 bp | Up to ~300 bp | Can exceed 800 kb |
| Accuracy | 99.99% | High | Above 99% single-read, lowest of the three |
| Throughput | Low | Up to 1,800 Gb per run | Moderate |
| Best for | Verifying one product; single-base calls | Genomes and metagenomes at low cost | Spanning repeats; field and real-time work; direct RNA |
Putting it together: reading an annotation
This is the exercise course objective 2 describes, so practise it explicitly.
| What you see in the annotation | What you predict | Because |
|---|---|---|
| A very small genome, many biosynthetic genes missing | An endosymbiont or obligate intracellular organism; predict growth-factor REQUIREMENTS from what is absent | Tremblaya, and the same use-it-or-lose-it logic as section 4.3 |
| A region whose GC% or codon usage departs sharply from the rest | Recently acquired horizontally; look for flanking direct repeats, a nearby integrase, and insertion at a tRNA gene | GC content and codon bias are genus-characteristic |
| Antibiotic resistance genes on a small circular replicon | Plasmid-borne and therefore transferable; a clinical containment concern | Resistance is the classic plasmid cargo |
| A second replicon carrying an essential gene | A secondary chromosome, not a plasmid, and probably plasmid-derived | The essential-gene test is the definition; plasmid-type replication machinery is the evidence |
| Genes for gyrase and Topo IV | Quinolone-susceptible; also that this organism is doing normal bacterial supercoiling and decatenation | Gyrase is the quinolone target |
| Telomerase absent but the chromosome is linear | A bacterium such as Borrelia, using a non-telomerase end solution | Bacteria with linear chromosomes have no telomerases |
| Multiple origins of replication plus histones | An archaeon | Archaeal chromosomes often carry multiple origins and eukaryote-like machinery |
Practice Quiz: genomes, replication and sequencing (with answer key)
Multiple choice
- Q1. Which requires ATP and INTRODUCES negative supercoils? (A) Topo I (B) DNA gyrase (C) primase (D) ligase
- Q2. Higher GC content means the DNA denatures at: (A) a lower temperature (B) a higher temperature (C) the same temperature (D) it does not denature
- Q3. SeqA blocks re-initiation because it binds preferentially to: (A) fully methylated origins (B) hemimethylated origins (C) unmethylated origins (D) ter sites
- Q4. Okazaki fragments are joined by: (A) Pol III (B) primase (C) DNA ligase (D) helicase
- Q5. The one feature that makes a replicon a secondary chromosome rather than a plasmid is that it: (A) is larger (B) is circular (C) carries at least one essential gene (D) replicates bidirectionally
- Q6. ParM, in the R1 partition system, is a homolog of: (A) tubulin (B) actin (C) histone (D) FtsZ
- Q7. Interlocked daughter chromosomes (catenanes) are separated by: (A) XerC/XerD (B) topoisomerase IV (C) DnaA (D) SSB
- Q8. Which sequencing method reads RNA directly, without reverse transcription? (A) Sanger (B) Illumina (C) nanopore (D) all three
- Q9. Archaeal DNA replication machinery most closely resembles that of: (A) bacteria (B) eukaryotes (C) viruses (D) mitochondria
- Q10. Bridge amplification in Illumina sequencing exists in order to: (A) fragment the genome (B) turn one molecule into a cluster bright enough to photograph (C) terminate chains (D) remove linkers
Short answer
- S1. Give BOTH mechanisms that prevent a second round of replication starting immediately after the origin is copied.
- S2. Why is a lagging strand needed at all? Answer at the level of enzyme chemistry.
- S3. You are handed a 139-kb genome missing several translation genes. What lifestyle do you predict, and what is the general principle?
- S4. Sanger, Illumina and nanopore: state the trade-off in one sentence each, and say which combination you would use to finish a bacterial chromosome with long repeats.
- S5. What is handcuffing, and what problem does it solve?
Answer key
- Q1 B. Gyrase is a type II topoisomerase, cuts both strands, uses ATP, and introduces negative supercoils. Topo I cuts one strand and RELIEVES them.
- Q2 B. Three hydrogen bonds per G-C pair against two per A-T.
- Q3 B. Right after replication the origin is methylated on the old strand only, and SeqA's affinity for that state is what times the block.
- Q4 C. Pol I removes the RNA primers and fills the gaps; ligase seals the nicks.
- Q5 C. The essential-gene test is the whole definition.
- Q6 B. ParM is actin-like and forms dynamically unstable filaments that push plasmids apart. FtsZ is the tubulin homolog, and it does septum formation, not plasmid partition.
- Q7 B. Topo IV decatenates. XerC/XerD resolve DIMERS at dif, which is the other end-of-replication problem.
- Q8 C. Nanopore reads current rather than synthesis, so RNA passes through just as DNA does.
- Q9 B. Size and shape look bacterial; the machinery is eukaryote-like. That split is the point.
- Q10 B. A single molecule fluoresces too faintly to image, so each fragment is amplified in place into a bright cluster of identical copies.
- S1. Free DnaA-ATP falls after initiation and must rebuild, AND SeqA binds the transiently hemimethylated origin until Dam methylates the new strand. Both must clear.
- S2. DNA polymerases can only add to a 3' OH, so synthesis runs 5' to 3' only. The two template strands are antiparallel, so at a single moving fork only one new strand can be built continuously toward the fork. The other must be built in short pieces running away from the fork, then stitched together.
- S3. An endosymbiont or obligate intracellular organism, like Tremblaya princeps. The principle is that a niche which reliably supplies a compound removes the selection maintaining the pathway that makes it, so the genes decay and are lost. For such genomes you predict requirements from what is MISSING.
- S4. Sanger: most accurate, ~1,000 bp reads, low throughput. Illumina: cheap, accurate, enormous throughput, but reads under ~300 bp so repeats defeat assembly. Nanopore: reads over 800 kb that span repeats, direct RNA, field portable, but the highest error rate. For a repeat-rich chromosome use a HYBRID assembly: nanopore long reads for structure, Illumina short reads to correct the base calls.
- S5. Rep dimers bridge the iterons of two plasmids together, physically blocking initiation and sequestering the monomers that would otherwise start it. It caps copy number, so a low-copy plasmid does not drain the host's energy making copies it does not need.
Mnemonic set for Chapter 7 and A3.6
- One cuts one and relaxes, two cuts two and coils. Topo I, single strand, relieves. Gyrase, double strand, ATP, introduces.
- DnaA starts it, SeqA stops it, Dam runs the clock. The whole initiation timer in six words.
- Prime with RNA so you can find it later. Why the primer is RNA and not DNA.
- Catenanes get cut by Topo IV, dimers get resolved by Xer. Two different end-of-replication messes, two different fixes.
- Essential gene makes it a chromosome. The plasmid versus secondary chromosome test.
- Sanger is accurate, Illumina is cheap, nanopore is long. Then add: repeats need length, base calls need accuracy, so finished genomes are hybrids.
- Archaea: bacterial body, eukaryotic brain. Size and shape from one side, information machinery from the other.
Unit 3 · Bacterial cell structure & viruses
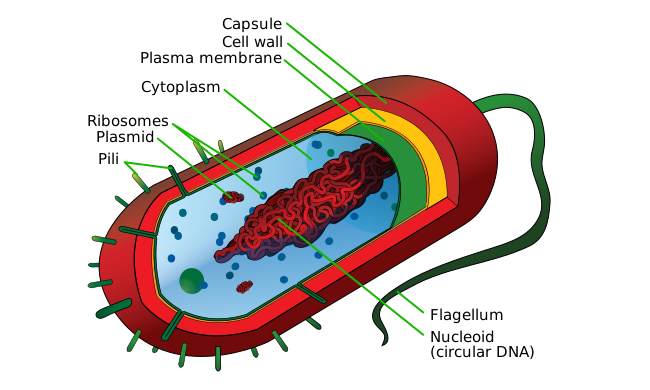

- Peptidoglycan
- Murein. Polymer of NAG-NAM cross-linked by tetrapeptides. Bacteria only — Archaea have pseudopeptidoglycan (NAG-NAT) or other walls.
- Gram-positive vs Gram-negative envelope
- G+: thick multilayer PG, teichoic acids, no outer membrane. G−: thin PG in a periplasm sandwiched between inner membrane and an outer membrane with LPS. The architecture explains stain result, antibiotic access, and toxin biology all at once.
- Teichoic acids
- Glycerol/ribitol-phosphate polymers anchored in the Gram-positive wall; antigenic + ion homeostasis.
- LPS (lipopolysaccharide)
- Outer leaflet of the Gram-negative outer membrane; Lipid A (endotoxin) + core + O-antigen. Triggers TLR4 → septic shock.
- Periplasm
- Gel-filled compartment between inner and outer membranes in Gram-negatives; holds binding proteins, folding catalysts, and secreted enzymes (β-lactamases).
- Capsule / S-layer
- Outer polysaccharide capsule (resists phagocytosis, aids attachment). S-layer = paracrystalline protein lattice, especially common in Archaea.
- Cytoplasmic membrane
- Phospholipid bilayer + proteins. Functions: permeability barrier, energy conservation (proton motive force), transport, and anchoring for secretion and division machinery. Sterol-free in most bacteria; hopanoids serve the rigidity role.
- Proton motive force (PMF)
- Δp = Δψ (charge) + ΔpH. Generated by electron transport or ATP hydrolysis; spent on ATP synthesis, transport, and flagellar rotation. The cell's rechargeable battery — Unit 4 depends on it.
- Simple diffusion vs facilitated diffusion
- Both run down a gradient, no energy. Facilitated needs a carrier protein and is saturable; gases and small uncharged molecules cross unaided.
- Active transport — primary
- Uses chemical energy directly. ABC transporters hydrolyze ATP and often pair with a periplasmic binding protein giving very high affinity.
- Active transport — secondary
- Driven by an existing ion gradient. Symport (lactose permease, LacY: H⁺ + lactose in together) · antiport (Na⁺ out, H⁺ in) · uniport.
- Group translocation (PTS)
- Substrate chemically modified during entry: the phosphotransferase system phosphorylates glucose to glucose-6-P as it crosses, so it cannot leak back. PEP is the phosphoryl donor; the same PTS components double as regulators of catabolite repression.
- Bacterial flagellum
- Helical filament rotated by an H⁺- or Na⁺-driven motor. Run-and-tumble chemotaxis; CCW rotation bundles the filaments (run), CW breaks the bundle (tumble).
- Pili / fimbriae
- Surface filaments. Type IV pili for twitching motility, DNA uptake, and biofilm; F-pilus for conjugation; fimbriae for adhesion.
- Bacterial internal structures
- Nucleoid, 70S ribosomes, storage granules (PHB, polyphosphate, sulfur globules), gas vesicles, magnetosomes, carboxysomes. Prokaryotes do have compartments — protein-shelled ones rather than membrane-bound organelles.
- Cytoskeleton
- FtsZ (tubulin homolog, division ring) · MreB (actin homolog, rod shape) · CreS/crescentin (intermediate-filament-like, curvature). Shape is genetically specified, not incidental.
- Binary fission & the divisome
- FtsZ polymerizes into the Z ring at midcell, recruits ~30 proteins (FtsA, ZipA, FtsI/PBP3) that build septal peptidoglycan, then constricts. One cell → two.
- Division site selection
- Min system (MinCDE oscillation) blocks polar division; nucleoid occlusion (SlmA/Noc) blocks division over unsegregated DNA. Together they leave only midcell available.
- Endospore
- Dormant, heat- and chemical-resistant structure of Bacillus and Clostridium. Dipicolinic acid + Ca²⁺ and small acid-soluble proteins in a dehydrated core. Triggered by starvation; asymmetric division is the first committed step.
- Archaeal membrane
- Ether-linked isoprenoid lipids (vs ester-linked fatty acids in Bacteria/Eukarya); often a covalently linked monolayer in hyperthermophiles.
- Virus
- Obligate intracellular acellular agent. Genome (DNA/RNA, ds/ss) + capsid (± envelope). No ribosomes, no metabolism of its own.
- Capsid symmetries
- Helical (TMV), icosahedral (T=1, 3, 7…), complex (T4 phage: icosahedral head + contractile tail).
- Lytic cycle
- Adsorption → penetration → replication → assembly → lysis. Holin/endolysin pairs time the burst.
- Lysogenic cycle
- Phage integrates as a prophage and replicates passively until induction (UV, DNA damage → RecA → cleavage of the CI repressor) flips it lytic. Lysogenic conversion can hand the host new genes — cholera toxin and Shiga toxin are prophage-encoded.
- One-step growth curve
- Phage titer over time after synchronous infection: eclipse → latent period → burst. Burst size = new phage per infected cell.
- Retrovirus
- +ssRNA → reverse transcriptase → dsDNA → integrase → provirus. HIV.
- Baltimore classification
- I dsDNA, II ssDNA, III dsRNA, IV +ssRNA, V −ssRNA, VI +ssRNA-RT (retro), VII dsDNA-RT (HBV). Organized by the route to mRNA.
- Phage defense & counter-defense
- Restriction–modification, CRISPR-Cas, abortive infection, and newly described systems (retrons, CBASS) — often clustered in "defense islands." Phages carry anti-CRISPR proteins in reply.
Unit 4 · Energetics, catabolism & biosynthesis
- Catabolism vs anabolism
- Catabolism breaks compounds down, yielding ATP + reducing power (NADH/NADPH). Anabolism spends both to build biomass. Amphibolic pathways (TCA) run in both directions.
- ΔG°′ and the direction of reactions
- Negative ΔG°′ = exergonic = can be coupled to do work. Redox couples: the more negative E°′, the better the electron donor. ΔG°′ = −nFΔE°′ — the span between donor and acceptor sets the energy available.
- Nutritional classes
- Named by energy source (chemo-/photo-), electron source (-organo-/-litho-), and carbon source (-heterotroph/-autotroph). Chemoorganoheterotroph = most cultured bacteria; chemolithoautotroph = nitrifiers, sulfur oxidizers.
- Chemoorganotroph
- Organic compounds serve as both energy and carbon source.
- Chemolithotroph
- Inorganic electron donors (H₂, NH₃, NO₂⁻, H₂S, Fe²⁺) for energy; usually CO₂ for carbon.
- Phototroph
- Light-driven energy conservation. Oxygenic (cyanobacteria) splits H₂O and releases O₂; anoxygenic (purple, green sulfur bacteria) uses H₂S or organics and releases no O₂.
- Glycolysis and alternatives
- Embden-Meyerhof-Parnas (net 2 ATP, 2 NADH) is the common route; Entner-Doudoroff (net 1 ATP — Pseudomonas, Zymomonas) and the pentose phosphate pathway (NADPH + pentoses for biosynthesis) are the alternatives worth naming.
- Fermentation
- Substrate-level phosphorylation only; an organic molecule is the terminal electron acceptor, regenerating NAD⁺. Products name the pathway: lactate, ethanol, butyrate, mixed-acid, 2,3-butanediol.
- Aerobic respiration
- Glycolysis + TCA + electron transport chain with O₂ as terminal acceptor → H₂O. Highest ATP yield because O₂ has the most positive E°′.
- Anaerobic respiration
- ETC with a non-O₂ terminal acceptor: NO₃⁻ (denitrification), SO₄²⁻ (Desulfovibrio), Fe³⁺ (Geobacter), CO₂ (methanogens), fumarate. Yield tracks the acceptor's E°′.
- Electron transport chain
- Membrane carriers (flavoproteins, Fe-S proteins, quinones, cytochromes) pass electrons downhill while pumping protons out, building the PMF. Bacterial ETCs are modular — the same cell can swap donors and acceptors as conditions change.
- Substrate-level vs oxidative phosphorylation
- SLP transfers a phosphate from a high-energy substrate to ADP (glycolysis, acetyl-phosphate). Oxidative phosphorylation uses ATP synthase driven by the proton gradient.
- ATP synthase
- F₁F₀ rotary motor: proton flow through F₀ turns the c-ring, driving conformational cycling in F₁ that condenses ADP + Pᵢ. Fully reversible — it will pump protons by hydrolyzing ATP when the PMF collapses.
- Calvin cycle
- RuBisCO fixes CO₂; 3 ATP + 2 NADPH per CO₂. Found in cyanobacteria, plants, many lithotrophs. Often packaged in carboxysomes to concentrate CO₂.
- Alternative CO₂ fixation
- Reverse TCA (green sulfur bacteria), 3-hydroxypropionate (Chloroflexus), Wood-Ljungdahl / reductive acetyl-CoA (acetogens + methanogens — the cheapest in ATP, and probably the most ancient).
- Nitrogen fixation not assigned — 15.4
- Rowen assigns only 15.1–15.2, so nitrogen fixation is formally off the reading list. Know it anyway: it is the standard worked example of an oxygen-poisoned enzyme, and it appears in genome-prediction questions (see nifHDK in the practice exam). N₂ → 2 NH₃ by nitrogenase (Mo-Fe protein), ~16 ATP per N₂ and irreversibly poisoned by O₂. Protected by heterocysts, leghemoglobin, or simply anaerobic lifestyle. Rhizobium–legume, cyanobacteria, free-living Azotobacter.
- Methanogenesis
- Archaea only (Euryarchaeota): CO₂ + 4 H₂ → CH₄ + 2 H₂O, or acetate → CH₄ + CO₂. Unique cofactors — F₄₂₀, methanofuran, coenzyme M.
- Sulfate reduction
- Desulfovibrio: SO₄²⁻ → H₂S using organic or H₂ donors. Dominant terminal process in marine sediments.
- Nitrification
- NH₃ → NO₂⁻ (Nitrosomonas, and ammonia-oxidizing archaea) → NO₃⁻ (Nitrobacter). Classically a two-organism relay; comammox organisms do both steps.
- Denitrification
- NO₃⁻ → NO₂⁻ → NO → N₂O → N₂. Anaerobic respiration and the main route returning fixed N to the atmosphere.
- Biosynthesis precursors
- Twelve precursor metabolites from glycolysis, PPP, and TCA feed every amino acid, nucleotide, and lipid. Anaplerotic reactions (PEP carboxylase, glyoxylate shunt) refill TCA intermediates drained for biosynthesis.
Unit 5 · Gene expression, regulation, biofilms & adaptation
- Bacterial RNA polymerase
- Core α₂ββ′ω does the chemistry; the σ factor joins to form the holoenzyme and confers promoter recognition, then is released after initiation. One RNA polymerase for all genes — regulation happens at the σ and factor level.
- Promoter architecture
- σ70 promoters have −10 (TATAAT, Pribnow box) and −35 (TTGACA) consensus elements; how closely a promoter matches consensus sets its baseline strength.
- Termination
- Intrinsic (rho-independent): GC-rich hairpin followed by a U-tract destabilizes the complex. Rho-dependent: Rho helicase loads on a rut site and catches the polymerase.
- Translation initiation
- Shine-Dalgarno sequence pairs with 16S rRNA to position the 30S subunit at the start codon; initiator tRNA carries fMet. 70S ribosome = 30S + 50S. Polycistronic mRNAs carry an SD site per gene.
- Coupled transcription–translation
- No nucleus, so ribosomes load onto mRNA still being transcribed. Enables attenuation, and means a nonsense mutation can trigger polarity in downstream genes.
- Protein folding & export
- Trigger factor, DnaK/DnaJ, GroEL/GroES chaperones. Sec exports unfolded chains through SecYEG; Tat exports already-folded proteins (needed for cofactor-loaded enzymes). Signal peptidase clips the leader.
- Operon
- Polycistronic mRNA from one promoter, coordinately regulated. Prokaryote-specific and the reason bacterial regulation is so compact.
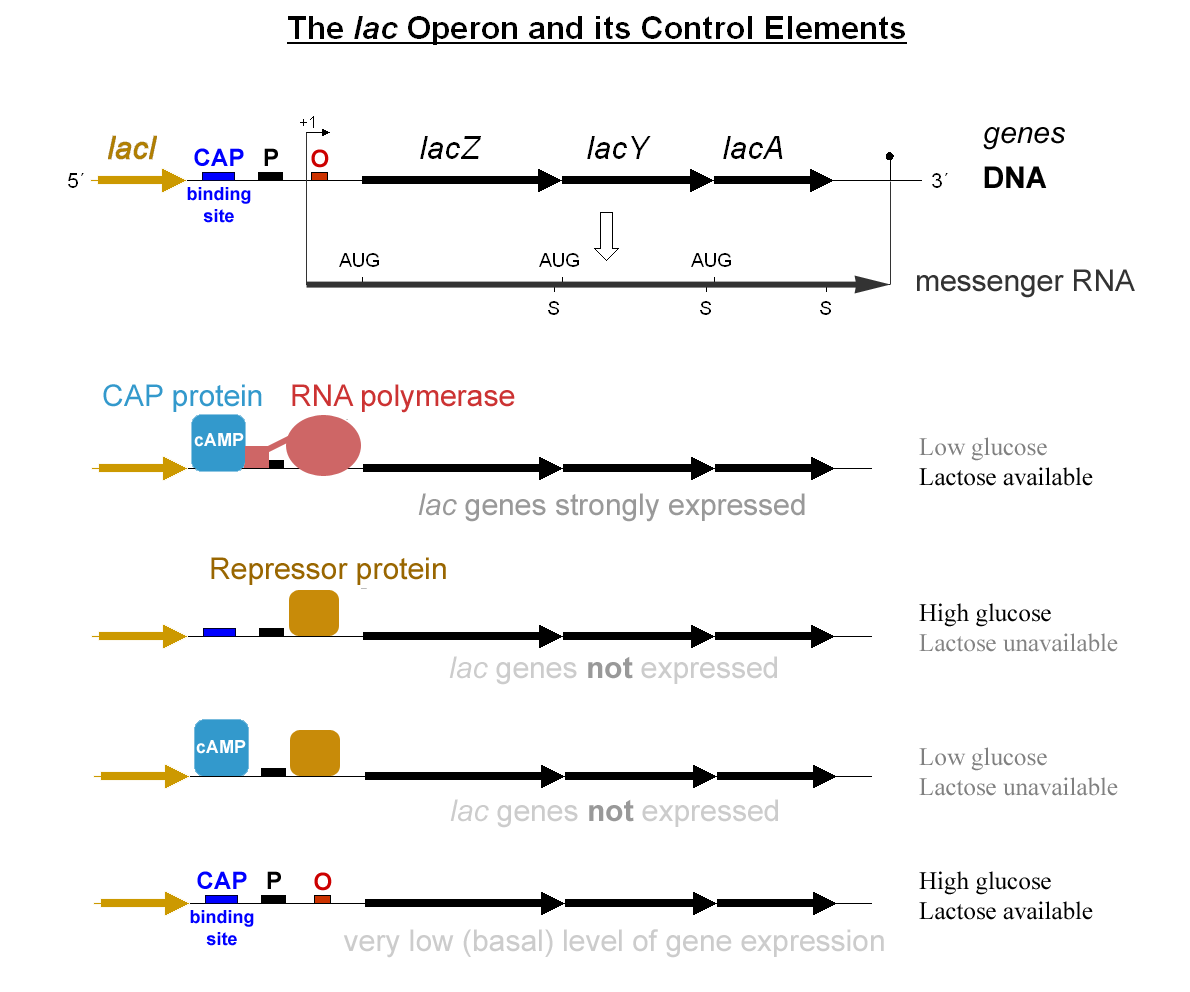

- lac operon
- Catabolic and inducible. LacI repressor blocks transcription until allolactose binds it. CAP+cAMP activates when glucose is low. Negative control + positive control on the same promoter.
- trp operon
- Anabolic and repressible. Trp acts as corepressor, activating TrpR. Plus attenuation: ribosome stalling at tandem Trp codons in the leader peptide chooses between terminator and antiterminator hairpins.
- Catabolite repression
- Glucose present → PTS keeps EIIA unphosphorylated → adenylate cyclase inactive → low cAMP → CAP cannot activate. The cell eats the best carbon source first; diauxic growth is the visible result.
- Sigma factor regulons
- Swapping σ reprograms the whole transcriptome. E. coli: σ70 housekeeping, σ32 heat shock, σS (RpoS) stationary/general stress, σ54 nitrogen, σF flagella, σE extracytoplasmic stress. Anti-σ factors sequester them until needed.
- Two-component system
- Membrane sensor histidine kinase autophosphorylates on a His, then transfers the phosphate to an Asp on a cytoplasmic response regulator, which binds DNA. The dominant environmental-sensing architecture in bacteria.
- Chemotaxis signaling
- MCP receptors → CheA/CheW → CheY-P → binds flagellar motor → CW rotation (tumble). CheR/CheB methylation provides adaptation, letting the cell sense gradients rather than absolute concentration.
- Quorum sensing
- Cell-density-dependent regulation via diffusible autoinducers. AHLs (LuxI/LuxR) in Gram-negatives; processed peptides (AIPs) in Gram-positives; AI-2 as an interspecies signal. Controls biofilm, competence, bioluminescence, virulence.
- Riboswitch
- A 5′-UTR element binds a metabolite directly; the conformational change causes premature termination or occludes the ribosome binding site. Regulation with no protein involved.
- sRNA / antisense RNA
- Trans-encoded small RNAs, often Hfq-dependent, base-pair with target mRNAs to block translation or recruit RNase E. Fast, cheap, and reversible.
- Stringent response
- Uncharged tRNA in the ribosomal A site → RelA synthesizes (p)ppGpp → rRNA/tRNA synthesis shuts down, amino-acid biosynthesis and stress genes turn on. The master switch from growth to survival.
- Biofilm
- Surface-attached community in a self-produced EPS matrix. Stages: reversible attachment → irreversible attachment → microcolony → maturation → dispersal. Regulated by quorum sensing and by c-di-GMP (high = sessile/biofilm, low = motile).
- Biofilm tolerance
- Slow growth, persister cells, EPS as a diffusion and binding barrier, altered expression — 100–1000× more antibiotic-tolerant than planktonic cells. Tolerance, not inherited resistance.
- Cell differentiation
- Sporulation in Bacillus (asymmetric septum, σF/σE/σG/σK cascade), heterocysts in Anabaena, fruiting bodies in Myxococcus, stalked/swarmer cells in Caulobacter. Genetically identical cells taking on different fates.
- Temperature classes
- Psychrophile (<15°C), mesophile (20-45°C), thermophile (45-80°C), hyperthermophile (>80°C). Adaptations: membrane fatty-acid saturation, chaperone load, protein ion-pair content.
- pH classes
- Acidophile (<5), neutrophile (5-8), alkaliphile (>9). Cells hold internal pH near neutral regardless; H. pylori is a neutrophile that survives the stomach with urease.
- Oxygen classes
- Obligate aerobe, facultative anaerobe, microaerophile, aerotolerant anaerobe, obligate anaerobe. Determined by the presence of superoxide dismutase, catalase, and peroxidase — and by whether O₂ poisons key enzymes.
- Reactive oxygen species
- O₂⁻ superoxide, H₂O₂, OH· hydroxyl radical. Defenses: SOD → catalase/peroxidase. OxyR and SoxRS are the sensing regulators.
- Water activity (aw) & osmotic stress
- Free water available for growth. Halophiles thrive at low aw; cells accumulate compatible solutes (K⁺, glycine betaine, ectoine) to balance osmolarity without poisoning enzymes.
- Extremophile examples
- Halobacterium (salt saturation, bacteriorhodopsin proton pump), Sulfolobus (pH 2, 80°C), Pyrolobus fumarii (113°C), Deinococcus radiodurans (radiation, via genome redundancy + efficient repair).
- Control of microbial growth
- Sterilization eliminates all microbes (autoclave 121°C, 15 psi, 15 min). Disinfection reduces pathogens on surfaces; antisepsis is the same on living tissue. D-value = time to kill 90% at a given condition.
Beyond the syllabus
Read this before you study the next three blocks
Rowen's 2026 schedule has no pathogenesis unit, no immunology unit, and no antimicrobials unit — chapters 23–28 of Slonczewski are entirely off the list. His own research is P. aeruginosa pathogenesis, so these topics show up as lecture examples: worth recognizing, not worth memorizing at exam depth.
One real exception. Section 12.2 is literally titled "Biofilm Formation by Pseudomonas aeruginosa" and is assigned in Unit 5. So P. aeruginosa biofilm biology — c-di-GMP, alginate, the mucoid switch — is fair exam material through the regulation lens, even though virulence factors and toxins are not.
Pathogenesis (Rowen's research area)
- Virulence factor
- Microbial product that contributes to disease: toxins, capsules, adhesins, secretion systems, immune evasion.
- Adhesion + colonization
- Pili, fimbriae, surface adhesins bind host receptors. E. coli P-pili in UTI; Vibrio cholerae TCP in gut.
- Exotoxins
- Secreted proteins. Diphtheria (ADP-ribosylates EF-2), cholera (locks Gαs on → cAMP), botulinum + tetanus (cleave SNAREs), Shiga (depurinates 28S rRNA).
- Endotoxin (LPS)
- Lipid A of the Gram-negative outer membrane; released on lysis; TLR4 → cytokine storm → septic shock.
- Type III secretion system (T3SS)
- Needle-like injectisome delivering effectors directly into host cytosol. Yersinia, Salmonella, Pseudomonas aeruginosa, EPEC. Evolutionarily related to the flagellar basal body.
- Type IV secretion (T4SS)
- Conjugation-related; Helicobacter CagA, Agrobacterium T-DNA, Legionella Dot/Icm.
- Type VI secretion (T6SS)
- Phage-tail-derived; injects toxins into competing bacteria and sometimes host cells.
- Pseudomonas aeruginosa
- Opportunistic pathogen; biofilms in CF lungs. Mucoid conversion (alginate overproduction) marks chronic infection. Multidrug resistance via efflux + porin loss + β-lactamases.
- Mucoid conversion in P. aeruginosa
- Loss-of-function mutation in mucA (anti-σ factor) frees σ22 (AlgT/U) → activates the alg biosynthesis genes → mucoid phenotype. Hallmark of CF lung adaptation, and a clean example of the σ/anti-σ logic from Unit 5.
Antimicrobials & resistance
- Cell wall inhibitors
- β-lactams (penicillin, cephalosporin, carbapenem) inhibit transpeptidase/PBPs. Vancomycin binds D-Ala-D-Ala. Bactericidal.
- Protein synthesis inhibitors
- 30S: aminoglycosides, tetracyclines. 50S: macrolides, chloramphenicol, lincosamides, oxazolidinones (linezolid).
- Nucleic acid inhibitors
- Quinolones inhibit gyrase/Topo IV. Rifampin binds RpoB → blocks transcription. Metronidazole damages DNA in anaerobes.
- Folate antagonists
- Sulfonamides + trimethoprim block sequential folate-synthesis steps; synergistic as TMP-SMX.
- MIC
- Minimum inhibitory concentration: lowest drug concentration preventing visible growth.
- Resistance mechanisms
- (1) Enzymatic inactivation (β-lactamase). (2) Efflux pumps. (3) Target modification (PBP2a in MRSA, ribosomal methylation, gyrase mutation). (4) Reduced uptake (porin loss).
- MRSA, VRE, ESBL, CRE
- MRSA = mecA → PBP2a. VRE = D-Ala-D-Lac. ESBL = extended-spectrum β-lactamase. CRE = carbapenem-resistant Enterobacterales (KPC, NDM-1).
Ecology, element cycles & applied microbiology
- Microbiome
- Microbial community of a defined habitat (gut, skin, soil, ocean). Studied by 16S amplicon and shotgun metagenomics — the same tools as Unit 2.
- Carbon cycle role
- Decomposers mineralize organic C → CO₂; anaerobes ferment and methanogens produce CH₄ in wetlands and ruminants.
- Nitrogen cycle
- Fixation → ammonification → nitrification → denitrification, with anammox as a shortcut. Almost entirely bacterial/archaeal chemistry.
- Sulfur cycle
- Sulfate reducers (Desulfovibrio) → H₂S; sulfide oxidizers (Beggiatoa, Thiobacillus) → SO₄²⁻.
- Symbioses
- Rumen microbiome digests cellulose; root nodules fix N₂; insect endosymbionts supply vitamins (and show the genome reduction from Unit 2).
- Bioremediation
- Microbes degrade pollutants: Pseudomonas on hydrocarbons, Geobacter on uranium, Dehalococcoides on chlorinated solvents. A good Assignment 1 topic.
- Industrial fermentation
- Lactic acid (yogurt), ethanol (beer, fuel), penicillin (Penicillium), recombinant insulin (E. coli), citric acid (Aspergillus).
- Lab diagnosis
- Culture + Gram stain + biochemical tests + MALDI-TOF + 16S rRNA + PCR.
Exam tips grounded in the syllabus
- Exam 1 is the big one. It carries Units 1 and 2 — every method plus all of genomics and phylogeny. Nothing else on the schedule spans two units.
- Objective 2 is a prediction task. "Predict the properties of a bacterium based on an analysis of its genome" reads as: given an annotation, say what it eats, where it lives, and how it moves. Practice going from gene list → phenotype, not just defining terms.
- Know the Bacteria/Archaea contrasts cold: peptidoglycan vs pseudopeptidoglycan, ester- vs ether-linked lipids, bacterial σ factors vs archaeal eukaryote-like RNA polymerase.
- lac vs trp: inducible vs repressible, allolactose vs tryptophan as effector, attenuation only in trp.
- Unit 5 ties regulation to lifestyle — σ/anti-σ, two-component, quorum sensing, and c-di-GMP all converge on biofilm formation. Expect a question that crosses those.
- The optional final replaces one of exams 1–3, not exam 4. A bad Exam 1 is recoverable.