Chapter introduction
Scanning electron tomography, with focused ion beam tomography, reveals Salmonella bacteria infecting a human cell. The 3D image shows bacteria (cyan) inside ruptured cell vesicles (yellow). Large vesicles
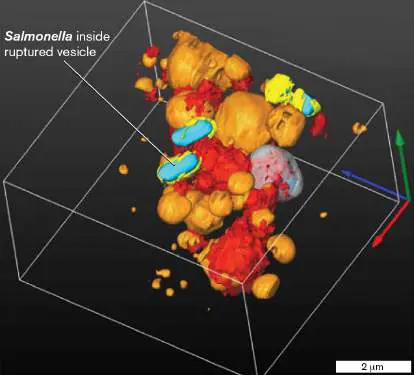
(orange) take up extracellular material by pinocytosis. Salmonella bacteria resist the cell’s defenses and multiply within the vesicles, thus evading the host immune system. J. FREDLUND ET AL. 2018. CELL MICROBIOL. 20 (4)
Chapter Sections Learning Objectives
2.1 Observing » Microbes Explain the distinction between detection and resolution, and summarize the use of microscopy across many scales of microbial size and shape.
2.2 Optics and » Properties of Define the different ways that Light light interacts with an object.
2.3 Bright-Field » Microscopy and Explain the function of bright- Phase-Contrast field microscopy and phase- Microscopy contrast microscopy, and the factors that influence them.
2.4 Fixation and » Staining for Describe the use of fixation and Bright-Field staining in bright-field Microscopy microscopy.
Chapter Sections Learning Objectives
2.5 Fluorescence » Microscopy, Describe the use of FISH, and fluorescence microscopy, Chemical fluorescence in situ Imaging hybridization (FISH), and Microscopy chemical imaging microscopy.
Special Topic 2 Biogeography of a Gut Pathogen 2.6 Electron » Microscopy, Explain the use of transmission Scanning Probe and scanning electron Microscopy, microscopy, and identify and X-Ray advanced methods of imaging Crystallography cells and molecules.
eResearch Activity 2 How Do Bacteria Make a Magnet Chain?
One definition of a microbe is an organism that requires a microscope to see. Microscopy reveals the vast realm of life that is invisible to the unaided eye. A microscope enables us to count the number of microbes in the human bloodstream or in natural environments such as the open ocean. It shows us how microbes swim and respond to signals such as a new food source. Microscopes reveal entire communities, such as the microbes that colonize the root of a tree or those that form plaque on the surface of our teeth. More powerful microscopes reveal the parts of our cells and their function in real time. Fluorescence microscopy captures single molecules within a living cell. The fluorophores can label specific kinds of DNA or proteins. At higher resolution, electron microscopy explores the cell’s interior. Cryo-electron microscopy reveals the cell in three dimensions and models the shape of viruses such as coronaviruses, including their spike proteins that lead to deadly infections.
Chapter 2 begins with light microscopy, the essential tool for every student and professional in the field or clinic. We then explore fluorescence and super-resolution imaging, electron microscopy, and scanning probe microscopy, which push ever farther the frontiers of our ability to observe the microbial world. And we continue to invent new kinds of microscopy, such as chemical imaging microscopy, to reveal microbial metabolism at work.
2.1 Observing MicrobesUnit 1 · Methods
How did people first see microbes? As we saw in Chapter 1, the microscope of Antonie van Leeuwenhoek first revealed the tiny life forms on his teeth; his superior lenses were key to his success. Since the time of Leeuwenhoek, microscopists have devised ever-more-powerful instruments to find microbes in familiar and unexpected habitats.
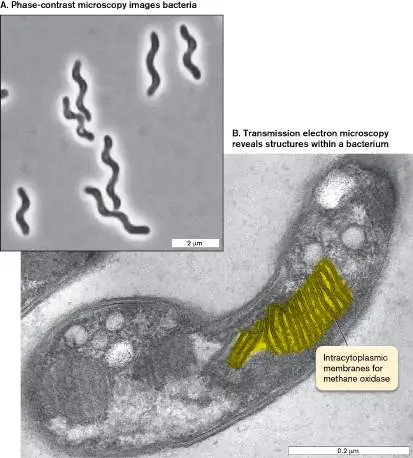
For example, an unusual spiral-shaped methane-oxidizing bacterium (methanotroph) was isolated from a peat bog in northern Russia (Fig. 2.1). Methane-oxidizing bacteria are crucial for curbing the release of methane from archaea that produce it. These bacteria were visualized as a whole by phase-contrast microscopy ( Fig. 2.1A). Phase contrast makes use of the wave property of light, which causes light rays to bend “out of sync” at the edge between a microbe and its surrounding medium, thus generating high contrast. The patterns of light and dark reveal the cell’s spiral curves. Phase contrast is explained further in Section 2.3.
To peek inside a cell requires more powerful tools, such as electron microscopy (EM) (Fig. 2.1B ). Transmission electron microscopy reveals the amazing pattern of membranes that contain the methane-oxidizing electron transport system. For transmission EM, the sample is sliced into very thin sections, stained with electron-dense metal atoms, and bombarded with a beam of electrons (see Section 2.6). Within the cell, the electron beam reveals surprising layers of membranes stacked like pancakes. These intracellular membranes are packed with proteins that transfer electrons from methane (CH 4) onto oxygen (O 2), a process discussed in Chapter 14. Ultimately much of the methane is trapped in the cell’s biomass, thus preventing escape of a greenhouse gas into the atmosphere.
FIGURE 2.1 ■ Methane-oxidizing bacteria shown by microscopy. A. Phase-contrast microscopy shows the spiral shape of each cell (spirillum). B. Transmission electron microscopy (TEM) reveals intracytoplasmic membranes where methane is oxidized. False color indicates intracellular membranes for methane oxidase.
O. V. DANILOVA ET AL. 2016. ISME J. 10 :2734–2743
O. V. DANILOVA ET AL. 2016. ISME J. 10 :2734–2743
But why can’t we see microbes without magnification? The answer is surprisingly complex. In fact, our definition of “microscopic” is based on the properties of our eyes. We define what is visible and what is microscopic in terms of the human eye (Fig. 2.2).
FIGURE 2.2 ■ Defining the microscopic. Within the human eye, the lens focuses an image on the retina.
Resolution of Objects by Our Eyes
What determines the smallest object we can see? The size at which objects become visible depends on the eye’s ability to resolve detail. Resolution is the smallest distance between two objects that allows us to see them as separate objects. The eyes of humans and other animals observe an object by focusing its image on a retina packed with light-absorbing photoreceptor cells (Fig. 2.2). The image appears sharp, in focus, if the eye’s lens and cornea bend all the light rays from each point of the object to converge at one point on the retina. Nearby points are then resolved as separate.
In the human eye, the finest resolution of two separate points is perceived by the fovea, the portion of the retina where the photoreceptors are packed at the highest density. The foveal photoreceptors are cone cells, which detect primary colors (red, green, or blue) and finely resolved detail. A group of cones with their
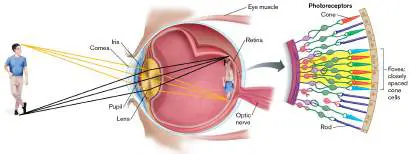
linked neurons forms one unit of detection, comparable to a pixel on a computer screen. The distance between two foveal “pixels” (groups of cones with neurons) limits our resolution to 100–200 micrometers (μm); that is, one-or two-tenths of a millimeter. So, a tenth of a millimeter is about the smallest object that most of us can see (resolve distinctly) without a magnifier.
What if our eyes were formed differently? The retinas of eagles have cones packed more closely than ours, so an eagle can resolve objects eight times as small (or eight times as far away) as a human can; hence, the phrase “eagle-eyed” means “sharp-sighted.” On the other hand, insect compound eyes have photoreceptors farther apart than ours, so insect eyes have poorer resolution. The best they can do is resolve objects 100-fold larger than those we can resolve. If a science-fictional giant ameba had eyes with photoreceptors 2 meters apart, it would perceive humans as “microscopic.”
Thought Question
2.1 As shown in Figure 2.2, the image passing through your cornea and lens is inverted (rotated upside down) on your retina. Why, then, does the world appear right side up?
Note: In this book, we use standard metric units for size:
1 millimeter (mm) = one-thousandth of a meter (m) = 10 −3 m 1 micrometer (μm) = one-thousandth of a millimeter = 10 −6 m 1 nanometer (nm) = one-thousandth of a micrometer = 10 −9 m 1 picometer (pm) = one-thousandth of a nanometer = 10 −12 m Some authors still use the traditional unit angstrom (Å), which equals a tenth of a nanometer, or 10 −10 meter.
Resolution Differs from Detection
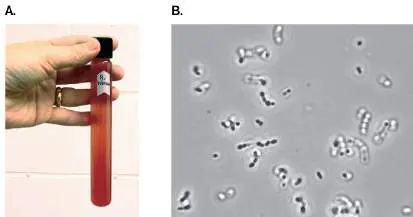
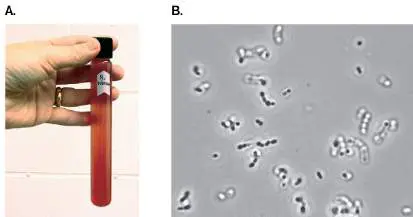
Can we detect the presence of objects whose size we cannot resolve? Yes, we can detect their presence as a group. For example, our eyes can detect a large population of microbes, such as a spot of mold on a piece of bread (about a million cells) or a cloudy tube of bacteria in liquid culture (a hundred million cells per milliliter; Fig. 2.3A). Detection, the ability to determine the presence of an object, differs from resolution. When the unaided eye detects the presence of mold or bacteria, it cannot resolve distinct cells. To resolve most kinds of microbial cells, our eyes need assistance; that is, magnification. Magnification reveals the shapes of individual bacteria such as the grape-fermenting bacterium Oenococcus oeni (Fig. 2.3B ). Magnifying an object means increasing the object’s apparent dimensions. As the distance increases between points of detail, our eyes can now resolve the object’s shape as a magnified image.
FIGURE 2.3 ■ Detecting and resolving bacteria. A. A tube of bacterial culture, Rhodospirillum rubrum. The presence of bacteria is detected, though individual cells are not resolved. B. Individual cells of Oenococcus oeni are resolved by light microscopy.
JOAN SLONCZEWSKI, KENYON COLLEGE
C. M. LUCY JOSEPH, UC DAVIS DEPT. OF VITICULTURE AND ENOLOGY WINE YEAST
AND BACTERIA COLLECTION
Microbial Size and Shape
Different kinds of microbes differ in size over a range of several orders of magnitude, or powers of ten (Fig. 2.4). Eukaryotic microbes are found across the full range of cell size, from photosynthetic picoeukaryotes abundant in the oceans (0.2–2.0 μm) to giant amebas that reach nearly a centimeter and marine xenophyophores that may reach 20 cm (discussed in Chapter 20).
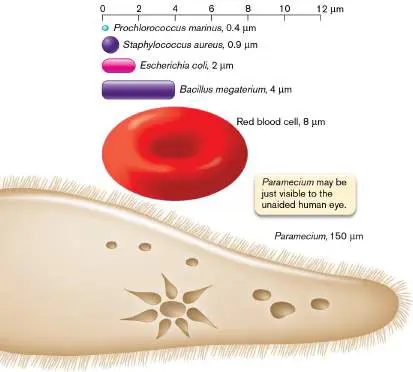
FIGURE 2.4 ■ Relative sizes of different cells. Within a eukaryotic cell, a student’s light microscope may resolve intracellular compartments such as the nucleus and vacuoles containing digested food (Fig. 2.5). Protists show complex shapes and appendages. For example, an ameba from a freshwater ecosystem shows a large nucleus and pseudopods to engulf prey ( Fig. 2.5A). Pseudopods can be seen moving by the streaming of their cytoplasm. Another protist readily observed by light microscopy is Trypanosoma brucei, an insect-borne blood parasite that causes African sleeping sickness (Fig. 2.5B ). In the trypanosome, we observe a nucleus and a flagellum. Eukaryotic flagella propel the cell by a whiplike action. For more on microbial eukaryotes, see Chapter 20.
FIGURE 2.5 ■ Eukaryotic microbial cells. Eukaryotic microbes are large enough that details of internal and external
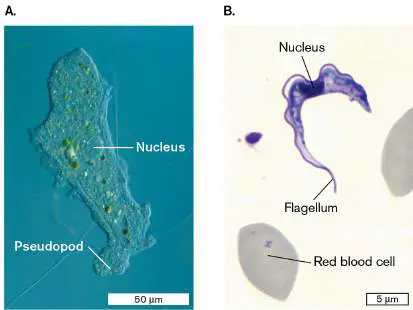
organelles can be seen under a light microscope. A. Amoeba proteus. B. Trypanosoma brucei (cause of sleeping sickness)
among blood cells.
ANDREW SYRED/SCIENCE SOURCE
CDC/DPDX
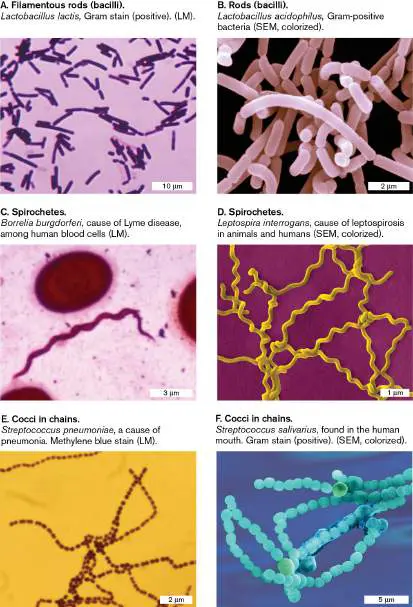
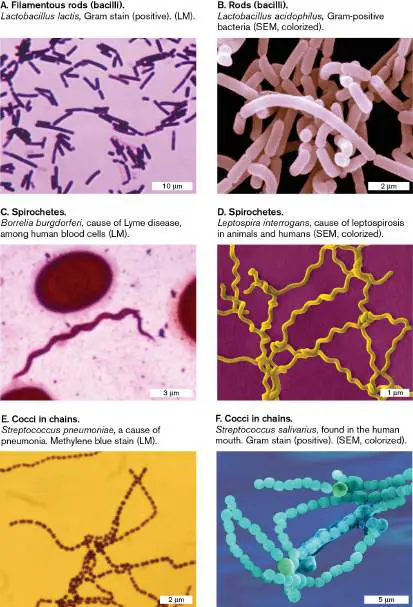
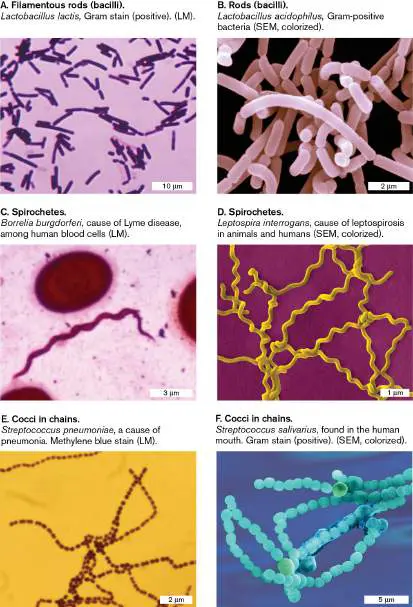
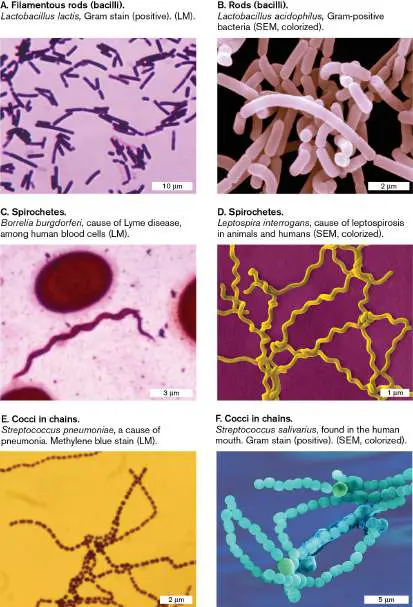
Many prokaryotes (bacteria and archaea) are smaller than 10 μm. Their overall shape can be seen, but most of their internal structures (discussed in Chapter 3) are too small to resolve by light microscopy. Figure 2.6shows some common cell shapes of bacteria, as visualized by light microscopy or by scanning electron microscopy. With bright-field light microscopy (LM), the cell shape is just discernible under the highest power, usually 1,000× (Fig. 2.6A, C, E ). With scanning electron microscopy (SEM), cell shapes appear in greater detail; that is, higher resolution (Fig. 2.6B, D, F ). These SEM images are colorized to enhance clarity.
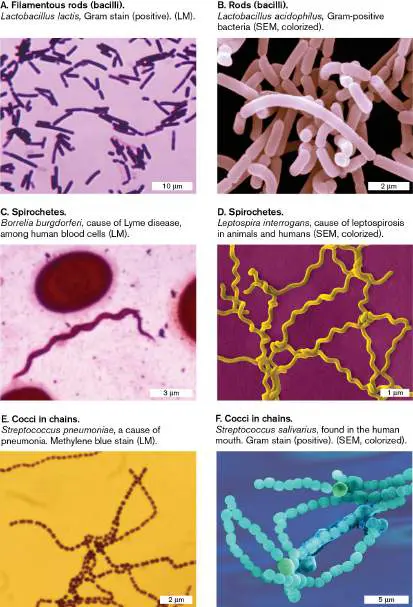
FIGURE 2.6 ■ Common shapes of bacteria. A, C, E. The shapes of most bacterial cells can be discerned with light microscopy (LM), but their subcellular structures and surface details cannot be seen. B, D, F. Surface detail is revealed by scanning electron microscopy (SEM). These SEM images are colorized to enhance clarity.
DR. A. M. SIEGELMAN/VISUALS UNLIMITED, INC.
DENNIS KUNKEL MICROSCOPY/SCIENCE SOURCE
MICHAEL ABBEY/VISUALS UNLIMITED
DENNIS KUNKEL MICROSCOPY/SCIENCE SOURCE
DR. A. M. SIEGELMAN/VISUALS UNLIMITED, INC.
DENNIS KUNKEL MICROSCOPY/SCIENCE SOURCE
Certain shapes of bacteria are common to many taxonomic groups. For example, both bacteria and archaea form similarly shaped rods, or bacilli (singular, bacillus; Fig. 2.6Aand B ), and cocci (spheres; singular, coccus; Fig. 2.6E and F ). Thus, rods and spherical shapes evolved independently within different taxa. In contrast, an example of a unique bacterial shape that evolved in only one taxon is the spirochete, a tightly coiled spiral (Fig. 2.6C and D ). Species of spirochetes cause diseases such as syphilis and Lyme borreliosis. The spiral form of the spirochete cell is maintained by internal axial filaments and flagella, as well as an outer sheath. (For more on spirochetes, see Section 18.5.) A different, unrelated spiral form is the spirillum (plural, spirilla), seen in Figure 2.1. The spirillum is a wide, rigid spiral cell that is similar to a rod-shaped bacillus.
Note: The genus name Bacillus refers to a specific taxonomic
group of bacteria, but the term “bacillus” (plural, bacilli) refers to any rod-shaped bacterium or archaeon.
Microscopy at Different Size Scales
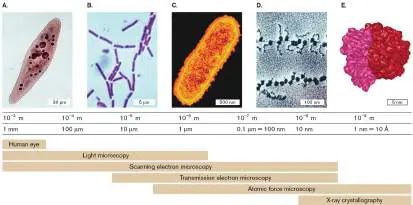
To resolve microbes and microbial structures of different sizes requires different kinds of microscopes. Figure 2.7shows different techniques used to resolve microbes and structures of various sizes. For example, a paramecium can be resolved under a light microscope, but an individual ribosome (20 nm in diameter) requires electron microscopy.
FIGURE 2.7 ■ Microscopy and X-ray crystallography, range of resolution. A. Paramecium (stained light microscopy, LM). B. Bacillus sp. (stained LM). C. Escherichia coli (transmission electron microscopy, TEM). D. Ribosomes on messenger RNA (TEM). E. Ribosome model (X-ray crystallography).
ED RESCHKE/PETER ARNOLD, INC./GETTY IMAGES
BIODISC/VISUALS UNLIMITED
T. J. BEVERIDGE/VISUALS UNLIMITED
KISELEVA & DONALD FAWCETT/VISUALS UNLIMITED
Light microscopy (LM) resolves images of individual bacteria by their absorption of light. The specimen is commonly viewed as a dark object against a light-filled field, or background; this is called bright-field microscopy (seen in Fig. 2.7Aand B ). Advanced techniques, based on special properties of light, include phase-contrast and fluorescence microscopy.
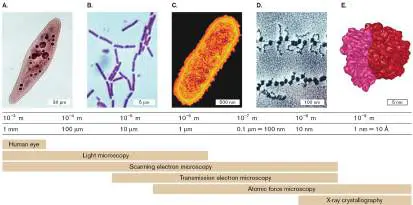
Electron microscopy (EM) uses beams of electrons to resolve details several orders of magnitude smaller than those seen under light microscopy. In scanning electron microscopy (SEM), the electron beam is scattered from the metal-coated surface of an object, generating an appearance of 3D depth. In transmission electron microscopy (TEM; Fig. 2.7C and D ), the electron beam travels through the object, where the electrons are absorbed by an electron-dense metal stain.
Chemical imaging microscopy uses spectrometry to map the chemical contents of a specimen, such as the distribution of nitrogen and carbon compounds.
X-ray crystallography (also called X-ray diffraction analysis) detects the interference pattern of X-rays entering the crystal lattice of a molecule. From the interference pattern, researchers build a computational model of the structure of the individual molecule, such as a protein or a nucleic acid or even a molecular complex such as a ribosome (Fig. 2.7E ).
Thought Question
2.2 (refer to Fig. 2.7) You have discovered a new kind of microbe, never observed before. What kinds of questions about this microbe might be answered by light microscopy? What questions would be better addressed by electron microscopy?
To Summarize
Detection is the ability to determine the presence of an object.
Resolution is the smallest distance by which two objects can be separated and still be distinguished as separate. Magnification is an increase in the apparent size of an image.
Some eukaryotic microbes may be large enough to resolve subcellular structures under a light microscope. Other eukaryotic cells are as small as bacteria.
Bacteria and archaea are generally too small for subcellular resolution by a light microscope. Their shapes include characteristic forms such as rods and cocci. Different kinds of microscopy resolve cells and subcellular structures of different sizes. Chemical imaging microscopy reveals the chemical composition of a cell.
Glossary
microscope A tool that increases the magnification of specimens to enable viewing at higher resolution.
resolution The smallest distance that two objects can be separated and still be distinguished as separate objects.
focus pl. foci The point at which rays of energy converge; in light microscopy, the convergence of light rays maximizes the clarity of the optical image.
detection The ability to determine the presence of an object.
magnification An increase in the apparent size of a viewed object as an optical image.
bacillus pl. bacilli A rod-shaped bacterial or archaeal cell.
bacillus pl. bacilli A rod-shaped bacterial or archaeal cell.
coccus pl. cocci A spherically shaped bacterial or archaeal cell.
coccus pl. cocci A spherically shaped bacterial or archaeal cell.
spirochete A bacterium with a tight, flexible spiral shape; a species of the phylum Spirochetes (Spirochaetota).
spirillum pl. spirilla A rigid, corkscrew-shaped bacterial cell such as Rhodospirillum sp.
spirillum pl. spirilla A rigid, corkscrew-shaped bacterial cell such as Rhodospirillum sp.
light microscopy (LM)
Observation of a microscopic object on the basis of light absorption and transmission.
bright-field microscopy A type of light microscopy in which the specimen absorbs light and appears dark against a light background.
electron microscopy (EM)
A form of microscopy in which a beam of electrons accelerated through a voltage potential is focused by magnetic lenses onto a specimen.
scanning electron microscopy (SEM)
Electron microscopy in which the electron beams scan across the specimen’s surface to reveal the 3D topology of the specimen.
transmission electron microscopy (TEM)
Electron microscopy in which electron beams are transmitted through a thin specimen to reveal internal structure. TEM See transmission electron microscopy .
chemical imaging microscopy A method of microscopy that maps the distribution of specific elements or chemicals within a sample.
X-ray crystallography or X-ray diffraction analysis A technique to determine the positions of atoms (atomic coordinates) within an array of identical molecules or molecular complexes on the basis of the diffraction of X-rays by the molecule.
X-ray crystallography or X-ray diffraction analysis A technique to determine the positions of atoms (atomic coordinates) within an array of identical molecules or molecular complexes on the basis of the diffraction of X-rays by the molecule.
Figure 2.2: FIGURE 2.2 ■ Defining the microscopic. Within the human eye, the lens focuses an image on the retina.
Figure 2.1:
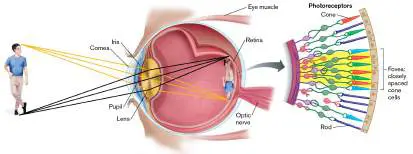
FIGURE 2.1 ■ Methane-oxidizing bacteria shown by microscopy. A. Phase-contrast microscopy shows the spiral shape of each cell (spirillum). B. Transmission electron microscopy (TEM) reveals intracytoplasmic membranes where methane is oxidized. False color indicates intracellular membranes for methane oxidase.
O. V. DANILOVA ET AL. 2016. ISME J. 10 :2734–2743
O. V. DANILOVA ET AL. 2016. ISME J. 10 :2734–2743
Fig. 2.7:
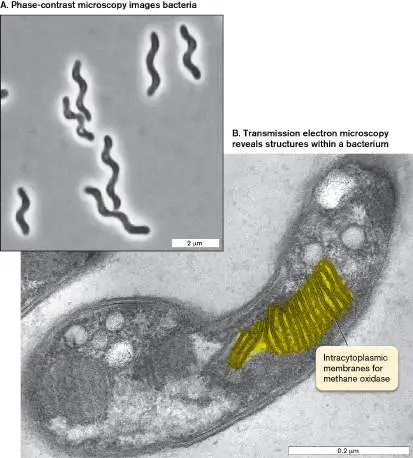
FIGURE 2.7 ■ Microscopy and X-ray crystallography, range of resolution. A. Paramecium (stained light microscopy, LM). B. Bacillus sp. (stained LM). C. Escherichia coli (transmission electron microscopy, TEM). D. Ribosomes on messenger RNA (TEM). E. Ribosome model (X-ray crystallography).
ED RESCHKE/PETER ARNOLD, INC./GETTY IMAGES
BIODISC/VISUALS UNLIMITED
T. J. BEVERIDGE/VISUALS UNLIMITED
KISELEVA & DONALD FAWCETT/VISUALS UNLIMITED
2.2 Optics and Properties of LightUnit 1 · Methods
How do light rays magnify an image? Light microscopy directly extends the lens system of our own eyes. Light is part of the spectrum of electromagnetic radiation (Fig. 2.8), a form of energy propagated as waves that are associated with electrical and magnetic fields. Regions of the electromagnetic spectrum are defined by wavelength, which for visible light is about 400–750 nm. Radiation of longer wavelengths includes infrared and radio waves, whereas shorter wavelengths include ultraviolet rays and X-rays.
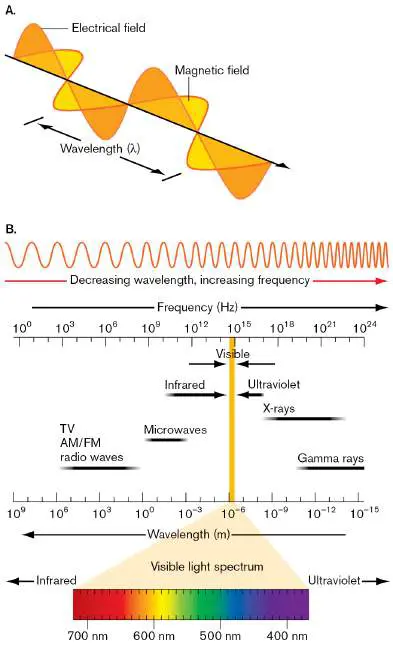
FIGURE 2.8 ■ Electromagnetic energy. A. Electromagnetic radiation is composed of electrical and magnetic waves perpendicular to each other. B. The electromagnetic spectrum includes the visible range of light.
Light Carries Information
All forms of electromagnetic radiation carry information from the objects they interact with. The information carried by radiation can be used to detect objects; for example, radar (using radio waves) detects a speeding car. All electromagnetic radiation travels through a vacuum at the same speed: about 3 × 10 8 meters per second (m/s), the speed of light. The speed of light (c) is equal to the wavelength (λ) of the radiation multiplied by its frequency (ν), the number of wave cycles per unit time: c = λν Because c is constant, the longer the wavelength λ is, the lower the frequency ν is. Frequency is usually measured in hertz (Hz), reciprocal seconds (1/s).
The wavelength λ limits the size of objects that can be resolved as separate from neighboring objects. Resolution requires: Contrast between the object and its surroundings.
Contrast is the difference in light and dark. If an object and its surroundings absorb or reflect radiation equally, then the object will be undetectable. It is hard to observe a cell of transparent cytoplasm floating in water, because the aqueous cytoplasm and the extracellular water tend to transmit light similarly, producing little contrast.
Wavelength smaller than the object. For an object to be resolved, the wavelength of the radiation must be equal to or smaller than the size of the object. If the wavelength of the radiation is larger than the object, then most of the wave’s energy will simply pass through the object, like an ocean wave passing around a dock post. Thus, radar, with a wavelength of 1–100 centimeters (cm), cannot resolve microbes, though it easily resolves cars and people.
Magnification. The human retina absorbs radiation within a range of wavelengths, 400–750 nm (0.40–0.75 μm), which we define as visible light. But the smallest distance our retina can resolve is 150 μm, about 300 times the wavelength of light. Thus, we are unable to access all of the information contained in the light that enters our eyes. To use more of the information carried within the light, we must spread the light rays apart far enough for our retina to perceive the resolved image.
Light Interacts with an Object
The physical behavior of light resembles in some ways a beam of particles and in other ways a waveform. The particles of light are called photons. Each photon has an associated wavelength that determines how the photon will interact with a given object. The combined properties of particle and wave enable light to interact with an object in several different ways (Fig. 2.9).
FIGURE 2.9 ■ Interaction of light with matter. Absorption means that the absorbing object gains the photon’s energy (Fig. 2.9A). The energy is converted to a different form, usually heat. (That is why a live specimen eventually “cooks” on the slide if observed for too long.) When a microbial specimen absorbs light, it can be observed as a dark spot
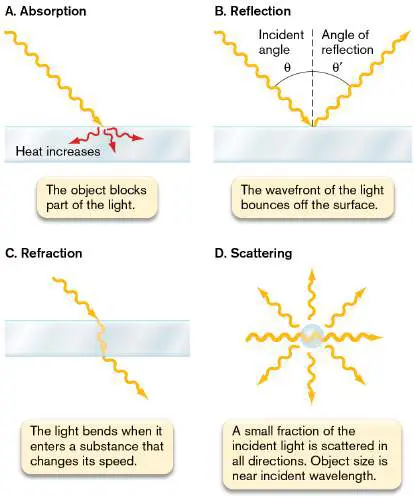
against a bright field, as in bright-field microscopy. Some molecules that absorb light of a specific wavelength reemit energy as light with a longer wavelength; this is called fluorescence. Fluorescence microscopy is discussed in Section 2.5.
Reflection means that the wavefront redirects from the surface of an object at an angle equal to its incident angle (Fig. 2.9B ). The reflection of light waves is analogous to the reflection of water waves. Reflection from a silvered mirror or a glass surface is used in the optics of microscopy.
Refraction means that light bends as it enters a substance that slows its speed (Fig. 2.9C ). Such a substance is said to be refractive and, by definition, has a higher refractive index than air has. Refraction is the key property that enables a lens to magnify an image.
Scattering means that a portion of the wavefront is converted to a spherical wave originating from the object (Fig. 2.9D ). If a large number of particles simultaneously scatter light, we see a haze; for example, the haze of bacteria suspended in a culture tube. Special optical arrangements can use scattered light to detect (but not resolve) microbial shapes smaller than the wavelength of light.
Magnification by a Lens
Magnification requires the bending of light rays, as in refraction. As a wavefront of light enters a refractive material, such as glass, the region of the wave that first reaches the material is slowed, while the rest of the wave continues at its original speed until it also passes into the refractive material (Fig. 2.10A). As the entire wavefront passes through the refractive material, its path continues, bent at an angle from its original direction.
Thought Question
2.3 Explain what happens to the refracted light wave as it emerges from a piece of glass of even thickness. How do its new speed and direction compare with its original (incident) speed and direction? How does refraction accomplish magnification? Refraction magnifies an image when light passes through a refractive material shaped so as to spread its rays. One shape that spreads light rays is a parabolic curve. When light rays enter a lens of refractive material with a parabolic surface (Fig. 2.10B ), parallel rays each bend at an angle such that all of the rays meet at a certain point, called the focal point. From the focal point behind the lens, the light rays continue, spreading out with an expanding wavefront. This expansion magnifies the image carried by the wave. The distance from the lens to the focal point (called the focal distance) is determined by the degree of curvature of the lens and by the refractive index of its material.
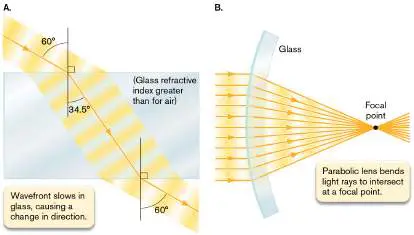
FIGURE 2.10 ■ Refraction of light waves. A. Wavefronts of light shift direction as they enter a substance of higher refractive index, such as glass. B. Glass with parabolic curvature (a lens) bends light rays to intersect at a focal point.
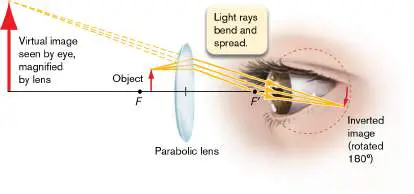
See above for Microscopy: Optic and Properties of Light animation In Figure 2.11, the object under observation is placed near the focal point (F) in front of a lens. The light rays trace a path opposite to that of Figure 2.10B . The rays expanding from point F are bent by the lens into a nearly parallel path entering the eye. The eye perceives the expanded light rays as a virtual image; that is, an image that appears to represent a much larger object farther away. The expansion of light rays, or magnification, increases the distances between points of the image. The details of the magnified image become larger than the spacing of photoreceptor units in the retina. Thus our eye can perceive details that the unaided eye cannot see.
FIGURE 2.11 ■ A lens magnifies an image. The object is placed near the focal point (F) in front of the lens. The lens bends and spreads the light rays.
See above for Microscopy: Optic and Properties of Light animation
Resolution of Detail
What limits the effect of magnification? The spreading of light rays does not in itself increase resolution. For example, an image composed of dots does not gain detail when enlarged on a photocopier, nor does an image composed of pixels gain detail when enlarged on a computer screen. In these cases, magnification fails to show details because the individual details of the image expand in proportion to the expansion of the overall image. Magnification without increasing detail is called empty magnification.
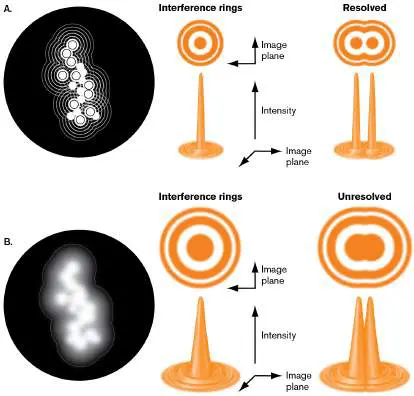
The resolution of detail in microscopy is limited by the wave nature of light. In theory, a perfect lens that focuses all of the light from an object should form a perfect image as its rays converge through the focal point. But light rays actually form wavefronts of infinite extent. Because the width of the lens is finite, only part of the wavefront enters, causing interference. The converging edges of the wave interfere with each other to form alternating regions of light and dark (Fig. 2.12). Thus, a point source of light (such as a point of detail in a specimen) forms an image of a bright central peak surrounded by interference rings of light and dark. Even a well-focused bright object appears as a bright disk surrounded by faint rings.
Suppose an object consists of a collection of point sources of light. Each point source generates a central peak of intensity. The width of this central peak will define the resolution, or separation distance, between any two points of the object (Fig. 2.12). This resolution determines the degree of detail that can be observed. In practice, any object, such as a stained microbe against a bright field, can be considered a large collection of points of light that act as partly resolved peaks of intensity.
FIGURE 2.12 ■ Interference of light waves at the focal point generates concentric rings surrounding the peak intensity. A. Broad wavefronts generate narrow interference rings with peaks well resolved. B. Narrow wavefronts generate wide interference rings that are unresolved.
See above for Microscopy: Optic and Properties of Light animation What factors limit resolution of an image? The wavelength of light limits the sharpness of the peak intensity of a point of detail. The finite width of the wavefront captured by the lens leads to interference and widens the peak intensity. Thus, bright-field light
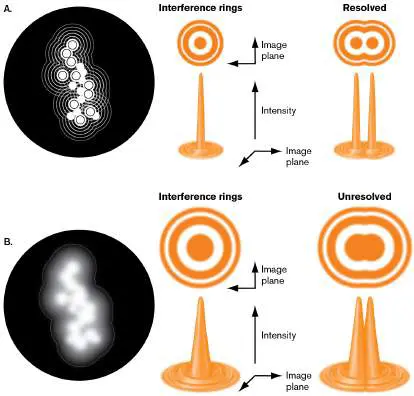
microscopy resolves only details that are greater than half the wavelength of light, about 200 nm (0.2 μm). Nevertheless, in advanced optical methods such as fluorescence microscopy (see Section 2.5), computation can extract positional detail from light rays. Such methods, called super-resolution imaging, enable us to track cellular molecules at a precision of 20–40 nm (discussed in Section 2.5).
To Summarize
Electromagnetic radiation interacts with an object and acquires information we can use to detect the object. Contrast between object and background makes it possible to detect the object and resolve its component parts. The wavelength of the radiation must be equal to or smaller than the size of the object for a microscope to resolve the object’s shape.
Absorption means that the energy from light (or other electromagnetic radiation) is acquired by the object. Reflection means that the wavefront bounces off the surface of a particle at an angle equal to its incident angle. Scattering means that a wavefront interacts with an object of smaller dimension than the wavelength. Light scattering enables the detection of objects whose detail cannot be resolved.
Refraction is the bending of light as it enters a substance that slows its speed. Refraction through a curved lens magnifies an image, enlarging its details beyond the spacing between our eye’s photoreceptors.
Interference between wavefronts converts a point source of light to a peak of intensity surrounded by rings. The width of the peak limits the resolution of details of an image.
Glossary
electromagnetic radiation Energy radiating in the form of alternating electrical and magnetic waves, quantized in photons.
contrast Differential absorption or reflection of electromagnetic radiation between an object and a background that allows the object to be distinguished from the background.
absorption In optics, the capacity of a material to absorb light.
fluorescence Also called epifluorescence. The emission of light from a molecule that absorbed light of a shorter, higher-energy wavelength.
reflection The deflecting of an incident light ray by an object, at an angle equal to the incident angle.
refraction The bending and slowing of light as it passes through a substance.
refractive index The degree to which a substance causes the refraction of light; a ratio of the speed of light in a vacuum to its speed in another medium.
scattering Interaction of light with an object that results in propagation of spherical light waves at relatively low intensity.
lens An object composed of transparent, refractive material that bends light rays to converge at a focal point (or to diverge from an imaginary point). For electron microscopy, a series of magnets arranged as a magnetic lens bends electron beams to converge or diverge.
focal point The position at which light rays that pass through a lens intersect.
empty magnification Magnification without an increase in resolution.
interference The interaction of two wavefronts. Interference can be additive (amplitudes in phase, constructive) or subtractive (amplitudes out of phase, destructive).
super-resolution imaging Techniques of microscopy that pinpoint the location of an object with a precision greater than the resolution of ordinary optical or fluorescence microscopy.
2.3 Bright-Field Microscopy and Phase- Contrast MicroscopyUnit 1 · Methods
The most common kind of light microscopy is called bright-field microscopy, in which an object such as a bacterial cell is perceived as a dark silhouette blocking the passage of light (for examples, see Fig. 2.6A, C, E). Details of the object are defined by the points of light surrounding its edge. Here we explain how a typical student’s microscope works and how to use it to image microbes.
Magnification
How do the optics of a bright-field microscope maximize the observation of detail? We consider the following factors: Wavelength and resolution. Our eyes can resolve a distance as small as 100–200 μm, while the resolution limit from the wavelength of light is 200 nm (0.2 μm); that is, 500-to 1,000-fold smaller. Thus, the greatest magnification that can improve our perception of detail is about 1,000×. Any greater magnification expands the image size, but the peaks expand without resolution between them (see Fig. 2.12). As we noted in the previous section, this expansion without increasing resolution is called empty magnification.
Light and contrast. For any given lens system, a balanced amount of light yields the highest contrast between the dark specimen and the light background. High contrast is needed to perceive the full resolution at a given magnification.
Lens quality. All lenses contain inherent aberrations that detract from perfect curvature. Optical properties limit the perfection of a single lens, but manufacturers construct microscopes with a series of lenses that multiply each other’s magnification and correct for aberrations.
Let’s first consider magnification of an image by a single lens. Figure 2.13shows an objective lens, a lens situated directly above an object or specimen that we wish to observe at high resolution. How can we maximize the resolution of details?
FIGURE 2.13 ■ Numerical aperture and resolution. The numerical aperture (NA) equals the refractive index (n) of the
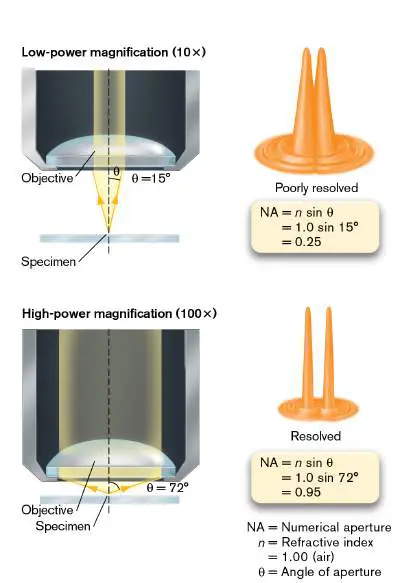
medium (air) containing the light cone, multiplied by the sine of the angle (θ) of the light cone. Higher NA allows greater resolution.
An object at the focal point of a lens sits at the tip of a cone of light formed by rays from the lens converging at the object. The angle of the light cone is determined by the curvature and refractive index of the lens. The lens fills an aperture, or hole, for the passage of light, and for a given lens the light cone is defined by an angle theta (θ) projecting from the midline, known as the angle of aperture. As θ increases and the horizontal width of the light cone (sin θ) increases, a wider cone of light passes through the specimen. The wider the cone of light rays, the less the interference between wavefronts—and the narrower the peak intensities in the image. Thus, a wider light cone enables us to resolve smaller details. The greater the angle of aperture of the lens (sin θ), the better the resolution.
Resolution also depends on the refractive index of the medium that contains the light cone, which is usually air. The refractive index (n) is the ratio of the speed of light in a vacuum to its speed in another medium. For air, n is extremely close to 1. For water, n = 1.33; for lens material, n ranges from 1.4 to 1.6. As light passing through air or water enters a lens of higher refractive index, the light bends, at angles (θ) up to a maximum. The product of the refractive index (n) of the medium multiplied by sin θ is the numerical aperture (NA): NA = n sin θ In Figure 2.13we see the calculation of NA for an objective lens of magnification 10× and for a lens of magnification 100×. As NA increases, the peak intensities of an image narrow and the distance between two objects that can be resolved decreases. The minimum resolution distance R varies inversely with NA: where λ represents the wavelength of incident light. Notice that this equation limits resolution to approximately half the wavelength of light (λ/2).
As the lens strength increases and the light cone widens, the lens must come nearer the object. Defects in lens curvature become more of a problem, and focusing becomes more challenging. As θ becomes very wide, too much of the light from the object is lost from refraction at the glass-to-air interface. To collect and focus more light, we need to increase the refractive index of the medium (air) between the object and the objective lens. For the highest-power objective lens, generally 100×, we can replace air with immersion oil between the object and the lens. Immersion oil has a refractive index (n = 1.5) comparable to that of the lens (Fig. 2.14). Immersion oil minimizes the loss of light rays by refraction and makes it possible to reach 100× magnification with minimal distortion. The 100× objective with immersion oil is generally the most powerful lens available on a student’s microscope.
FIGURE 2.14 ■ Use of immersion oil in microscopy. Immersion oil with a refractive index comparable to that of glass
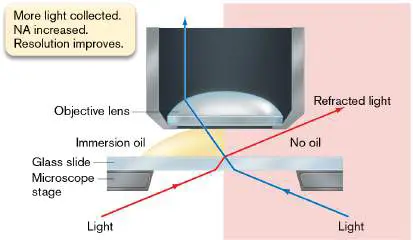
(n = 1.5) prevents light rays from bending away from the objective lens.
Thought Question
2.4 (refer to Fig. 2.13) For a single lens, what angle θ might offer magnification even greater than 100×? What practical problem would you have in designing such a lens to generate this light cone?
The Compound Microscope
A compound microscope is a system of multiple lenses designed to correct or compensate for lens aberrations. Why do we use a compound microscope instead of a single perfect lens? The manufacture of high-power lenses is difficult because as the glass curvature increases, the effects of aberration increase faster than the magnification. Instead of one thick lens, a series of lower-power lenses can multiply their magnification with minimal aberration. Figure 2.15shows a typical arrangement of a compound microscope: the light source is placed at the bottom, shining upward through a series of lenses, including the condenser, objective, and ocular lenses.
FIGURE 2.15 ■ Anatomy of a compound microscope. A. Light path through the microscope. B. Cutaway view.
Between the light source and the condenser sits a diaphragm, a device to cut the diameter of the light column. Lower-power lenses require lower light levels because the excess light makes it impossible to observe the darkening effect of specimen absorbance. Higher-power lenses spread the light rays farther and thus require an open diaphragm to collect sufficient light for contrast between the dark specimen and the bright field.
Above the diaphragm, the condenser consists of one or more lenses that collect a beam of rays from the light source onto a small area of the slide, where light may be absorbed by the object or
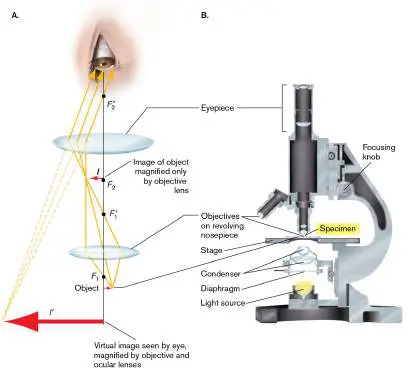
specimen. Condenser lenses increase light available for contrast but do not participate in magnification.
The objective lens is the first to form a magnified image (I) of the object (Fig. 2.15A). As the image forms, each light ray traces a path toward a position opposite its point of origin; thus, the image is inverted (rotated 180°).
The first image of the object (I) is then amplified by a secondary magnification step through the ocular lens within the eyepiece. The final image (I ′) is comparable to the virtual image of Figure 2.11, but I ′ includes the total magnification of the object by both objective and ocular lenses. The magnification factor of the ocular lens is multiplied by the magnification factor of the objective lens to generate the total magnification (power). Thus, a 10× ocular multiplied by a 40× objective generates 400× total magnification. A 100× objective with immersion oil is multiplied by 10× ocular magnification to yield 1,000× total magnification.
The nosepiece of a compound microscope typically holds three or four objective lenses of different magnifying power, such as 4×, 10×, 40×, and 100× (requiring immersion oil). These lenses are arranged so that they rotate in turn into the optical column. In a high-quality instrument, the lenses are set at different heights from the slide so as to be parfocal. In a parfocal system, when an object is focused with one lens, it remains in focus, or nearly so, when another lens is rotated to replace the first.
Note: Objective lenses can be obtained in several different
grades of quality, manufactured with different kinds of correction for aberrations. Lenses should feature at minimum the following corrections: “plan” correction for field curvature, to generate a field that appears flat; and “apochromat” correction for spherical and chromatic aberrations.
Observing a specimen under a compound microscope requires several steps: Position the specimen centrally in the optical column.
Only a small area of a slide can be visualized within the field of view of a given lens. The higher the magnification, the smaller the field of view that will be seen.
Optimize the amount of light. At lower power, too much light will wash out the light absorption of the specimen. At higher power, more light needs to be collected, lest everything appear dark. To optimize light, the condenser must be set at the correct vertical position to focus on the specimen, and the diaphragm must be adjusted to transmit the amount of light that produces the best contrast.
Focus the objective lens. The focusing knob permits adjustment of the focal distance between the objective lens and the specimen on the slide so as to bring the specimen into the focal plane, the plane that contains the focal points for light entering the lens from all directions. Typically, we focus first using a low-power objective, which generates a greater depth of field; that is, a range of planes in which the object appears in or near focus. After focusing under low power, we can rotate a higher-power lens into view and then fine-tune the adjustment.
Preparing a Specimen for Microscopy
A simple way to observe microbes is to place them in a drop of water on a slide with a coverslip. This is called a wet mount preparation. The advantage of the wet mount is that the organism is viewed in as natural a state as possible, without artifacts resulting from chemical treatment, and we can observe live behavior such as swimming (see Fig. 2.3B). The disadvantage of the wet mount is that most living cells are transparent and therefore show little contrast with the external medium. With limited contrast, the cells can barely be distinguished from background, and both detection and resolution are minimal.
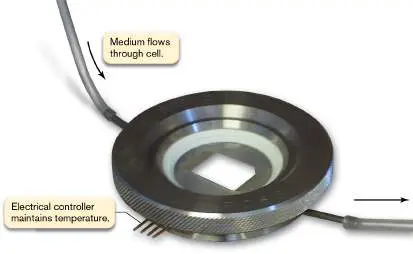
Another disadvantage of the wet mount is that the sample rapidly converts absorbed light to heat, thus tending to overheat and dry out. To avoid overheating, researchers use a temperature-controlled flow cell, in which fresh medium passes through the specimen (Fig. 2.16). The microbe to be observed must adhere to a specially coated slide within the flow cell. The adherent cells may grow and multiply as a biofilm, nourished continually by fresh medium.
FIGURE 2.16 ■ A flow cell enables extended observation of living microbes. In a flow cell, culture medium flows through an inlet tube into the slide chamber and then exits through the outlet.
BIOPTECHS FLOW CELL (PHOTO BY J. SLONCZEWSKI)
Focusing the Object
An object appears in focus (that is, it is situated within the focal plane of the lens) when its edge appears sharp and distinct from the background. The shape of the dark object is actually defined by the points of light surrounding its edge. At higher power, as we reach the resolution limit, these points of light are only partly resolved. The partial resolution of these points of light generates interference effects, such as extra rings of light surrounding an object. In Figure 2.17we observe Oenococcus oeni, bacteria that ferment the malic acid of grapes during wine production. As chains of O. oeni drift in and out of the focal plane, their appearance changes through optical effects. When a bacterium drifts out of the focal plane too close to the lens, resolution declines and the image blurs (Fig. 2.17A). When the bacterium lies within the focal plane, its image appears sharp, with a bright line along its edge (Fig. 2.17B ). When the chain of cells lies too far past the focal plane, the bright interference lines collapse into the object’s silhouette, which now appears bright or “hollow,” or surrounded by rings (Fig. 2.17C ). In fact, the bacterium is not hollow at all; only its image has changed.
When the chain extends across several focal planes, different portions appear out of focus (either too near or too far from the lens; Fig. 2.17D ). In addition, when the end of a cell points toward the observer, light travels through the length of the cell before reaching the observer, so the cell absorbs more light and appears dark.
FIGURE 2.17 ■ Bacteria observed at different levels of focus.
C. M. LUCY JOSEPH, UC DAVIS DEPT. OF VITICULTURE AND ENOLOGY WINE YEAST
AND BACTERIA COLLECTION
How do we observe microbes that are actively motile? Motile bacteria swimming in and out of the focal plane present a challenge even to experienced microscopists. The higher the magnification, the narrower the depth of the focal plane; thus, observing swimming organisms requires a trade-off between magnification and depth of field.
Thought Question
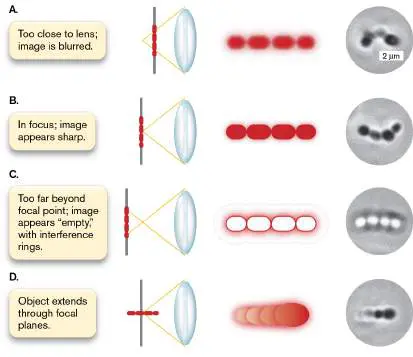
2.5 Under starvation, a soil bacterium such as Bacillus subtilis packages its cytoplasm into a spore, leaving behind an empty cell wall. Suppose, under a microscope, you observe what appears to be a hollow cell. How can you tell whether the cell is indeed hollow or is simply out of focus?
Phase-Contrast Microscopy
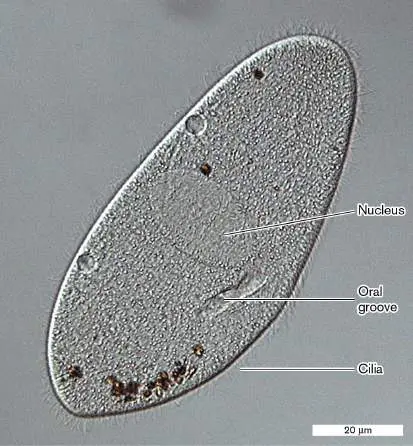
Living microbes are challenging to visualize because their watery cytoplasm is often clear, like the medium they inhabit. One way to increase contrast for living cells is phase-contrast microscopy (PCM). Phase contrast exploits differences in refractive index between the cytoplasm and the surrounding medium or between different organelles. Figure 2.18shows a paramecium, a ciliated protist found in pond water. Under phase contrast, the cell outlines appear dark because light passes entirely through the cell envelope, whose refractive index is higher than that of cytoplasm. Differences in refractive index reveal the shape of organelles such as the nucleus, oral groove (mouth), and cilia (whiplike structures for motility). FIGURE 2.18 ■ Phase-contrast microscopy (PCM) of a paramecium. Differences in refractive index reveal the nucleus, oral groove, and cilia.
SCIENCE PHOTO LIBRARY/ALAMY STOCK PHOTO
Phase-contrast optics depends on the principle of interference (introduced in Section 2.2). In interference, two wavefronts (or two portions of a wavefront) interact with each other by addition (amplitudes in phase) or subtraction (amplitudes out of phase; Fig. 2.19). The result of interference between two waves is a pattern of
alternating zones of constructive and destructive interference (brightness and darkness).
The optical system for phase contrast was invented in the 1930s by the Dutch microscopist Frits Zernike (1888–1966), for which he earned the 1953 Nobel Prize in Physics. In this system, slight differences in the refractive index of the various cell components are transformed into differences in the intensity of transmitted light. Zernike’s scheme makes use of the fact that living cells have relatively high contrast because of their high concentration of solutes. Given the size and refractive index of commonly observed cells, light is retarded by approximately one-quarter of a wavelength when it passes through the cell. In other words, after passing through a cell, light exits the cell about one-quarter of a wavelength behind the phase of light transmitted directly through the medium. The Zernike optical system is designed to retard the refracted light by an additional quarter of a wavelength, so that the light refracted through the cell is slowed by a total of half a wavelength compared with the light transmitted through the medium. When two waves are out of phase by half a wavelength, they produce destructive interference, canceling each other’s amplitude (Fig. 2.19B ). The result is a region of darkness in the image of the specimen.
FIGURE 2.19 ■ Phase interference. A. In constructive interference, the peaks of the two wave trains rise together; their amplitudes are additive (A 1 + A 2), forming a wave of greater total amplitude (A T). B. In destructive interference, the peaks of the waves are opposite one another, so their amplitudes cancel (A 1 − A 2), forming a wave of lesser amplitude.
In phase-contrast microscopy, the light transmitted through the medium needs to be separated from the light interacting with the object, where it is slowed by refraction. The transmitted light is separated by a ring-shaped slit (annular ring). The annular ring generates a hollow cone of light, which is focused through the specimen and generates an inverted cone above it (Fig. 2.20). Light passing through the specimen, however, is refracted and thus bent into the central region within the inverted cone.
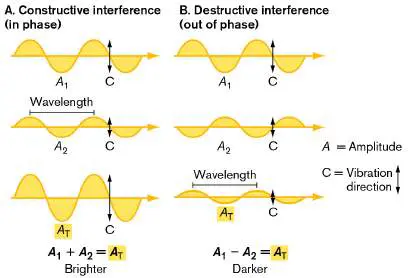
FIGURE 2.20 ■ Phase-contrast optics. A. The specimen retards light by approximately one-quarter of a wavelength. The phase plate contains a central disk of refractive material that retards light from the specimen by another quarter wavelength, increasing the phase difference to half a wavelength. The light from the specimen and the transmitted light are now fully out of phase; they cancel, making the specimen appear dark. B. In the phase-contrast microscope, the annular ring forms a hollow cone of light that passes through the refractive material of the specimen. When the transmitted and refracted light cones re-join at the focal point, they are out of phase; their amplitudes cancel each other, and that region of the image appears dark against a bright background.
Both the refracted light from the specimen and the outer cone of transmitted light enter the phase plate. The phase plate consists of refractive material that is thinner in the region met by the outer (transmitted) light cone. The refracted light passing through the center of the phase plate is retarded by an additional one-quarter
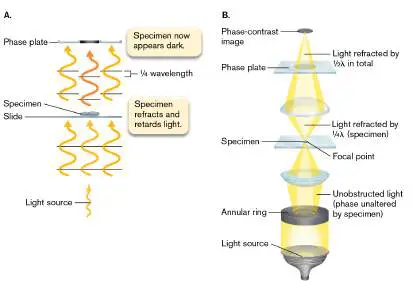
wavelength compared with the transmitted light passing through the thinner region on the outside; the overall difference approximates half a wavelength. When the light from the inner and outer regions focuses at the ocular lens, the amplitudes of the waves cancel and produce a region of darkness. In this system, small differences in refractive index can produce dramatic differences in contrast between the offset phases of light.
Other optical systems exploit the properties of light in different ways. Differential interference contrast microscopy (DIC) with Nomarski optics superimposes interference bands on an image, accentuating small differences in refractive index. A different system, dark-field microscopy, makes use of light scattering (Fig. 2.9D). In dark-field microscopy, only the light rays scattered by an object reach the observer, whereas light rays direct from the source are bent aside. The bright object is viewed against a dark background.
To Summarize
In bright-field microscopy, image quality depends on the wavelength of light; on the magnifying power of a lens; and on the position of the focal plane, the region where the specimen is in focus (that is, where the sharpest image is obtained).
A compound microscope achieves magnification and resolution through the objective and ocular lenses.
A wet mount specimen contains living microbes.
Phase-contrast microscopy with Zernike optics superimposes refracted light and transmitted light shifted out of phase so as to reveal differences in refractive index as patterns of light and dark. Live cells with transparent cytoplasm, and the organelles of eukaryotes, can be observed with high contrast.
High refractive index of the specimen causes light to bend and pass through the highly refractive phase plate. Retarded phase partly cancels the phase of transmitted light, generating a dark edge with high contrast.
Glossary
bright-field microscopy A type of light microscopy in which the specimen absorbs light and appears dark against a light background.
aberration An imperfection in a lens.
objective lens In a compound microscope, the lens that is closest to the specimen and generates the initial magnification.
angle of aperture The width of a light cone (theta, θ) that projects from the midline of a lens. Greater angles of aperture increase resolution. numerical aperture The product of the refractive index of the medium and sin θ (where θ is the angle of aperture). As numerical aperture increases, the magnification increases.
immersion oil An oil with a refractive index similar to glass that minimizes light-ray loss at wide angles, thereby minimizing wavefront interference and maximizing resolution.
compound microscope A microscope with multiple lenses to compensate for lens aberration and increase magnification.
condenser In a microscope, a lens that focuses parallel light rays from the light source onto a small area of the specimen to improve the resolution of the objective lens.
ocular lens In a compound microscope, the lens situated closest to the observer’s eye; part of the eyepiece.
total magnification The magnification of the ocular lens multiplied by the magnification of the objective lens.
parfocal In a microscope with multiple objective lenses, having the objective lenses set at different heights that maintain focus when switching among lenses.
depth of field In a microscope, a region of the optical column over which a specimen appears in focus.
wet mount A technique to view living microbes with a microscope by placing the microbes in water on a slide under a coverslip. phase-contrast microscopy (PCM)
Observation of a microscopic object based on the differences in the refractive index between cell components and the surrounding medium. Contrast is generated as the difference between refracted light and transmitted light shifts out of phase.
Fig. 2.6A: FIGURE 2.6 ■ Common shapes of bacteria. A, C, E. The shapes of most bacterial cells can be discerned with light microscopy (LM), but their subcellular structures and
surface details cannot be seen. B, D, F. Surface detail is revealed by scanning electron microscopy (SEM). These SEM images are colorized to enhance clarity.
DR. A. M. SIEGELMAN/VISUALS UNLIMITED, INC.
DENNIS KUNKEL MICROSCOPY/SCIENCE SOURCE
MICHAEL ABBEY/VISUALS UNLIMITED
DENNIS KUNKEL MICROSCOPY/SCIENCE SOURCE
DR. A. M. SIEGELMAN/VISUALS UNLIMITED, INC.
DENNIS KUNKEL MICROSCOPY/SCIENCE SOURCE
Fig. 2.6C: FIGURE 2.6 ■ Common shapes of bacteria. A, C, E. The shapes of most bacterial cells can be discerned with light microscopy (LM), but their subcellular structures and
surface details cannot be seen. B, D, F. Surface detail is revealed by scanning electron microscopy (SEM). These SEM images are colorized to enhance clarity.
DR. A. M. SIEGELMAN/VISUALS UNLIMITED, INC.
DENNIS KUNKEL MICROSCOPY/SCIENCE SOURCE
MICHAEL ABBEY/VISUALS UNLIMITED
DENNIS KUNKEL MICROSCOPY/SCIENCE SOURCE
DR. A. M. SIEGELMAN/VISUALS UNLIMITED, INC.
DENNIS KUNKEL MICROSCOPY/SCIENCE SOURCE
Fig. 2.6E: FIGURE 2.6 ■ Common shapes of bacteria. A, C, E. The shapes of most bacterial cells can be discerned with light microscopy (LM), but their subcellular structures and
surface details cannot be seen. B, D, F. Surface detail is revealed by scanning electron microscopy (SEM). These SEM images are colorized to enhance clarity.
DR. A. M. SIEGELMAN/VISUALS UNLIMITED, INC.
DENNIS KUNKEL MICROSCOPY/SCIENCE SOURCE
MICHAEL ABBEY/VISUALS UNLIMITED
DENNIS KUNKEL MICROSCOPY/SCIENCE SOURCE
DR. A. M. SIEGELMAN/VISUALS UNLIMITED, INC.
DENNIS KUNKEL MICROSCOPY/SCIENCE SOURCE
Fig. 2.12: FIGURE 2.12 ■ Interference of light waves at the focal point generates concentric rings surrounding the peak intensity. A. Broad wavefronts generate narrow
interference rings with peaks well resolved. B. Narrow wavefronts generate wide interference rings that are unresolved.
Fig. 2.13: FIGURE 2.13 ■ Numerical aperture and resolution. The numerical aperture (NA) equals the refractive index (n) of the medium (air) containing the light cone, multiplied by the sine of the angle (θ) of the light cone. Higher NA allows greater resolution.
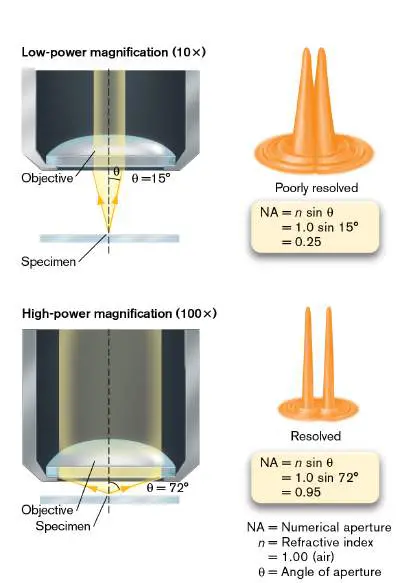
Figure 2.11: FIGURE 2.11 ■ A lens magnifies an image. The object is placed near the focal point (F) in front of the lens. The lens bends and spreads the light rays.
Fig. 2.9D:
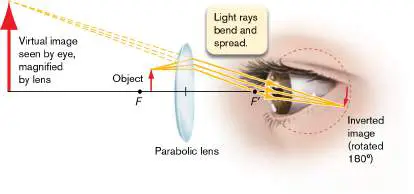
FIGURE 2.9 ■ Interaction of light with matter. Fig. 2.3B:
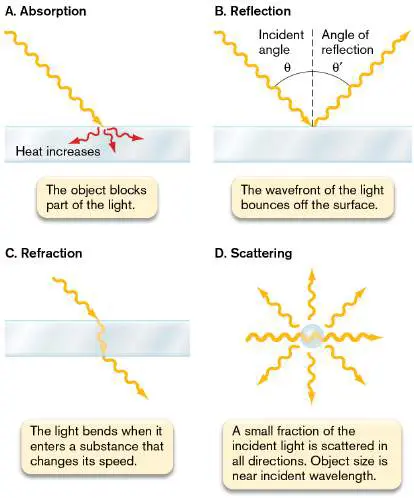
FIGURE 2.3 ■ Detecting and resolving bacteria. A. A tube of bacterial culture, Rhodospirillum rubrum. The presence of bacteria is detected, though individual cells are not resolved. B. Individual cells of Oenococcus oeni are resolved by light microscopy.
JOAN SLONCZEWSKI, KENYON COLLEGE
C. M. LUCY JOSEPH, UC DAVIS DEPT. OF VITICULTURE AND ENOLOGY WINE
YEAST AND BACTERIA COLLECTION
2.4 Fixation and Staining for Bright-Field MicroscopyUnit 1 · Methods
For bright-field microscopy, we can increase detection and resolution by fixation and staining. Fixation and staining are procedures that usually kill the cell. Fixation is a process by which cells are made to adhere to a slide in a fixed position. We can fix cells with methanol or by heat treatment to denature the cell’s proteins, whose exposed side chains then adhere to the glass. Staining is the use of a molecule that absorbs much of the incident light, usually over a wavelength range that results in a distinctive color (Fig. 2.21). The use of chemical stains was developed in the nineteenth century, when German chemists used organic synthesis to invent new coloring agents for clothing. Clothing was made of natural fibers such as cotton or wool, so a substance that dyed clothing would be likely to react with biological specimens.
How do stains work? Most stain molecules contain conjugated double bonds or aromatic rings that absorb visible light (Fig. 2.21). Stains also have positively charged groups that bind cell-surface components with negative charge, such as the phosphoryl groups of membrane phospholipids (discussed in Section 3.2). Different stains vary with respect to the strength of their binding and the degree of binding to different parts of a cell.
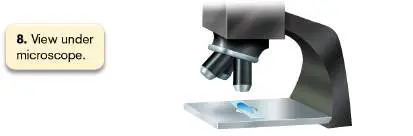
FIGURE 2.21 ■ Chemical structure of stains. Methylene blue and crystal violet are cationic (positively charged) dyes. Simple stains. A simple stain adds dark color specifically to cells, but not to the external medium or surrounding tissue (in the case of pathological samples). The most commonly used simple stain is methylene blue (see Fig. 2.6E), originally used by Robert Koch in the nineteenth century to stain bacteria. A typical procedure for fixation and staining is shown in Figure 2.22. First we fix a drop of culture on a slide by treating it with methanol or by heating it on a slide warmer (steps 1–4 in the figure). Either of these treatments denatures cell proteins, exposing side chains that bind to the glass. We then flood the slide with methylene blue solution (step 5). The positively charged molecule binds to the negatively charged cell envelope of fixed bacteria. After excess stain is washed off and the slide has been dried, we observe it under high-power magnification using immersion oil (steps 6–8).
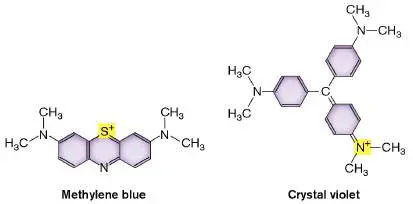
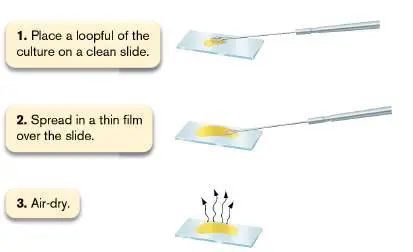

FIGURE 2.22 ■ Procedure for simple staining with methylene blue.
Differential stains. A differential stain colors one kind of cell but not another. The most famous differential stain is the Gram stain,


devised in 1884 by the Danish physician Hans Christian Gram (1853– 1938). Gram first used this stain to distinguish pneumococcal bacteria (Streptococcus pneumoniae) from human lung tissue. In Figure 2.23A, Gram-stained S. pneumoniae bacteria appear dark purple among unstained white blood cells. Other species of bacteria, such as Proteus mirabilis (a cause of urinary infections), fail to retain the purple stain (Fig. 2.23B ). Different bacterial species are classified as Gram-positive or Gram-negative, depending on whether they retain the stain. Members of the phylum Proteobacteria (Pseudomonadota) stain Gram-negative, whereas most of the Firmicutes (Bacillota) stain Gram-positive. Other taxa may stain Gram-negative or Gram-variable.
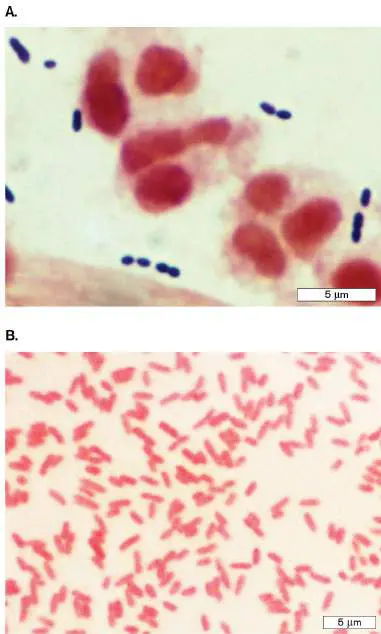
FIGURE 2.23 ■ Gram staining of bacteria. A. Gram stain of a sputum specimen from a patient with pneumonia, containing Gram-positive Streptococcus pneumoniae (purple diplococci)
among white blood cells in pus. The white blood cell nuclei stain pink (counterstain). B. Gram-negative Proteus mirabilis (pink rods).
CDC/DR. MIKE MILLER
CDC/SCIENCE SOURCE
In the Gram stain procedure (Fig. 2.24A), a dye such as crystal violet binds to the bacteria; it also binds to the surface of human cells, but less strongly. After the excess stain is washed off, we apply a mordant, or binding agent. The mordant used is iodine solution, which contains iodide ions (I −). The iodide complexes with the positively charged crystal violet molecules trapped inside the cells (step 3 in the figure). The crystal violet–iodide complex is now held more strongly within the cell wall. The thicker the cell wall, the more crystal violet–iodide molecules are held.
Next we add a decolorizer, ethanol, for a precise time interval (typically 10 seconds). The decolorizer removes loosely bound crystal violet–iodide, but Gram-positive cells retain the stain tightly (Fig. 2.24A, step 4). The Gram-positive cells that retain the stain appear dark purple, while the Gram-negative cells are colorless. Timing the decolorizer step is critical because if it lasts too long, the Gram-positive cells, too, will release their crystal violet stain. In the final step, a counterstain, safranin, is applied (step 5). This process allows the visualization of Gram-negative material, which is stained pale pink by the safranin. Gram-positive cells also retain safranin; thus, if the cells are decolorized too long, both Gram-positive and Gram-negative cells will appear pink because of the safranin.
How does the Gram stain distinguish different cell types? Most Gram-negative species of bacteria possess a cell wall that is thinner and more porous than that of Gram-positive species (discussed in Chapter 3). A Gram-negative cell wall has only one to three layers of peptidoglycan (sugar chains cross-linked by peptides), whereas a Gram-positive cell has five or more layers (Fig. 2.24B ). The multiple layers of peptidoglycan retain enough stain complex that the cell appears purple.
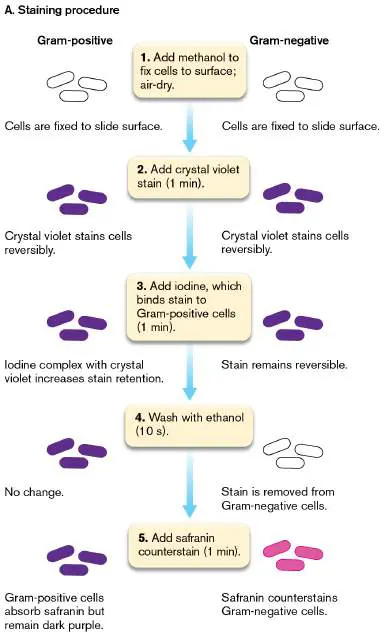
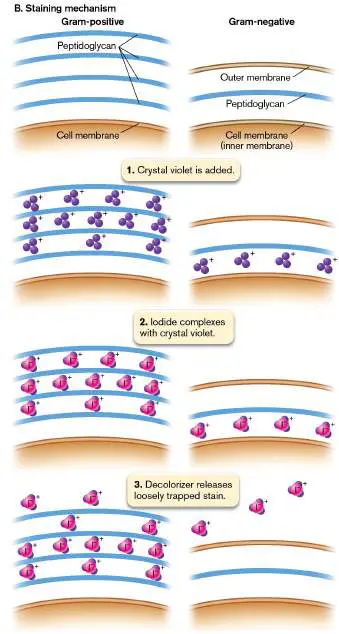
FIGURE 2.24 ■ The Gram stain. A. Gram-positive cells have thick cell walls that retain the crystal violet stain. Gram-negative cells have thinner cell walls, which lose the crystal violet stain but are counterstained by safranin. B. In a Gram-positive cell, multiple layers of cell-wall peptidoglycan retain the crystal violet– iodide complex. In a Gram-negative cell, the stain leaks out. The Gram stain became a key tool for identifying pathogens in the clinical laboratory. As we’ll see in Chapter 3, the Gram stain effectively distinguishes Proteobacteria (a diverse group of Gram-negative bacteria with a thin cell wall and an outer membrane) from Firmicutes (Gram-positive bacteria with a thick cell wall and no outer membrane). Proteobacteria include Escherichia coli and many related intestinal bacteria. Another phylum that stains Gram-negative is Bacteroidetes (Bacteroidota), which work with Proteobacteria to digest our food (discussed in Chapters 13 and 21).
Our colon also contains Gram-positive Firmicutes such as species of Clostridium and Enterococcus. Most intestinal bacteria are mutualists; that is, they share positive contributions with their host (the human body). However, the gut community may be invaded by deadly pathogens, such as the pathogenic Escherichia coli strain O157:H7 or the Gram-positive Enterococcus faecalis and Clostridioides difficile.
Still other groups of bacteria and archaea have different kinds of cell walls that may stain Gram-positive, Gram-negative, or variable (discussed in Chapters 18 and 19). Moreover, even Firmicutes such as Bacillus species show variable stain results depending on their growth state and environmental conditions.
Other differential stains reveal components specific to certain classes of bacteria (Fig. 2.25):
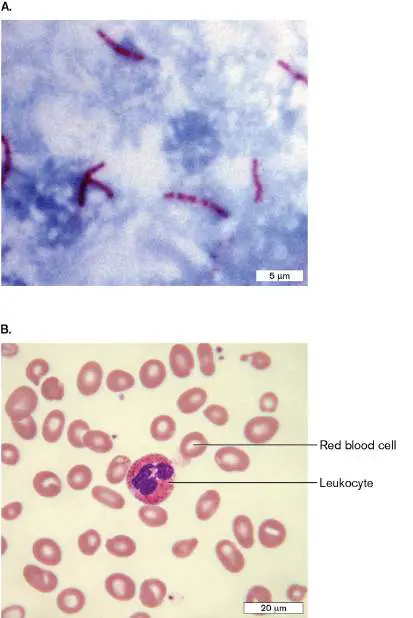
FIGURE 2.25 ■ Differential stains. A. Acid-fast stain of Mycobacterium tuberculosis (red) in sputum. B. Giemsa stain of human blood film.
CDC/DR. GEORGE P. KUBICA
NATURE’S FACES/SCIENCE SOURCE
Acid-fast stain (Ziehl-Neelsen). Carbolfuchsin specifically stains mycolic acids of Mycobacterium tuberculosis and M. leprae, the causative agents of tuberculosis and leprosy, respectively (Fig. 2.25A).
Giemsa stain for blood film. A mixture of methylene blue, eosin (pink, protein-binding), and Azure B (blue) is used to stain blood cells and associated parasites. Figure 2.25B shows red blood cells appearing pink, and a monocyte and a leukocyte whose nuclei stain purple.
Negative stain. A negative stain is a suspension of opaque particles such as India ink added to darken the surrounding medium and reveal transparent components such as the outer capsule of a pathogen (presented in Chapter 3). Other kinds of negative stains are used for electron microscopy (see Section 2.6 ).
Antibody stains. Stains linked to antibodies can identify precise strains of bacteria or even specific molecular components of cells. The antibody binds a specific cell protein. The antibody may be “conjugated” (attached) to a reactive enzyme for detection or to a fluorophore (fluorescent molecule) for immunofluorescence microscopy. Fluorescence microscopy is discussed next, in Section 2.5.
To Summarize
Fixing and staining a specimen kills it but improves contrast and resolution.
A differential stain colors one kind of cell but not another. The Gram stain differentiates between two major bacterial taxa, which stain either Gram-positive (Firmicutes) or Gram-negative (Proteobacteria). Human tissues stain Gram-negative. Other bacteria and archaea may stain Gram-negative or Gram-variable.
Giemsa stain distinguishes different kinds of blood cells and parasites.
Antibody stains detect a very specific cell type or component. The antibody is conjugated to an enzyme or a fluorophore.
Glossary
fixation The adherence of cells to a slide by a chemical or heat treatment.
staining The process of treating microscopic specimens with a stain to enhance their detection or to visualize specific cell components. simple stain A stain that makes an object more opaque, increasing its contrast with the external medium or surrounding tissue. differential stain A stain that differentiates among objects by staining only particular types of cells or specific subcellular structures. Gram stain A differential stain that distinguishes cells that possess a thick cell wall and retain a positively charged stain (Gram-positive) from cells that have a thin cell wall and outer membrane and fail to retain the stain (Gram-negative).
mordant A chemical binding agent that causes specimens to retain stains better.
Gram-positive Describing cells that retain the Gram stain and appear dark purple after staining.
Gram-negative Describing cells that do not retain the Gram stain.
counterstain A secondary stain used to visualize cells that do not retain the first stain.
acid-fast stain A diagnostic stain for mycobacteria, which retain the dye fuchsin because of mycolic acids in the cell wall.
negative stain A stain that colors the background and leaves the specimen unstained.
Fig. 2.6E: FIGURE 2.6 ■ Common shapes of bacteria. A, C, E. The shapes of most bacterial cells can be discerned with light microscopy (LM), but their subcellular structures and surface
details cannot be seen. B, D, F. Surface detail is revealed by scanning electron microscopy (SEM). These SEM images are colorized to enhance clarity.
DR. A. M. SIEGELMAN/VISUALS UNLIMITED, INC.
DENNIS KUNKEL MICROSCOPY/SCIENCE SOURCE
MICHAEL ABBEY/VISUALS UNLIMITED
DENNIS KUNKEL MICROSCOPY/SCIENCE SOURCE
DR. A. M. SIEGELMAN/VISUALS UNLIMITED, INC.
DENNIS KUNKEL MICROSCOPY/SCIENCE SOURCE
2.5 Fluorescence Microscopy, FISH, and Chemical Imaging MicroscopyUnit 1 · Methods
Fluorescence microscopy (also called epifluorescence microscopy) is a powerful tool for identifying specific kinds of microbes, such as pathogens or members of environmental communities. Fluorescence also reveals specific cell parts at work, such as division proteins in the act of accomplishing cell fission. The profound importance of fluorescence for microbial discovery was acknowledged by the awarding of the 2008 Nobel Prize in Chemistry to Osamu Shimomura, Martin Chalfie, and Roger Tsien for the discovery and development of green fluorescent protein (GFP). Fluorescence microscopy can now be coupled to new tools of chemical imaging, which reveals the actual chemistry of cell parts under microscopy.
What Is Fluorescence?
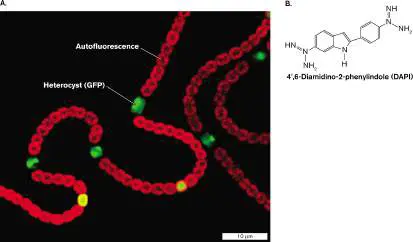
In fluorescence microscopy, the specimen absorbs light of a defined wavelength and then emits light of lower energy, hence longer wavelength; thus, the specimen is said to “fluoresce.” Some microbes, such as cyanobacteria and algae, fluoresce on their own (autofluorescence), owing to endogenous fluorescent molecules such as chlorophyll. Chlorophyll autofluorescence has important applications in environmental monitoring of algae and cyanobacteria. For other aims, specific parts of the cell are labeled with a fluorophore, a fluorescent dye or protein. In Figure 2.26A, cells of the cyanobacterium Nostoc sp. PCC 7120 (formerly Anabaena sp. PCC 7120) show autofluorescence (red) arising from their chlorophyll. Every tenth cell or so, however, develops as a nitrogen-fixing heterocyst that lacks chlorophyll. In the sample shown, the bacteria are engineered such that heterocysts express a nitrogen-stress gene fused to a gene that encodes GFP. (We’ll discuss this technique shortly.) Thus, the two different colors of fluorescence distinguish between the cyanobacterial cells conducting photosynthesis and the heterocysts conducting nitrogen fixation. Fluorescence microscopy is also used by marine ecologists to reveal tiny bacteria and plankton growing in seawater, a highly dilute natural environment (discussed in Chapter 21). Such observations support the study of microbial responses to climate change. Microbes, including viruses, bacteria, and protists, are detected by fluorescence of DNA-specific stains such as DAPI (4′, 6-diamidino-2-phenylindole; Fig. 2.26B ). The advantage of DAPI fluorescent stain is that it detects only cells whose DNA is intact, distinguishing them from environmental debris.
FIGURE 2.26 ■ Fluorescence microscopy. A. Cyanobacteria show chlorophyll-based autofluorescence (red) and fluorescence from heterocysts (green) expressing a nitrogen-stress gene fused to GFP. B. The molecule DAPI is used as a fluorescent stain that specifically labels DNA.
ALICIA M. MURO-PASTOR
Excitation and Emission
How and when does a molecule fluoresce? Fluorescence occurs when a molecule absorbs light of a specific wavelength (the excitation wavelength) that has just the right energy needed to raise an electron to a higher-energy orbital (Fig. 2.27). Because this higher-energy electron state is unstable, the electron decays to an orbital of slightly lower energy, while losing some energy as heat. The electron then falls to its original level by emitting a photon of less energy and longer wavelength (the emission wavelength). The emitted photon has a longer wavelength (less energy) because part of the electron’s energy of absorption was lost as heat.
FIGURE 2.27 ■ Fluorescence. Energy gained from UV absorption is released as heat and as a photon of longer
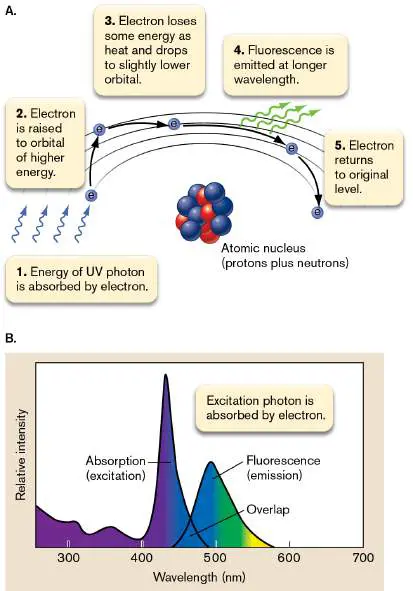
wavelength in the visible region. A. Fluorescence on the molecular level. B. Comparison of absorption and emission spectra for a fluorophore.
The optical system for fluorescence microscopy uses filters to limit the source light to the wavelength range of excitation and the specimen’s emitted light to the wavelength range of emission (Fig. 2.28). The wavelengths of excitation and emission are determined by the choice of fluorophore; in Figure 2.28we show excitation light as green and emission as red. Because only a small portion of the spectrum is used, fluorescence requires a high-intensity light source such as a tungsten arc lamp. The light passes through a filter that screens out all but the peak wavelengths of excitation. The excitation light (green) is then reflected by a dichroic mirror (dichroic filter), a material that reflects light below a certain wavelength but transmits light above that wavelength.
FIGURE 2.28 ■ Fluorescence microscopy. A. The light path of a fluorescence microscope separates the excitation beam from light emitted by the specimen. B. Diagram of a fluorescence microscope.
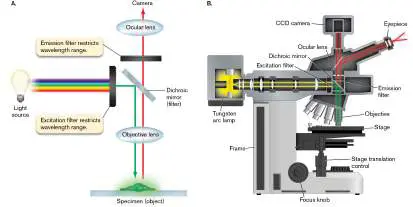
The reflected green light enters the objective lens, which focuses it onto the specimen, where it excites fluorophores to fluoresce red. The fluorescence emanates in all directions from the specimen, like a point source. Because the light rays point in all directions, a small portion of the emitted light (red) returns through the objective lens to reach the dichroic mirror. The red light now has a longer wavelength, above the penetration limit of the mirror, so it continues through to the ocular lens. The ocular lens focuses the emitted light onto the photodetectors of a digital camera.
Fluorescence can be observed in live organisms. The fluorescent organisms are commonly held in place on the slide; for example, by a pad of agarose gel.
Fluorophores for Labeling
What determines the properties of a fluorophore? The molecular structure of each fluorophore determines its peak wavelengths of excitation and emission, as well as its binding properties. For example, the aromatic rings of DAPI mimic a base pair, enabling intercalation between base pairs of DNA. DAPI absorbs in the UV spectrum and emits in the blue range. Note, however, that the computer driving the optical system can convert the fluorescence signal to any color chosen by the microscopist.
The cell specificity of the fluorophore can be determined by: Chemical affinity. Certain fluorophores have chemical affinity for certain classes of biological molecules. For example, the fluorophore FM4-64 (green excitation, red emission) specifically binds membranes.
Labeled antibodies. Antibodies that specifically bind a cell component are covalently attached to a fluorophore, forming a “conjugated antibody.” The use of fluorophore-conjugated antibodies is known as immunofluorescence.
DNA hybridization. A short sequence of DNA attached to a fluorophore will hybridize to a specific sequence in the genome. Thus we can label one position in the chromosome.
Gene fusion reporter. Cells can be engineered with a gene fusion, a fused gene that expresses a bacterial protein combined with either GFP or one of many GFP variants expressing different colors (Fig. 2.29).
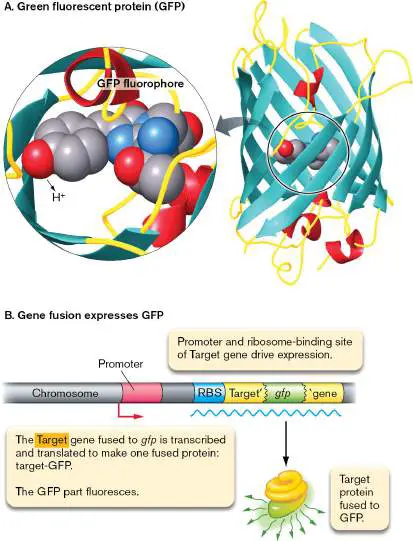
FIGURE 2.29 ■ The fluorophore green fluorescent protein (GFP). A. Green fluorescent protein (GFP) is expressed endogenously by the cell. Blowup: Three GFP amino acid residues (serine, tyrosine, and glycine) condense to form the fluorophore. B. The gene encoding GFP can be fused to a target gene (Target′- gfp). The fused gene then expresses a fused protein in which the GFP portion fluoresces. The fluorescent protein is expressed under control of the target gene promoter and ribosome-binding site (RBS).
Originally isolated from a jellyfish (Aequorea victoria), the Nobel Prize–winning GFP can be expressed from a gene spliced into the DNA of any organism; even monkeys have been engineered to glow green. How does GFP act as a fluorophore? The fluorophore part of GFP consists of three amino acid residues that react to form an aromatic ring structure, embedded within a beta barrel protein tube. The properties of the fluorophore are modified by the surrounding protein, so mutation of the gene encoding GFP generates numerous variants with different spectral ranges.
Remarkably, GFP and related fluorescent proteins can be modified as markers of specific target proteins of interest in a cell. This modification is called a gene fusion (Fig. 2.29). A gene fusion consists of a target gene fused to a gene encoding GFP, which gets expressed via the target control sequences and translated by ribosomes using the target ribosome-binding site (RBS). The fused protein can fluoresce as a marker pinpointing the position of the target protein within the cell (Fig. 2.29B ). The target protein function may be surprisingly normal, despite the fused GFP. The wide range of colors of GFP variants provides an extraordinary set of probes for the internal structure of a cell. For example, different fluorophores label specific molecules during DNA replication within a growing cell of Bacillus subtilis (Fig. 2.30B ). The red color arises from the membrane-specific fluorophore FM4-64. The DNA origin of replication is labeled blue by cyan fluorescent protein (CFP), a color variant of GFP. The gene encoding CFP is fused to a gene encoding a DNA-binding protein specific to the B. subtilis origin of replication. The replisomes (DNA polymerases) are labeled yellow, owing to a fused gene encoding yellow fluorescent protein (YFP). The replisomes usually locate together near the center of the cell, but sometimes they separate and are visible as two yellow spots. Another exciting application is that GFP and related protein fluorophores can be engineered to report chemical conditions within a cell. For example, the ionized and protonated forms of GFP (labeled in Fig. 2.29A) have slightly different excitation ranges, thus affording a way to measure hydronium ion concentration (pH) within a cell. This property enables GFP to report on a cell’s response to pH stress. Other GFP sensors are designed to report concentrations of chloride or calcium, second messengers, redox level, or even protease activity.
Thought Question
2.6 What experiment could you devise to determine the order of events in Bacillus subtilis DNA replication?
A concern with the use of GFP fluorescence is that proteins fused to GFP may behave differently from the original nonfused protein. In some cases, the GFP portion causes fusion proteins to form complexes at the cell poles that are absent in non-GFP cells. Thus, in cellular biology it is always important to confirm data with the results of a different kind of technique; for example, localization of the target protein with a labeled antibody.
Note also in Figure 2.30B that the labeled membranes and DNA origin appear diffuse; that is, unresolved. The emitted light travels in all directions from the point source of the object, and its resolution is limited by the wavelength. Thus, fluorescence cannot resolve the detailed shape of a protein or distinguish two proteins that are close together. But we can detect the location of a DNA-binding protein within a cell and resolve it as distinct from another fluorescent object located elsewhere. Furthermore, computational techniques called super-resolution imaging enable us to pinpoint the protein’s location with a precision tenfold greater than the resolution of ordinary optical microscopy.
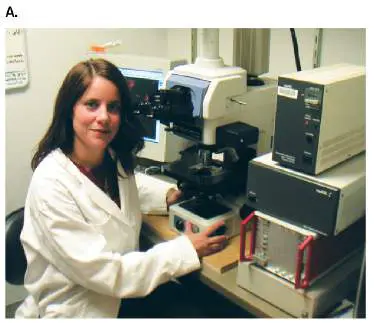
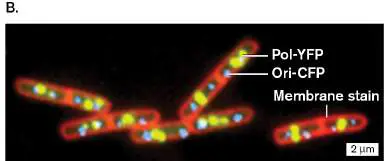
FIGURE 2.30 ■ The replisome and the DNA origin of replication. A. Melanie Berkmen, working in the laboratory of Alan Grossman, obtains the fluorescence micrograph shown in panel B. B. Fluorescence microscopy reveals the DNA origin, labeled blue by a protein fused to cyan fluorescent protein, binding at a sequence near the origin (Ori-CFP). Replisomes are labeled yellow by fusion of a DNA polymerase subunit to yellow fluorescent protein (Pol-YFP) in dividing cells of Bacillus subtilis.
COURTESY OF MELANIE BERKMEN, MIT
COURTESY OF MELANIE BERKMEN, MIT
Super-Resolution Imaging
Cell function requires the interaction of key single molecules, such as the chromosomal DNA with a protein binding its origin. William Moerner at Stanford University was the first to demonstrate the possibility of single-molecule tracking of fluorescent proteins in bacteria (Fig. 2.31). The 2014 Nobel Prize in Chemistry honored Eric Betzig, Stefan Hell, and William Moerner for the development of super-resolved fluorescence microscopy, or super-resolution imaging.
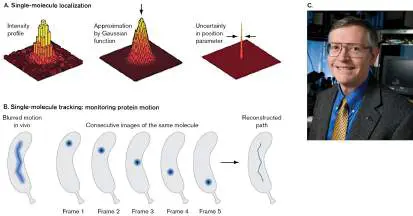
FIGURE 2.31 ■ Single-molecule localization by computation: a form of super-resolution imaging. A. The uncertainty of the central peak position. B. Tracking a single molecule in a cell. C. William Moerner was the first to demonstrate the possibility of single-molecule tracking of fluorescent proteins in bacteria.
ANDREAS GAHLMANN AND WILLIAM MOERNER. 2014. NAT. REV. MICROBIOL. 12 :9
LINDA A. CICERO/STANFORD NEWS
How can we track a single molecule, which is far smaller than the resolution limit of light (λ/2 = 200 nm)? Recall the shape of the magnified image of a point source of light (Fig. 2.12). Upon magnification, each image of a point source appears as a peak intensity surrounded by rings of much lower intensity. The sharpness of the main peak is limited by the wavelength of light. But the precision with which we know the peak’s central position is much narrower (Fig. 2.31A). In other words, the uncertainty of the central peak position is about a tenth the width of the intensity profile. Computation based on the intensity profile can reveal the peak positions with high precision. The peak positions show how individual proteins move within a living cell (Fig. 2.31B ). In an early application of super-resolution imaging, Moerner worked with Lucy Shapiro at Stanford University to track the movement of DNA-binding proteins during cell fission of Caulobacter crescentus (Fig. 2.32). Shapiro received the National Medal of Science from President Obama in 2013 for her studies of the intriguing developmental cycle of this bacterium, which involves a transition between stalked and flagellar cells (presented in Chapter 3 ). Moerner, Shapiro, and their students used super-resolution imaging to track the migration of the ParA cell fission protein (Fig. 2.32A and B ). In this experiment, the gene encoding ParA is fused to a gene for yellow fluorescent protein (YFP), whereas the gene encoding ParB is fused to a gene for cyan fluorescent protein (CFP). The ParA protein migrates clear across the cell, generating a spindle-like track to guide the ParB protein as it pulls the newly replicated DNA origin from one pole to the opposite pole. Many similar intracellular mechanisms are explored in Chapter 3.
FIGURE 2.32 ■ Super-resolution imaging reveals movement of origin-binding proteins across a cell. A.
Super-resolution imaging reveals the migration of the ParA cell fission protein across the cell of Caulobacter crescentus. The gene encoding ParA is fused to a gene encoding YFP, and the gene encoding ParB is fused to a gene encoding CFP. B. The ParA protein migrates clear across the cell, generating a track to guide the ParB protein as it pulls the newly replicated DNA origin across from one pole to the opposite pole. The arrow indicates movement. C. Lucy Shapiro, winner of the National Medal of Science in 2013.
JEROD L. PTACIN ET AL. 2010. NAT. CELL BIOL. 12 :791
LUCY SHAPIRO
Some advanced forms of fluorescence microscopy use laser beams to resolve subcellular details, and even to visualize cells in 3D. One such method is confocal laser scanning microscopy (or confocal microscopy ). In confocal microscopy, a microscopic laser light source scans across the specimen. Figure 2.33shows a biofilm composed of the pathogenic bacterium Pseudomonas aeruginosa
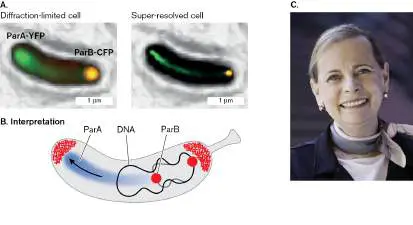
treated with the antibiotic tobramycin. The biofilm is treated with fluorophores that reveal live cells (green) beneath the dead cells killed by tobramycin (red). The hidden live cells cause problems for medical therapy. Confocal microscopy enables us to visualize the 3D structure of the biofilm. The method of confocal microscopy is explained in eAppendix 3.
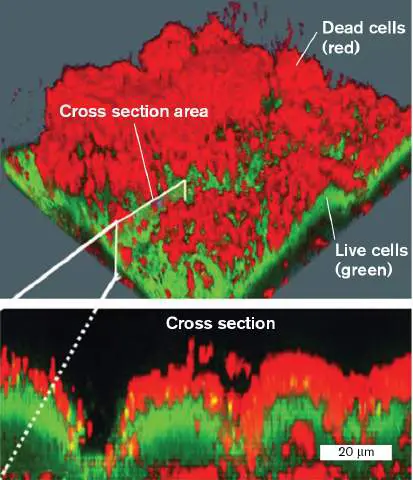
FIGURE 2.33 ■ Biofilm with live/dead fluorophore, observed by confocal laser scanning microscopy.
Pseudomonas aeruginosa cells growing in a biofilm treated with the antibiotic tobramycin. Dead cells fluoresce red; live cells fluoresce green.
MORTEN HENTZER AND MICHAEL GIVSKOV. 2003. J. CLIN. INVEST. 112 :1300
Confocal imaging can be used for 3D imaging of pathogens embedded within host cells or tissue. We saw an example in the chapter-opening image, where infective Salmonella cells were observed within intracellular vesicles. Another advanced form of fluorescence imaging involves the CLARITY technique. This remarkable method generates optical clarity in background tissue, revealing the spatial distribution of bacteria that colonize a host tissue (see Special Topic 2).
Fluorescence In Situ Hybridization (FISH)
Fluorescent labeling can be used to show the spatial location of microbial taxa. This technique is fluorescence in situ hybridization, or FISH . FISH can map specific taxa of microbes within an environment such as soil or within a host organ such as the human intestinal epithelium.
The FISH technique (Fig. 2.34A) makes use of a fluorophore-labeled oligonucleotide probe (usually a short DNA sequence) that hybridizes to a microbe’s DNA or ribosomal RNA (rRNA). Hybridizing to rRNA increases sensitivity because rRNA is present in approximately 100-fold to 10,000-fold excess over DNA.
In a typical procedure, the cells of a sample are fixed to a slide (Fig. 2.34A, step 1) by a chemical treatment that maintains cell integrity while permeabilizing the cell so that the fluorophore-labeled DNA probe can enter (step 2). Next the fixed cells are incubated in a hybridization buffer containing the probe, at a temperature designed to maximize specificity of binding to the sequence of the desired taxa (step 3). A probe with broad specificity might hybridize to all bacterial rRNA, but not to archaeal or eukaryotic rRNAs. For greater specificity, a probe may have a sequence complementary to a sequence found only in rRNA of a given bacterial taxon. After hybridization and a wash (step 4), the cells containing hybridized probes are observed by fluorescence microscopy (step 5).
SPECIAL TOPIC 2 Biogeography of a Gut Pathogen
What do microbial pathogens really look like within the host organ they infect? The host tissue constitutes a vast geography, where the microbe’s location may determine its ability to cause disease. William DePas (Fig. ST 2.1A ), in the laboratory of Dianne Newman at the California Institute of Technology, combined several state-of-the-art technologies to image the biogeography of pathogens. Ana Hernandez-Gallego (Fig. ST 2.1B ) with Fitnat Yildiz, at UC Santa Cruz, used the method to study virulence factors of the pathogen Vibrio cholerae during infection of the mouse gut.

FIGURE ST 2.1 ■ William DePas and Ana Hernandez-Gallego. DePas developed the MiPACT technique, and Hernandez-Gallego applied it to study the virulence of Vibrio cholerae during mouse infection.
COURTESY OF WILLIAM DEPAS
ANA LUCÍA GALLEGO HERNÁNDEZ

The first technology used is the CLARITY technique, which can render tissues transparent for whole organs. The technique selectively removes the tissue’s lipid components, which are the main cause of opacity. DePas devised MiPACT, a microscale version of CLARITY that allows microscopic visualization of cells within a tissue section (Fig. ST 2.2 ). The mouse cells are labeled blue with DAPI fluorophore bound to nuclear DNA, whereas the bacteria are labeled yellow by a fluorophore attached to a DNA probe that hybridizes to the bacterial chromosome.
FIGURE ST 2.2 ■ MiPACT imaging reveals Vibrio cholerae within the mouse gut epithelium. Mouse intestinal sections were made transparent. DAPI (blue) stains nuclei of villi. Vibrio cholerae (yellow) are identified by the hybridization chain reaction (HCR). Inoculated cells were A. planktonic, see video; B. biofilm, see video. (Panel A:; Panel B:)
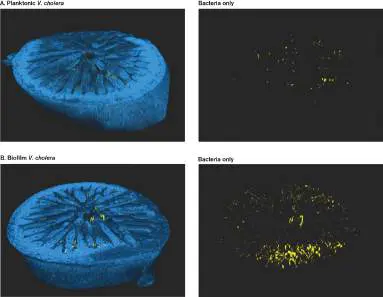
A. L. GALLEGO HERNÁNDEZ. 2020. PROC NATL ACAD SCI USA. 117 :11010–
11017
A. L. GALLEGO HERNÁNDEZ. 2020. PROC NATL ACAD SCI USA. 117 :11010–
11017
A. L. GALLEGO HERNÁNDEZ. 2020. PROC NATL ACAD SCI USA. 117 :11010–
11017
A. L. GALLEGO HERNÁNDEZ. 2020. PROC NATL ACAD SCI USA. 117 :11010–
11017
To render the tissue transparent, the sample is soaked in acrylamide monomers that cross-link with each other and with the protein components of the tissue. The lipid components are then dissolved by sodium dodecyl sulfate (SDS) detergent, the same detergent used for gel electrophoresis. Once the tissue clears, a final solution treatment removes the SDS and adds a preservative chemical. The clarified tissue retains structural proteins as well as DNA. A lysozyme treatment then breaks down bacterial cell walls, enabling the entry of DNA-hybridizing probes. To detect specific types of bacteria, DePas used an advanced version of FISH called the hybridization chain reaction (HCR). In this technique, specific bacteria are detected by hybridization of their RNA with a species-specific DNA probe. The hybridization reaction activates multiple fluorophores, magnifying the signal.
The MiPACT technique reveals the presence of V. cholerae bacteria within the landscape of mouse intestinal villi. Hernandez-Gallego used this technique to compare the colonization ability of V. cholerae from populations that were grown as planktonic (Fig. ST 2.2A ) or as biofilm (Fig. ST 2.2B ). After mouse infection, sections of colon are obtained. The bacteria are visualized by HCR as yellow, whereas the nuclei of intestinal villi are stained blue with DAPI fluorophore; their surrounding cytoplasm is transparent. Individual V. cholerae cells can be counted, revealing that biofilm-grown populations show increased colonization. The movies rotate through each section, showing the distribution of the pathogen. This technique enables us to study the process of infection in unprecedented detail.
RESEARCH QUESTION
How can we use MiPACT imaging to study the mechanism and effectiveness of antibiotic therapies on host infections?
Gallego-Hernandez, A. L., W. H. DePas, J. H. Park, J. K. Teschler, R.
Hartmann, et al. 2020. Upregulation of virulence genes promotes Vibrio cholerae biofilm hyperinfectivity. Proceedings of the National Academy of Sciences USA 117 :11010–11017.
Note: For microbial ecology, FISH usually involves probe
hybridization to ribosomal RNA molecules, whereas for eukaryotic cells the probe is hybridized to a gene on chromosomal DNA. Figure 2.34B shows an example of FISH used to reveal the deep-sea methanotrophic consortium that oxidizes 90% of the methane emitted by methanogens—a major contribution to the global climate (discussed in Chapter 22). The target community consists of a mixed biofilm of anaerobic methane-oxidizing archaea (ANME) and sulfate-reducing bacteria (SRB), obtained from a methane seep located 2 km below sea level at the Guaymas Basin in the Gulf of California. The biofilm was labeled with oligonucleotide fluorescent probes specific for ANME (red) and for SRB (green). FIGURE 2.34 ■ Fluorescence in situ hybridization (FISH) of bacteria and archaea. A. Fluorophore-labeled DNA oligonucleotide hybridizes to a taxon-specific sequence of rRNA molecules within the cells that are fixed and permeabilized on a microscope slide. B. Syntrophy between anaerobic methane-oxidizing archaea (red FISH) and sulfate-reducing bacteria (green FISH) from a deep-sea cold seep at Guaymas Basin in the Gulf of California.
Source: Part A modified from Rudolf Amann and Bernhard M. Fuchs. 2008. Nat. Rev. Microbiol. 6 :339, fig. 1.
P. CRUAUD & A. VIGNERON, IFREMER
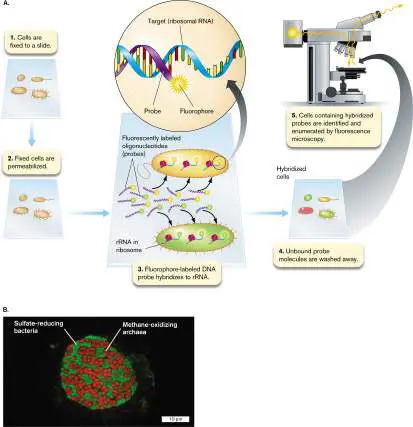
The FISH image shows the two kinds of cells grouped together in a remarkably regular pattern. The ANME, which extract electrons from methane, thereby releasing CO 2, tend to be buried within the sample, surrounded by the SRB. The SRB receive electrons from the ANME and transfer electrons to sulfate, which is reduced to sulfide. Sulfate is a relatively poor electron acceptor (as discussed in Chapter 14), but its high concentration in seawater increases its free-energy contribution (discussed in Chapter 13). The spatial organization of ANME and SRB cells thus facilitates their syntrophy, a form of metabolism in which each partner completes half of a reaction with an overall negative value of Δ G (see Chapter 13). Tight association of the ANME with the sulfate-reducing bacteria enables ANME to transfer electrons from methane directly to the SRB.
Chemical Imaging Microscopy
Chemical imaging uses mass spectrometry (analysis of molecular fragments by mass) to visualize the distribution of chemicals within living cells. The combination of fluorescence and chemical imaging offers extraordinary opportunities to map the structure and function of cells in natural communities, such as soil or the intestinal microbiome.
A high-resolution method for chemical imaging is called nanoscale secondary ion mass spectrometry (NanoSIMS). The NanoSIMS process starts with an ionizing probe, a source of energy that breaks up the large organic molecules of a sample (Fig. 2.35A). The molecular fragments, called “secondary ions,” fly off from the source and are captured by a mass spectrometer. This instrument measures fragment masses of the secondary ions, generating a mass spectrum. Mass spectra are taken from thousands of locations, scanned across a bacterial cell.
For NanoSIMS, the microbial sample is prepared by growth on nutrients labeled with a heavy isotope. For example, the cell’s uptake of nitrogen-rich protein can be detected by incorporation of the heavy isotope 15 N. The increased weight of 15 N compared to the normally predominant 14 N (as indicated by the mass ratio 15 N/ 14 N) is detected quantitatively in the molecular-fragment masses.
Alternatively, we can detect isotopes of carbon (13 C/ 12 C) or other isotopes.
Figure 2.35B shows NanoSIMS applied to a biofilm of Geobacter sulfurreducens growing upon an anode (positively charged electrode). The bacteria donate electrons to the electrode, generating electricity for a fuel cell. To optimize performance of the fuel cell, the researchers determined the pattern of metabolic efficiency within the biofilm. (Bacterial electricity is discussed in Chapter 14.) To measure biomass production, the researchers used NanoSIMS to indicate the proportion of uptake of 15 N. The 15 N fraction—that is, 15 N/(14 N + 15 N)—is represented by color scale in the heat map. The distribution of 15 N shows that bacteria contacting the electrode directly incorporate more nitrogen into biomass than do the bacteria at the outer surface.
FIGURE 2.35 ■ Imaging mass spectrometry. Mass spectra are obtained from thousands of locations throughout the sample surface. A. Molecular fragments are selected for analysis of mass-to-charge ratio (m / z). Selected isotopes may label specific atoms; for example, C, N, or P. The relative intensities of individual compounds are visualized using false-color gradients. B. NanoSIMS of Geobacter sulfurreducens biofilm upon an electrode, showing atomic percentages of nitrogen (15 N) incorporated into biomass.
Source: Part B modified from Grayson Chadwick et al. 2019. PNAS 116 :20716.
G. L. CHADWICK. 2019. PROC NATL ACAD SCI USA. 116 :20716–20724
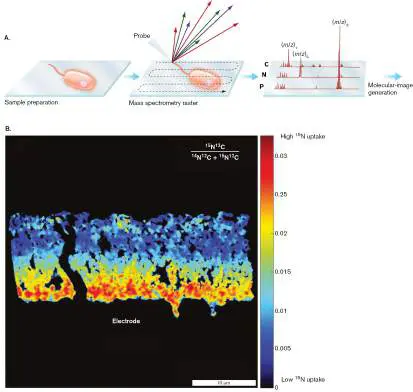
To Summarize
Fluorescence microscopy uses fluorescence by a fluorophore to reveal specific cells or cell parts.
The specimen absorbs light at one wavelength and then emits light at a longer wavelength. Color filters allow only light in the excitation range to reach the specimen and only emitted light to reach the photodetector.
A fluorophore can label a cell part by chemical affinity for a component such as a membrane, attachment to an antibody stain, or attachment to a short nucleic acid that hybridizes to a DNA sequence.
Fluorescent proteins such as GFP can be fused to a specific protein expressed by the cell. Endogenous GFP-type proteins can track intracellular movement of cell parts and can report environmental stress responses.
Super-resolution imaging can define the position of a fluorescent protein with a precision of 20–40 nm, tenfold better than the resolution limit of light magnification. Fluorescence in situ hybridization (FISH) uses fluorophore-labeled DNA probes to map the spatial location of microbial taxa in the environment or within a host.
Chemical imaging microscopy maps the distribution of compounds within a cell or a microbial community. NanoSIMS uses mass spectral analysis of bacterial components labeled by heavy isotopes.
Glossary
fluorophore A fluorescent molecule used to stain specimens for fluorescence microscopy.
excitation wavelength The wavelength of light that must be absorbed by a molecule in order for the molecule to fluoresce. It is shorter than the emission wavelength and has higher energy.
emission wavelength The wavelength of light emitted by a fluorescent molecule. It is longer than the excitation wavelength and has lower energy. gene fusion In biotechnology, the construction of a recombinant gene composed of portions from two different genes, one of which may be a reporter for gene expression.
super-resolution imaging Techniques of microscopy that pinpoint the location of an object with a precision greater than the resolution of ordinary optical or fluorescence microscopy.
confocal laser scanning microscopy or confocal microscopy A type of fluorescence microscopy in which the excitation light from a laser and the emitted light from the specimen are focused together, producing high-resolution images.
fluorescence in situ hybridization (FISH)
A technique to detect individual microbes in an ecological or clinical sample, using a fluorophore-labeled oligonucleotide probe (usually a short DNA sequence) that hybridizes to microbial DNA or rRNA.
nanoscale secondary ion mass spectrometry (NanoSIMS)
A technique of chemical imaging in which an ionizing beam breaks off organic ions from a sample, which fly off the sample and are captured for analysis by a mass spectrometer.
nanoscale secondary ion mass spectrometry (NanoSIMS)
A technique of chemical imaging in which an ionizing beam breaks off organic ions from a sample, which fly off the sample and are captured for analysis by a mass spectrometer.
Fig. 2.12: FIGURE 2.12 ■ Interference of light waves at the focal point generates concentric rings surrounding the peak intensity. A. Broad wavefronts generate narrow interference rings with peaks well resolved. B. Narrow wavefronts generate wide interference rings that are unresolved.
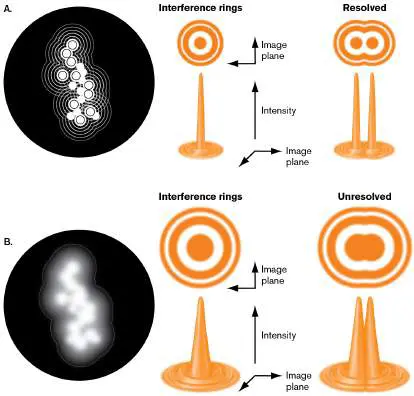
2.6 Electron Microscopy, Scanning Probe Microscopy, and X-Ray CrystallographyUnit 1 · Methods
All cells are built of macromolecular structures. The foremost tool for observing the shapes of these structures is electron microscopy (EM). In electron microscopy, magnetic lenses focus beams of electrons to image cell membranes, chromosomes, and ribosomes with a resolution a thousand times that of light microscopy. Other kinds of microscopy are emerging, such as scanning probe microscopy, which images the contours of live bacteria. For atom-level detail of a macromolecule, the tool of choice is X-ray crystallography.
Electron Microscopy
How does an electron microscope work? Electrons are ejected from a metal subjected to a voltage potential. Like photons, the electrons travel in a straight line, interact with matter, and carry information about their interaction. And also like photons, electrons can exhibit the properties of waves. The wavelength associated with an electron is 100,000 times smaller than that of a photon; for example, an electron accelerated over a voltage of 100 kilovolts (kV) has a wavelength of 0.0037 nm, compared with 400–750 nm for visible light. However, the actual resolution of electrons in microscopy is limited not by the wavelength, but by the aberrations of the lensing systems used to focus electrons. The magnetic lenses that focus the electrons never achieve the precision required to utilize the full potential resolution of the electron beam.
Electrons are focused by means of a magnetic field directed along the line of travel of the beam (Fig. 2.36). As a beam of electrons enters the field, it spirals around the magnetic field lines. The shape of the magnet can be designed to generate field lines that will focus the beam of electrons in a manner analogous to the focusing of photons by a refractive lens. The electron beam, however, forms a spiral because electrons travel around magnetic field lines. Magnetic lenses generate large aberrations; thus, we need a series of corrective magnetic lenses to obtain a resolution of about 0.2 nm. This resolution is a thousand times greater than the 200-nm resolution of light microscopy.
FIGURE 2.36 ■ A magnetic lens. The beam of electrons spirals around the magnetic field lines. The U-shaped magnet acts as a lens, focusing the spiraling electrons much as a refractive lens focuses light rays.
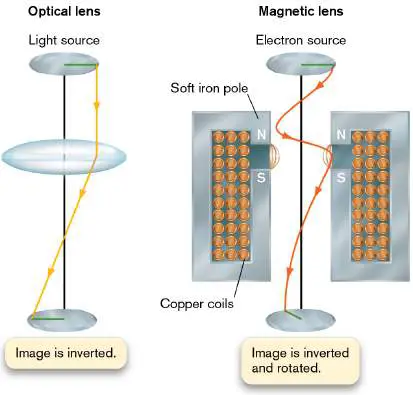
Thought Question
2.7 Like a light microscope, an electron microscope can be focused at successive powers of magnification. At each level, the image rotates at an angle of several degrees. Given the geometry of the electron beam (see Fig. 2.36), why do you think the image rotates? Transmission EM and scanning EM. Two major types of electron microscopy are transmission electron microscopy (TEM) and scanning electron microscopy (SEM). In TEM, electrons are transmitted through the specimen as in light microscopy to reveal internal structure. In SEM, the electron beams scan across the surface of the specimen and are reflected to reveal the contours of its 3D surface.
The transmission electron microscope closely parallels the design of a bright-field microscope, including a source of electrons (instead of light), a magnetic condenser lens, a specimen, and a magnetic objective lens (Fig. 2.37). The light source is replaced by an electron source consisting of a high-voltage current applied to a tungsten filament, which gives off electrons when heated. The electron beam is focused onto the specimen by the magnetic condenser lens. The specimen image is then magnified by the magnetic objective lens. The magnetic projection lens, analogous to the ocular lens of a light microscope, focuses the image on a fluorescent screen.
FIGURE 2.37 ■ Transmission electron microscopy (TEM). In the transmission electron microscope (right), the light source is replaced by an electron source consisting of a high-voltage current applied to a tungsten filament, which gives off electrons when heated. Each magnetic lens shown (condenser, objective, projection) actually represents a series of lenses.
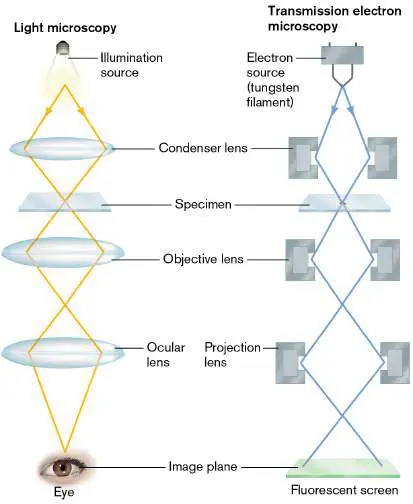
The scanning electron microscope is arranged somewhat differently from the TEM, in that a series of magnetic condenser lenses focuses the electron beam onto the surface of the specimen. Reflected electrons are then picked up by a detector (Fig. 2.38).
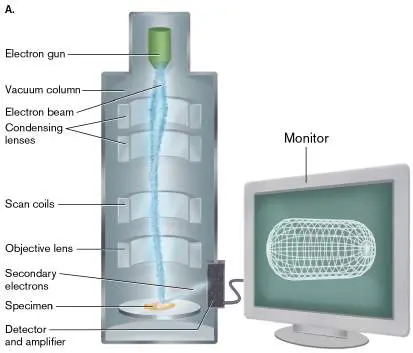
FIGURE 2.38 ■ Scanning electron microscopy (SEM). A. In the scanning electron microscope, the electron beam is scanned across a specimen coated in gold, which acts as a source of secondary electrons. The incident electron beam ejects secondary electrons toward a detector, generating an image of the surface of the specimen. B. Loading a specimen into the vacuum column.
COLIN CUTHBERT/SCIENCE SOURCE
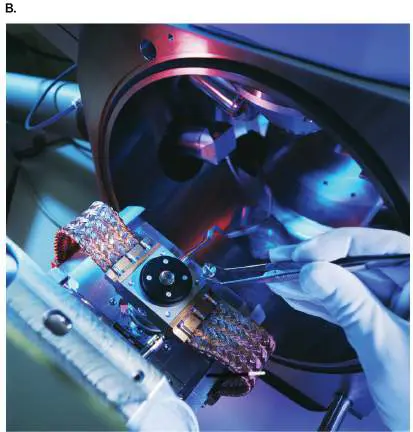
Sample preparation for EM. Standard electron microscopy of biological specimens at room temperature poses special problems. The entire optical column must be maintained under vacuum to prevent the electrons from colliding with the gas molecules in air. The requirement for a vacuum precludes the viewing of live specimens, which in any case would be quickly destroyed by the electron beam. Moreover, the structure of most specimens lacks sufficient electron density (ability to scatter electrons) to provide contrast. Thus, the specimen requires an electron-dense negative stain using salts of heavy-metal atoms such as tungsten or uranium. The heavy atoms collect outside the surfaces of cell structures such as membranes, where their electron scatter reveals the outline of the structure. Staining, however, can be avoided for cryo-electron microscopy (discussed next).
We can prepare a specimen by embedding it in a polymer for thin sections. A special knife called a microtome cuts slices through the specimen, each slice a fraction of a micrometer thick. Alternatively, a specimen consisting of, for example, virus particles or isolated organelles can be sprayed onto a copper grid. In either case, the electron beam penetrates the object as if it were transparent. The electrons are actually absorbed by the heavy-atom stain, which collects at the edges of biological structures.
Figure 2.39shows examples from transmission electron microscopy. The transmission electron micrograph of Bacillus anthracis in Figure 2.39Ashows a thin section through a bacillus, including a cell wall, membranes, and glycoprotein filaments. The section is stained with uranyl acetate (a salt of uranium ion). The image includes electron density throughout the depth of the section. In Figure 2.39B , Salmonella protein complexes called “injectisomes” have been isolated and spread on a grid.
Injectisomes, or type III secretion systems (T3SS), are used by Salmonella enterica to inject virulence effector proteins into a host cell. The motor protein complexes are negatively stained with phosphotungstate, an electron-dense material that deposits in the crevices around the complexes on the grid. The transmission electron micrograph reveals details of each complex, including the individual rings that anchor it in the cell envelope. The details resolved by the beam of electrons are far smaller than those resolved by a light microscope.
FIGURE 2.39 ■ Transmission electron micrographs. A. Bacillus anthracis thin section, showing envelope and cytoplasm (uranyl acetate stain). B. “Injectisome” toxin injection devices from Salmonella enterica (phosphotungstate negative stain).
STÉPHANE MESNAGE ET AL. 1988. J. BACTERIOL. 180 :52
THOMAS C. MARLOVITS AND OLIVER SCHRAIDT
Scanning electron microscopy can show whole cells in apparent 3D view, with much greater resolution than light microscopy can accomplish. SEM is particularly effective for visualizing cells within complex communities such as a biofilm (Fig. 2.40A) . The scanning electron micrograph shows a biofilm of archaea with “hami,” grappling hooks that enable the cells to encase filaments of a bacterial partner. The shapes of the archaea and their hami appear distinct from the bacteria.
In a clinical example, Figure 2.40B shows the pathogen Helicobacter pylori colonizing the gastric epithelium (stomach lining). H. pylori bacteria are helical rods (colorized green). Note that the colorizing consists of interpretation by a photo artist; no actual colors are observed by electron microscopy, as colors are defined not by electrons but by visible light. The bacterium Helicobacter pylori was first reported by Australian scientist Barry Marshall, but it proved difficult to isolate and culture. Ultimately, electron microscopy confirmed the existence of H. pylori
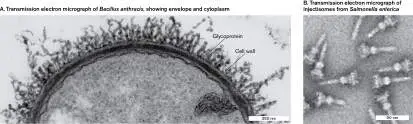
in the stomach and helped to document its role in gastritis and stomach ulcers.
FIGURE 2.40 ■ Scanning electron micrographs. A. Archaea of a wetland biofilm, with numerous hami. The archaea encase bacterial filaments. From Sippenauer Moor, Germany. B. Helicobacter pylori adheres to the villi (small bulges) of the gastric epithelium. Bacteria are colorized green.
ALEXANDRA K. PERRAS ET AL. 2014. FRONT. MICROBIOL. 5 :397
VERONIKA BURMEISTER/VISUALS UNLIMITED
Thought Question
2.8 What kinds of research questions could you investigate using SEM? What questions could you answer using TEM?
An important limitation of traditional electron microscopy, whether TEM or SEM, is that the fixatives and heavy-atom stains can introduce artifacts into the image, especially at finer details of resolution. In some cases, different preparation procedures have led to substantially different interpretations of subcellular structure. For example, an oval that appears hollow might be interpreted as a cell when, in fact, it represents a deposit of staining material. A
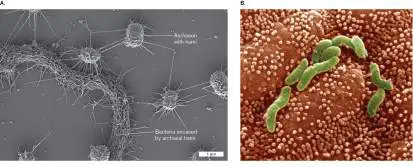
microscopic structure that is interpreted incorrectly is termed an artifact. Avoiding artifacts is an important concern in microscopy.
Cryo-Electron Microscopy and Tomography
How can electron microscopy achieve finer resolution and avoid artifacts due to staining? High-strength electron beams now permit low-temperature cryo-electron microscopy (cryo-EM), also known as electron cryomicroscopy.
Cryo-EM avoids staining. In cryo-EM, the specimen does not require staining, because the high-intensity electron beams can detect smaller signals (contrast in the specimen) than earlier instruments could. The specimen must, however, be flash-frozen; that is, suspended in water and frozen rapidly in a refrigerant of high heat capacity (ability to absorb heat). The rapid freezing avoids ice crystallization, leaving the water solvent in a glass-like amorphous phase. The specimen retains water content and thus closely resembles its living form, although it is still ultimately destroyed by electron bombardment.
The cryo-EM micrograph in Figure 2.41Ashows Pelagibacter, an ultrasmall bacterium found throughout the open oceans.
Pelagibacter is a heterotroph adapted to the lowest concentrations of nutrients. It is one of the world’s most abundant life forms, and one of the smallest free-living cells (about 0.01 cubic micrometer). Little is known about its means of survival, with its streamlined genome and cell structure. The cell section reveals in detail the form of its Gram-negative outer membrane (blue), inner membrane (cyan), and periplasmic space between (Fig. 2.41B ). Within the cytoplasm, we can see the DNA strands of nucleoid (red) and individual ribosomes (yellow). As small as the cell is, we can see its distinctive asymmetry of shape, a curved cell with one end pinched. The function of the asymmetry is unknown.
FIGURE 2.41 ■ Cryo-electron tomography of the marine bacterium Pelagibacter. A. A single cryo-EM scan lengthwise through Pelagibacter. B. 3D model of Pelagibacter based on multiple scans, showing nucleoid DNA (purple), ribosomes (yellow), inner membrane (cyan), and outer membrane (blue).
X. ZHAO ET AL. 2017. APPL. ENVIRON. MICROBIOL. 83 :E02807-16
X. ZHAO ET AL. 2017. APPL. ENVIRON. MICROBIOL. 83 :E02807-16
Note: Pelagibacter ubique is the first of several cultured isolates
of the “SAR11” cluster of bacteria, originally identified by analysis of DNA sequences of bacteria in the Sargasso Sea near Bermuda. The SAR11 cluster has since been expanded beyond genus to the rank of order: Pelagibacterales, phylum Alphaproteobacteria.
Tomography. Another innovation made possible by cryo-EM is tomography, the acquisition of projected images from different angles of a transparent specimen. Cryo-electron tomography, or electron cryotomography, avoids the need to physically slice the sample for thin-section TEM. The images from tomography are combined digitally to visualize objects in 3D, such as the Pelagibacter nucleoid and ribosomes (Fig. 2.41B ). Repeated scans can be summed computationally to obtain an image at high resolution (Fig. 2.42). The scans are taken either at different angles or within different focal planes. Each different scan images a
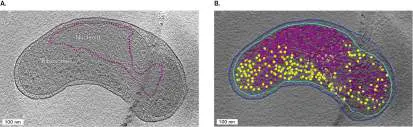
slightly different part of the cell. The summed scans then generate a 3D model.
FIGURE 2.42 ■ 3D image construction in cryo-electron tomography. Cryo-EM images are obtained in multiple focal planes throughout an object. The images are combined through a mathematical transformation to model the entire object in 3D. Modeling cell parts. One use of cryo-electron tomography is to generate high-resolution models of complex particles, such as viruses. For a symmetrical virus, particle images can be rotated for averaging. In addition, images of multiple particles can be averaged together. The digitally combined images can achieve high resolution, nearly comparable to that of X-ray crystallography. Chinese
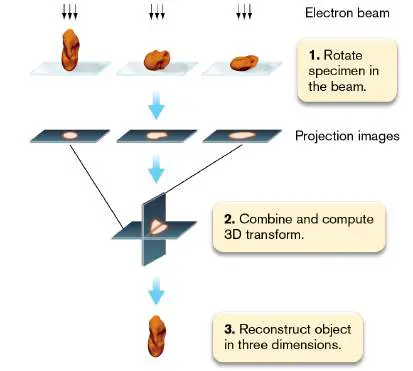
microscopists Hongrong Liu, at Hunan Normal University, and Lingpeng Cheng, at Tsinghua University, used cryo-EM to model cypovirus, a virus that infects silkworms and butterfly larvae (Fig. 2.43). Other viruses modeled recently include herpesvirus and human immunodeficiency virus (HIV) (presented in Chapter 11). Cryo-EM is especially useful for particles that cannot be crystallized for X-ray diffraction analysis, the most common means of molecular visualization.
FIGURE 2.43 ■ Cryo-electron tomography reveals virus structure. A. Hongrong Liu (left) and Lingpeng Cheng used cryo-EM and symmetry-based computation to model the structure of a cypovirus. B. Cypovirus model shows the double-stranded RNA genome (blue) packed inside the capsid, along with viral RNA-dependent RNA polymerases (red).
HONGRONG LIU, HUNAN NORMAL UNIVERSITY
LINGPENG CHENG, TSINGHUA UNIVERSITY
H. LIU AND L. CHENG. 2015. SCIENCE 349 :1347–1350
Another example is the modeling of rotary flagellar motors. Bonnie Chaban (Fig. 2.44A) and co-workers at Imperial College London used cryo-EM digital combination to obtain detailed models of the motors of Campylobacterales, a clade of bacteria including enteric pathogens. The models allowed reconstruction of each motor interior, including each axle (shown as violet). It was possible to compare the motors from related bacteria, such as the Escherichia
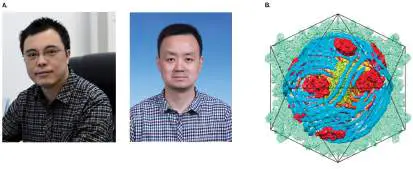
coli predator Bdellovibrio and the rumen symbiont Wolinella (Fig. 2.44B ). The comparison enabled computation of a phylogenetic tree of motor evolution—something once thought impossible because of the precision requirements of a rotary device.
FIGURE 2.44 ■ Cryo-electron tomography (cryo-EM) of bacterial flagellar motors. A. Bonnie Chaban, now at University of Saskatchewan. B. The flagellar motor structures of the bacteria Bdellovibrio bacteriovorus and Wolinella succinogenes.
BONNIE CHABAN, UNIVERSITY OF THE SUNSHINE COAST
B. CHABAN ET AL. 2018. SCI. REP. 8 :97
Model of a cell. Cryo-EM models of a motor are impressive, but can we build a 3D model of an entire cell? Grant Jensen and colleagues at the California Institute of Technology use cryo-electron tomography to visualize an entire flash-frozen bacterium. Such a model includes all the cell’s parts and their cytoplasmic connections —and reveals new structures never seen before.
The cell modeled in Figure 2.45is Magnetospirillum magneticum, a bacterium that can swim along Earth’s magnetic field in order to reach deeper, low-oxygen water. To orient along magnetic field lines, the cell contains a string of magnetic particles composed of the mineral magnetite (iron oxide; Fe 3 O 4). A cryo-
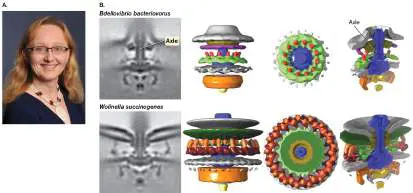
EM section through the bacterium (Fig. 2.45A) shows fine details, including the inner membrane (equivalent to the cell membrane), peptidoglycan cell wall, and outer membrane, an outer covering found in Gram-negative bacteria. Four dark magnetosomes (particles of magnetite) appear in a chain, each surrounded by a vesicle of membrane. How do cells form such intracellular structures? For some clues, see eResearch Activity 2.
Figure 2.45B models the magnetosomes, reconstructed using multiple cryo-EM scans across the volume of the cell. The magnetosomes are colorized red, each surrounded by a membrane vesicle (green). The vesicles are organized within the cell by a series of protein axial filaments, colorized yellow. Figure 2.45C shows an expanded image of the magnetosomes viewed from the cell interior. This expansion reveals that the magnetosome vesicles consist of invaginations from the cell membrane. Thus, the 3D model shows how the magnetite particles are fixed in position by invaginated membranes and held in a line by axial filaments.
FIGURE 2.45 ■ Magnetotactic cell visualized by cryo-electron tomography. A. A single cryo-EM scan lengthwise through Magnetospirillum magneticum. B. 3D model of M.
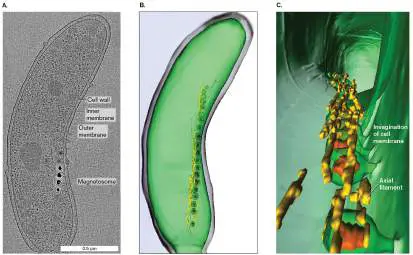
magneticum based on multiple scans. C. Expanded view of the cell interior.
AAAS. ARASH KOMEILI ET AL. SCIENCE 311 :242–245, FIG. 1
NIH, THE JENSEN LABORATORY
NIH, THE JENSEN LABORATORY
Scanning Probe Microscopy
Scanning probe microscopy (SPM) enables nanoscale observation of cell surfaces. Unlike electron microscopy, some forms of SPM can be used to observe live bacteria in water or exposed to air.
SPM techniques measure a physical interaction, such as the “atomic force” between the sample and a sharp tip. Atomic force microscopy (AFM) measures the van der Waals forces between the electron shells of adjacent atoms of the cell surface and the sharp tip. In AFM, an instrument probes the surface of a sample with a sharp tip a couple of micrometers long and often less than 10 nm in diameter (Fig. 2.46A). The tip is located at the free end of a lever that is 100–200 μm long. The lever is deflected by the force between the tip and the sample surface. Deflection of the lever is measured by a laser beam reflected off a cantilever attached to the tip as the sample scans across. The measured deflections allow a computer to map the topography of cells in liquid medium and at a resolution below 1 nm.
In Figure 2.46B , AFM was used to observe live bacteria collected on a filter, from seawater off the coast of California. Two round bacteria and a helical bacterium can be seen (raised regions, green-white). The cells were observed in water suspension, without stain. Thus, AFM can help assess the ecological contributions of marine bacteria that cannot be cultured.
FIGURE 2.46 ■ Atomic force microscopy enables visualization of untreated cells. A. The atomic force microscope has a fine-pointed tip attached to a cantilever that
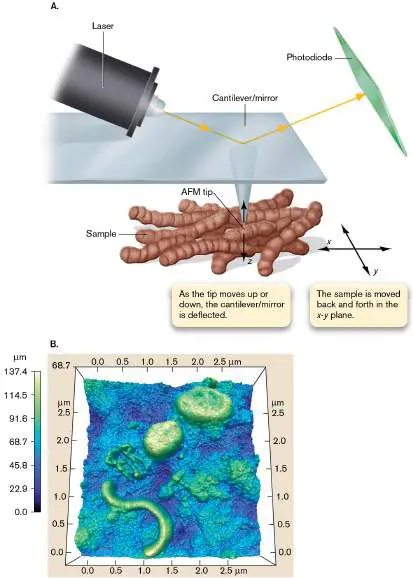
moves over a sample. The tip interacts with the sample surface through atomic force. As the tip is pushed away or pulled into a depression, the cantilever is deflected. The deflection is measured by a laser light beam focused onto the cantilever and reflected into a photodiode detector. B. This AFM image shows live bacteria collected on a filter, from seawater off the coast of California. Two round bacteria and a helical bacterium can be seen (raised regions, green-white).
REPRINTED BY PERMISSION FROM SPRINGER NATURE. F. MALFATTI ET AL. 2010.
ISME 4 :427
Thought Question
2.9 How could you use atomic force microscopy to study the effect of an antibiotic on Pseudomonas aeruginosa contamination of medical catheters?
X-Ray Diffraction Analysis
To know a cell, we need to isolate the cell’s individual molecules. The major tool used at present to visualize a molecule is X-ray diffraction analysis , or X-ray crystallography. Much of our knowledge of microbial genetics (see Chapters 7–12) and metabolism (see Chapters 13–16) comes from crystal structures of key macromolecules.
Unlike microscopy, X-ray diffraction does not present a direct view of a sample, but instead generates computational models. Dramatic as the models are, they can only represent particular aspects of electron clouds and electron density that are fundamentally “unseeable.” That is why we represent molecular structures in different ways that depend on the context—by electron density maps, as models defined by van der Waals radii, or as stick models. Proteins are frequently presented in a cartoon form that shows alpha helix and beta sheet secondary structures.
For a molecule that can be crystallized, X-ray diffraction makes it possible to fix the position of each individual atom in the molecule. Atomic resolution is possible because the wavelengths of X-rays are much shorter than the wavelengths of visible light and are comparable to the size of atoms. X-ray diffraction is based on the principle of wave interference (see Fig. 2.19). The interference pattern is generated when a crystal containing many copies of an isolated molecule is bombarded by a beam of X-rays (Fig. 2.47A). The wavefronts associated with the X-rays are diffracted as they pass through the crystal, causing interference patterns. In the crystal, the diffraction pattern is generated by a symmetrical array of many sample molecules (Fig. 2.47B ). The more copies of the molecule in the array, the narrower the interference pattern and the greater the resolution of atoms within the molecule. Diffraction patterns obtained from the passage of X-rays through a crystal ( Fig. 2.47C ) can be analyzed by computation to develop a precise structural model for the molecule, detailing the position of every atom in the structure.
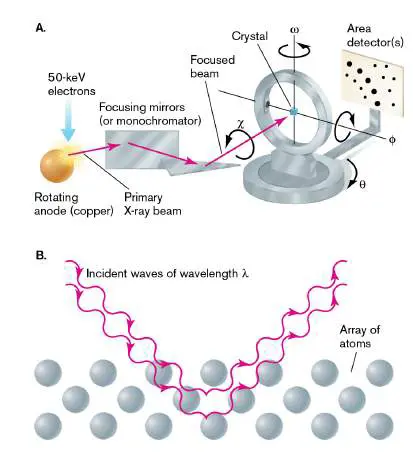
FIGURE 2.47 ■ Visualizing molecules by X-ray crystallography. A. Apparatus for X-ray crystallography. The X-ray beam is focused onto a crystal, which is rotated over all angles to obtain diffraction patterns. The intensity of the diffracted X-rays is recorded on film or with an electronic detector. B. X-rays are diffracted by rows of identical molecules in a crystal. The diffraction pattern is analyzed to generate a model of the individual molecules. C. Diffraction pattern from a crystal.
ALFRED PASIEKA/SCIENCE SOURCE
The application of X-ray crystallography to complex biological molecules was pioneered by the Irish crystallographer John Bernal (1901–1971; Fig. 2.48A). Bernal was particularly supportive of women students and colleagues, including Rosalind Franklin (1920– 1958), who made important discoveries about DNA and RNA, and Nobel laureate Dorothy Crowfoot Hodgkin (1910–1994). Hodgkin (
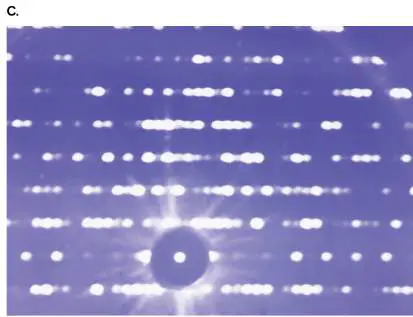
Fig. 2.48B ) solved the crystal structures of penicillin and vitamin B 12 (Fig. 2.48C ), as well as one of the first protein structures—that of the hormone insulin.
FIGURE 2.48 ■ Pioneering X-ray crystallography. A. John Bernal at Cambridge University developed X-ray crystallography to solve the structure of complex biological molecules. B. Dorothy Hodgkin at Oxford University was awarded the 1964 Nobel Prize in Chemistry for her work in X-ray crystallography. C. Vitamin B 12, whose structure was originally solved by Hodgkin. The corrin ring structure is built around an atom of cobalt (pink). Carbon atoms here are gray; oxygen, red; nitrogen, blue; phosphorus, yellow. Hydrogen atoms are omitted for clarity.
J. L. FINNEY, PRIVATE COLLECTION
AGE FOTOSTOCK/ALAMY STOCK PHOTOS
Today, X-ray data undergo digital analysis to generate sophisticated molecular models, such as the one seen in Figure 2.49of anthrax lethal factor, a toxin produced by Bacillus anthracis that kills the infected host cells. The model for anthrax lethal factor was encoded in a Protein Data Bank (PDB) text file that specifies coordinates for all atoms of the structure. The Protein Data Bank is a worldwide database of solved X-ray structures, freely available on the Internet. Visualization software is used to present the structure as a “ribbon” of amino acid residues, color-coded for secondary structure. The ribbon diagram method was developed by Jane S.
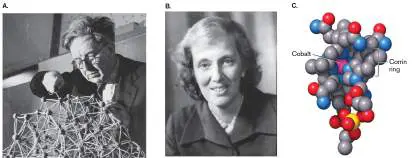
Richardson and is also known as the “Richardson diagram.” In Figure 2.49, the red coils represent alpha helix structures, whereas the blue arrows represent beta sheets (for a review of protein structures, see eAppendix 1).
FIGURE 2.49 ■ X-ray crystallography of a protein complex, anthrax lethal factor. The toxin consists of a butterfly-shaped dimer of two peptide chains. This cartoon model is based on X-ray-crystallographic data, showing alpha helix (red coils) and beta sheet (blue arrows). (PDB code: 1J7N)
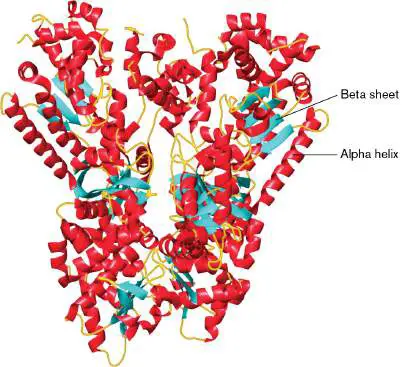
Note: Molecular and cellular biology increasingly rely on
visualization in 3D. Many of the molecules illustrated in this book are based on structural models deposited in the Protein Data Bank, as indicated by the PDB file code. Each PDB file can be viewed in 3D in the browser.
A limitation of X-ray analysis is the unavoidable deterioration of the specimen under bombardment by X-rays. The earliest X-ray diffraction models of molecular complexes such as the ribosome relied heavily on components from thermophilic bacteria and archaea that grow at high temperatures. Because thermophiles have evolved to grow under higher thermal stress, their macromolecular complexes are often more stable and therefore easier to crystallize than homologous proteins from organisms that grow at moderate temperatures.
X-ray diffraction analysis of crystals from a wide range of sources was made possible by cryocrystallography. In cryocrystallography, as in cryo-EM, crystals are frozen rapidly to liquid-nitrogen temperature. The frozen crystals have greatly decreased thermal vibrations and diffusion, thus lessening the radiation damage to the molecules. Models based on cryocrystallography can present multisubunit structures such as the bacterial ribosome complexed with transfer RNAs and messenger RNA (presented in Chapter 8).
To Summarize
Electron microscopy (EM) focuses beams of electrons on an object stained with a heavy-metal salt that scatters electrons. Much higher resolution can be obtained than with light microscopy.
Transmission electron microscopy (TEM) transmits electron beams through a thin section.
Scanning electron microscopy (SEM) involves scanning of a 3D surface with an electron beam.
Cryo-electron microscopy (cryo-EM) involves the observation of samples flash-frozen in water solution. Tomography combines multiple images by computation to achieve high resolution.
Atomic force microscopy (AFM) , a form of scanning probe microscopy (SPM), uses intermolecular force measurement to observe cells in water solution.
X-ray diffraction analysis , or X-ray crystallography , uses X-ray diffraction (interference patterns) from crystallized macromolecules to model the form of a molecule at atomic resolution.
Cryocrystallography uses frozen crystals that have greatly decreased thermal vibrations and diffusion, enabling the determination of structures of large macromolecular complexes, such as the ribosome.
Glossary
electron microscopy (EM)
A form of microscopy in which a beam of electrons accelerated through a voltage potential is focused by magnetic lenses onto a specimen.
transmission electron microscopy (TEM)
Electron microscopy in which electron beams are transmitted through a thin specimen to reveal internal structure. scanning electron microscopy (SEM)
Electron microscopy in which the electron beams scan across the specimen’s surface to reveal the 3D topology of the specimen.
artifact A structure viewed through a microscope that is incorrectly interpreted.
cryo-electron microscopy (cryo-EM)
Also called electron cryomicroscopy. Electron microscopy in which the sample is cooled rapidly in a cryoprotectant medium that prevents freezing. The sample does not need to be stained. electron cryomicroscopy See cryo-electron microscopy .
tomography The acquisition of projected images of a transparent specimen from different angles that are digitally combined to visualize the entire specimen.
cryo-electron tomography Also called electron cryotomography. A method of cryo-electron microscopy in which the electron beam generates multiple views in parallel planes through the specimen.
electron cryotomography See cryo-electron tomography .
scanning probe microscopy (SPM)
A type of microscopy in which a physical probe scans the surface of a specimen and maps the topography by detecting a property such as electron tunneling current (scanning tunneling microscopy) or atomic force (atomic force microscopy). atomic force microscopy (AFM)
A technique that maps the 3D topography of a object using van der Waals forces between the object and a probe.
X-ray crystallography or X-ray diffraction analysis A technique to determine the positions of atoms (atomic coordinates) within an array of identical molecules or molecular complexes on the basis of the diffraction of X-rays by the molecule.
Fig. 2.36: FIGURE 2.36 ■ A magnetic lens. The beam of electrons spirals around the magnetic field lines. The U-shaped magnet acts as a lens, focusing the spiraling electrons much as a refractive lens focuses light rays.
Fig. 2.19:
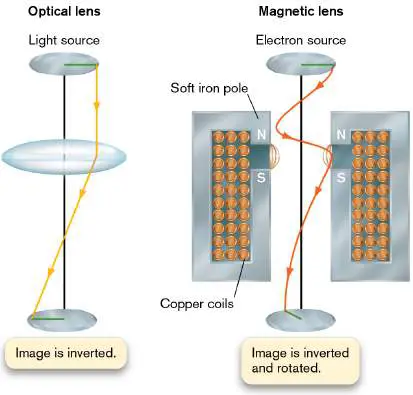
FIGURE 2.19 ■ Phase interference. A. In constructive interference, the peaks of the two wave trains rise together; their amplitudes are additive (A 1 + A 2), forming a wave of greater total amplitude (A T). B. In destructive interference, the peaks of the waves are opposite one another, so their amplitudes cancel (A 1 − A 2), forming a wave of lesser amplitude.
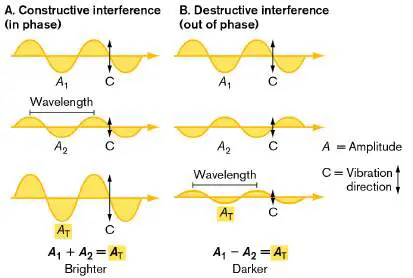
eResearch Activity 2
How Do Bacteria Make a Magnet Chain?
Magnetotactic bacteria (see Figure 2.45) can orient themselves like a compass along Earth’s magnetic field. The vesicles of magnetite (Fe 3 O 4) line up so as to maximize their overall magnetic moment, allowing the cell to behave like a compass needle. But how does the cell build magnetosomes and form the chain of vesicles that hold them in place? This extraordinary program of organelle development (organellogenesis) has been a mystery.
Surprising clues to the mystery emerge from the work of Mauricio Toro-Nahuelpan and colleagues at the University of Bayreuth, Germany (Fig. ERA 2.1 ). Toro-Nahuelpan observed magnetosome development in the bacterium Magnetospirillum gryphiswaldense. For clues to the development pathway, he constructed mutants lacking genes that encode various proteins needed to form magnetosomes.
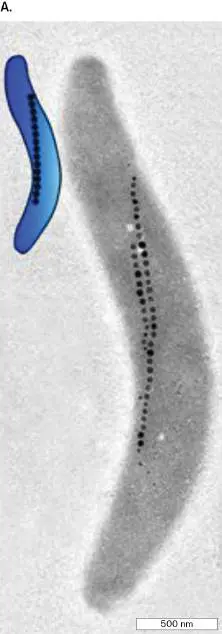
FIGURE ERA 2.1 ■ Mauricio Toro-Nahuelpan investigates magnetosome development. A. Wild-type Magnetospirillum gryphiswaldense has a double string of magnetosomes aligned along the axis of the spiral cell (TEM). B. Mauricio Toro-Nahuelpan uses TEM to analyze mutant cells with malformed magnetosomes.
M. TORO-NAHUELPAN ET AL. 2019. NAT MICROBIOL. 4 :1978–1989
MAURICIO TORO-NAHUELPAN
The TEM images of the various M. gryphiswaldense mutants show intriguing differences (Fig. ERA 2.2 ). The mutant that lacks MamK protein (panel A) makes fragmentary chains of magnetosomes that

lie at the cell’s curvature instead of along its central axis. A mutant lacking both MamK and MamY (panel B) makes chains that are tangled, with no connection to the cell membrane. Another mutant possesses MamK and MamY, but fails to express MamJ (panel C). This mamJ deletion mutant forms aggregations of magnetosomes with no linear chains.
The data from Fig ERA 2.2 were combined with other molecular and genetic experiments that used fluorescence microscopy and cryo-electron tomography. On the basis of these experiments, Toro-Nahuelpan and colleagues propose a model for magnetosome development (Fig. ERA 2.3 ). In this model, MamY (green) is proposed to be a transmembrane protein that forms a line along the inner curve of cytoplasmic membrane. MamJ proteins (orange) hold the magnetosome vesicles in place along a filament of MamK proteins (yellow). Then the MamJ proteins tether the string of magnetosomes to the MamY line along the inner curve of the cell. By fixing to points on the inner curve, the filament is maintained overall at an axial position in the cell.
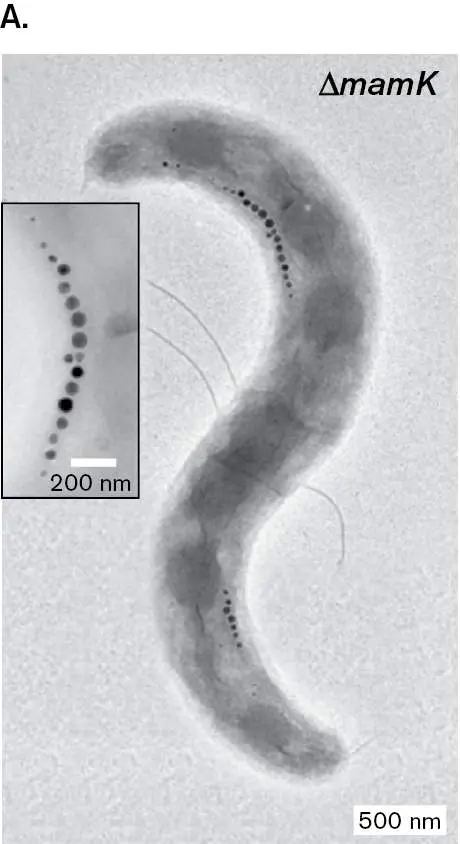
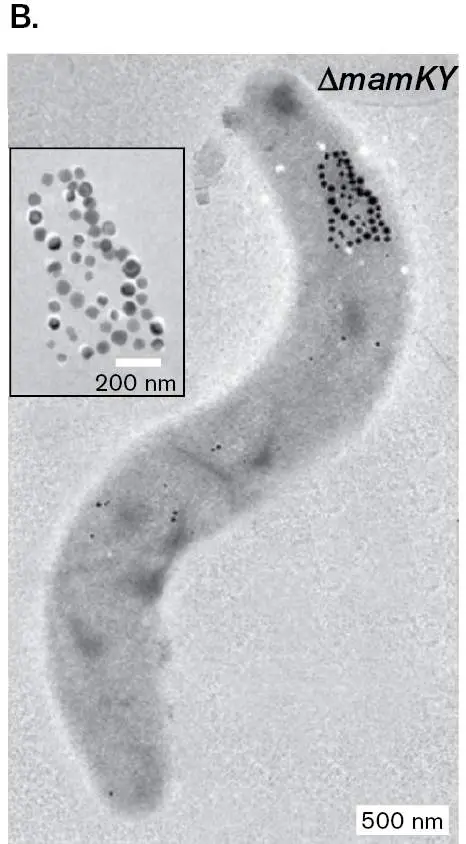
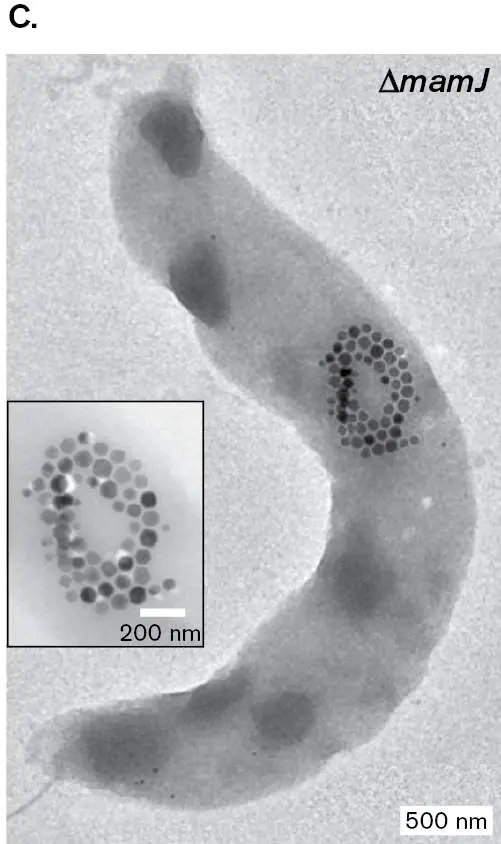
FIGURE ERA 2.2 ■ Magnetospirillum gryphiswaldense magnetosome mutants. A. Mutant lacking MamK protein makes fragmented chains of magnetosomes along the cell’s curvature instead of its central axis (TEM). B. Mutant lacking MamK and MamY makes tangled chains (TEM). C. Mutant lacking MamJ forms aggregations of magnetosomes instead of linear chains (TEM).
M. TORO-NAHUELPAN ET AL. 2019. NAT MICROBIOL. 4 :1978–1989
M. TORO-NAHUELPAN ET AL. 2019. NAT MICROBIOL. 4 :1978–1989
M. TORO-NAHUELPAN ET AL. 2019. NAT MICROBIOL. 4 :1978–1989
FIGURE ERA 2.3 ■ Model for magnetosome development. MamY (green) is proposed to be a transmembrane protein that forms a line along the inner curve of cytoplasmic membrane. MamJ proteins (orange) hold the
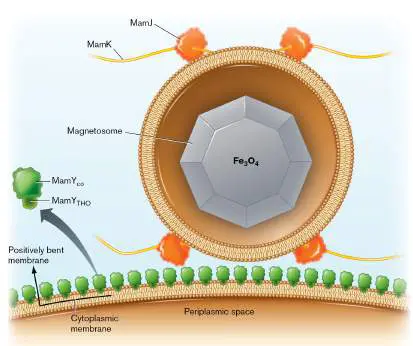
magnetosome vesicles in place along a filament of MamK proteins (yellow). The MamJ proteins tether the string of magnetosomes to the inner curve of cytoplasmic membrane.
Further Exploration
What do you think of the model proposed in Fig ERA 2.3 ? Is it consistent with the data? What aspects of magnetosome development are not addressed? How might you test other questions?
Toro-Nahuelpan, Mauricio, G. Giacomelli, O. Raschdorf, S. Borg S, J. M.
Plitzko, et al. 2019. MamY is a membrane-bound protein that aligns
magnetosomes and the motility axis of helical magnetotactic bacteria. Nature Microbiology 4 :1978–1989.
Glossary
Figure 2.45:
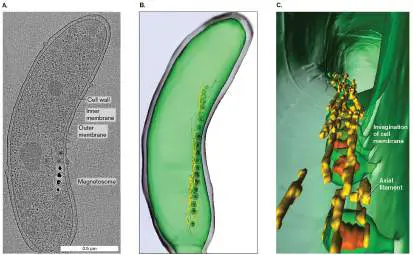
FIGURE 2.45 ■ Magnetotactic cell visualized by cryo-electron tomography. A. A single cryo-EM scan lengthwise through Magnetospirillum magneticum. B. 3D model of M. magneticum based on multiple scans. C. Expanded view of the cell interior.
AAAS. ARASH KOMEILI ET AL. SCIENCE 311 :242–245, FIG. 1
NIH, THE JENSEN LABORATORY
NIH, THE JENSEN LABORATORY
CHAPTER REVIEW
Review Questions
1. What principle defines an object as microscopic? 2. Explain the difference between detection and resolution. 3. How do eukaryotic and prokaryotic cells differ in appearance under the light microscope?
4. Explain how electromagnetic radiation carries information and why different kinds of radiation can resolve different kinds of objects.
5. Describe how light interacts with an object through absorption, reflection, refraction, and scattering. 6. Explain how refraction enables magnification of an image.
7. Explain how magnification increases resolution and why empty magnification fails to increase resolution.
8. Explain how the angle of aperture and resolution change with increasing lens magnification.
9. Summarize the optical arrangement of a compound microscope.
10. Explain how to focus an object and how to tell when the object is in or out of focus.
11. Explain the relative advantages and limitations of wet mount and stained preparations for observing microbes. 12. Explain the significance (and limitations) of the Gram stain for bacterial taxonomy.
13. Explain the basis of phase-contrast microscopy and that of fluorescence microscopy. Give examples of applications of these advanced techniques.
14. Explain the use of FISH for spatial mapping of microbial taxa.
15. Explain the difference between transmission and scanning electron microscopy and the different applications of each.
16. Explain how cryo-EM reveals the structure of cells and viruses.
Thought Questions
1. Explain which features of bacteria you can study by (a) light microscopy; (b) fluorescence microscopy; (c) scanning EM; (d) transmission EM.
2. Explain how resolution is increased by magnification. Why can’t the details be resolved by your unaided eye? Explain why magnification reaches a limit. Why can it not go on resolving greater detail?
3. Explain why artifacts appear in microscopic images, even with the best lenses. Explain how you can tell the difference between an optical artifact and an actual feature of an image.
4. How can “detection without resolution” be useful in microscopy? Explain with specific examples.
5. In D. Berry et al., 2013, PNAS 110 :4720, the number of Bacteroides foraging on host secretions changes when other species are introduced. Why might this happen? Can you propose an experiment using NanoSIMS to test your hypothesis?
Key Terms
aberration (48)
absorption (46)
acid-fast stain (57)
angle of aperture (48)
artifact (69)
atomic force microscopy (AFM) (73) bacillus (42)
bright-field microscopy (44, 48) chemical imaging microscopy (44) coccus (42)
compound microscope (49)
condenser (50)
confocal laser scanning microscopy (62) contrast (45)
counterstain (55)
cryo-electron microscopy (cryo-EM) (electron cryomicroscopy) (70) cryo-electron tomography (electron cryotomography) (71) depth of field (51)
detection (41)
differential stain (54)
electromagnetic radiation (45)
electron microscopy (EM) (44, 67) emission wavelength (58)
empty magnification (47)
excitation wavelength (58)
fixation (54)
fluorescence (46)
fluorescence in situ hybridization (FISH) (63) fluorophore (58)
focal point (47)
focus (41)
gene fusion (60)
Gram-negative (55)
Gram-positive (55)
Gram stain (54)
immersion oil (49)
interference (47)
lens (47)
light microscopy (LM) (44)
magnification (42)
microscope (40)
mordant (54)
nanoscale secondary ion mass spectrometry (NanoSIMS) (66) negative stain (57)
numerical aperture (49)
objective lens (48)
ocular lens (50)
parfocal (50)
phase-contrast microscopy (PCM) (52) reflection (46)
refraction (46)
refractive index (46)
resolution (41)
scanning electron microscopy (SEM) (44, 68) scanning probe microscopy (SPM) (73) scattering (46)
simple stain (54)
spirillum (43)
spirochete (43)
staining (54)
super-resolution imaging (48, 61) tomography (71)
total magnification (50)
transmission electron microscopy (TEM) (44, 68) wet mount (51)
X-ray crystallography (X-ray diffraction analysis) (44, 74)
Recommended Reading
Berry, D., B. Stecher, A. Schintlmeister, J. Reichert, S. Brugiroux, et al. 2013. Host-compound foraging by intestinal microbiota revealed by single-cell stable isotope probing. Proceedings of the National Academy of Sciences USA 110:4720.
Gahlmann, Andreas, and William E. Moerner. 2014. Exploring bacterial cell biology with single-molecule tracking and super-resolution imaging. Nature Reviews. Microbiology 12 :9–22. Klein, Steffen, Mirko Cortese, Sophie L. Winter, Moritz Wachsmuth-Melm, Christopher J. Neufeldt, et al. 2020. SARS-CoV-2 structure and replication characterized by in situ cryo-electron tomography. Nature Communications 11 :1–10. Murphy, Douglas B. 2001. Fundamentals of Light Microscopy and Electronic Imaging. Wiley-Liss, Hoboken, NJ.
Oikonomou, Catherine M., Yi-Wei Chang, and Grant J.
Jensen. 2016. A new view into prokaryotic cell biology from electron cryotomography. Nature Reviews. Microbiology 14:205–220.
Popescu, Aurel, and R. J. Doyle. 1996. The Gram stain after more than a century. Biotechniques in Histochemistry 71 :145– 151.
Ptacin, Jerod L., Steven F. Lee, Ethan C. Garner, Esteban Toro, Michael Eckart, et al. 2010. A spindle-like apparatus guides bacterial chromosome segregation. Nature Cell Biology 12 :791–798.
Rodriguez, Erik A., Robert E. Campbell, John Y. Lin, Michael Z. Lin, Atsushi Miyawaki, et al. 2017. The growing and glowing toolbox of fluorescent and photoactive proteins. Trends in Biochemical Sciences 42 :111–129.
Schraivogel, Daniel, Terra M. Kuhn, Benedikt Rauscher, Marta Rodríguez-Martínez, Malte Paulsen, et al. 2022. High-speed fluorescence image–enabled cell sorting. Science 375 :315–320.
Söderström, Bill, Helena Chan, and Daniel O. Daley. 2019. Super-resolution images of peptidoglycan remodeling enzymes at the division site of Escherichia coli. Current Genetics 65 :99– 101.
Su, Zhaoming, Chao Wu, Liuqing Shi, Priya Luthra, Grigore D. Pintilie, et al. 2018. Electron cryo-microscopy structure of Ebola virus nucleoprotein reveals a mechanism for nucleocapsid-like assembly. Cell 172 :966–978.
Uebe, René, and Dirk Schüler. 2016. Magnetosome biogenesis in magnetotactic bacteria. Nature Reviews. Microbiology 14:621–637.
Glossary
aberration An imperfection in a lens.
absorption In optics, the capacity of a material to absorb light. acid-fast stain A diagnostic stain for mycobacteria, which retain the dye fuchsin because of mycolic acids in the cell wall.
angle of aperture The width of a light cone (theta, θ) that projects from the midline of a lens. Greater angles of aperture increase resolution.
artifact A structure viewed through a microscope that is incorrectly interpreted.
atomic force microscopy (AFM)
A technique that maps the 3D topography of a object using van der Waals forces between the object and a probe.
bacillus pl. bacilli A rod-shaped bacterial or archaeal cell.
bright-field microscopy A type of light microscopy in which the specimen absorbs light and appears dark against a light background.
chemical imaging microscopy A method of microscopy that maps the distribution of specific elements or chemicals within a sample.
coccus pl. cocci A spherically shaped bacterial or archaeal cell.
compound microscope A microscope with multiple lenses to compensate for lens aberration and increase magnification.
condenser In a microscope, a lens that focuses parallel light rays from the light source onto a small area of the specimen to improve the resolution of the objective lens.
confocal laser scanning microscopy or confocal microscopy A type of fluorescence microscopy in which the excitation light from a laser and the emitted light from the specimen are focused together, producing high-resolution images.
contrast Differential absorption or reflection of electromagnetic radiation between an object and a background that allows the object to be distinguished from the background.
counterstain A secondary stain used to visualize cells that do not retain the first stain.
cryo-electron microscopy (cryo-EM)
Also called electron cryomicroscopy. Electron microscopy in which the sample is cooled rapidly in a cryoprotectant medium that prevents freezing. The sample does not need to be stained.
cryo-electron tomography Also called electron cryotomography. A method of cryo-electron microscopy in which the electron beam generates multiple views in parallel planes through the specimen. depth of field In a microscope, a region of the optical column over which a specimen appears in focus.
detection The ability to determine the presence of an object.
differential stain A stain that differentiates among objects by staining only particular types of cells or specific subcellular structures. excitation wavelength The wavelength of light that must be absorbed by a molecule in order for the molecule to fluoresce. It is shorter than the emission wavelength and has higher energy.
emission wavelength The wavelength of light emitted by a fluorescent molecule. It is longer than the excitation wavelength and has lower energy. electron microscopy (EM)
A form of microscopy in which a beam of electrons accelerated through a voltage potential is focused by magnetic lenses onto a specimen.
electromagnetic radiation Energy radiating in the form of alternating electrical and magnetic waves, quantized in photons.
empty magnification Magnification without an increase in resolution.
focus pl. foci The point at which rays of energy converge; in light microscopy, the convergence of light rays maximizes the clarity of the optical image.
fluorescence Also called epifluorescence. The emission of light from a molecule that absorbed light of a shorter, higher-energy wavelength.
focal point The position at which light rays that pass through a lens intersect.
fixation The adherence of cells to a slide by a chemical or heat treatment.
fluorophore A fluorescent molecule used to stain specimens for fluorescence microscopy.
fluorescence in situ hybridization (FISH)
A technique to detect individual microbes in an ecological or clinical sample, using a fluorophore-labeled oligonucleotide probe (usually a short DNA sequence) that hybridizes to microbial DNA or rRNA.
Gram stain A differential stain that distinguishes cells that possess a thick cell wall and retain a positively charged stain (Gram-positive) from cells that have a thin cell wall and outer membrane and fail to retain the stain (Gram-negative).
Gram-positive Describing cells that retain the Gram stain and appear dark purple after staining.
Gram-negative Describing cells that do not retain the Gram stain.
gene fusion In biotechnology, the construction of a recombinant gene composed of portions from two different genes, one of which may be a reporter for gene expression.
interference The interaction of two wavefronts. Interference can be additive (amplitudes in phase, constructive) or subtractive (amplitudes out of phase, destructive).
immersion oil An oil with a refractive index similar to glass that minimizes light-ray loss at wide angles, thereby minimizing wavefront interference and maximizing resolution.
light microscopy (LM)
Observation of a microscopic object on the basis of light absorption and transmission.
lens An object composed of transparent, refractive material that bends light rays to converge at a focal point (or to diverge from an imaginary point). For electron microscopy, a series of magnets arranged as a magnetic lens bends electron beams to converge or diverge.
microscope A tool that increases the magnification of specimens to enable viewing at higher resolution.
magnification An increase in the apparent size of a viewed object as an optical image.
mordant A chemical binding agent that causes specimens to retain stains better.
numerical aperture The product of the refractive index of the medium and sin θ (where θ is the angle of aperture). As numerical aperture increases, the magnification increases.
negative stain A stain that colors the background and leaves the specimen unstained.
nanoscale secondary ion mass spectrometry (NanoSIMS)
A technique of chemical imaging in which an ionizing beam breaks off organic ions from a sample, which fly off the sample and are captured for analysis by a mass spectrometer. objective lens In a compound microscope, the lens that is closest to the specimen and generates the initial magnification.
ocular lens In a compound microscope, the lens situated closest to the observer’s eye; part of the eyepiece.
parfocal In a microscope with multiple objective lenses, having the objective lenses set at different heights that maintain focus when switching among lenses.
phase-contrast microscopy (PCM)
Observation of a microscopic object based on the differences in the refractive index between cell components and the surrounding medium. Contrast is generated as the difference between refracted light and transmitted light shifts out of phase.
resolution The smallest distance that two objects can be separated and still be distinguished as separate objects.
reflection The deflecting of an incident light ray by an object, at an angle equal to the incident angle.
refraction The bending and slowing of light as it passes through a substance.
refractive index The degree to which a substance causes the refraction of light; a ratio of the speed of light in a vacuum to its speed in another medium.
spirochete A bacterium with a tight, flexible spiral shape; a species of the phylum Spirochetes (Spirochaetota).
spirillum pl. spirilla A rigid, corkscrew-shaped bacterial cell such as Rhodospirillum sp.
scanning electron microscopy (SEM)
Electron microscopy in which the electron beams scan across the specimen’s surface to reveal the 3D topology of the specimen.
scattering Interaction of light with an object that results in propagation of spherical light waves at relatively low intensity.
super-resolution imaging Techniques of microscopy that pinpoint the location of an object with a precision greater than the resolution of ordinary optical or fluorescence microscopy.
staining The process of treating microscopic specimens with a stain to enhance their detection or to visualize specific cell components. simple stain A stain that makes an object more opaque, increasing its contrast with the external medium or surrounding tissue. scanning probe microscopy (SPM)
A type of microscopy in which a physical probe scans the surface of a specimen and maps the topography by detecting a property such as electron tunneling current (scanning tunneling microscopy) or atomic force (atomic force microscopy). transmission electron microscopy (TEM)
Electron microscopy in which electron beams are transmitted through a thin specimen to reveal internal structure. total magnification The magnification of the ocular lens multiplied by the magnification of the objective lens.
wet mount A technique to view living microbes with a microscope by placing the microbes in water on a slide under a coverslip. tomography The acquisition of projected images of a transparent specimen from different angles that are digitally combined to visualize the entire specimen.
X-ray crystallography or X-ray diffraction analysis A technique to determine the positions of atoms (atomic coordinates) within an array of identical molecules or molecular complexes on the basis of the diffraction of X-rays by the molecule.