Chapter introduction
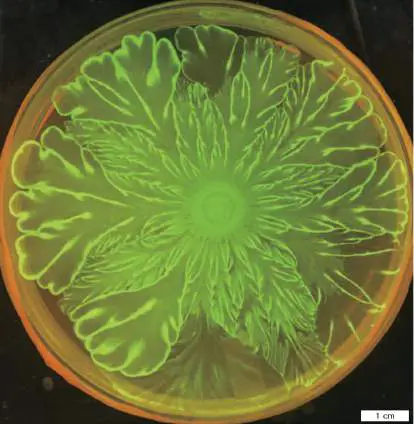
Like all living things, bacteria need nutrients to grow. But where do they find them? In natural habitats, bacteria struggle to survive because they constantly compete for food. Over time, however, bacteria have evolved slowly (thousands of years) and sometimes quickly (tens of years) to consume varieties of new, and sometimes even strange, foods (mothballs, for instance). Those adaptations enabled bacteria to invade many different nutritional environments. Some bacteria developed mechanisms to harness energy from light, while others evolved to survive in extreme environments such as boiling temperatures around deep-sea thermal vents. The result is that single-celled organisms now inhabit nearly every environmental niche around the world.
In the process, microbes have developed ways to chemically “talk” to each other, collaborating to form multicellular communities such as biofilms and fruiting bodies. Some competing biofilm communities of bacteria can time-share access to limiting nutrients, taking turns consuming scarce food—and they do it using nerve-like communications. Different species can communicate to help each other disseminate through an environment or even to avoid predation by amebas.
Chapter 4 provides a broad perspective of microbial growth, introducing the basic ways bacteria gather and use nutrients and how they gain energy to grow. The finer details of metabolism will emerge in Chapters 13, 14, and 15. We also explain how scientists culture bacteria in the laboratory and measure their growth. And we consider why most bacterial species growing in natural environments fail to grow in the lab—the uncultured “microbial dark matter” of Earth’s biome. We end by describing how bacteria form interactive communities, physically change shape to survive starvation, or search for new sources of food—all so they can grow again.
4.1 Microbial Nutritionnot assigned
Bacterial cells look simple but are remarkably complex and efficient replication machines. One cell of Escherichia coli, for example, can divide to form two cells every 20–30 minutes. In 24 hours, that one cell could multiply to over 100 trillion (10 14) cells. Collectively they would weigh only about 1 gram, but after another 24 hours the cell mass would explode to 10 14 grams (that is, 10 7 tons)! Why, then, are we not buried under mountains of E. coli? One factor limiting bacterial growth is the finite supply of nutrients in their environment (Fig. 4.1).
FIGURE 4.1 ■ Minimum set of essential nutrients needed for growth. Essential nutrients are those that all microbes need but cannot make. Macronutrients are required in large amounts, whereas only small amounts of micronutrients
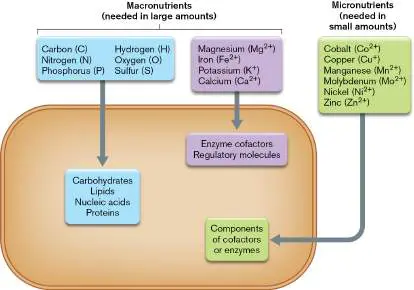
are needed. Some bacteria can have additional nutritional requirements depending on their biosynthetic capabilities.
Nutrient Supplies Limit Microbial Growth
Microbes, in fact, often live where nutrients are scarce because of limited availability or competition. Essential nutrients are compounds that a microbe must have but cannot make.
Consequently, the organism must find and import these nutrients from the surrounding environment. If an essential nutrient becomes depleted, microbes stop growing, even if other nutrients remain available. How organisms cope with these periods of starvation will be discussed later.
All microorganisms require a minimum set of macronutrients, nutrients needed in large quantities. Six macronutrients—carbon, nitrogen, phosphorus, hydrogen, oxygen, and sulfur—make up the carbohydrates, lipids, nucleic acids, and proteins of the cell. Four other macronutrients are cations that serve as cofactors for specific enzymes (Mg 2+, Fe 2+, and K +) or act as regulatory signaling molecules (Ca 2+). All cells also require very small amounts of certain trace elements, called micronutrients. These include cobalt, copper, manganese, molybdenum, nickel, and zinc, which are ubiquitous trace contaminants on glassware and in water. As a result, these six elements are not added to laboratory media unless heroic measures have been taken to first remove the elements from the glassware and water. Cells require micronutrients as essential components of enzymes or cofactors. Cobalt, for instance, is part of the cofactor vitamin B 12.
Note: The term “macronutrients” is used here to define the basic
elements and ions needed to make the components of a cell. Be careful not to confuse our usage with how the word is used by nutritionists. Nutritionists use “macronutrients” to refer to the nutritive components of food—carbohydrates, fats, and proteins— that a body needs in large amounts to gain energy and function optimally.
All cells require nutrients to increase biomass (grow) and gain energy. Some organisms, such as the common laboratory bacterium E. coli, make all their cell wall and membrane components, proteins, nucleic acids, and lipids using a very simple recipe: a carbohydrate such as glucose (the source of carbon, hydrogen, and oxygen), plus ammonia (nitrogen), sodium phosphate, and potassium phosphate. For other microbes, this basic set of nutrients is insufficient. For example, Borrelia burgdorferi, the cause of Lyme disease, requires an extensive mixture of complex organic supplements to grow. We now provide a brief overview of the many ways in which different microbes use nutrients to increase biomass and produce energy.
Microbes Build Biomass through Autotrophy or Heterotrophy
Maintaining life on this planet is a complex, multifaceted process. All of Earth’s life forms are based on carbon, but carbon is a limited resource that must be recycled to maintain life. The recycling process, called the carbon cycle, involves two counterbalancing kinds of metabolism: heterotrophy and autotrophy. Heterotrophy breaks down multicarbon nutrients (organic compounds) and harvests much of the carbon to make cell constituents. Some of the carbon, however, is converted into carbon dioxide as a waste product. Autotrophy takes the CO 2 molecules discarded as waste by heterotrophs and reassembles them into multicarbon nutrients such as glucose that heterotrophs can use as carbon sources (Fig. 4.2). The metabolic details of these pathways are discussed later, in Chapters 13 and 14.
FIGURE 4.2 ■ The carbon cycle. The carbon cycle requires both autotrophs and heterotrophs. A.
Heterotrophs gain energy from degrading complex organic compounds (such as polysaccharides) to smaller compounds (such as glucose and pyruvate). The carbon from pyruvate moves through the tricarboxylic acid (TCA) cycle and is released as CO 2. In the absence of a TCA cycle, the carbon can end up as fermentation products, such as ethanol or acetic acid. B. Autotrophs use light energy or energy derived from the oxidation of minerals to capture CO 2 and convert it to complex organic molecules. C. Chloroflexus aggregans, originally isolated from hot springs in Japan, possesses extraordinary metabolic versatility and is an example of a mixotroph. It grows anaerobically (without oxygen) as a photoheterotroph and aerobically (with oxygen) as a chemoheterotroph.
SATOSHI HANADA, TOKYO METROPOLITAN UNIVERSITY
Most heterotrophs (such as E. coli) are organotrophs. Organotrophy is a form of heterotrophy in which organic carbon sources are broken down in ways that not only harvest carbon for growth but also yield
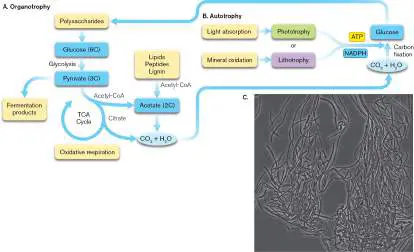
energy (oxidation) (Fig. 4.2A). Organotrophy converts a large amount of the organic carbon source to CO 2, which is then released into the atmosphere. Left on their own, organotrophs would deplete the world of organic carbon sources (converting them to unusable CO 2) and then starve to death. For life to continue, CO 2 must be recycled into organic compounds by autotrophs.
Autotrophs (such as cyanobacteria) assimilate CO 2 gas as a carbon source via CO 2 fixation. The fixation process reduces CO 2 (adding hydrogen atoms) to generate complex, organic cell constituents made up of C, H, and O (for example, carbohydrates, which have the general formula CH 2 O; Fig. 4.2B ). When autotrophs later die or are eaten, these organic compounds can be used as carbon sources by heterotrophs. Autotrophs are classified as photoautotrophs or chemolithoautotrophs by how they obtain energy. Photoautotrophs use light energy to fix CO 2 into biomass, whereas chemolithoautotrophs fix CO 2 using chemical reactions. Light is not involved. Most chemolithoautotrophs gain energy by oxidizing inorganic substances such as iron or ammonia (described next). In addition, many microorganisms (for example, phototrophic soil bacteria) can use both organotrophy and autotrophy to gain carbon.
Thought Question
4.1 In a mixed ecosystem of autotrophs and organotrophs, what happens if the autotroph begins to outgrow the organotroph, producing more and more organic food?
Microbes Obtain Energy through Phototrophy or Chemotrophy
The macronutrients mentioned earlier (C, N, P, H, O, and S) provide the essential building blocks needed to synthesize proteins and other cell structures. However, all of those synthetic processes require an energy source. Depending on the organism, energy can be obtained from chemical reactions triggered by the absorption of light (phototrophy —for example, photosynthesis) or from oxidation-reduction reactions that remove electrons from preformed high-energy compounds such as glucose or hydrogen (H 2) to make products of lower energy (chemotrophy). Chemotrophs capture the energy difference to do work. Chemotrophic organisms fall into two classes that use different sources of electron donors: lithotrophs (also called chemolithotrophs) and organotrophs (also called chemoorganotrophs or chemoheterotrophs). Lithotrophs oxidize (remove electrons from) inorganic chemicals (for example, H 2, H 2 S, NH +, NO −, and Fe 2+) for energy, whereas organotrophs, as
4 2
noted earlier, oxidize organic compounds (for example, sugars). Oxidation and reduction are reviewed in eAppendix 1. The metabolic reactions introduced here are presented in detail in Chapters 13 and 14.
Can a single microbe conduct more than one type of metabolism? Many free-living soil and aquatic bacteria can use a mix of different sources of energy and carbon, such as autotrophy and heterotrophy or phototrophy and chemotrophy. Such microbes are called mixotrophs (Fig. 4.2C) . A photoheterotroph or photoorganotroph is a type of mixotroph that obtains energy by different kinds of metabolism under different environmental conditions. For example, Rhodospirillum rubrum grows by photoheterotrophy when light is available and oxygen is absent, but it can switch to organotrophy and respiration, without absorbing light, when O 2 is available.
In chemotrophy, the amount of energy harvested from oxidizing a compound depends on the compound’s reduction state. The more reduced the compound is, the more electrons it has to give up and the higher its potential energy yield. A highly reduced compound, such as glucose, can donate electrons to a less reduced (more oxidized) compound, such as nicotinamide adenine dinucleotide (NAD), releasing energy in the form of donated electrons. Glucose, having lost electrons, becomes oxidized in the process. In contrast, NAD, having gained electrons, becomes reduced (to NADH). NAD is a cell molecule critical to energy metabolism and is discussed, along with oxidation-reduction reactions, in Chapter 13.
In short, the mechanisms used to acquire carbon and energy classify microbes as follows: Autotrophy (autotroph) . Autotrophs build biomass by fixing CO 2 into complex organic molecules. Autotrophs gain energy through one of two general metabolic routes that either oxidize inorganic compounds or absorb light.
Chemolithoautotrophy (chemolitho autotroph ) .
Chemolithoautotrophs gain energy from oxidizing inorganic molecules such as iron, sulfur, or nitrogen. This energy is used to fix CO 2 into biomass.
Photoautotrophy (photolitho autotroph). In photo-lithoautotrophy, photolithoautotrophs gain energy from light absorption and use that energy to fix CO 2 into biomass. Capturing the energy from light involves the photoexcitation of electrons generated by the photolysis of H 2 O, H 2 S, or another inorganic molecule.
Heterotrophy (heterotroph) . Heterotrophs break down organic compounds from other organisms to gain energy and to harvest carbon for building their own biomass. Heterotrophic metabolism can be divided into two classes, also based on whether light is involved.
Chemoorganoheterotrophy. Chemoorganoheterotrophs obtain energy and carbon for biomass solely from organic compounds. Chemoheterotrophy is also called just heterotrophy.
Photoorgano heterotrophy (photoorganotrophy ) .
Photoorganotrophs obtain energy from the catabolism (breakdown) of organic compounds and through light absorption. Organic compounds are broken down and used to build biomass.
The survival and metabolism of any one group of organisms depend on the survival and metabolism of other groups of organisms. For example, the cyanobacteria, a type of photosynthetic microorganism that originated 2.5–3.5 billion years ago, produce about half of the oxygen we breathe. Cyanobacteria also depend on heterotrophic bacteria to consume the molecular oxygen that the cyanobacteria produce, as oxygen by-products can be toxic to cyanobacteria.
Today, cyanobacteria (and other phytoplankton) form the base of Earth’s marine food chain. The autotrophic cyanobacteria fix carbon in the ocean and are eaten by heterotrophic protists such as protozoans. The protists are then devoured by fish, and the fish produce the CO 2 fixed by the cyanobacteria. And eventually, we eat the fish.
Note: In biology, the suffix “-trophy” refers to the acquisition of
nutrients. The following prefixes for “-trophy” terms help distinguish different forms of biomass-building (carbon source) and energy-yielding (energy source) metabolism.
Carbon source for building biomass: Auto-: CO 2 is fixed and assembled into organic molecules. Hetero-: Preformed organic molecules (having two or more carbon atoms).
Energy source: Photo-: Light absorption captures energy.
Chemo-: Oxidation of reduced molecules (organic or inorganic). Electron source: Litho-: Inorganic molecules donate electrons.
Organo-: Organic molecules donate electrons.
Energy Is Stored for Later Use
Whatever the source, energy, once obtained, must be converted to a form useful to the cell. This form can be chemical energy, such as that contained in the high-energy phosphate bonds in adenosine triphosphate (ATP), or it can be electrochemical energy, which is stored in the form of an electrical potential generated between compartments separated by a membrane (see Chapter 14). Energy stored by an electrical potential across the membrane is known as the membrane potential (for most cells, the membrane potential is more negative inside than outside).
A membrane potential is generated when chemical (or light) energy is used to pump protons (H +), Na +, or K + to the outside of the cell, making the cation concentration (positive charges) greater outside the cell than inside. For example, membrane proteins such as cytochrome oxidases use energy from respiration to pump protons across the cell membrane and out of the cell, generating a proton gradient. The proton gradient (ΔpH) plus the charge difference (voltage potential) across the membrane form an electrochemical potential. When this electrochemical potential includes a proton gradient, it is also called the proton potential, or proton motive force (detailed in Chapter 14). The energy stored in the proton motive force can be used by specific transport proteins to move nutrients into the cell (see Section 3.3), to directly drive motors that rotate flagella, and to drive the synthesis of ATP by a membrane-embedded ATP synthase (Fig. 4.3).
FIGURE 4.3 ■ Bacterial membrane ATP synthase. The F o portion of the F 1 F o complex of ATP synthase is embedded in the cell membrane. The F 1 complex protrudes into the cytoplasm. Protons passing through the F o complex drive rotation of the c-ring and the F 1 gamma rotor. Structural changes that result in the alpha subunit of the F 1 complex activate ATP synthase activity.
The membrane-embedded F-ATP synthase, also called F 1 F o ATP synthase, provides most of the ATP for aerobic respiring cells such as E. coli. Essentially the same complex mediates ATP generation in our own mitochondria. ATP synthase is a complex of many different proteins. The enzyme includes a channel (F) that allows H + to
o
move across the membrane and drive rotation of the ATP c-ring. Rotation of the c-ring causes changes in the F 1 complex that mediate formation of ATP. The idea that a living organism could contain rotating parts was controversial when such parts were first discovered in bacterial flagella (discussed in Section 3.6). The role of the proton potential in metabolism is discussed in detail in
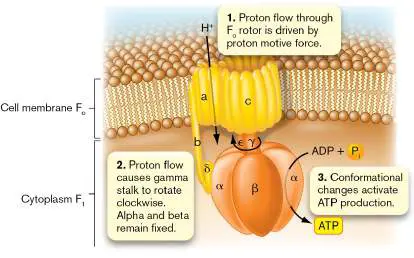
Chapters 13 and 14. Note, too, that some bacteria living in alkaline environments use a different form of ion motive force involving Na +, called sodium motive force (see Chapter 5).
The Nitrogen Cycle
Nitrogen is an essential component of proteins, nucleic acids, and other cell constituents, and as such, living cells require it in large amounts. So, how do bacteria get nitrogen? Nitrogen gas (N 2) makes up nearly 79% of Earth’s atmosphere, but most organisms cannot use nitrogen gas as a nitrogen source. The reason is that few organisms can break the highly stable triple bond holding the two nitrogen atoms together. For nitrogen to be used for growth, it must first be “fixed,” or converted to ammonium ions (NH +), a process
4
that requires considerable amounts of energy. Fortunately, a group of organisms called nitrogen-fixing bacteria can convert (or fix) nitrogen into NH +. The ammonium is then used by all microbes
4
to make amino acids and other nitrogen-containing compounds needed for growth (presented in Chapter 15).
Nitrogen-fixing bacteria may be free-living in soil or water or they may form symbiotic associations with plants or other organisms (see Chapter 21). A symbiont is an organism that lives in intimate association with a second organism. For example, Rhizobium, Sinorhizobium, and Bradyrhizobium species are nitrogen-fixing symbionts of leguminous plants such as soybeans, chickpeas, and clover (Fig. 4.4). Although symbionts are the most widely known nitrogen-fixing bacteria, the majority of nitrogen in soil and aquatic environments is fixed by free-living bacteria and archaea.
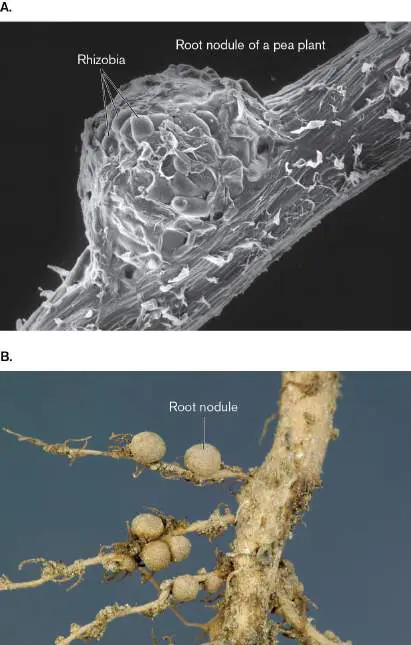
FIGURE 4.4 ■ Rhizobium and a legume. A. Symbiotic Rhizobium cells forming a nodule on a pea plant root (SEM). The rhizobia (about 0.9 μm × 3 μm) invade the root and begin a symbiotic partnership that will benefit both organisms. B. Root nodules. After the rhizobia invade the plant root, symbiosis between plant and microbe produces nodules.
DR. JEREMY BURGESS/SCIENCE SOURCE
INGA SPENCE/SCIENCE SOURCE
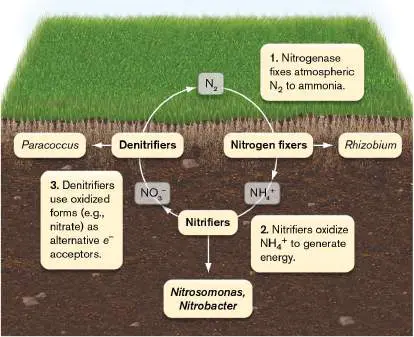
Once fixed into organic compounds, how does nitrogen get back into the atmosphere? As with the carbon cycle, various groups of organisms collaborate to recycle ammonium ions and nitrate ions (NO −) into nitrogen gas in what is called the nitrogen cycle, and
3
they collect energy in the process (Fig. 4.5). One group of bacteria, called the nitrifiers (Nitrosomonas, Alcaligenes, and Nitrobacter), gains energy by converting, or oxidizing, ammonia in two steps to form nitrate in a process called nitrification. Nitrification is a form of lithotrophy. Other heterotrophic microbes (for example, Paracoccus) can reduce nitrate to N 2 via denitrification, a process that uses nitrate and related inorganic forms of nitrogen as terminal electron acceptors for certain electron transport chains. Denitrifying bacteria send an amount of nitrogen into the atmosphere that roughly balances the amount removed by nitrogen fixation. Like the carbon cycle, the nitrogen cycle illustrates how nature manages to replenish planet Earth. For the environmental significance of nitrogen metabolism, see Chapter 22. FIGURE 4.5 ■ The nitrogen cycle. Different sets of bacteria fix nitrogen from atmospheric nitrogen gas (N 2) to form ammonia (NH) or ammonium (NH +), convert NH + to
3 4 4
nitrate (NO −), and return N to the atmosphere.
3 2
To Summarize
Microorganisms require certain essential macronutrients and micronutrients to grow.
Autotrophs use CO 2 as a carbon source, either through photosynthesis or through lithotrophy, and make organic compounds as biomass.
Heterotrophs consume the organic compounds made by autotrophs to gain carbon.
Energy gained by phototrophy or chemotrophy is stored either as ion motive forces (such as PMF) or as chemical energy (ATP).
Nitrogen fixers (only bacteria and archaea) incorporate nitrogen into biomass and contribute organic nitrogen to the rest of the ecosystem.
Chemotrophic nitrifying bacteria gain energy by converting NH + (made by nitrogen-fixing bacteria) into
4
nitrate and nitrite.
Heterotrophic denitrifying organisms use nitrate and nitrite as electron acceptors to make nitrogen gas.
Glossary
essential nutrient A compound that an organism cannot synthesize and must acquire from the environment in order to survive.
macronutrient A nutrient that an organism needs in large quantity. cofactor A metallic ion or a coenzyme required by an enzyme to perform normal catalysis.
micronutrient A nutrient that an organism needs in small quantity, typically a vitamin or a mineral.
heterotrophy Also called chemoorganoheterotrophy. The use of external sources of organic carbon compounds for biosynthesis. autotrophy The metabolic reduction of carbon dioxide to produce organic carbon for biosynthesis.
organotrophy Also called chemoorganotrophy or chemoheterotrophy. The metabolic oxidation of organic compounds to yield energy without absorption of light.
phototrophy The use of chemical reactions powered by the absorption of light to yield energy.
chemotrophy Metabolism that yields energy from oxidation-reduction reactions without using light energy.
autotrophy The metabolic reduction of carbon dioxide to produce organic carbon for biosynthesis.
chemolithoautotrophy Metabolism in which single-carbon compounds are fixed into organic biomass, using energy from chemical reactions without light absorption.
photolithoautotrophy (or photoautotrophy)
A form of metabolism that yields energy from light absorption and uses that energy to fix CO 2 into biomass.
heterotrophy Also called chemoorganoheterotrophy. The use of external sources of organic carbon compounds for biosynthesis. chemoorganoheterotrophy A form of metabolism that uses organic carbon sources to obtain energy and build biomass. Also called heterotrophy. photoorganotrophy A form of metabolism that obtains energy either from the catabolism of organic compounds or through the absorption of light.
membrane potential Energy stored as an electrical voltage difference across a membrane.
electrochemical potential A type of potential energy formed by the combined concentration gradient of a molecule and the electrical potential across a membrane.
proton potential or proton motive force (PMF)
The potential energy of the concentration gradient of protons (hydrogen ions; H +) plus the charge difference across a membrane.
proton motive force or proton motive force (PMF)
The potential energy of the concentration gradient of protons (hydrogen ions; H +) plus the charge difference across a membrane.
ATP synthase A protein complex that synthesizes ATP from ADP and inorganic phosphate using energy derived from the transmembrane proton potential. It is located in the prokaryotic cell membrane and in the mitochondrial inner membrane.
Photoautotrophy The fixation of single-carbon compounds into organic biomass, using light as an energy source.
nitrogen-fixing bacterium A bacterium that can reduce diatomic nitrogen gas (N 2) to two molecules of ammonium ion (NH +).
4
symbiont An organism that lives in a close association with another organism.
nitrification The oxidation of reduced nitrogen compounds to nitrite or nitrate.
lithotrophy Also called chemolithotrophy. The metabolic oxidation of inorganic compounds to yield energy and fix single-carbon compounds into biomass.
denitrification Also called dissimilatory nitrate reduction. Energy-yielding metabolism in which nitrate (NO −) is reduced to nitrite (NO
3 2
−), diatomic nitrogen (N), and in some cases ammonia (NH
2 3
).
4.2 Nutrient Uptakenot assigned
How do bacteria gather nutrients? Whether a microbe swims by flagella toward a favorable habitat or, lacking motility, drifts through its environment, the organism must be able to find nutrients and move them across the membrane into the cytoplasm. The membrane, however, presents a daunting obstacle. Membranes separate what is outside the cell from what is inside. So, for a cell to gain sustenance from the environment, the membrane must be selectively permeable to nutrients the cell can use. A few compounds, such as oxygen and carbon dioxide, can passively diffuse across the membrane, but most cannot.
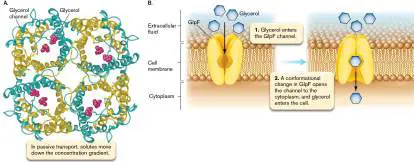
Selective permeability is achieved in three ways: Membrane-spanning protein channels, or pores (porins; Chapter 3), that discriminate between substrates of certain sizes or chemical composition, and then permit those substances to enter into the cell. Facilitated diffusion, shown in Figure 4.6, is one such mechanism.
Substrate-specific carrier proteins (permeases) that span the cytoplasmic membrane and transport substrates into the cell. Nutrient-binding proteins that sample the external environment (Gram-positive bacteria) or the periplasmic space (Gram-negative bacteria) for specific nutrients, and then pass those nutrients to specific permeases in the membrane.
FIGURE 4.6 ■ Facilitated diffusion. A. The glycerol transporter of E. coli, viewed from the external side of the membrane, consists of four channels that span the cell membrane. Each channel (blue and yellow) can transport two glycerol molecules (magenta) at a time. (PDB code: 1FX8) B. Facilitated diffusion of glycerol through GlpF. The protein facilitates the movement of glycerol from outside the cell (where the concentration of glycerol is high) to inside the cell (where the concentration of glycerol is low).
Microbes must also overcome the problem of low nutrient concentrations in the natural environment. If the intracellular concentration of a nutrient never rose higher than the extracellular concentration, the cell would starve in low-nutrient environments. To solve this dilemma, most organisms have evolved efficient transport systems that concentrate nutrients inside the cell relative to outside. However, moving molecules against a concentration gradient requires some form of energy.
In contrast to environments where nutrients are available but exist at low concentrations (for example, most aquatic environments), certain habitats have plenty of nutrients but those nutrients are locked in a form that cannot be transported into the cell. Starch, a large, complex carbohydrate, is but one example. Many microbes unlock these nutrient “vaults” by secreting digestive enzymes that break down complex carbohydrates or other
molecules into smaller compounds that are easier to transport. The amazing mechanisms that cells use to extrude these large digestive proteins through the membrane and into their surrounding environment are discussed in Chapter 8.
Facilitated Diffusion
Although most transport systems use cellular energy to bring compounds into the cell, a few do not. Facilitated diffusion transports nutrients across a membrane only from a compartment of higher concentration to a compartment of lower concentration. The best these passive systems can do is to equalize the internal and external concentrations of a solute. Facilitated diffusion systems are used for compounds that are either too large or too polar to diffuse on their own. The most important facilitated diffusion transporters are those of the aquaporin family that transport water and small polar molecules such as glycerol, which is used for energy and for building phospholipids. Glycerol transport is performed by an integral membrane protein in Escherichia coli called GlpF. The structure of a glycerol channel is shown in Figure 4.6A, where the complex is viewed from the outer face of the membrane. The complex is a tetramer of four channels, each of which transports a glycerol molecule.
In the membrane, GlpF reversibly (and randomly) assumes two conformations. One form exposes the glycerol-binding site to the external environment; the second form exposes this site to the cytoplasm. When the concentration of glycerol is greater outside than inside the cell, the form with the binding site exposed to the exterior is more likely to find and bind glycerol. After binding glycerol, GlpF changes shape, closing itself to the exterior and opening to the interior (Fig. 4.6B ). Bound glycerol is released and diffuses into the cytoplasm (influx). Of course, this form of GlpF could also bind a glycerol molecule in the cytoplasm and release it outside the cell. Thus, once the cytoplasmic concentration of glycerol equals the concentration outside the cell, bound glycerol can be released to either compartment. However, the cell consumes the glycerol as it enters the cytoplasm, keeping cytoplasmic concentrations of glycerol low; thus, facilitated diffusion normally promotes glycerol influx.
Active Transport Requires Energy
Most forms of transport expend energy to take up molecules from outside the cell and concentrate them inside. The ability to import nutrients against their natural concentration gradients is critical in aquatic habitats, where nutrient concentrations are low, and in soil habitats, where competition for more plentiful nutrients is fierce because of high cell numbers.
The simplest way to move molecules against their gradient across a membrane is to exchange the energy of one chemical gradient for that of another. The most common chemical gradients used are those of ions, particularly the positively charged ions Na+ and K+. These ions are kept at different concentrations on either side of the cell membrane. When an ion moves down its concentration gradient (from high to low), energy is released. Some transport proteins harness that free energy and use it to drive transport of a second molecule up, or against, its concentration gradient in the process called coupled transport.
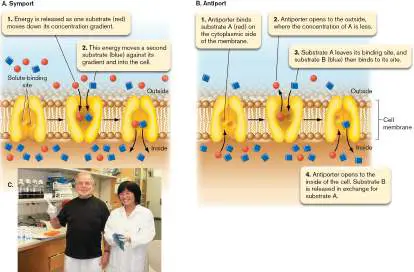
The two types of coupled transport systems are symport, in which the two molecules travel in the same direction (Fig. 4.7A), and antiport, in which the actively transported molecule moves in the direction opposite that of the driving ion (Fig. 4.7B ). An example of a symporter is the lactose permease LacY of E. coli, one of the first transport proteins to have its function elucidated. This work was carried out by the pioneering membrane biochemist H. Ronald Kaback (1936–2019) of UCLA (Fig. 4.7C ). LacY moves lactose inward, powered by a proton that is also moving inward (symport). LacY proton-driven transport is said to be electrogenic because an unequal distribution of charge results (for example, symport of an uncharged lactose molecule with a H + results in net movement of positive charge).
FIGURE 4.7 ■ Coupled transport. In both symport (A) and antiport (B) substrate B (blue) is taken up against its gradient because of the energy released by substrate A (red) traveling down its gradient. (C) Ronald Kaback (left) elucidated the mechanism of transport by the proton-driven lactose symporter LacY.
COURTESY OF RONALD KABACK, UCLA
An example of electroneutral coupled transport, in which there is no net transfer of charge, is that of the Na + /H + antiporter, which couples the export of Na + with the import of a proton (antiport). Because molecules of like charges are merely exchanged, there is no net movement of charge. Sodium exchange is important for all organisms and is particularly critical for organisms living in high-salt habitats (see Section 5.2).
Thought Questions
4.2 How could a symport transporter produce electroneutral coupled transport?
4.3 How might mutations in transporter gene sequences influence bacterial survival under different conditions; for example, normal versus very low glucose concentrations?
Symport and antiport transport proteins function by alternately opening one end or the other of a channel that spans the cell membrane. The interior of the channel contains solute-binding sites (Fig. 4.7Aand B ). When the channel opens up to the high-concentration side of the membrane, the driving ion (solute) attaches to the binding sites. The transport protein then changes shape to open that site to the low-concentration side of the membrane, and the ion leaves. When and where the second (cotransported) solute binds depends on whether the transport protein is an antiporter or a symporter.
With all this ion traffic across the membrane going on, a careful accounting must be kept of how many ions are inside the cell relative to outside. The cell must recirculate ions back and forth across the membrane to maintain certain gradients if the organism is to survive. Because key ATP-producing systems require an electrochemical gradient across the membrane, it is especially important to keep the interior of the cell negatively charged relative to the exterior. However, because the movement of many compounds is coupled to the import of positive ions, the electrochemical gradient will eventually dissipate, or depolarize, unless positive ions are also exported. Complete depolarization must be avoided, because a depolarized cell loses membrane integrity and cannot carry out the transport functions needed to sustain growth. A healthy cell maintains a proper charge balance by using the electron transport chain and ATP synthase to move protons out of and into the cell, respectively, and antiporters to exchange negatively and positively charged ions as needed. Each symport and antiport protein links the transport of two different ions. However, the movement of two different ions can also be linked indirectly by two different transport systems. Indirectly linking ion transport will prevent depolarization, as illustrated by the example in Figure 4.8. Proton concentrations are typically greater outside the cell than inside, and the inwardly directed proton gradient is called proton motive force. Proton motive force can impel the exit of Na + through the Na + /H + antiporter. The resulting Na + gradient can then drive the symport of amino acids into the cell. In this case, Na + moves back into the cell down its gradient, and the energy released is tied to the import of an amino acid against its gradient. The end result is that an amino acid is transported without changing intracellular ion concentration or charge.
FIGURE 4.8 ■ Maintaining ion gradients. These three ion transporters are collaborating to maintain ion gradients while still accomplishing work; in this case, the transport of an amino
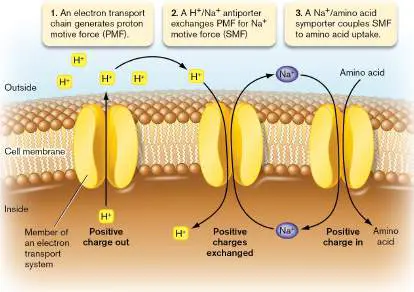
acid into the cell. When viewed as a group, the net outcome of the three transport systems is electroneutral. SMF = sodium motive force.
ABC Transporters Are Powered by ATP
As we pointed out in Section 3.2, a major function of proton transport is to form the proton motive force that powers ATP synthesis (for details on the proton motive force, see Chapter 14). The energy stored in ATP can then drive membrane transport of nutrients.
The largest family of energy-driven transport systems is the A TP-b inding c assette superfamily, also known as ABC transporters ( Fig. 4.9). These transporters are found in bacteria, archaea, and eukaryotes. All of them appear to have arisen from a common ancestral porter, so they share a considerable amount of amino acid sequence homology. Many different ABC transporters mediate the import or export of a wide variety of substrates.
FIGURE 4.9 ■ ABC (ATP-binding cassette) transporter in a Gram-negative organism. In Gram-positive bacteria without
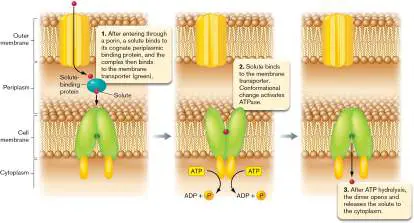
an outer membrane or periplasm, the solute-binding protein would be attached to the cell surface.
It is impressive that nearly 5% of the E. coli genome is dedicated to producing the components of 79 different varieties of uptake and efflux ABC transporters. The uptake ABC transporters are critical for transporting simple carbon sources such as the carbohydrates maltose, arabinose, and galactose, as well as the amino acid histidine. Other uptake ABC transporters can import long-chain carbohydrates such as the acidic polysaccharide alginate. For instance, the marine hyperthermophilic bacterium Thermotoga maritima utilizes the ABC transporter AguEFG to import alginate as a carbon source. Alginate, a major component of brown seaweed, is being examined as an alternative source of bioethanol. Bacteria that import alginate and ferment the carbohydrate to ethanol will be critical to this effort.
Efflux ABC transporters are generally used as multidrug efflux pumps that protect microbes from hazardous chemicals. Pseudomonas aeruginosa, a pathogenic bacterium found in soil and water habitats, uses numerous multidrug efflux pumps (including ABC transporters) to export a broad range of antibiotics, including tetracyclines, streptogramins, quinolones, macrolides, and aminoglycosides, thus conferring resistance to those drugs (see Section 27.3).
An ABC transporter typically consists of two hydrophobic membrane proteins and two cytoplasmic proteins that contain a highly conserved amino acid motif, called the ATP-binding cassette, that binds ATP (Fig. 4.9). The uptake systems (but not the efflux systems) possess an additional, extracytoplasmic protein called a substrate-binding protein that initially binds the substrate. (Note that substrates are also called solutes.) In Gram-negative bacteria, these substrate-binding proteins float in the periplasmic space between the inner and outer membranes. In Gram-positive bacteria, which lack an outer membrane, the proteins must be tethered to the cell surface.
ABC transport systems that import nutrients (Fig. 4.9) start with the substrate-binding protein snagging the appropriate solute, either as it floats by a Gram-positive microbe or as the molecule enters the periplasm of a Gram-negative cell. Most substrates nonspecifically enter the periplasm of Gram-negative organisms through the outer membrane pores (porins). Because substrate-binding proteins have a high affinity for their cognate (matched) solutes, their use increases the efficiency of transport when concentrations of solute are low.
Once united with its solute, the binding protein binds to the periplasmic face of the cytoplasmic membrane channel protein and releases the solute, which now moves to a site on the channel protein. This interaction triggers a structural (or conformational) change in the channel protein (the green “membrane transporter” in Fig. 4.9) that is telegraphed to, and affects, the ATP-binding proteins on the cytoplasmic side (yellow). On receiving this signal, the ATP-binding proteins start hydrolyzing ATP and send a return conformational change through the channel, signaling the channel to open its cytoplasmic side and allow the solute to enter the cell.
Siderophores Are Secreted to Scavenge Iron
Iron, an essential nutrient of most cells, is largely locked up in nature as insoluble Fe(OH) 3, which is unavailable for transport. Many bacteria and fungi have solved this transport dilemma by synthesizing and secreting specialized molecules called siderophores (Greek for “iron bearer”), which have a very high affinity for the small amounts of soluble ferric iron available in the environment. These iron scavenger molecules are produced and secreted by cells when the intracellular iron concentration is low (Fig. 4.10). FIGURE 4.10 ■ Siderophores and iron transport. This model shows how the E. coli siderophore called enterochelin captures ferric iron in the environment and is transported into the cytoplasm. In the cytoplasm, ferric ion is released from enterochelin and reduced to ferrous ion.
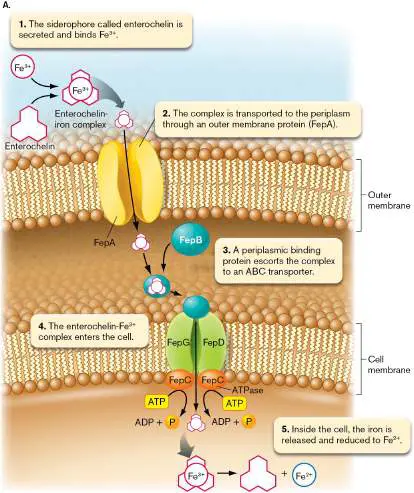
In most Gram-negative organisms, the siderophore (for example, enterochelin in E. coli) binds iron in the environment, and the siderophore-iron complex then attaches to specific receptors in the outer membrane. At this point, either the iron is released directly and is passed to other transport proteins or the complex is transported across the cytoplasmic membrane by a dedicated ABC transporter. The iron is released intracellularly and reduced from Fe 3+ to Fe 2+ for biosynthetic use.
Other Gram-negative microorganisms, such as Neisseria gonorrhoeae (the causative agent of gonorrhea), do not use siderophores at all but instead employ receptors on their surface that bind human iron complexes (for example, transferrin or lactoferrin) and snatch the iron from them. Because microbial iron-transporting proteins are critical to the pathogenesis of many microbes, solving the molecular structures of these proteins is of great interest. Such structural studies can expose vulnerabilities in the transport proteins that we can use in designing new antibiotics that stop iron transport.
Scientists are also interested in using siderophores directly as antimicrobial agents. Janet Wu and colleagues at the Cleveland Clinic have studied cefiderocol, a combination siderophore-cephalosporin that is effective on a wide variety of antibiotic-resistant, Gram-negative pathogens such as Acinetobacter baumannii and Klebsiella pneumoniae. The drug, synthesized in 2018, received U.S. Food and Drug Administration approval in 2020 for the treatment of complicated urinary tract infections such as pyelonephritis (kidney infection). How does it work? The siderophore part of cefiderocol binds to iron in the environment and uses the pathogen’s iron-siderophore transport system to enter the periplasm. Once in the periplasm, the drug’s cephalosporin side chains bind to cell wall–building proteins (called penicillin-binding proteins), even those resistant to other antibiotics, and inhibit peptidoglycan synthesis. The drug also resists hydrolysis by many enzymes that degrade commonly used cephalosporins. The discovery of this new class of potent antibiotic illustrates the power of understanding bacterial physiology.
Group Translocation Avoids “Uphill” Battles
The uptake transporters that we have just considered increase a solute’s concentration inside the cell relative to the outside. They move nutrients “uphill” against a concentration gradient. An entirely different system, known as group translocation, cleverly accomplishes the same result but without really moving a substance uphill. Group translocation alters the substrate during transport by attaching a new group (for example, phosphate) to it. Because the modified nutrient inside the cell is chemically different from the related compound outside, the parent solute entering the cell is always moving down its concentration gradient, regardless of how much solute has already been transported. Note that this process uses energy to chemically alter the solute. ABC transporters and group translocation systems both involve active transport, but group translocation systems are not ABC transporters.
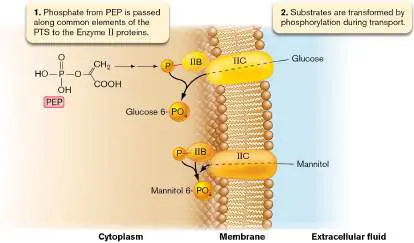
The phosphotransferase system (PTS) is a well-characterized group translocation system present in many bacteria. It uses energy from phosphoenolpyruvate (PEP), an intermediate in glycolysis, to attach a phosphate to specific sugars during their transport into the cell (Fig. 4.11). Glucose, for example, is converted during transport to glucose 6-phosphate. The system has a modular design that accommodates different substrates. Protein elements that initiate phosphotransfer from PEP are used for all sugars transported by the PTS (Fig. 4.11, step 1). PTS proteins that complete transport, however, are unique to a given carbohydrate (step 2). For example, different Enzyme IIB and membrane-embedded Enzyme IIC proteins transfer phosphate to glucose and mannitol during transport. Because the sugar (glucose, for instance) is phosphorylated during transport, glucose itself never accumulates in the cytoplasm. As a result, the sugar transported via the PTS always travels down its concentration gradient into the cell. In Chapter 10 we will see how this physiological system influences the genetic control of many other systems.
FIGURE 4.11 ■ Group translocation: the phosphotransferase system (PTS) of E. coli. The phosphate group from phosphoenolpyruvate (PEP) is ultimately passed along proteins common to all PTS sugar transport systems and to Enzyme II components of the PTS that are specific to individual substrates (such as glucose or mannitol). The substrate is then phosphorylated during transport, making it different from the external sugar. As a result, the sugar is always traveling down its concentration gradient into the cell.
Like prokaryotic cells, eukaryotic cells possess antiporters and symporters and use ABC transport systems as multidrug efflux pumps. But eukaryotes also employ another process, called endocytosis, which often precedes nutrient transport across membranes. Endocytosis is discussed in eAppendix 2.
To Summarize
Transport systems move nutrients across phospholipid bilayer membranes.
Facilitated diffusion helps solutes move across a membrane from a region of high concentration to one of lower concentration.
Antiport and symport are coupled transport systems in which energy released by moving a driving ion (H + or Na +) from a region of high concentration to one of low concentration is harnessed and used to move a solute against its concentration gradient.
ABC transporters use the energy from ATP hydrolysis to move solutes “uphill,” against their concentration gradients. Siderophores are secreted to bind ferric iron (Fe 3+) and transport it into the cell, where it is reduced to the more useful ferrous form (Fe 2+). Siderophore-iron complexes enter cells with the help of ABC transporters.
Group translocation systems use energy to chemically modify the solute during transport.
Glossary
permease A substrate-specific carrier protein in the membrane. facilitated diffusion A process of passive transport across a membrane that is facilitated by transport proteins.
coupled transport The movement of a substance against its electrochemical gradient (from lower to higher concentration or from opposite charge to like charge) using the energy provided by the simultaneous movement of a different chemical down its electrochemical gradient.
symport Coupled transport in which the molecules being transported move in the same direction across the membrane.
antiport Coupled transport in which the molecules being transported move in opposite directions across the membrane.
ABC transporter An ATP-powered transport system that contains an ATP-binding cassette.
siderophore A high-affinity iron-binding protein used to scavenge iron from the environment and deliver it to a siderophore-producing organism.
group translocation A form of active transport in which the transported molecule is modified after it enters the cell, thus keeping a favorable inward concentration gradient for the unmodified extracellular molecule.
phosphotransferase system (PTS)
A group translocation system that uses phosphoenolpyruvate to transfer phosphoryl groups onto the incoming molecule.
4.3 Culturing and Counting BacteriaUnit 1 · Methods
How do we capture bacteria and study them? Microbes in nature usually exist in complex, multispecies communities (Fig. 4.12). For detailed studies of a single species, however, cells of the species are usually grown in pure culture. In this section we will describe how that is done. But after over 140 years of trying to grow microbes in the laboratory, the vast majority of the microbial world (85%–99%) has yet to be cultured—although we will discuss some new, innovative methods that enable us to culture at least some of these uncultured microbes.
FIGURE 4.12 ■ Separation and growth of microbes on an agar surface. Agar plate culture made from swabbing patient elevator buttons and escalator rails at a university hospital. The cotton end of the swab was rolled over the surface of a nutrient
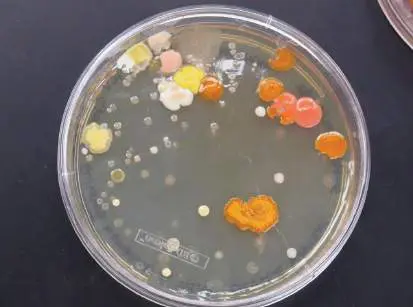
agar plate, and the plate was incubated for several days. Note the various colony shapes and colors made by different species of microbes.
https://commons.wikimedia.org/wiki/File:VCU_agar_plate_colonie s.jpg https://creativecommons.org/licenses/by-sa/3.0/legalcode
COURTESY WIKIMEDIA COMMONS
Bacteria Are Grown in Culture Media
For those organisms that can be cultured, we have access to a variety of culturing techniques that can be used for different purposes. Bacterial culture media may be either liquid or solid. A liquid, or broth, medium, in which organisms can move about freely, is useful for studying the growth characteristics of a single strain of a single species (that is, a pure culture). Liquid media are also convenient for examining growth kinetics and microbial biochemistry at different phases of growth. Solid media, usually gelled with agar, are useful for trying to separate mixtures of different organisms as they are found in the natural environment or in clinical specimens (Fig. 4.12).
Dilution Streaking and Spread Plates
Solid media are basically liquid media to which a solidifying agent has been added. The most versatile and widely used solidifying agent is agar (discussed in Section 1.3). Derived from seaweed, agar forms an unusual gel that liquefies at 100°C but does not solidify again until cooled to about 40°C. Liquefied agar medium poured into shallow, covered Petri dishes cools and hardens to provide a large, flat surface on which a mixture of microorganisms can be streaked to separate individual cells. Each cell will divide and grow to form a distinct, visible colony of cells. A cotton swab or an inoculating loop can be used to collect a sample and apply it to an agar surface.
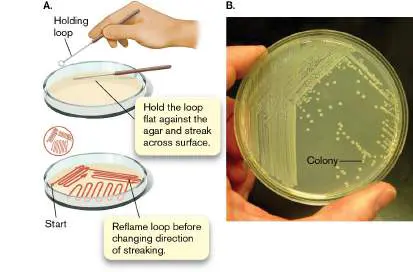
As shown in Figure 4.13A, a drop of liquid culture is collected with an inoculating loop and streaked across the agar plate surface in a pattern called dilution streaking , or streak plating. Organisms fall off the loop as the loop moves along the agar surface. Toward the end of the streak, few bacteria remain on the loop, so individual cells will land and stick to different places on the agar surface. If the medium contains the proper nutrients and growth factors, a single cell will multiply into many millions of offspring, forming a microcolony. At first visible only under a microscope, the microcolony grows into a visible droplet called a colony (Fig. 4.13B ). A pure culture of the species or of one strain of a species can be obtained by touching a single colony with a sterile inoculating loop and inserting that loop into fresh liquid medium.
FIGURE 4.13 ■ Dilution streaking technique. A. A liquid culture is sampled with a sterile inoculating loop and streaked across the plate in three or four areas, with the loop flamed between areas to kill bacteria still clinging to it. Dragging the loop across the agar diminishes the number of organisms clinging to the loop, until only single cells are deposited at a given location. B. Salmonella enterica culture obtained by dilution streaking.
JOHN FOSTER, UNIVERSITY OF SOUTH ALABAMA
Another way to isolate pure colonies is the spread plate technique. Starting from a liquid culture of bacteria, a series of tenfold dilutions is made, and a small amount of each dilution is placed directly on the surface of separate agar plates (Fig. 4.14). The sample is spread over the surface of the plate with an alcohol flame–sterilized, bent glass rod or a sterile disposable spreader. Alternatively, sterile glass beads placed on the agar plate can be shaken to spread the culture across the plate. The early dilutions, those containing the most bacteria, will produce confluent growth that covers the entire agar surface. Subsequent dilutions, containing fewer and fewer organisms, yield individual colonies. As we will see, spread plates are often used to enumerate the number of viable bacteria in the original growth tube. A viable organism, also called culturable, is one that successfully replicates to form a colony. Thus, each colony on an agar plate represents one viable organism (or colony-forming unit; CFU) present in the original liquid culture . Generally, only plates containing 30–300 colonies produce an accurate count of cell numbers. Figure 4.14illustrates how to enumerate viable cells using dilutions and spread plates.
FIGURE 4.14 ■ Tenfold dilutions, plating, and viable counts. A. A culture containing an unknown concentration of cells is serially diluted. First 1 milliliter (ml) of culture is added to 9 ml
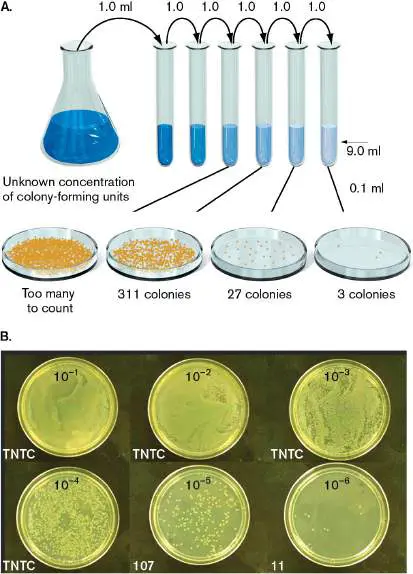
of diluent broth and mixed, and then 1 ml of this 1/10 dilution is added to another 9 ml of diluent (10 −2 dilution). These steps are repeated for further dilution, each of which lowers the cell number tenfold. After dilution, 0.1 ml of each dilution is spread onto an agar plate. B. Plates prepared as in (A) are incubated at 37°C to yield colonies. By multiplying the number of countable colonies (107 colonies on the 10 −5 plate) by 10, we get the number of cells in 1.0 ml of the 10 −5 dilution. By multiplying that number by the reciprocal of the dilution factor, we can calculate the number of cells (colony-forming units, or CFUs) per milliliter in the original broth tube (107 × 10 1 × 10 5 = 1.1 × 10 8 CFUs/ml). TNTC = too numerous to count.
JOHN FOSTER, UNIVERSITY OF SOUTH ALABAMA
It is important to realize that the “one cell equals one colony” paradigm does not hold for all bacteria. Organisms such as Streptococcus and Staphylococcus usually do not exist as single cells but instead grow as chains or clusters of several cells. Thus, a cluster of ten Staphylococcus cells will form only one colony on an agar medium and so is also called a colony-forming unit.
Complex versus Synthetic Media
We often culture bacteria in a type of medium called complex medium (or rich medium) that is nutrient-rich but has poorly defined components, such as yeast (Table 4.1). Alternatively, we can select a defined or synthetic medium in which all of the chemical components and their concentrations are known. Bacteria grow more slowly on defined media because the organisms must synthesize more of their own components. A minimal defined medium contains only those nutrients that are essential for growing a given microbe. However, not every microbe that can be cultured on a complex medium can be grown on a defined medium. Recipes for complex media usually contain several ingredients, such as yeast extract or beef extract, that provide a rich variety of amino acids, peptides, nucleosides, vitamins, and some sugars. Some organisms are particularly fastidious, requiring that components of blood be added to a basic complex medium. With such additions, the complex medium is called an enriched medium.
TABLE Composition of Commonly Used
4.1 Media
Medium Ingredients Organisms per liter cultured Lysogeny Bacto 10 g Many Gram-broth; also tryptone a 5 g negative and called Luria Bacto yeast 10 g Gram-positive Bertani extract organisms broth NaCl (such as (complex) Adjust to pH Escherichia coli 7 and Staphylococcus aureus, respectively)
M9 medium Glucose 2.0 g Gram-negative (defined) Na 2 HPO 4 6.0 g (42 organisms KH 2 PO 4 mM) such as E. coli NH Cl 3.0 g (22
4
mM)
NaCl 1.0 g (19 MgSO 4 mM)
CaCl 2 0.5 g (9 Adjust to pH mM)
7 2.0 mM 0.1 mM TABLE Composition of Commonly Used
4.1 Media
Sulfur NH 4 Cl 0.52 g Acidithiobacillus oxidizers KH 2 PO 4 0.28 g thiooxidans (defined) MgSO • 7H 0.25 g
4 2
0.07 g O 1.56 g CaCl 2 Elemental sulfur Grown in an atmosphere of 5% CO 2.
Adjust to pH 3 Complex media provide many of the chemical building blocks that a cell would otherwise have to synthesize on its own. For example, instead of making proteins that synthesize tryptophan, all the cell needs is a membrane transport system to harvest tryptophan already present in complex culture medium. Likewise, fastidious organisms that require blood in their media may reclaim the heme released from red blood cells as their own, using it as an “enzyme prosthetic group,” a group critical to enzyme function (for example, the heme group in cytochromes). All of this saves the scavenging cell a tremendous amount of energy, and as a result, bacteria tend to grow fastest in complex media.
Complex medium is not useful, however, to scientists trying to determine the metabolism of a microbe. How would you know whether Escherichia coli possesses the ability to make tryptophan if the bacterium was grown only in complex media? Questions like this can be asked of organisms able to grow in fully defined synthetic media. In preparing a synthetic medium, we start with water and then add various salts, carbon, nitrogen, and energy sources in precise amounts. For self-reliant organisms such as E. coli or Bacillus subtilis, that is all that’s needed. Other organisms, such as Shigella species or mutant strains of E. coli or B. subtilis, require additional ingredients to satisfy requirements imposed by the absence of specific metabolic pathways (growth factors are discussed shortly). However, newer molecular tools, such as whole-genome sequencing, can reveal missing biosynthetic pathways and help predict which nutrients are needed for a particular species to grow in a synthetic medium.
Thought Question
4.4 Describe the phenotype (growth characteristic) of a cell that lacks the trp genes (genes required for the synthesis of tryptophan). What would be the phenotype of a cell missing the lac genes (genes whose products catabolize the carbohydrate lactose)?
Selective, Differential, and Enrichment Media
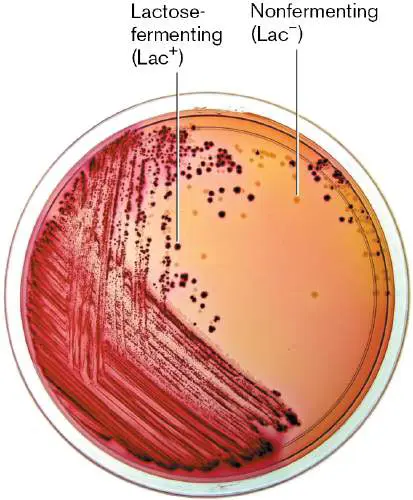
Microorganisms are remarkably diverse with respect to their metabolic capabilities and resistance to certain toxic agents. These differences are exploited in selective media and enrichment media, which favor the growth of one organism over another, and in differential media, which expose biochemical differences between two species that grow equally well. For example, Gram-negative bacteria (such as Proteobacteria), with their outer membrane, are much more resistant than Gram-positive bacteria to detergents like bile salts and to certain dyes, such as crystal violet. A solid medium containing bile salts and crystal violet is considered selective because it favors the growth of Gram-negative over Gram-positive bacteria. On the other hand, a differential medium is needed to distinguish between organisms that differ not in their ability to grow, but in a particular biochemical function that they possess. For example, E. coli and Salmonella enterica, a major cause of diarrhea, are both Gram-negative, but only E. coli can ferment lactose. Both organisms will grow on a solid medium (MacConkey agar; Fig. 4.15) that contains lactose (a fermentable carbon source), peptone (a nonfermentable carbon source), and a dye called “neutral red.” E. coli will ferment the lactose and produce acidic end products. These products lower the pH surrounding the colony, so the neutral red dye stays red. The red dye also enters cells, so the growing colony of E. coli becomes red. However, S. enterica cannot ferment lactose but grows well on the nonfermentable peptides in MacConkey agar to make alkaline products. Neutral red is colorless at alkaline pH, so the colonies of S. enterica remain white, their natural color. In this example, growth in differential media easily distinguishes colonies of lactose fermenters (red) from nonfermenters (white).
FIGURE 4.15 ■ MacConkey medium, a culture medium both selective and differential. Only Gram-negative bacteria grow on lactose MacConkey (selective). Only a species capable of fermenting lactose produces pink colonies (differential), because only fermenters can take up the neutral red and peptones that are also in the medium. Gram-negative nonfermenters appear as uncolored or white colonies.
JOHN FOSTER, UNIVERSITY OF SOUTH ALABAMA
Several media used in clinical microbiology are both selective and differential. The MacConkey medium described here also contains bile salts and crystal violet to prevent the growth of Gram-positive bacteria and allow the growth of Gram-negative bacteria (Fig. 4.15 ). This medium is often used to identify bacteria that cause diarrheal disease because most normal microbiota that grow on this medium are lactose fermenters, whereas two important Gram-negative pathogens, Salmonella and Shigella, are lactose nonfermenters. Enrichment media are similar to selective media in that they both contain chemicals that either inhibit the growth of unwanted bacteria in a mixed-species sample or support the growth of a rare species in the sample. The two types of media differ in that selective media are typically agar plates, whereas enrichment media are liquid broths. For example, selenite broth is used for the selective enrichment of Salmonella species whose numbers in clinical and food samples may be too scarce to find, compared to environmental bacteria or microbiota, when cultured directly on agar. However, when inoculated into a selenite enrichment broth, the small numbers of Salmonella will multiply (enrich) because the selenite prevents growth of the others. The enrichment process increases the likelihood that the pathogen will be discovered when subcultured. Enrichment broth cultures can also be used to facilitate replication of rare bacteria in a complex natural ecosystem (soil, for instance) if the rare organism can consume a specific nutrient that other bacteria cannot metabolize. For example, an enrichment broth that includes a particular hydrocarbon as a sole carbon source will grow only those species capable of metabolizing that hydrocarbon. More information on enrichment culture is found in Chapter 21.
Thought Question
4.5 If lactose were left out of MacConkey medium (Fig. 4.15), would lactose-fermenting E. coli bacteria grow, and if so, what color would their colonies be?
Growth Factors and Uncultured Microbes
Why do some bacterial species fail to grow in minimal medium or fail to grow at all in the laboratory? Such failures are a consequence of evolution and of the organism’s natural growth environment. If an ecological niche continually provides a compound that a microbe would otherwise have to make, the relevant biosynthetic pathway for the compound becomes unnecessary. Random mutations can slowly degrade the pathway as long as the organism remains in that environment. However, once the defective species is removed from its natural niche and cultured in a laboratory, the organism will require that compound, also called a growth factor, in order to grow.
Growth factors (Table 4.2) are specific nutrients not required by other species. Why, for example, should Streptococcus pyogenes make glutamic acid or alanine if both are readily available in its normal environment, the human oral cavity? Because S. pyogenes never needs to make glutamic acid or alanine in its natural habitat, it lost the genes needed to synthesize these amino acids. For S. pyogenes to grow in the laboratory, the culture medium must contain alanine and glutamic acid along with the essential macronutrients and micronutrients mentioned earlier.
Growth Factors and Natural
TABLE 4.2 Habitats of Organisms
Associated with Disease
Organism Diseases Natural Growth habitats factors Abiotrophia Osteomyelitis Humans Vitamin K, and other cysteine animal species Bordetella Whooping Humans Glutamate, cough and other proline, animal cysteine species Francisella Tularemia Wild deer, Complex, rabbits cysteine Haemophilus Meningitis, Humans Hemin, NAD chancroid and other animal species, upper respirator y tract Legionella Legionnaires’ Soil, Cysteine disease refrigerati on cooling towers
Growth Factors and Natural
TABLE 4.2 Habitats of Organisms
Associated with Disease
Mycobacterium Tuberculosis, Humans Nicotinic acid leprosy (NAD), a alanine (M.
leprae is unculturable)
Shigella Bloody Humans Nicotinamide diarrhea (NAD) a Staphylococcus Boils, Widespread Complex osteomyeli requirement tis Streptococcus Pharyngitis, Humans Glutamate, pyogenes rheumatic alanine fever Some species have adapted so specifically to their natural habitats that we do not yet know how to grow them in the laboratory. As mentioned earlier, 85%–99% of bacterial species that are present in water or soil or that grow in or on animals will not form colonies on an agar plate. They are referred to as uncultured (previously called unculturable) organisms, or “microbial dark matter.” We know now that a subset of the uncultured organisms depends on growth factors, such as siderophores, provided by other species that cohabit their natural environment. Some of these factors even appear to act like hormones, somehow stimulating replication of the uncultured organism.
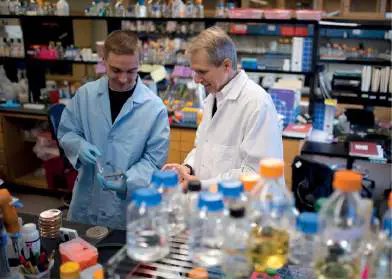
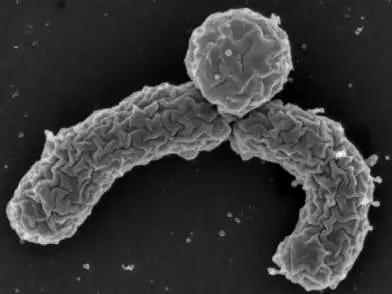
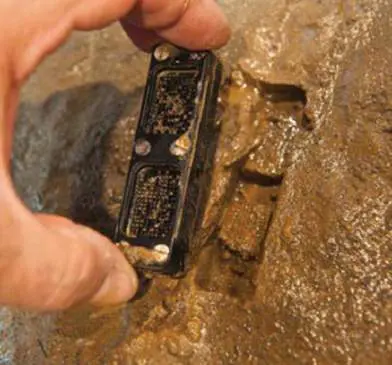
If a microbe cannot be cultured, how do we know it exists? All known microorganisms have a set of genes that encode the RNA molecules present in ribosomes. The ribosomal RNA molecules are highly conserved across the phylogenetic tree. A DNA-amplifying procedure called the polymerase chain reaction (PCR; described in eAppendix 3) can screen for the presence of these genes in soil and water samples. Comparing the DNA sequences of the PCR products from environmental samples with the DNA sequences of similar genes from known, culturable organisms reveals that nature harbors many undiscovered microbes. Even though we don’t know the growth and nutritional requirements of these phantom microbes, modern genomic techniques can expose their existence and can even provide remarkable insight into their physiologies (see Section 9.5). Today, new methods of culturing are being used to domesticate some of these uncultured species. For example, Kim Lewis at Northeastern University in Boston (Fig. 4.16A) and colleagues devised an elegant method to culture previously uncultured soil microbes. One such previously uncultured species is Eleftheria terrae (Fig. 4.16B ), which produces the novel antibiotic teixobactin, a peptide that is effective against Gram-positive but not Gram-negative bacteria. To find and culture this organism, Lewis’s lab diluted soil samples such that one bacterial cell was delivered into each agar-containing channel of a multichannel iChip (isolation chip; Fig. 4.16C ). Both sides of the inoculated iChip were then covered with semipermeable membranes and placed back into the soil, allowing nutrients and growth factors in the soil to diffuse into the chamber and stimulate uncultured microbes to form colonies (Fig. 4.16D ). Once cultured, many of the previously uncultured organisms suddenly were able to grow without further assistance. How that happens is not known. A similar technique was recently used to identify growth factors produced by a marine sponge that supported growth of uncultured marine sponge–associated bacteria (Special Topic 4). A B
C D
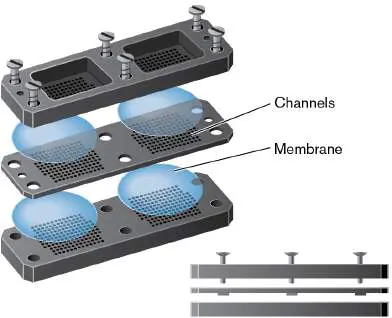
FIGURE 4.16 ■ In situ culturing of the uncultured. A. Kim Lewis (right), with postdoctoral researcher Brian Conlon. B. The recently discovered species Eleftheria terrae produces the novel antibiotic teixobactin. C. Schematic look at the iChip used to culture previously uncultured soil bacteria. D. The iChip being removed from soil.
© BROOKS CANADAY
KIM LEWIS/NORTHEASTERN UNIVERSITY
SLAVA EPSTEIN/NORTHEASTERN UNIVERSITY
A clever way to identify uncultured bacterial species that survive in nature by partnering with other bacteria is called co-occurrence analysis, but it could be named the “guilt by association” methodology. Kirsten Kusel (Friedrich Shiller University in Germany),
Patricia Geesink (currently at Wageningen University and Research; Fig. 4.17A), and their colleagues have been studying a group of tiny bacteria that are members of the Candidate Phyla Radiation (CPR). The microbes are called a “radiation” because they are an evolutionary offshoot, or radiation, of bacterial lineages. It is thought that members of this group of mostly uncultured bacteria compose up to 26% of the bacterial diversity on Earth. They are abundant in groundwater around the world and play key roles in sulfur and nitrogen recycling. However, the metabolism of these organisms is severely compromised in that they lack genes for amino acid, nucleotide, and lipid biosynthesis and have incomplete TCA cycles and electron transport chains. Those deficiencies can explain why they remain uncultured and suggest that individual species may have to partner with other microorganisms in the environment in order to survive.
Kusel’s team focused on candidate species Roizmanbacterium ADI133. Using a variety of genomic techniques, the scientists sequenced the bacterium’s genome and used quantitative PCR (qPCR) to track its distribution in oligotrophic groundwater over the course of a year. They observed a striking co-distribution of Roizmanbacterium with Thermodesulfovibrionia, another uncultured bacterium, suggesting that the two bacteria may partner in groundwater (Fig. 4.17B ). Innovative culturing of novel bacteria is discussed further in Chapters 18 and 19.
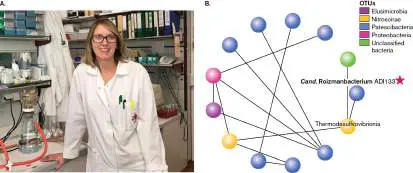
FIGURE 4.17 ■ Co-occurrence analysis of “ Candidatus Roizmanbacterium ADI133.” A. Patricia Geesink, Wageningen University and Research in the Netherlands, studies microbial evolution. B. Co-occurrence analysis over 29 groundwater samples was carried out with the 300 most abundant bacterial operational taxonomic units (OTUs). Absolute abundances of each OTU and of “ Cand. Roizmanbacterium ADI133” (indicated by the star symbol) were calculated on the basis of qPCR and amplicon sequencing of 16S rRNA genes. A line connecting two OTUs indicates they were both present (co-occurred) in a subset of samples. Only OTUs that were present in at least 14 of the 29 samples are represented in this figure. Across those samples, a co-occurrence was observed between “ Cand. Roizmanbacterium ADI133” and an uncultured Thermodesulfovibrionia. A second co-occurrence was noted with “ Candidatus Parcubacteria,” another member of the Candidate Phyla Radiation (not shown here).
PATRICIA GEESINK
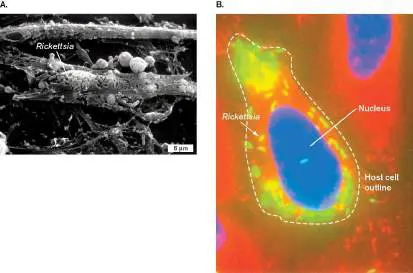
Another class of bacteria, known as obligate intracellular bacteria, could also be called uncultured because they, too, will not grow on laboratory media. These species first evolved to penetrate and then grow only within a eukaryotic cell. Evidence suggests that an unknown ancestor of Rickettsia prowazekii, the cause of epidemic typhus fever, adapted to grow within the cytoplasm of eukaryotic cells (Fig. 4.18). As it evolved, this obligate intracellular bacterium lost key biochemical pathways needed for independent growth because the host cell supplied them. We still do not know what those factors are, but we can grow Rickettsia in animal cell tissue culture or in chicken eggs (the bacteria grow inside the endothelial cells of blood vessels formed in fertilized eggs). Despite extensive efforts to grow this bacterium outside of a host cell (called axenic growth), R. prowazekii has proved uncooperative.
FIGURE 4.18 ■ Rickettsia prowazekii growing within eukaryotic cells. A. R. prowazekii growing within the cytoplasm of a chicken embryo fibroblast (SEM). B. Fluorescent stain of Rickettsia prowazekii (approx. 0.5 μm long) growing within a cultured human cell (outline marked by dotted line). The rickettsias are green (FITC-labeled antibody; arrow), the host cell nucleus is blue (Hoechst stain), and the mitochondria are red (Texas Red MitoTracker). The bacterium grows only in the cytoplasm.
D. J. SILVERMAN ET AL. 1975. INFECT. IMMUN. 11 :1391
JON AUDIA, U. OF SOUTH ALABAMA COLLEGE OF MEDICINE
Techniques for Counting Bacteria
Growth of bacteria in laboratory media is important for studying their physiology, but knowing how many bacteria are present in a medium is critical for interpreting results. Counting of bacteria is how we determine whether a lake is contaminated with fecal bacteria and whether our peanut butter is contaminated with
Salmonella. Counting of or quantifying microorganisms is surprisingly difficult because each of the available techniques measures a different physical or biochemical aspect of growth. Thus, a cell density value (given as cells per milliliter) derived from one technique will not necessarily agree with the value obtained by a different method. Here are some commonly used methods for counting microbes.
SPECIAL TOPIC 4 Factors from a Marine Sponge That Resuscitate “Microbial Dark Matter”
The vast majority of microbes in natural environments remain uncultivated. Because they cannot be “seen,” they have been referred to as “microbial dark matter.” Learning why most microbes in nature resist cultivation is of great interest to both basic and applied sciences. In situ culture approaches pioneered by Kim Lewis have been applied to many environments other than soil. However, why in situ cultivation techniques work remains unclear. Yoshiteru Aoi from Hiroshima University in Japan and his collaborators have used the marine sponge Theonella swinhoei (Fig. ST 4.1 ) to help answer this question. Aoi discovered that some uncultured bacteria in the marine sponge require an initiation factor made by the sponge (or by other microbes associated with the sponge) to start growing in artificial culture.
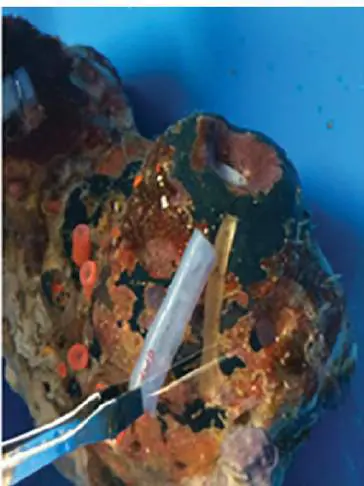
FIGURE ST 4.1 ■ Harboring uncultured microbes. The marine sponge Theonella swinhoei.
HELMUT CORNELI/ALAMY STOCK PHOTO
To discover these factors, scientists implanted diffusion chambers (DCs) similar to the iChip (see Fig. 4.16C ) into a living marine sponge (Fig. ST 4.2 ). However, the DC device did not have multiple chambers like the iChip; instead, it was just a thin slab of agar containing nutrients, sea salt, and a homogenized sponge extract carrying its uncultured bacteria. The DC agar was covered on both sides by filters of 0.1 μm pore size. These filters did not allow organisms outside the chamber to enter, but they permitted the entry of small molecules made by the sponge itself or by sponge-associated organisms. The researchers predicted that these small molecules would mimic the natural environment and activate growth of uncultured sponge bacteria embedded in the agar.
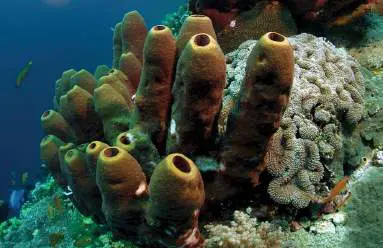
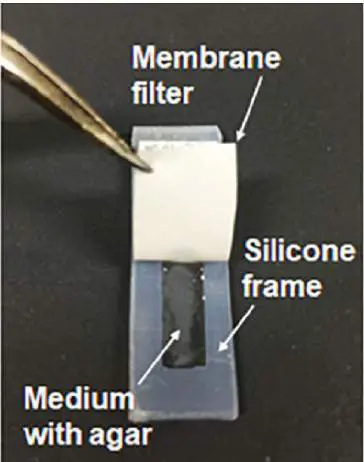
FIGURE ST 4.2 ■ In situ cultivation method used to discover microbial growth factors produced by Theonella swinhoei. A. The diffusion chamber (DC) used to find uncultured sponge bacteria. B. Installation of the DC device into the marine sponge.
D. JUNG ET AL. 2021. FRONT MICROBIOL. 12:537194. © 2021 JUNG, MACHIDA,
NAKAO, KINDAICHI, OHASHI AND AOI
After a week of implantation in a marine sponge, the chambers were removed, and colonies growing on the DC agar were subcultured onto fresh agar media lacking any sponge extract. Sequences of 16S ribosomal RNA from these colonies revealed members from six taxonomic groups. Forty percent were novel species. A similar approach examining colonies arising from standard direct plating (SDP) of sponge extract (no implantation) resulted in colonies from only three taxonomic groups and one novel species. Furthermore, of the 37 different species identified, only one (Ruegeria atlantica) was recovered under both DC and SDP conditions.
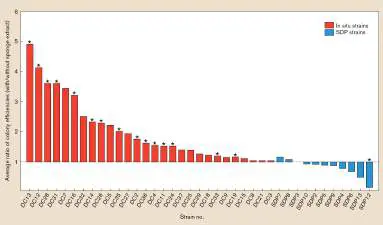
As noticed in other in situ cultivation studies, the majority of novel species activated by the sponge extract no longer needed the in situ growth factor to grow when transferred to new media. The extract did not affect growth rate or growth yield of the reactivated novel isolates; it was needed only to initiate bacterial growth on artificial media after leaving the sponge. The authors next asked whether starvation could send the novel strains back toward dormancy and, if so, whether the sponge extract would rescue them from starvation. Select isolates from in situ and SDP experiments were starved for several days and dilution-plated onto growth agar medium with and without marine sponge extract. Amazingly, the plating efficiencies of 15 out of 28 in situ isolates were higher on agar containing sponge extract than on agar without sponge extract ( Fig. ST 4.3 ). Eight of those 15 plated at efficiencies two to five times greater. In contrast, the sponge extract had little effect and even lowered the plating efficiency of the SDP isolates. FIGURE ST 4.3. ■ Effect of the sponge extract on starvation recovery of the in situ SDP strains. The ratio of colony plating efficiencies for each selected strain (triplicate measurements) on medium containing the sponge extract to medium without the sponge extract. An asterisk indicates that the ratio was statistically significant (t test; P < 0.01).
The authors hypothesize that the sponge extract contains a growth-initiation factor (or factors) that works as a trigger for regrowth of some dormant bacteria but does not continually promote growth. The factor is thermostable insofar as autoclaving sponge extract did not destroy the growth-initiating activity. The research has provided an important clue about why most environmental microbes cannot grow on standard agar media and sets the stage for future studies.
RESEARCH QUESTION
If you were involved in this project, what is the next important research question you would ask? What experiments might you perform?
Jung, Dawoon, Koshi Machida, Yoichi Nakao, Tomonori Kindaichi,
Akiyoshi Ohashi, and Yoshiteru Aoi. 2021. Triggering growth via growth
initiation factors in nature: A putative mechanism for in situ cultivation of previously uncultivated microorganisms. Frontiers in Microbiology 12
:537194. https://doi.org/10.3389 /fmicb.2021.537194.
Direct counting of living and dead cells. Microorganisms can be counted directly using a microscope. A dilution of a bacterial culture is placed on a special microscope slide called a hemocytometer or, more specifically for bacteria, a Petroff-Hausser counting chamber. Etched on the surface of the slide is a grid of precise dimensions, and placing a coverslip over the grid forms a space of precise volume. The number of organisms counted microscopically within that volume is used to calculate the concentration of cells in the original culture.
Thought Question
4.6 You want to determine the concentration of Shigella flexneri cells in a liquid culture and use a Petroff-Hausser chamber to do so. Use the following information to calculate the concentration of cells per milliliter in that culture. Each small square of the slide’s etched grid is 0.0025 μm 2 in size. You add a drop of the culture to the slide and cover it with a coverslip. The distance of the coverslip from the grid is 0.2 μm. With a microscope, you count 10 cells evenly spread over 16 squares. Calculate the concentration of cells in the original culture.
Simply “seeing” an organism under the microscope, however, does not mean that the organism is alive, because living and dead cells are indistinguishable by this basic approach. Living cells may be distinguished from dead cells by fluorescence microscopy using fluorescent chemical dyes, as discussed in Chapter 2. For example, propidium iodide, a red dye, intercalates between DNA bases but cannot freely penetrate the energized membranes of living cells. Thus, only dead cells stain red under a fluorescence scope. Another dye, Syto-9, enters both living and dead cells, staining them both green. By combining Syto-9 with propidium iodide, living and dead cells can be distinguished: Living cells stain green, whereas dead cells appear red or orange (Fig. 4.19).
FIGURE 4.19 ■ Live/dead stain. LIVE/DEAD Bac Light Bacterial Viability Kit. Dead bacterial cells fluoresce orange because propidium iodide (red) can enter the cells and intercalate the base pairs of DNA. Live cells fluoresce green because Syto-9 (green) enters the cell.
Source: International Journal of Nanomedicine. 2017. 12 :4409–4413.
Originally published by and used with permission from Dove Medical Press Ltd.
E. SANS-SERRA MITJANA ET AL. 2017. INT. J. NANOMEDICINE 12 :4409
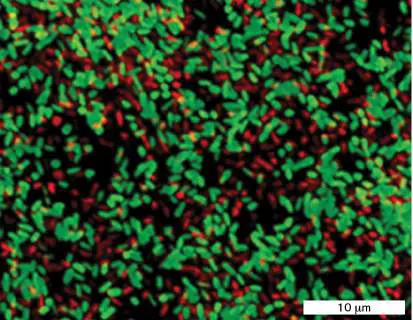
Direct counting without microscopy can be achieved using an electronic technique, called flow cytometry, that counts individuals within populations of bacterial cells and distinguishes classes of cells with different properties. The instrument is called a flow cytometer. In flow cytometry, bacterial cells that synthesize a fluorescent protein (such as cyan fluorescent protein; see Section 2.5) or that have been labeled with a fluorescent antibody or chemical are passed single file through a small orifice and then through a laser beam (Fig. 4.20A). Detectors measure light scatter in the forward direction (an indicator of particle size) and to the side (which indicates shape or granularity). In addition, the laser activates the fluorophore bound to fluorescent antibody, and a detector measures fluorescence intensity. Within a single culture, one subpopulation of cells may fluoresce more than or less than another because of the presence or absence of a targeted protein. Thus, flow cytometry enables us to use cell size and the level of fluorescence to identify and count different populations of cells. For example, flow cytometry can determine the expression of a gene in different subpopulations of cells in a single culture. This can be done by placing the green fluorescent protein gene (gfp) under the control of a specific bacterial gene (making a gene fusion). Researchers can then use flow cytometry to count cells expressing the gene and even to sort high-expressing cells from low-expressing cells (fluorescence-activated cell sorting, or FACS). The sorted cells can then be used for additional applications, such as selection of recombinant clones for molecular biology. Flow cytometry and FACS analysis make it possible to determine which environmental conditions trigger expression of the gene and whether all cells in the population express that gene at the same time and to the same extent (Fig. 4.20B ).
FIGURE 4.20 ■ Fluorescence-activated cell sorting. A. Schematic of a fluorescence-activated cell sorter (FACS) counting cells and conducting bidirectional sorting. B. Counting and separation of GFP-producing E. coli and non-GFP-producing E. coli. In the top panel, the low-level fluorescence (blue peak)
produced by the cells on the left is baseline fluorescence (autofluorescence). Cells producing high-level fluorescence (red peak) are expressing the GFP protein. The scatterplot in the bottom panel displays the same FACS data, showing the size distribution of cells (x -axis) with respect to the level of fluorescence (y -axis). The larger cells may be cells that are about to divide.
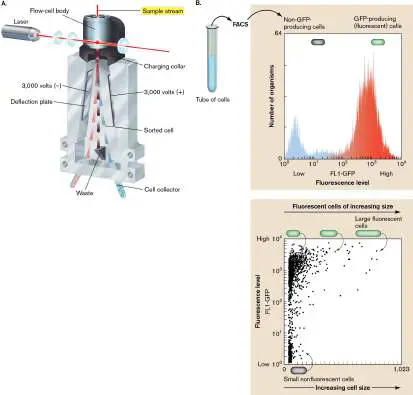
Viable counts. Viable cells, as noted previously, are those that can replicate and form colonies on a plate. To obtain a viable cell count, dilutions of a liquid culture can be plated directly on an agar surface (as in Fig. 4.14) or added to liquid agar cooled to 42°C–45°C. The agar is subsequently poured into an empty Petri plate (this is called the pour plate technique), where the agar cools further and solidifies. Because many bacteria resist short exposures to that temperature, individual cells retain the ability to form colonies on, and in, the pour plate. After colonies form, they are counted, and the original cell number is calculated. For example, if 100 colonies are observed in a pour plate made with 100 microliters (μl) of a 10 −3 dilution of a culture, then there were 10 6 organisms per milliliter in the original culture. Figure 4.14illustrates these types of calculations.
Although viable counts are widely used in research, this method is problematic for measuring cell number. Colony counts usually underestimate the number of living cells in a culture. Cells damaged for one reason or another can remain metabolically active and alive but may be too compromised to divide. Because these cells will not form colonies on an agar plate, they will not be counted as living. Comparing a viable count with a direct count obtained from a live/dead stain can expose the presence of these damaged cells. Another challenge is any organism that grows in chains, such as Streptococcus, because each colony originates from a group of cells, not a single cell. Consequently, counting of colonies underestimates actual cell number. For this reason, viable counts are reported as colony-forming units (CFUs) rather than as cells.
Biochemical assays. In contrast to methods that visualize individual cells, assays of cell biomass, protein content, or metabolic rate measure the overall size of a population of cells. The most straightforward but time-consuming biochemical approach to monitoring population growth is to measure the dry weight of a culture. Cells are collected by centrifugation, washed, dried in an oven, and weighed. Because bacterial cells weigh very little, a large volume of culture must be harvested to obtain measurements, making this technique quite insensitive. A more accurate alternative is to measure increases in protein levels, which correlate with increases in cell number. Protein levels are more easily measured with relatively sensitive assays.
Optical density measures growth in real time. The phenomenon of light scattering was introduced in Chapter 2. Recall that the presence of bacteria in a tube of medium can be detected by how cloudy the medium appears as the cells scatter light (see Fig. 2.3). The decrease in intensity of a light beam due to the scattering of light by a suspension of particles is measured as optical density. The optical density of light scattered by bacteria is a very useful tool for estimating population size. The method is quick and easy, but because light scattering is a complex function of cell number, composition, and volume, optical density provides only an approximate result. A standard curve that compares viable counts to optical density is typically made to improve accuracy.
Optical density as a measure of cell numbers has limitations. These include changes in the light-scattering properties of a cell as it grows, and the fact that dead cells also scatter light.
Clearly, using optical density to estimate viable count can be misleading, especially when measuring populations in stationary phase. A molecular method that can quantify cell number based on DNA content—the polymerase chain reaction (PCR; described in eAppendix 3)—also suffers from limitations. Dead cells contain DNA, and fast-growing cells can contain more than one copy of their chromosome—both of which can lead to overestimations in cell number. A modification of the PCR method, called viability PCR, uses a propidium dye that penetrates the membranes of dead cells and binds to their DNA. Photoactivation of the dye will cross-link the dead cell’s DNA so that it cannot be amplified by PCR. Now, quantitative PCR procedures will only recognize and amplify DNA from living cells.
To Summarize
Microbes in nature usually exist in complex, multispecies communities, but for detailed studies they must be grown separately in pure culture.
Bacteria can be cultured on solid or in liquid media. Defined or synthetic media contain known lists of chemical components. Minimal defined media contain only the defined nutrients essential for growth of a given organism. Complex , or rich , media contain many nutrients. Other media exploit physiological differences between organisms and can be defined as selective , differential , or selective and differential (for example, MacConkey medium or enrichment medium).
Most microbes are not yet cultured and require specific growth factors depending on the nutrient richness of their natural ecological niche.
Obligate intracellular bacteria lose metabolic pathways provided by their hosts and develop requirements for growth factors supplied by their hosts.
Culturable microorganisms may be counted directly under a microscope (with or without staining), through the use of flow cytometry, or by quantitative PCR.
Culturable microorganisms can be counted indirectly by viable counts (as colony-forming units) or by the measurement of dry weight, protein levels, or optical density.
A viable bacterial organism is defined as being capable of replicating.
Glossary
pure culture A culture containing only a single strain or species of microorganism. A large number of microorganisms that all descended from a single individual cell.
dilution streaking A method of spreading bacteria on a plate in order to obtain colonies arising from an individual bacterium.
colony A visible cluster of microbes on a plate, all derived from a single founding microbe. Usually consists of a clone , except for infrequent mutations.
spread plate A method to grow separate bacterial colonies by plating serial dilutions of a liquid culture.
confluent Describing a mode of growth that results in a lawn of organisms completely covering a surface.
viable Capable of replicating; for instance, by forming a colony on an agar plate.
complex medium Also called rich medium. A nutrient-rich growth solution including undefined chemical components such as beef broth. rich medium See complex medium .
minimal defined medium A solution of chemically defined compounds for organismal growth that contains only the minimal components required for growth.
enriched medium A growth solution for fastidious bacteria, consisting of complex medium plus additional components.
selective medium A medium that allows the growth of certain species or strains of organisms but not others.
enriched medium A growth solution for fastidious bacteria, consisting of complex medium plus additional components.
differential medium A growth medium that can distinguish between various bacteria on the basis of metabolic differences.
enriched medium A growth solution for fastidious bacteria, consisting of complex medium plus additional components.
growth factor A compound needed for the growth of only certain cells. uncultured Describing an organism whose requirements for culture remain unknown.
flow cytometry A tool for analyzing cell populations, in which cells of multiple types are detected individually and distinguished by light scatter and fluorescence emission.
fluorescence-activated cell sorting (FACS)
A technique in which cells are counted (via flow cytometry), and then different classes of cells are collected into fractions according to differences in fluorescence (via cell sorting). pour plate technique A procedure in which organisms are added to melted agar cooled to 42°C–45°C and the mixture is poured into an empty Petri plate. Colonies grow in the agar after the agar solidifies. optical density A measure of how many particles are suspended in a solution, based on light scattering by the suspended particles.
enrichment medium A medium whose composition favors the growth of one microbial species over others, increasing (enriching) the presence of the favored species.
viability PCR A form of PCR that amplifies DNA only from viable cells. Fig. 2.3 FIGURE 2.3 ■ Detecting and resolving bacteria. A. A tube of bacterial culture, Rhodospirillum rubrum. The presence of bacteria is detected, though individual cells are not resolved. B. Individual cells of Oenococcus oeni are resolved by light microscopy.
JOAN SLONCZEWSKI, KENYON COLLEGE
C. M. LUCY JOSEPH, UC DAVIS DEPT. OF VITICULTURE AND ENOLOGY WINE
YEAST AND BACTERIA COLLECTION
Endnotes
1. Note a: Bacto tryptone is a pancreatic digest of casein (bovine milk protein). Return to reference a 2. Note a: Both nicotinamide and nicotinic acid are derived from NAD, nicotinamide adenine dinucleotide. Return to reference a 3. Note a: Both nicotinamide and nicotinic acid are derived from NAD, nicotinamide adenine dinucleotide. Return to reference a
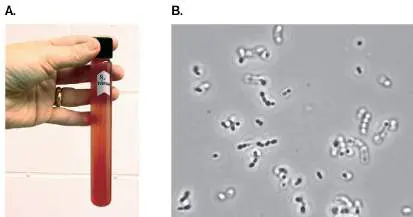
4.4 The Growth CycleUnit 1 · Methods
Survival of any species ultimately depends on its ability to generate offspring. A typical bacterium grows by increasing in length and mass, which facilitates expansion of its nucleoid as its DNA replicates (see Section 3.4). As DNA replication nears completion, the cell, in response to complex genetic signals, begins to synthesize a midcell septum that separates the two daughter cells. In this overall process, called binary fission, one parental cell splits into two equal daughter cells (Fig. 4.21A).
Although a majority of culturable bacteria divide symmetrically into two equal halves, some species divide asymmetrically. For example, the bacterium Caulobacter forms a stalked cell that remains fixed to a solid surface but reproduces by budding from one end to produce small, unstalked motile cells (see Fig. 3.30). The marine organism Hyphomicrobium also replicates asymmetrically by budding, releasing a smaller cell from a stalked parent (Fig. 4.21B ).
FIGURE 4.21 ■ Symmetrical and asymmetrical cell division. A. Symmetrical cell division, or binary fission, in Lactobacillus sp. (SEM). B. Asymmetrical cell division via budding in the marine bacterium Hyphomicrobium (approx. 4 μm long).
DENNIS KUNKEL MICROSCOPY, INC./SCIENCE SOURCE
ELLEN QUARDOKUS, INDIANA UNIVERSITY
Eukaryotic microbes, in contrast, divide by a special form of cell fission involving mitosis, the segregation of pairs of chromosomes within the nucleus (see eAppendix 2). Some eukaryotes also undergo more complex life cycles involving budding and diverse morphological forms.
Several questions present themselves when trying to understand microbial growth. How do microbes grow? What determines their rate of growth? And when can growth resume in a nongrowing population? These questions seem simple, but their answers are complex and still incomplete. Microbes in natural environments typically exist in
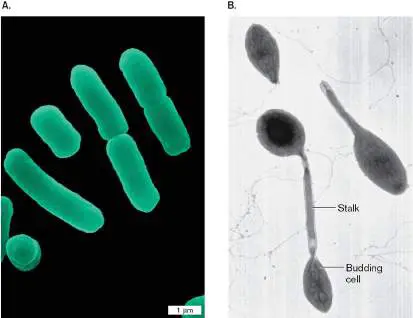
biofilms (described later) that are complex, mixed communities built on solid surfaces. Measuring the growth of a single species in that situation is challenging. Fortunately, individual cells called planktonic cells can separate from a biofilm and grow on their own. These free-living, single-species cells permit analysis of their growth much more easily than multispecies biofilms do. Consequently, our discussion in this section focuses on the growth of planktonic cells.
Exponential Growth
All species, at one time or another, exhibit rapid growth, nongrowth, and many phases in between. We care about growth for many reasons. For instance, how rapidly a microbe grows will influence how fast a pathogen causes disease, how quickly contaminated food spoils, and how fast an oil-consuming bacterial species will remediate an oil spill. We start our discussion with rapid growth.
If we assume that microbial growth is unbounded, what happens to the population? The unlimited growth of any population obeys a simple law: The growth rate, or rate of increase in cell numbers or biomass, is proportional to the population size at a given time. Such a growth rate is called “exponential” because it generates an exponential curve, a curve whose slope increases continually. How does binary fission of cells generate an exponential curve? If each cell produces two cells per generation, then the population size at any given time is proportional to 2 n, where the exponent n represents the number of generations (that is, cell divisions in which offspring replace parents) that have taken place between two time points. Thus, cell number rises exponentially. Many microbes, however, have replication cycles that are based on numbers other than 2. For example, some cyanobacteria such as Pleurocapsa minor form cell aggregates that divide by multiple fissions, releasing dozens of daughter cells. The cyanobacterium enlarges without dividing, and then suddenly divides many times without separating. The cell mass breaks open to release hundreds of progeny cells. Cyanobacterial life cycles are described further in Chapter 18.
Thought Question
4.7 A virus such as influenza virus might produce 800 progeny virus particles from one host cell infected by one virus. How would you mathematically represent the exponential growth of the virus? What practical factors might limit such growth?
Generation Time
In an environment with unlimited resources, bacteria divide at a constant interval called the generation time (but not all cells in the population divide at the same instant). The generation time varies with respect to many parameters, including the bacterial species, type of medium, temperature, and pH. The generation time for cells in culture is also known as the doubling time, because the population of cells doubles over one generation. For example, one cell of Escherichia coli placed into a complex medium will divide every 20 minutes. After 1 hour of growth (three generations), that one cell will have become eight (1 to 2, 2 to 4, 4 to 8). Because cell number (N) doubles with each division, the increase in cell number over time is exponential, not linear. A linear increase would occur if cell number rose by a fixed amount after every generation (for example, 1 to 2, 2 to 3, 3 to 4).
Why do we care about generation time? As noted already, generation time is important when we’re trying to understand how rapidly a pathogen can cause disease symptoms. In biotechnology, how fast a producing organism grows will affect how quickly a commercially useful by-product can be made.
How do we calculate generation time? Starting with any number of organisms (N 0), the number of organisms after n generations will be N × 2 n. For example, a single cell after three generations (n =
0
3) will produce 1 cell × 2 3 = 8 cells The number of generations that an exponential culture undergoes in a given time period can be calculated if the number of cells at the start of the period (N 0) and the number of cells at the end of the period (N t) are known. Methods such as viable counts are used to make those determinations. Thus, N = N × 2 n
t 0
can be expressed as log 2 N t = log 2 N 0 + n log 2 2 = log 2 N 0 + n Solving for n: n = log 2 N t − log 2 N 0 = log 2 (N t / N 0)
Once the number of generations (n) over a given time is known, generation time (g) is calculated as g = t / n For example, if 2 hours (120 minutes) yielded 6 generations, then g = 20 minutes.
The rate of exponential growth is expressed as the mean growth rate constant (k), which is the number of generations (n) per unit time (usually generations per hour). This is written as k = n / t, where t is 1 hour; or k = 1/ g Thus, if the generation time is 20 minutes (0.33 hour) for a given bacterial species in a given medium, the growth rate constant k = 1/0.33 hour = 3 generations per hour. If the generation time is 2 hours, the growth rate constant is 0.5 generation per hour. In practice, exponential growth lasts for only a short period when all nutrients are in full supply and the concentration of waste products has not become a limiting factor.
The growth rate constant can also be calculated from the slope of log 2 N over time, where N is a relative measure of culture density, such as the optical density measured in a spectrophotometer (Fig. 4.22A). The units of N do not matter, because we are always looking at ratios of cell numbers relative to an earlier level (N 1 / N 0 ). For example, we can use the following series of optical density (OD) measurements to determine N: Time (min) OD 600 log 2 OD 600 0 0.05 –4.32 15 0.08 –3.65 30 0.13 –2.94 45 0.20 –2.32 60 0.33 –1.59 FIGURE 4.22 ■ Bacterial growth curves. A. and B. Theoretical growth curves of a bacterial suspension measured by optical density (OD) at a wavelength of 600 nm. Linear-scale (A) and logarithmic-scale (B) plots of OD 600. Note that the log plot is a straight line. C. Phases of bacterial growth in a typical batch culture.
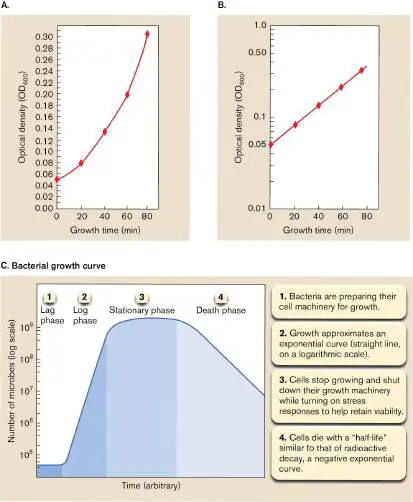
If we plot log 2 OD 600 versus time (Fig. 4.22B ), we obtain a line with a slope of 0.0452 per minute. The growth rate constant, in doublings per hour, becomes k = (0.0452/min)(60 min/h)
= 2.7 generations per hour The steeper the slope, the faster the organisms are dividing.
Note: An alternative formula uses logarithms to base 10, requiring
conversion to base 2 (log 10 2 = 0.301): log 10 N t = log 10 N 0 + n log 10 2 = log 10 N 0 + n 0.301 n = 3.3 log 10 (N t / N 0)
Thought Question
4.8 Suppose one cell of the nitrogen fixer Sinorhizobium meliloti colonizes a plant root. After 5 days (120 hours), there are 10,000 bacteria fixing N 2 within the plant cells. What is the bacterial doubling time?
The mathematics of exponential growth is relatively straightforward, but remember that microbes grow differently in pure culture (very rare in nature) than they do in mixed communities, where neighboring cells produce all kinds of substances that may feed or poison other microbes. In mixed communities, the microbes may grow planktonically floating or swimming as single cells in liquid, as in the open ocean, or grow as a biofilm on solid matter suspended in that ocean. In each instance, the mathematics of exponential growth applies, at least until the community reaches a density at which different species begin to compete or nutrients become scarce.
Thought Question
4.9 It takes 40 minutes for a typical E. coli cell to completely replicate its chromosome and about 20 minutes to prepare for another round of replication. Yet the organism enjoys a 20-minute generation time growing at 37°C in complex medium. How is this possible? Hint: How might the cell overlap the two processes?
Stages of Growth in Batch Culture
Exponential growth never lasts indefinitely when cells are grown in a closed system such as a flask, also called batch culture. Nutrient consumption and toxic by-products eventually slow the growth rate until it halts altogether. In batch culture, no fresh medium is added during incubation; thus, nutrient concentrations decline and waste products accumulate during growth.
The progressively deteriorating conditions of a batch culture profoundly affect bacterial physiology and growth. These changes illustrate the remarkable ability of bacteria to adapt to their environment. As medium conditions worsen, alterations occur in membrane composition, cell size, and metabolic pathways, all of which affect generation time. Microbes possess intricate, self-preserving genetic and metabolic mechanisms that slow growth before their cells lose viability. Plotting culture growth (as represented by the logarithm of the cell number) versus incubation time makes it possible to see the effect of changing conditions on generation time and reveals the stages of growth shown in Figure 4.22C ; namely, lag phase, log (or exponential) phase, stationary phase, and death phase.
Lag phase. Cells transferred from an old culture to fresh growth media typically experience a lag period, or lag phase, during which they do not divide. Several factors influence lag phases. Cells taken from an aged culture may be damaged and require time for repair. Carbon, nitrogen, or energy sources different from those originally used by the seed culture must be sensed, and the appropriate enzyme systems must be synthesized. The length of the lag phase also varies with changes in temperature, pH, and salt concentration, as well as nutrient richness. For example, transferring cells from one complex medium to a fresh complex medium results in a very short lag phase, whereas cells grown in a complex medium and then plunged into a minimal defined medium will experience a protracted lag phase. Lag phase cells in the latter case, must synthesize all the amino acids, nucleotides, and other metabolites previously supplied by the complex medium.
Early log, or exponential, phase. Once cells have retooled their physiology to accommodate the new environment, they begin to grow exponentially and enter what is called exponential, or logarithmic (log), phase (the linear part of the growth curve). Exponential growth is balanced growth, in which all cell components are synthesized at constant rates relative to each other—the assumption behind the generation time calculation given in the previous subsection. Cells in exponential phase are growing and dividing at the maximum rate possible in the medium and growth conditions provided (such as temperature, pH, and osmolarity). Cells are largest at this stage of growth. If cell division were synchronized and all cells divided at the same time, the growth curve during this period would appear as a series of steps with cell numbers doubling instantly after every generation time. But batch cultures are not synchronous. Every cell has an equal generation time, but each cell divides at a slightly different moment, making the cell number rise smoothly.
Cells enjoying balanced, exponential growth are temporarily thrown into metabolic chaos (unbalanced growth) when their medium is abruptly changed. Nutritional downshift (moving cells from a good carbon source such as glucose to a poorer carbon source such as succinate) or nutritional upshift (moving cells to a better carbon source) casts cells into unbalanced growth. Downshifting to a carbon source with a lower energy yield means that different enzymes must be made to use the new carbon source. The cells must also adjust their generation time because the high rate of macromolecular synthesis (such as ribosome synthesis) achieved while growing on a high-energy-yield carbon source cannot be sustained when growing on a carbon source with a lower energy yield. Failure to adjust can increase mistakes during the synthesis of RNA, protein, and DNA, the depletion of key energy stores, and ultimately death.
Note that the smooth exponential growth phase shown in Figure 4.22B does not always hold for microbes growing in natural environments or in complex laboratory media containing multiple carbon and energy sources. Some bacterial species produce odd-looking growth curves in complex media as the population depletes one carbon source and must switch physiology to use another. Even E. coli doesn’t really experience a uniform log-phase metabolism growing in complex medium; instead, it smoothly transitions through a series of metabolic states.
Late log phase. As cell density (number of cells per milliliter) rises during log phase, the rate of doubling eventually slows, and a new set of growth phase–dependent genes is expressed. At this point, some species can also begin to detect the presence of others by sending and receiving chemical signals in a process known as quorum sensing (discussed in Chapter 10).
Stationary phase and growth arrest. Eventually, cell numbers stop rising, owing to the lack of a key nutrient or the buildup of waste products. At this point the growth curve levels off, and the culture is said to be in stationary phase. It was originally thought that in stationary phase, the rate of cell division equaled the rate of cell death. That is, cells were either dead or they were alive. That model has been challenged by numerous scientists who now propose three types of stationary-phase cells: those that can replicate and can form colonies on agar plates (culturable), those that are growth-arrested or dormant (described shortly), and those that are truly dead. Stationary-phase cells that remain culturable change their physiology to become resistant to damage from oxygen radicals and the toxic by-products of metabolism. These cells undergo a very effective molecular reprogramming. The microbial model organism E. coli, for example, adjusts to stationary phase by decreasing its size, thus minimizing the volume of its cytoplasm compared to the volume of its nucleoid. Fewer nutrients are then required to sustain the smaller cell. New stress resistance enzymes are also synthesized to handle oxygen radicals, protect DNA and proteins, and increase cell wall strength through increased peptidoglycan cross-linking. As a result, culturable E. coli cells in stationary phase become more resistant to heat, osmotic pressure, pH changes, and other stresses that they might encounter while waiting for a new supply of nutrients. Note that some bacteria, such as Bacillus subtilis, respond to nutrient depletion by differentiating to produce resistant spores (see Section 4.6)
Growth-arrested stationary-phase bacterial cells undergo a more dramatic molecular reprogramming that limits macromolecular synthesis, increasing the difficulty of reinitiating replication and forming colonies. But the cells are alive. Nathalie Questembert-Balaban and colleagues from the Hebrew University of Jerusalem elegantly showed that the vast majority of E. coli cells thought to have died in stationary phase are actually alive but growth-arrested— and can still make protein. To prove growth arrest, E. coli cells that expressed a red fluorescent protein were grown to stationary phase for 15 hours and then trapped in a microfluidic channel (Fig. 4.23A ). A chemical inducer molecule was added to observe the percentage of cells that could still synthesize a green fluorescent protein encoded by a second gene. Nine hours later, none of the cells had divided, but at least 90% of cells had produced the new protein, meaning that these cells were alive but growth-arrested.
FIGURE 4.23 ■ Observing dormant E. coli making protein in stationary phase. A. Stationary-phase E. coli cells expressing a red fluorescent protein were trapped in a microfluidic channel (t = 0) and induced to make a new, green fluorescent protein. Scale bar equals 2 μm. B. Nathalie Questembert-Balaban (center) with student Eitam Rotem (left) and lab manager Irene Ronin (right) viewing fluorescent bacteria growing and dying.
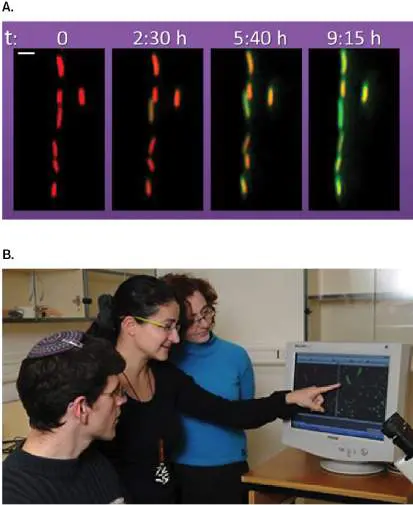
O. GEFEN ET AL. 2014. PNAS 111 :556–561
COURTESY OF HEBREW UNIVERSITY
Jonathan Dworkin and colleagues at Columbia University in New York City examined what causes growth arrest in stationary-phase B. subtilis. They discovered that the molecules guanosine tetraphosphate (ppGpp) and guanosine pentaphosphate (pppGpp), associated with the stringent response of starved cells (discussed in Chapter 10), accumulate during transition to stationary phase and inhibit protein synthesis, thereby producing growth-arrested cells ( Fig. 4.24). At high concentrations, the molecules competitively bind and inhibit the protein synthesis initiation factor IF2 that normally binds to GTP. Slowing protein synthesis saves stationary-phase cells a considerable amount of energy and helps them transition into a quiescent state.
FIGURE 4.24 ■ Guanosine tetraphosphate and guanosine pentaphosphate inhibit protein synthesis in Bacillus subtilis stationary-phase cells. Cells grown in complex media were examined in exponential phase (1.5-hour incubation) as well as during early (6-hour incubation) and late stationary phases (13-hour incubation). Green fluorescence indicates active protein
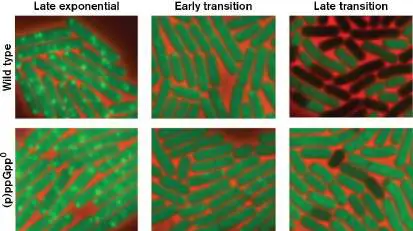
synthesis as measured by incorporation of a puromycin analog into nascent proteins undergoing translation. Top panels are wild-type cells that can make guanosine tetra-and pentaphosphate [(p)ppGpp]; bottom panels are cells that cannot make (p)ppGpp.
S. DIEZ ET AL. 2020. PROC NATL ACAD SCI USA. 117:15565-15572
A more striking example of growth arrest and survival is carried out by Rhodopseudomonas palustris, a phototrophic Gram-negative bacterium found in a variety of aquatic environments, including marine coastal sediments. Studies by Kieran Pechter and Liang Yin (Fig. 4.25A) in Caroline Harwood’s lab at the University of Washington (Fig. 4.25B ) revealed that R. palustris can enter a growth-arrested state for months during carbon or nitrogen restriction, but only in the presence of light (Fig. 4.25C) . FIGURE 4.25 ■ Identification of longevity genes in growth-arrested Rhodopseudomonas palustris. A. Kieran Pechter (right) and Liang Yin, working in Caroline Harwood’s lab (B) , studied growth arrest in the phototroph Rhodopseudomonas. C. They determined longevity by initiating growth of R. palustris
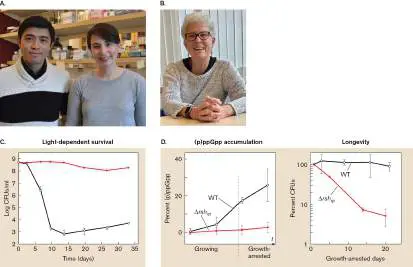
at low acetate concentrations without oxygen (day 0) and then plating for viable count at weekly intervals on rich agar medium. Cultures were incubated with light (red line) or in the dark (black line). D. Left: (p)ppGpp synthesis is compromised in the rsh mutant. Measurements taken were early log, late log, early arrest, and arrest phases. Percent (p)ppGpp was calculated as (ppGpp + pppGpp)/(GTP + ppGpp + pppGpp). Right: Viability of wild-type and mutant R. palustris during growth arrest. △ rsh rp = rsh mutant; WT = wild type.
Source: Part C modified from K. B. Pechter et al. 2017. mBio 8 :e01726-17. Part D modified from L. Yin et al. 2019. mBio 10 :e02189-19.
TROY MORRIS
CAROLINE HARWOOD
To remain viable, growth-arrested cells of any species must somehow maintain an electrochemical membrane potential to provide energy. R. palustris uses photosynthesis to maintain membrane potential during nutrient restriction. The ability to separate energy production from carbon use in this organism enabled the scientists to ask which genes, other than those needed for photosynthesis, were required for long-term growth arrest and recovery. Random insertions into the R. palustris genome were screened to determine which genes were needed to survive dormancy, and RNA sequencing was used to identify which RNA molecules were made during growth arrest (see Chapter 10, RNAseq). These approaches revealed 117 longevity genes. One of the longevity genes, rsh rp, encodes a (p)ppGpp synthesis/hydrolase enzyme. The rsh rp mutant made very minimal amounts of (p)ppGpp in stationary phase and had a severe longevity defect (Fig. 4.25D ), once again indicating that (p)ppGpp plays an important role in triggering growth arrest. Longevity afforded by growth arrest, coupled with the ability to maintain proton motive force using light energy, gives R. palustris a distinct survival advantage in nutrient-depleted bodies of water such as the ocean.
Thought Question
4.10 The bacterium Acidithiobacillus thiooxidans is an extremophile that grows using sulfur as an energy source. (a) Draw the approximate growth curves that you would expect to see, extending from log phase to stationary phase, if four cultures with different starting numbers of bacteria were grown in the same concentration of sulfur. Use Figure 4.22B as the model and 4 × 10⁵, 4 × 10⁶, 4 × 10⁷, and 4 × 10⁸ as the starting cell densities. Maximum growth yield is 109 cells per milliliter. (b) Draw a second graph showing how the curves would change if the initial population density were constant but the concentration of sulfur varied.
Death or decline phase. The final phase of “growth” for bacteria is called the death, or decline, phase. Without reprieve in the form of new nutrients, cells in stationary phase will eventually succumb to toxic chemicals present in the environment. Cells, even growth-arrested cells, begin to die as unrepaired free-radical damage accumulates. Like the growth rate, the death rate —the rate at which cells die—is logarithmic. In death phase, the number of cells that die in a given time period is proportional to the number that existed at the beginning of the time period. Thus, the death rate is a negative exponential function. The death rate can be expressed as a half-life, the time over which a population declines by half.
Determining microbial death rates is critical to the study of food preservation and to the development of antibiotics (further discussed in Chapters 5, 16, and 27). Although death curves are basically logarithmic, exact death rates are difficult to define for several reasons: mutations that arise to promote survival, cannibalization of dead cells by live cells, and the presence of growth-arrested cells that seem dead but aren’t. Consequently, the death phase is extremely prolonged. In fact, a portion of the cells will often survive for months in the dormant or growth-arrested states mentioned earlier.
Thought Questions
4.11 What can happen to the growth curve when a culture medium contains two carbon sources: one a preferred carbon source of growth-limiting concentration and the other a nonpreferred source? 4.12 How would you modify the equations describing microbial growth rate to describe the rate of death?
4.13 Why are cells in log phase larger than cells in stationary phase?
Continuous Culture
In the classic growth curve that develops in closed systems, the exponential phase spans only a few generations. In open systems, however, where fresh medium is continuously added to a culture and an equal amount of culture is constantly siphoned away, bacterial populations can be maintained in exponential phase at a constant cell mass for extended periods of time. In this type of growth pattern, known as continuous culture, all cells in a population achieve a steady state, which permits a detailed analysis of microbial physiology at different growth rates.
The chemostat is a continuous culture system in which the diluting medium contains a limiting amount of one essential nutrient (Fig. 4.26). You could think of your gastrointestinal tract as a kind of crude chemostat. Nutrient enters through your mouth and passes through your intestine, where it feeds your microbiome, and your microbiome exits in fecal waste. In both cases the numbers of microbes in the chamber (or gut) remain relatively constant. The GI tract is different from a chemostat, of course, in that the volumes of nutrient intake and fecal exit are not continuous or equal, and water is absorbed.
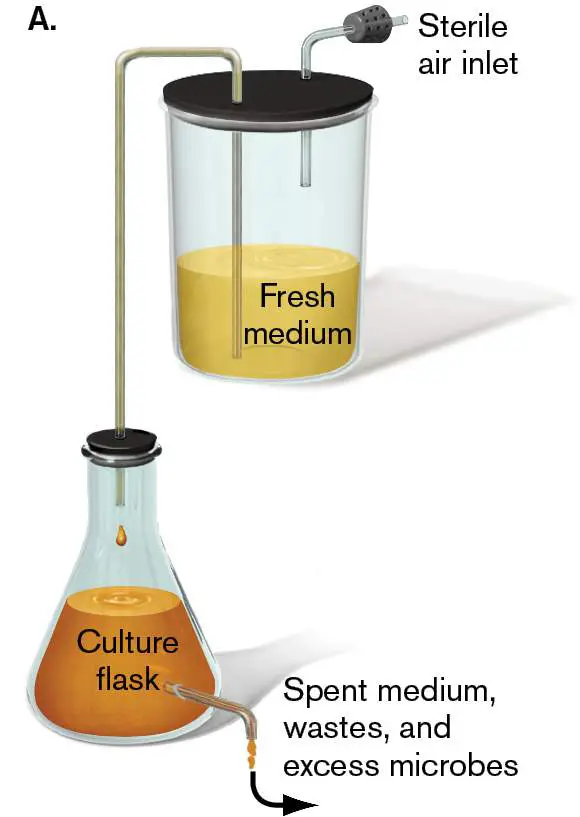
FIGURE 4.26 ■ Chemostats and continuous culture. A. The basic chemostat ensures logarithmic growth by constantly adding and removing equal amounts of culture media. B. A modern chemostat.
SEBASTIAN KOPF, UNIVERSITY OF COLORADO, BOULDER
The complex relationships among dilution rate, cell mass, and generation time in a chemostat are illustrated in Figure 4.27. The curves in this figure represent a typical experimental result. At very low dilution (flow) rates, the nutrient is so limiting that cells will divide very slowly and cell mass will remain low. Any increase in flow rate, however, will increase the availability of the limiting nutrient such that cells grow faster and cell mass
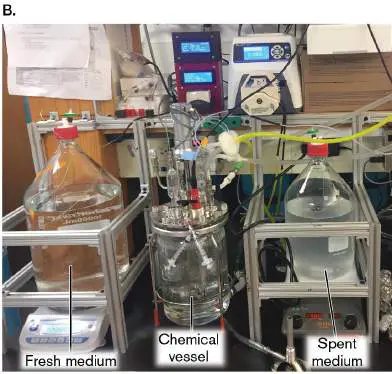
increases. The rate of cell division and the cell mass are kept constant when the flow rate is kept constant, because the amount of culture (and cells) removed from the vessel exactly compensates for the increased rate of cell division. Constant cell mass, or density, can be maintained only over a certain range of flow rates. At faster and faster flow rates, cells are eventually removed more quickly than they can be replenished by division, so cell density (cell mass) decreases in the vessel—a phenomenon called “washout.”
FIGURE 4.27 ■ Relationships among chemostat dilution rate, cell mass, and generation time. As the dilution rate (x - axis) increases, the generation time decreases and the mass of the culture increases. When the rate of dilution exceeds the division rate, cells are washed from the vessel faster than they can be replaced by division, and the cell mass (bacterial mass) decreases. The y -axis varies depending on the curve, as labeled.
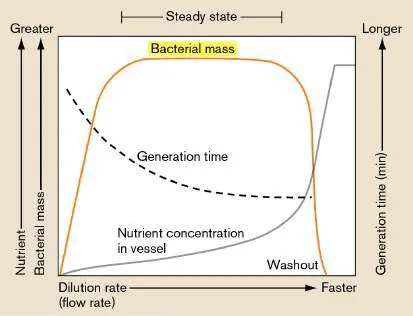
Continuous culture is used to study large numbers of cells at a constant growth rate and cell mass for both research and industrial applications. Its advantage over batch culture is that the physiology of cells in continuous culture is homogeneous. Consequently, continuous cultures are used in industry to optimize the production of antibiotics, beer, and other microbial products. In research, continuous culture is used to examine what happens to metabolic flux (essentially the rate at which molecules move through metabolic pathways) before and after a biochemical step is altered, and to conduct long-term studies of bacterial evolution.
To Summarize
Generation time is the length of time it takes for a population of cells to double in number.
The generation time for a single species will vary as culture conditions change. During exponential growth , generation time remains constant.
The growth cycle of organisms grown in liquid batch culture consists of lag phase, log (exponential) phase, stationary phase, and death phase.
The physiology of a bacterial population changes with growth phase.
Continuous culture can be used to sustain a population of bacteria at a specified growth rate and cell density.
Glossary
binary fission The process of replication in which one cell divides to form two genetically equivalent daughter cells of equal size.
planktonic cell An isolated cell, growing individually in a liquid without connections to other cells.
growth rate The rate of increase in population number or biomass. generation time The species-specific time period for doubling of a population (e.g., by bacterial cell division) in a given environment, assuming no depletion of resources.
doubling time The generation time of bacteria in culture. The amount of time it takes for the population to double.
growth rate constant The number of organismal generations per unit time; k. batch culture The growth of bacteria in a closed system without additional input of nutrients.
lag phase A period of cell culture, occurring right after bacteria are inoculated into new media, during which there is slow growth or no growth.
exponential phase Also called logarithmic (log) phase. A period of cell culture during which bacteria grow exponentially at their maximal possible rate, given the conditions.
logarithmic (log) phase See exponential phase .
stationary phase A period of cell culture, following exponential phase, during which there is no net increase in replication.
death rate The rate at which cells die; it is exponential during the death phase.
death phase A period of cell culture, following stationary phase, during which bacteria die faster than they replicate.
continuous culture A culture system in which new medium is continuously added to replace old medium.
chemostat A continuous culture system in which the introduced medium contains a limiting nutrient.
Fig. 10.12 FIGURE 10.12 ■ Glucose transport via the phosphotransferase system inhibits LacY (lactose
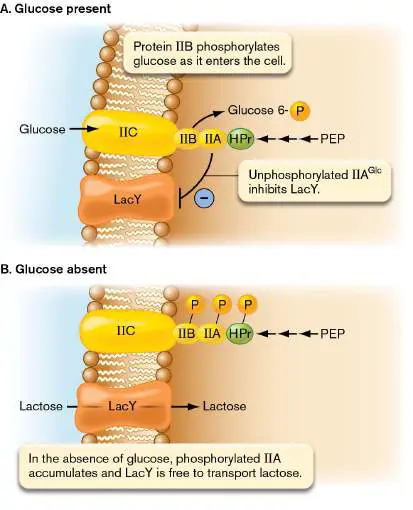
permease). A. Inducer exclusion. Phosphoenolpyruvate (PEP) “feeds” phosphate into the PTS, which relays the phosphate to glucose during transport. The level of unphosphorylated II A Glc is high because glucose continually siphons off the phosphate. Unphosphorylated II A Glc inhibits LacY (lactose permease) activity to keep lactose from entering the cell. B. In the absence of glucose, the phosphorylated forms of glucose-specific II A Glc and II BC Glc accumulate and cannot inhibit LacY. LacY transports lactose, and the lac operon is induced. HPr = histidine-rich protein. Fig. 3.30 FIGURE 3.30 ■ Asymmetrical cell division: a model for development. A swarmer cell of Caulobacter crescentus loses its flagellum and grows a stalk. The stalked cell divides to produce a swarmer cell (TEM).
YVES BRUN
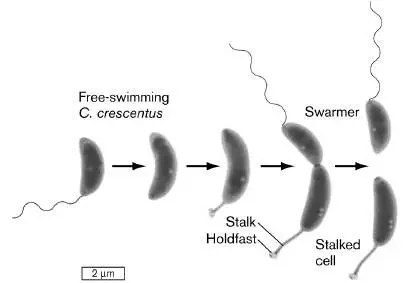
4.5 BiofilmsUnit 5 · Regulation
Can bacteria collaborate? Bacteria are typically thought of as unicellular, but many, if not most, bacteria in nature form specialized, surface-attached, collaborative communities called biofilms (Fig. 4.28) . Indeed, within aquatic environments bacteria are found mainly associated with surfaces—a fact that underscores the importance of biofilms in nature. Soil biofilms help filter groundwater through the soil, where the bacteria break down organic waste. This process is especially important in wetlands, which provide an important “ecosystem service” for human communities (discussed in Chapter 22).
FIGURE 4.28 ■ Biofilm of Proteus mirabilis.
GADO IMAGES/ALAMY STOCK PHOTO
Other biofilms play critical roles in infectious disease and environmental degradation, which cost billions of dollars each year in equipment damage, product contamination, and
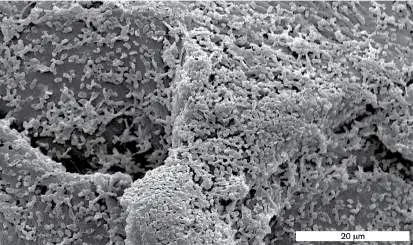
medical infections. For example, pseudomonad or staphylococcal biofilms can damage ventilators used to assist respiration. Biofilms can also form inside indwelling catheter tubes that deliver fluids and medications to patients. In both of these examples, the biofilms serve as direct sources of infection, so developing ingenious ways to prevent biofilm formation on medical instrumentation is a major goal of biomedical research. More recently, pathogen biofilms have been found in certain clinical settings as unattached small aggregates dispersed in mucus.
The Biofilm Life Cycle
Biofilms can be constructed by a single species or by multiple, collaborating species, as in the mixture of facultative and anaerobic bacteria that form on river rocks or dental plaque (Fig. 4.29). The Gram-negative bacterium Pseudomonas aeruginosa can form a single-species biofilm on the lungs of cystic fibrosis patients or on medical implants. All surface-attached biofilms develop in distinct stages (the biofilm “life cycle”). These stages include initiation, maturation, maintenance, and dissolution (or dispersal). Bacteria typically initiate biofilms when nutrients are plentiful. The goal is to stay where food is abundant. Why should a microbe travel off to hunt for food when it is already available? Once nutrients become scarce, however, individuals detach from the community to forage for new sources of nutrients.
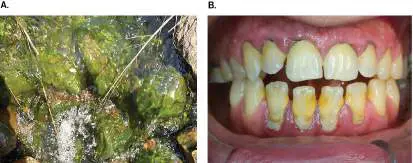
FIGURE 4.29 ■ Biofilms. A. A greenish brown slime biofilm found on cobbles of the streambed in High Ore Creek, Montana. B. The biofilm that forms on teeth is called plaque.
USGS
DR. ARMEN TARANYAN/SCIENCE SOURCE
Confocal images of biofilms are shown in Figure 4.30(inset) and Figure 2.33. Biofilm formation can be induced by different environmental signals in different species. These signals include pH, iron concentration, temperature, oxygen availability, and the presence of certain amino acids. Nevertheless, a common pattern emerges in the formation of many kinds of biofilms: adhesion of single cells to a solid surface, microcolony formation, biofilm maturation, and dispersal (Fig. 4.30).
FIGURE 4.30 ■ Biofilm development. The stages of biofilm development in Pseudomonas, which generally apply to the formation of many kinds of biofilms. Inset: A mucoid
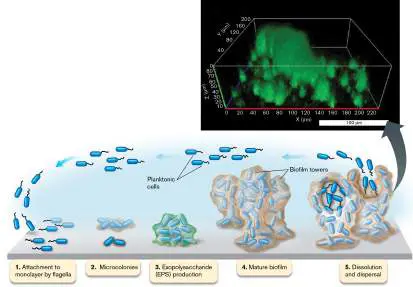
environmental strain of P. aeruginosa produces uneven, lumpy biofilms in a continuous-flow cell. Cells in the biofilm were stained green with live/dead viability stain (3D confocal laser scanning microscopy).
Source: O. E. Petrova and K. Sauer. 2011. J. Bacteriol. 193 : 6614–6628.
O. E. PETROVA AND K SAUER. 2011. J. BACTERIOL. 193 (23):6614–6628
See above for Biofilm Formation animation First, a specific environmental signal induces a genetic program in planktonic cells. The planktonic cells then start to attach to nearby inanimate surfaces by means of flagella, pili, lipopolysaccharides, or other cell-surface appendages or charge interactions, and they begin to coat that surface with an organic monolayer of polysaccharides or glycoproteins to which more planktonic cells can attach. At this point, cells of some species may move along surfaces using a twitching motility that involves the extension and retraction of a specific type of pilus that pulls the organisms along. Ultimately, the bacteria stop moving and firmly attach to the surface.
As more and more cells bind to the surface, they can begin to communicate with each other by sending and receiving chemical signals in a process called quorum sensing. These chemical signaling molecules are continually made and secreted by individual cells. Once the population reaches a certain number (analogous to an organizational “quorum”), the chemical signal achieves a concentration that the cells can sense (further discussed in Chapter 10). Sensing of the signal molecule triggers genetically regulated changes that cause cells to bind tenaciously to the surface and to each other. Quorum sensing serves the biofilm in many ways. Among other functions, quorum sensing triggers the increased tolerance of biofilms to antibiotics and to phagocytosis by white blood cells. Once established as a nascent biofilm, the cells form a thick extracellular matrix of polysaccharide polymers that entrap organic (DNA and proteins) and inorganic materials (Fig. 4.30). These extracellular polymeric substances or exopolysaccharides (EPS), such as alginate produced by Pseudomonas aeruginosa and colanic acid produced by Escherichia coli, increase the antibiotic tolerance of residents within the biofilm by keeping antibiotics from freely entering the complex. As the biofilm matures, the amalgam of adherent bacteria and matrix takes on complex 3D shapes such as columns and streamers that form channels through which nutrients flow. For many bacteria, sessile (nonmoving) cells in a biofilm chemically “talk” to each other to organize biofilm structure and keep water channels open. Bacillus subtilis also spins out a fibril-like amyloid protein called TasA, which tethers cells and strengthens the biofilm. The effect of TasA on a floating biofilm formed on liquid medium is evident in Figure 4.31.
FIGURE 4.31 ■ Floating biofilm (pellicle) formation of Bacillus subtilis. Electron micrographs of wild-type cells (A) and tasA mutant cells (B) . In the lower panels, cells were grown in a broth for 48 hours without agitation at 30°C. The pellicles formed by wild-type and tasA mutant Bacillus subtilis are
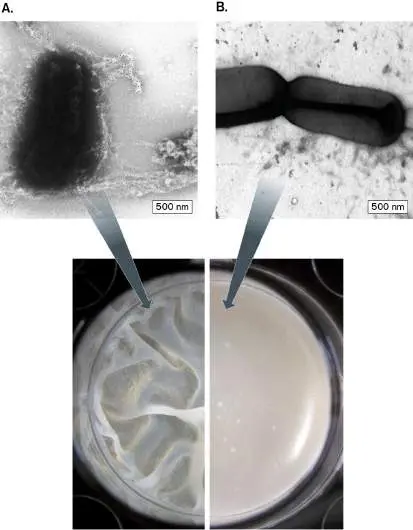
strikingly different. Wild-type pellicles are extremely wrinkly, whereas tasA mutant pellicles are flat and fragile.
DIEGO ROMERO ET AL. 2010. PNAS 107 :2230–2234
DIEGO ROMERO ET AL. 2010. PNAS 107 :2230–2234
DIEGO ROMERO ET AL. 2010. PNAS 107 :2230–2234
DIEGO ROMERO ET AL. 2010. PNAS 107 :2230–2234
Biofilm Differentiation and Communication
Bacteria growing in biofilms also exhibit a type of cell differentiation initiated by physiological conditions that develop in different layers of the biofilm. For example, oxygen does not penetrate deep into biofilms. Imagine a colony growing on agar. Cells at the colony surface will be exposed to oxygen, whereas cells near the agar will not. Colonies of microbes such as E. coli that do not need oxygen to grow will have an actively growing zone at the agar-colony interface. Cells there can, without oxygen, ferment the nutrients diffusing up from the agar. Cells at the colony-air interface will be in stationary phase because the nutrients seeping up from below are consumed before reaching them (Fig. 4.32). The reverse pattern happens for oxygen-requiring bacteria such as Pseudomonas. Oxygen-requiring cells deep in the colony at the agar surface are in stationary phase in part because they can’t get oxygen. Nutrients from the agar are not consumed, so they diffuse toward the oxygen-rich colony surface to feed a narrow growth zone.
FIGURE 4.32 ■ Two-layer differentiation in Escherichia coli biofilms. A. Side view of a cross section through a ridge of a macrocolony (inset) grown on salt-free Luria Bertani (LB) agar plates (a complex medium) for 5 days (SEM). Areas false-colored in red and blue represent zones of cells exhibiting stationary-phase and post-exponential-phase physiologies, respectively. The narrow purple area represents the physiological transition zone between the lower and upper layers. B. SEM images showing stationary-phase cells on the macrocolony surface covered with secreted cellulose (top), transition zone cells covered with pili and cellulose next to “naked” cells (middle), and mesh-entangled flagella of post-exponential-growth cells (bottom).
DIEGO O. SERRA AND REGINE HENGGE. 2014. ENVIRON. MICROBIOL. 16 :1455
DIEGO O. SERRA AND REGINE HENGGE. 2014. ENVIRON. MICROBIOL. 16 :1455
When conditions turn dire (as during carbon limitation), a biofilm can generate nerve-like signals that mediate a kind of nutrient time-share process between sections of the biofilm. Gürol Süel (Fig. 4.33A) and collaborators at UC San Diego discovered this novel
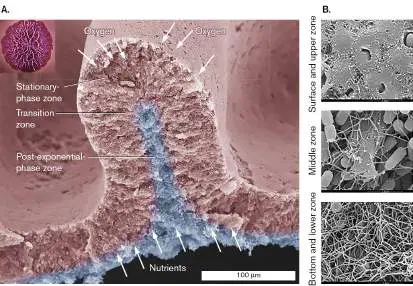
coping mechanism using carbon-starved biofilms of Bacillus subtilis. Biofilms were grown on the walls of a flow cell under a constant stream of low-carbon (glutamate) liquid medium.
FIGURE 4.33 ■ Nutrient time-share in biofilms. A. Gürol Süel studies electrical signaling among Bacillus subtilis biofilms. B. Waves of nerve-like signaling oscillate between adjacent biofilms 1 and 2. Membrane potential (inside positive) was monitored using the blue fluorescent cationic dye ThT. Blue indicates the cell membranes are polarized (dye enters); black reflects depolarized membranes. Scale bar = 50 μm.
COURTESY OF GÜROL SÜEL
J. LIU ET AL. 2017. SCIENCE 356 :638–642, FIG. 2D.
The biofilm’s periphery near the flow can easily acquire passing nutrients, but its base, far from the nutrient stream, cannot. Carbon-starved cells at the base of the biofilm will release potassium (K +). Potassium release causes neighboring cells to depolarize, releasing more K +, and import less glutamate. This electrical wave propagates to the biofilm’s edge. Less glutamate transported at the
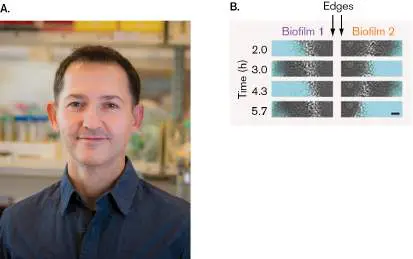
edge enables more glutamate to temporarily diffuse to the interior of the biofilm. As the interior cells feed on negatively charged glutamate, they repolarize. The intermittent waves of K + - dependent electrical signals moving up and down the biofilm enable all areas to feed on the limiting nutrient. The signal can also travel between separate, nearby biofilms to initiate a community-wide time-share of a limiting nutrient (Fig. 4.33B ). The figure shows alternating waves of polarization (blue) to depolarization (black) in adjacent biofilms grown in limiting glutamate. Meanwhile, a fail-safe mechanism meant to ensure survival is triggered. The stressed biofilm disperses single scout cells whose mission is to establish new biofilms in more bountiful environs.
The Breakup (Dissolution)
When the time comes, how do cells escape from a biofilm? When a sessile biofilm (or a part of it) begins to starve or experiences oxygen depletion, some cells start making enzymes that dissolve the matrix. Pseudomonas aeruginosa, for instance, produces an alginate lyase that can strip away the EPS. Cells of Bacillus subtilis sever their links to TasA fibers in some as-yet unknown way. The sessile biofilm then sends out “scouts” called dispersal cells to initiate new biofilms. For scouts to form, genes whose products make EPS must be turned off, and for bacteria capable of motility, genes needed for flagella must be activated. Dispersed cells have properties different from typical planktonic cells, such as increased expression of adhesion factors needed to establish new biofilms and, for pathogens, virulence factors that release nutrients from a host or inhibit host immune systems.
Recall that biofilms are important for chronic infections, so preventing or reversing their formation could prove therapeutic. Two intracellular signaling molecules critical to biofilm development and dispersal in many bacteria are the unusual nucleotides cyclic dimeric guanosine monophosphate (c-di-GMP) and guanosine tetra-and pentaphosphate [(p)ppGpp]. High concentrations of either molecule promote biofilm formation, whereas low levels promote dispersal. Robert Hancock and colleagues from the University of British Columbia may have found a way to undo a biofilm’s architecture by targeting one of these signal nucleotides. They discovered two synthetic antibiofilm peptides that bind the signaling molecule (p)ppGpp and promote its degradation in various pathogens. When used in vitro, these peptides caused the death and dispersal of biofilm cells (Fig. 4.34). The antibiofilm peptides were also effective in treating Pseudomonas infections in mice, suggesting that these peptides could play a role in treating human disease. An extended explanation of biofilm formation by P. aeruginosa is found in Section 12.2.
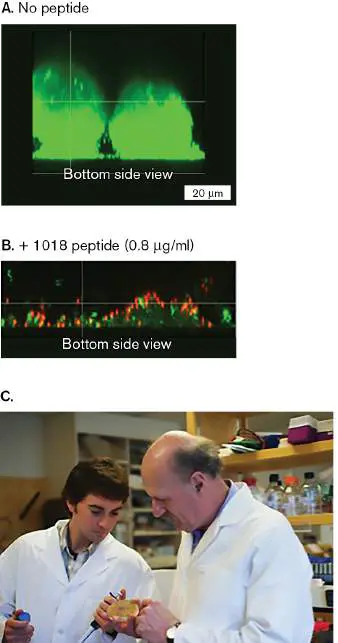
FIGURE 4.34 ■ Effect of an antibiofilm peptide on a Pseudomonas biofilm. Confocal images of a 2-day-old Pseudomonas biofilm (side views) after 23 hours of no peptide (A) or with antibiofilm peptide treatment (B) The peptide promotes degradation of the intracellular signaling molecule (p)ppGpp. Cells were stained with live/dead stain in which live cells fluoresce green and dead cells stain red. Most cells from the treated biofilm were dead or had dispersed. (C) Robert Hancock (right) and master’s student Pat Taylor.
CESAR DE LA FUENTE-NUNEZ ET AL. 2014. PLOS PATHOG. 10 (5):E1004152
CESAR DE LA FUENTE-NUNEZ ET AL. 2014. PLOS PATHOG. 10 (5):E1004152
TAMEA BURD PHOTOGRAPHY
Organisms adapted to life in extreme environments also form biofilms. Archaea form biofilms in acid mine drainage (pH 0), where they contribute to the recycling of sulfur, and cyanobacterial biofilms are common in thermal springs. In the ocean there are suspended particles of biofilm called “marine snow” comprising many unidentified organisms (discussed in Chapter 21). The particles seem to be capable of methanogenesis, nitrogen fixation, and sulfide production, indicating that the architecture of biofilms enables anaerobic metabolism to occur in an otherwise aerobic environment.
To Summarize
Biofilms are complex, multicellular, surface-attached microbial communities.
Chemical signals enable bacteria to communicate ( quorum sensing ) and in some cases to form biofilms. Biofilm development involves the adherence of cells to a substrate, the formation of microcolonies, and, ultimately, the development of complex channeled communities that generate new planktonic cells.
Glossary
biofilm A community of microbes growing on a solid surface.
twitching motility A type of bacterial movement on solid surfaces in which a specific pilus extends and retracts.
quorum sensing The ability of bacteria to sense the abundance of other bacteria via secreted chemical signals called autoinducers.
exopolysaccharides (EPS)
Also called extracellular polymeric substance. Polysaccharides and entrapped materials that form a thick extracellular matrix around the microbes in a biofilm.
Figure 2.33 FIGURE 2.33 ■ Biofilm with live/dead fluorophore, observed by confocal laser scanning microscopy.
Pseudomonas aeruginosa cells growing in a biofilm treated with the antibiotic tobramycin. Dead cells fluoresce red; live cells fluoresce green.
MORTEN HENTZER AND MICHAEL GIVSKOV. 2003. J. CLIN. INVEST. 112 :1300
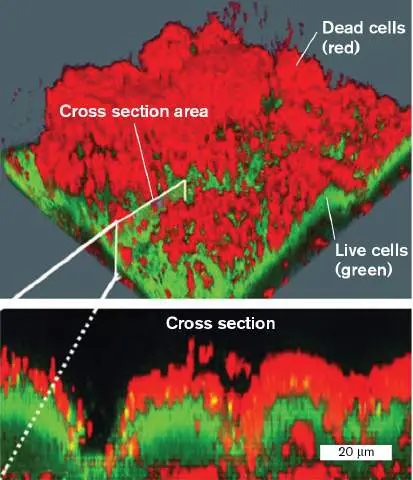
4.6 Cell DifferentiationUnit 5 · Regulation
Can bacteria change shape? Many bacteria faced with environmental stress undergo complex molecular reprogramming that includes changes in cell structure. Some species, such as Escherichia coli, experience relatively simple changes in cell structure, such as the formation of smaller cells or thicker cell surfaces. However, select species undergo elaborate cell differentiation processes. Bacillus and Clostridium species form suspended animation spores that can survive for extremely long periods without any sustenance and then germinate into vegetative cells once nutrients return (Fig. 4.35). In this section we discuss the process of bacterial sporulation and introduce how cyanobacteria make nitrogen-fixing cells, Myxococcus builds fruiting bodies, and Streptomyces develops fungus-like colonies that can produce spores and antibiotics.
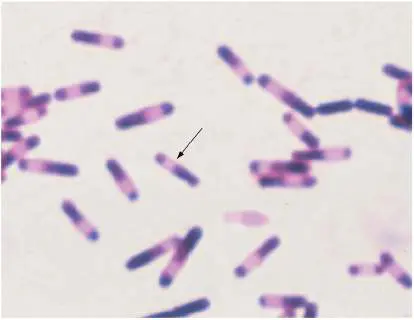
FIGURE 4.35 ■ Photomicrograph of Clostridioides difficile endospores. The cells (approx. 3 μm long) are stained with crystal violet. The cells are blue, whereas the spores are colorless and located inside the cells (arrow).
CDC, HTTP://PHIL.CDC.GOV/PHIL/HOME.ASP
Endospores Are Bacteria in Suspended Animation
Certain Gram-positive genera, including important pathogens such as Clostridium tetani (tetanus), Clostridioides difficile (pseudomembranous colitis), and Bacillus anthracis (anthrax), have the remarkable ability to develop dormant spores that are heat and desiccation resistant (Fig. 4.35). Spores are particularly hardy because they do not grow and do not need nutrients until they germinate. Resistance to heat and desiccation (and its lethal toxin) makes B. anthracis spores a potential bioweapon.
Most of what we know about bacterial sporulation comes from the Gram-positive soil bacterium Bacillus subtilis. When growing in rich media, this microbe undergoes normal vegetative growth and can replicate every 30–60 minutes. However, starvation initiates an elaborate 8-hour genetic program that directs an asymmetrical cell division process and ultimately yields a spore.
As shown in Figure 4.36A, sporulation is divided into seven discrete stages that are based primarily on cell morphology. Stage 0 (not shown) represents the point at which the vegetative cell “decides” to use one of two potential polar division sites to begin septum formation instead of the central division site used for vegetative growth. In stage I, the genome is replicated, and the duplicate chromosomes are stretched into a long axial filament that spans the length of the cell. Ultimately, one of the polar division sites wins out and forms a septum. In stage II, the septum divides the cell into two unequal compartments: the smaller forespore, which will ultimately become the spore, and the larger mother cell, from which the forespore is derived. Each compartment eventually contains one of the replicated chromosomes. (Most of the chromosome in the forespore has to be pumped in after septum formation.)
In stage III of sporulation, the mother cell membrane engulfs the forespore. Next, the mother cell chromosome is destroyed (stage IV), and a thick peptidoglycan layer (cortex) is placed between the two membranes surrounding the forespore protoplast (stage V). Layers of coat proteins are then deposited on the outer membrane, also in stage V. Stage VI completes the development of spore resistance to heat and chemical insults. This last process includes the synthesis of dipicolinic acid (which stabilizes and protects spore DNA) and the uptake of calcium into the coat of the spore. Finally, the mother cell, now called a sporangium, releases the mature spore (stage VII).
Spores resist many environmental stresses that would kill vegetative cells. Spores owe this resistance, in part, to their desiccation (they have only 10%–30% of a vegetative cell’s water content). But, as discovered by Peter Setlow and colleagues (Fig. 4.36B ), spores are also packed with small acid-soluble proteins (SASPs) that bind to and protect DNA. The SASP coat protects the spore’s DNA from damage by ultraviolet light and various toxic chemicals.
FIGURE 4.36 ■ Endospore formation. A. The seven stages of endospore formation. B. Peter Setlow (right) of the University of Connecticut figured out how proteins regulate the process of endospore differentiation.
COURTESY OF PETER SETLOW
A fully mature endospore can exist in soil for at least 50–100 years, and endospores have been known to last thousands of years. Once proper nutrient conditions arrive, another genetic program, called germination, is triggered to wake the dormant cell, dissolve the spore coat, and release a viable vegetative cell.
While sporulation is an effective survival strategy, bacteria that sporulate actually go out of their way not to sporulate—even to the point of cannibalism. During nutrient limitation, these bacteria will
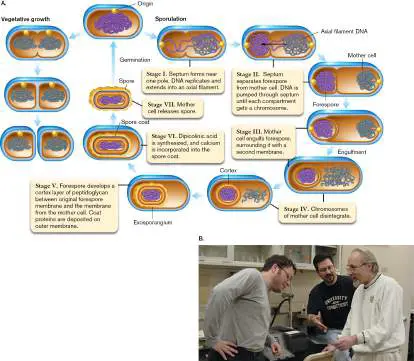
secrete proteins that can kill their siblings and then use the released nutrients to prevent starvation and, thus, sporulation. When (and only when) that strategy fails, the ill-fated cells sporulate.
Cyanobacteria Differentiate to Fix Nitrogen
Cyanobacteria, sometimes called blue-green algae, are a special class of bacteria (they are not really algae) that can carry out photosynthesis. Some species are filamentous, multicellular organisms. A single filament can comprise hundreds of cells (Fig. 4.37). Some autotrophic filamentous cyanobacteria, such as Anabaena, not only carry out photosynthesis but also “fix”
atmospheric nitrogen to make ammonia. This is surprising because nitrogenase, the enzyme required to fix nitrogen, is very sensitive to oxygen, which is produced as a by-product of photosynthesis. So, one might expect that photosynthesis and nitrogen fixation would be mutually exclusive physiological activities. Anabaena solved this dilemma by developing specialized cells, called heterocysts, that can fix nitrogen (Fig. 4.37). A tightly regulated genetic program converts every tenth photosynthetic, vegetative cell to a heterocyst. As part of the differentiation process, heterocysts make nitrogenase, produce three additional cell walls, and form a specialized envelope that provides a barrier to atmospheric O 2. In addition, these cells degrade the photosynthesis machinery that produces O 2. The heterocyst then supplies nitrogen compounds to the adjacent vegetative cells, which, in turn, send carbon sugars to the heterocyst. The precise spacing of heterocysts relies on the ratio of inhibitors relative to activators produced by different cells in the chain. Inhibitors predominate in vegetative cells, whereas cells fated to become heterocysts contain higher levels of an activator. Heterocysts do not provide the survival resistance of bacterial endospores, but they can differentiate into spore-like cells called akinetes.
FIGURE 4.37 ■ Cyanobacteria and heterocyst formation. The cyanobacterium Anabaena. The expression of genes in heterocysts is different from their expression in other cells. All cells in the figure contain a cyanobacterial gene to which the gene for green fluorescent protein (GFP) has been spliced. Only cells that have formed heterocysts are expressing the fused gene, which makes the heterocyst cell fluoresce bright green.
WILLIAM BUIKEMA, U. OF CHICAGO
Myxococcus Differentiation Is a “Family” Gathering
Certain species of bacteria produce architectural marvels called fruiting bodies—the microbial equivalent of a barn raising. The Gram-negative, soil-dwelling species Myxococcus xanthus uses gliding motility (involving a type of pilus, not a flagellum) to travel on surfaces as individuals or to move together as a mob (Fig. 4.38 ). Starvation triggers a developmental cycle in which 100,000 or
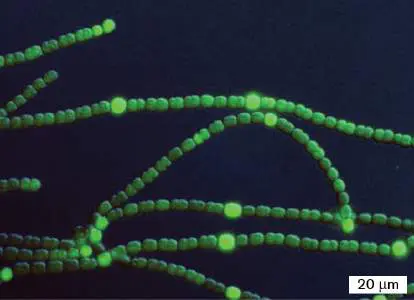
more individuals attract each other, aggregate, and rise into a mound called a fruiting body. To be successful, only M. xanthus cells from the same clonal line (siblings) are permitted to join the swarm. Specific cell-surface receptors ensure kinship and make possible the exchange of outer membranes between individuals. The outer membrane exchanges aid the swarm to transition from unconnected individuals into an interactive multicellular organism. Myxococci within the interior of the fruiting body differentiate into thick-walled, spherical spores that are released into the surroundings. The random dispersal of spores is an attempt to find new sources of nutrients. This differentiation process requires many cell-cell interactions and a complex genetic network that is slowly being unraveled.
FIGURE 4.38 ■ Myxococcus swarm, erecting a fruiting body. Approximately 100,000 cells begin to aggregate, and over the course of 72 hours they erect a fruiting body.
J. M. KUNER AND D. KAISER 1982. JOURNAL OF BACTERIOLOGY 151 :458.
Actinomycetes: The Fungus-like Bacteria
Many of the antibiotics we use today come from a group of bacteria called actinomycetes. The actinomycetes, such as Streptomyces [within the order Streptomycetales (formerly Actinomycetales); see Chapter 18], are bacteria that form mycelia and sporangia analogous to the filamentous structures of eukaryotic fungi (Fig. 4.39). Several developmental programs tied to nutrient availability are at work in this process (Fig. 4.40). Under favorable nutrient conditions, a germ tube emerges from a germinating spore, grows
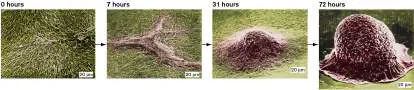
from its tip (tip extension), and forms branches that grow along, and within, the surface of its food source (Fig. 4.40, step 1). This type of growth produces an intertwined network of long multinucleate filaments (hyphae; singular, hypha) collectively called substrate mycelia (singular, mycelium). After a few days, a signaling molecule made by the organisms accumulates to a level that activates a new set of genes, including one encoding a surfactant, that allow hyphae to grow into the atmosphere, rising above the surface to form aerial mycelia (Fig. 4.40, steps 2a and 2b). Compartments at the tips of these aerial hyphae contain 20–30 copies of the genome. Aerial hyphae stop growing as nutrients decline, triggering a developmental program that synthesizes antibiotics. Meanwhile, the older ends of the filaments senesce, and their decomposing cytoplasm attracts scavenger microbes—which are killed by the antibiotics. The younger streptomycete cells then feast on the dead scavengers.
FIGURE 4.39 ■ Bacterial mycelia. A. Streptomyces substrate mycelia. B. Filamentous colonies of Streptomyces coelicolor, an actinomycete known for producing antibiotics (blue pigment in water droplets). C. Streptomyces aerial hyphae. The arrow points to a hyphal spore (approx. 1 μm each).
DAVID SCHARF/SCIENCE SOURCE
MERVYN BIBB AND ANDREW DAVIS (JOHN INNES CENTRE)
KIM FINDLAY AND MARK BUTTNER (JOHN INNES CENTRE)
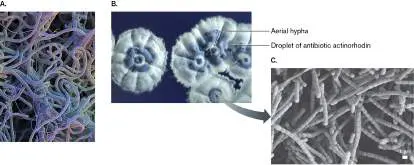
FIGURE 4.40 ■ Developmental cycle of Streptomyces coelicolor.
The aerial hyphae ultimately produce spores (arthrospores) that are fundamentally different from bacterial endospores. This program lays down multiple septa that subdivide the compartment into single-genome prespores (Fig. 4.40, step 3). The shape of the prespore then changes, its cell wall thickens, and deposits are made in the spore that all increase resistance to desiccation. The result is a quiescent form of the species that can withstand a variety of environmental assaults.
A fourth stage of Streptomyces development was recently described by Marie Elliot at McMaster University (Fig. 4.40, step 4). Called exploratory growth, this fourth stage develops when nutrient profiles in the soil change (low glucose level and alkaline pH). Such changes can happen after the growth of competing soil
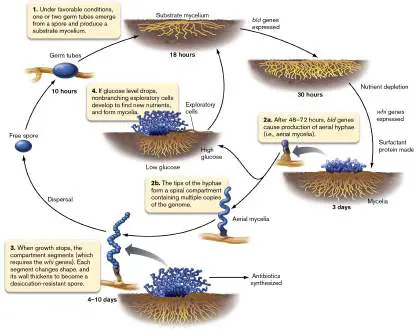
organisms such as yeast. The nutrient and pH changes initiate the growth of nonbranching filaments (explorer cells) that emerge from the mass of sporulating cells to find new, but distant, sources of food. The explorer cells also emit an airborne signal compound, trimethylamine, that stimulates explorer growth in distant Streptomyces colonies. This newly described developmental stage is a bet-hedging strategy to scavenge nutrients for the group while the sporulating cells provide a highly resistant genetic repository that ensures colony survival in case exploration fails.
Streptomyces species remain of tremendous scientific interest, both for their fascinating developmental programs and for their ability to make antibiotics.
Thought Question
4.14 How might members of the Actinomycetales such as Streptomyces species avoid “committing suicide” when they make their antibiotics?
To Summarize
Microbial development involves complex changes in cell forms.
Endospore development by Bacillus, Clostridium, and Clostridioides species is a multistage process that includes asymmetrical cell division to make a forespore and a mother cell, forespore engulfment by the mother cell, deposition of coat proteins around the forespore, and steps that increase chemical and heat resistance of the endospore.
Heterocyst development enables cyanobacteria to fix nitrogen anaerobically while maintaining oxygenic photosynthesis.
Multicellular fruiting bodies in Myxococcus and mycelia in actinomycetes develop in response to starvation, dispersing dormant cells to new environments.
Aerial hyphae of Streptomyces produce arthrospores that are fundamentally different from endospores, but, like endospores, arthrospores can survive a variety of environmental stresses.
Glossary
forespore In sporulation of Gram-positive bacteria, the smaller cell compartment formed through asymmetrical cell division; it develops into the endospore.
mother cell In sporulation of Gram-positive bacteria, the larger cell that forms during the asymmetrical cell division leading to spore formation. The mother cell will engulf the forespore, but then disintegrates as the forespore matures.
germination The activation of a dormant spore to generate a vegetative cell. gliding motility The movement of cells individually or as a collective over surfaces using specialized pili.
hypha pl. hyphae The threadlike filament that forms the mycelium of a fungus. hypha pl. hyphae The threadlike filament that forms the mycelium of a fungus. mycelium pl. mycelia A single mass of fungal hyphae that projects into the air (aerial mycelium) or into the growth substrate (surface mycelium). mycelium pl. mycelia A single mass of fungal hyphae that projects into the air (aerial mycelium) or into the growth substrate (surface mycelium). eResearch Activity 4
Can Bacteria Unite to Defeat Predators?
It’s a tough world out there in nature, especially if you are a bacterium about to become dinner for a hungry ameba. Could different bacterial species about to become prey somehow gang up on those predatory amebas? This question was asked by Pierre Stallforth (Fig. ERA 4.1 ) and colleagues at the Hans Knöll Institute in Germany. The scientists knew that many complex microbial traits exhibited in nature require cooperation between numerous microorganisms, and that predation can be a strong selective pressure to drive antipredatory, cooperative behaviors among those preyed upon.
FIGURE ERA 4.1 ■ The laboratory of Pierre Stallforth (right) examines cooperative antipredator behavior by Pseudomonas and Paenibacillus. His graduate student Shuaibing (Bing) Zhang (left) and postdoctoral student Ruchira Mukherji (not shown) were lead authors on the study.
MARKUS GUENTHER
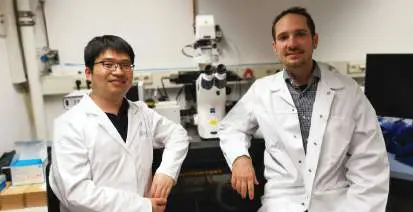
The scientists turned to Dictyostelium discoideum, a species of social ameba, as the predator. As single cells, these amebas are attracted to and feed on bacteria. However, as they feed, the unicellular amebas divide until they starve, at which point the single cells gather in a pile and rise up to form a fruiting body, a multicellular tower easily seen by the naked eye (see Figure 20.20 ). Spores formed at the tip of this body are ultimately released and carried by the wind to new habitats.
The Hans Knöll Institute scientists hypothesized that if a pair of bacterial species in soil could collaborate to kill the rampaging ameba, both species would be spared, and fruiting bodies would not be formed. To test their hypothesis, the researchers analyzed pairings of 28 bacterial species isolated from the forest soil habitat of D. discoideum. All of the strains examined were susceptible to predation when grown individually. However, some pairs of these species could kill their predator, but only when cultured together. Figure ERA 4.2 illustrates what happened when two of these bacterial species, the Gram-positive Paenibacillus SZ31 and the Gram-negative Pseudomonas SZ57, were spread individually (Fig. ERA 4.2A and B ) or together (Fig. ERA 4.2C ) onto agar medium and cells of D. discoideum added. Round clearings (plaques; Fig. ERA 4.2A and B ) indicated that the amebas successfully grazed on the bacteria when the bacteria were plated individually. However, the absence of plaques in panel C indicated that when the two species of bacteria were plated together, they were either unpalatable or they collaborated to kill their predators. FIGURE ERA 4.2 ■ Edibility of individual bacterial strains when subjected to grazing by Dictyostelium discoideum. Overnight cultures of bacteria (30 μ>l) were spread onto agar and dried for 2 hours. Then 10,000 ameba cells were added onto the lawns. Small, circular areas of clearing (plaques) indicated that the ameba successfully fed on the bacteria. SZ31 = Paenibacillus; SZ57 = Pseudomonas; SZ57Δ syf = Pseudomonas syringafactin deletion.
S. ZHANG ET AL. 2021. PROC NATL ACAD SCI USA. 118 :E2013759118
The scientists then probed for metabolites secreted from the two bacteria that might kill the ameba. They used a technique called liquid chromatography–mass spectrometry (LC-MS) to analyze culture extracts from individually grown and cocultured organisms. Fig ERA 4.3A shows the profiles of the products produced in liquid culture: Paenibacillus did not secrete any detectable metabolites by this analysis (vi), but the Pseudomonas strain SZ57 secreted two forms of syringafactin called A and C even when grown alone (v). Syringafactins (Fig. ERA 4.3B ) are a family of lipo-octapeptides that are synthesized enzymatically, not by ribosomes. The surprise came when Pseudomonas was coincubated with Paenibacillus; two slightly shortened degradation products (iv) of syringafactins A and C were observed (A −1, C −1). When purified and added to ameba cultures, neither A nor C syringafactins had amebicidal activity. However, the degradation products A −1 and C −1 produced during
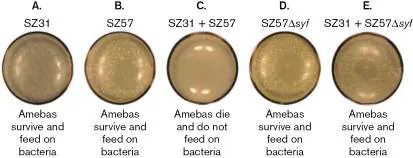
coculture were highly toxic to ameba. A fluorescent stain (fluorescein diacetate) that discriminates between live and dead ameba showed extensive cell death.
FIGURE ERA 4.3 ■ LC-MS profiles of secreted compounds found in Paenibacillus and Pseudomonas liquid coculture extracts. A. Syringafactins A and C and their derivatives A −1 and C −1 are detected in cultures of SZ57. The x -axis indicates the time the compounds eluted from liquid chromatography before mass spectrometric analysis. B.
Syringafactin structure. Syringafactins A −1 and C −1 are derivatives of A and C shortened by one amino acid.
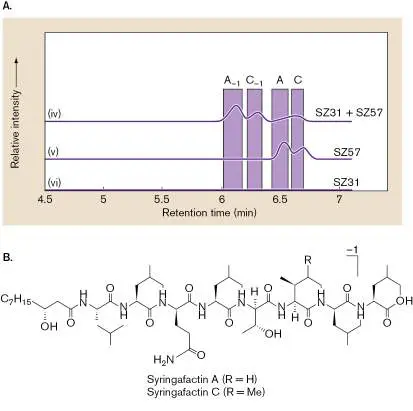
Next, a syf gene required for syringafactin synthesis was deleted from Pseudomonas, and the new strain was cocultured with Paenibacillus. Now the coculture supernatant would no longer fend off amebic predation (Fig. ERA 4.2D and E ), providing further evidence that the shorter syringafactins were involved in antipredation.
In sum, the results suggest that Pseudomonas SZ57 produces syringafactins that must be shortened by a Paenibacillus SZ31 peptidase in order to become deadly to the ameba. The scientists concluded more broadly that evolutionary selection pressures can act not only on individual organisms but also on the combined gene pools of bacterial communities, enabling members to develop cooperative behaviors.
Further Exploration
What experiments or processes would you perform to see whether a peptidase made by Paenibacillus was actually required for antipredator cooperative behavior?
Zhanga, Shuaibing, Ruchira Mukherjia, Somak Chowdhurya, Lisa Reimera, and Pierre Stallforth. 2021. Lipopeptide-mediated bacterial interaction enables cooperative predator defense. Proceedings of the National Academy of Sciences USA 118 (6):e2013759118.
Glossary
Figure 20.20 FIGURE 20.20 ■ A cellular slime mold: Dictyostelium discoideum. A. Fruiting bodies of D. discoideum (composite SEM). B. D. discoideum aggregation of cells, mediated by waves of cAMP signal. Green fluorescence indicates cAMP binding a cAMP-dependent fluorophore, Flamindo2. C. Life cycle of D. discoideum.
Source: Inset from Hidenori Hashimura et al. 2019. Commun. Biol. 2 :34.
DAVID SCHARF/SCIENCE SOURCE
H. HASHIMURA ET AL. 2019. COMMUN BIOL. 2 :34
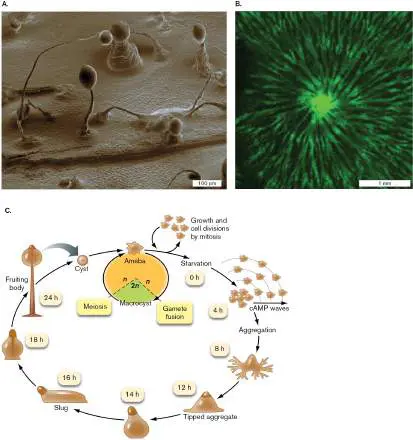
CHAPTER REVIEW
Review Questions
1. What nutrients do microbes need to grow?
2. Explain how autotrophy, heterotrophy, phototrophy, and chemotrophy differ.
3. Explain the basics of the carbon and nitrogen cycles. 4. Describe the various mechanisms that transport nutrients in prokaryotes and eukaryotes. What are facilitated diffusion, coupled transport, ABC transporters, group translocation, and endocytosis?
5. Why is it important to grow bacteria in pure culture? 6. Under what circumstances would you use a selective medium? A differential medium?
7. What factors define the growth phases of bacteria grown in batch culture?
8. Describe the important features of biofilms.
9. Name three kinds of bacteria that differentiate, and give highlights of the differentiation processes.
Thought Questions
1. Bile salts are used in certain selective media. What are bile salts, and why might they be more harmful to Gram-positive organisms than to Gram-negatives?
2. Why is Rickettsia prowazekii, which can grow only in the cytoplasm of a eukaryotic cell, considered a living organism but viruses are not?
3. Suppose 1,000 bacteria are inoculated in a tube containing a minimal salts medium, where they double once an hour, and 10 bacteria are inoculated into rich medium, where they double in 20 minutes. Which tube will have more bacteria after 2 hours? After 4 hours? 4. An exponentially growing culture has an optical density at 600 nm (OD 600) of 0.2 after 30 minutes and an OD 600 of 0.8 after 80 minutes. What is the doubling time?
5. Microbes that grow at high NaCl concentrations are called halophiles. Describe how you would isolate a halophilic organism from the natural environment.
6. Mercuric ions (Hg 2+) and methylmercury [(CH Hg) +]
3
are major, human-generated, toxic contaminants of water and soil. Some species of bacteria can bioremediate these compounds by transporting them into the cell and reducing them to elemental mercury (Hg 0). One of the transport proteins is called MerC. Use the Internet to determine how many organisms have a MerC homolog.
7. Environmental bacteria were isolated from the water reservoirs of insect-digesting pitcher plants. The isolated strains were cultured in tryptone–yeast extract broth, which contains many different peptide and carbohydrate nutrients. The different growth curves obtained are shown in the graph. Explain how these curves differ from the “standard” growth curve and propose hypotheses as to why they differ.
Key Terms
ABC transporter (132)
antiport (130)
ATP synthase (127)
autotrophy (125, 126)
batch culture (148)
binary fission (146)
biofilm (153)
chemolithoautotrophy (126) chemoorganoheterotrophy (127)
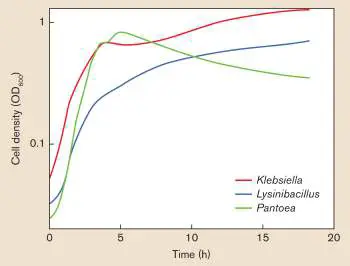
chemostat (152)
chemotrophy (126)
cofactor (125)
colony (136)
complex medium (136)
confluent (136)
continuous culture (152) coupled transport (130)
death phase (152)
death rate (152)
denitrification (128)
differential medium (138) dilution streaking (135) doubling time (147)
electrochemical potential (127) enriched medium (137)
enrichment medium (138)
essential nutrient (124) exopolysaccharide (EPS) (155) exponential phase (149)
extracellular polymeric substances (EPS) (155) facilitated diffusion (130) flow cytometry (144)
fluorescence-activated cell sorting (FACS) (144) forespore (158)
generation time (147)
germination (158)
gliding motility (160)
group translocation (134) growth factor (139)
growth rate (147)
growth rate constant (148) heterotrophy (125, 126)
hypha (160)
lag phase (149)
lithotrophy (128)
logarithmic (log) phase (149) macronutrient (124)
membrane potential (127) micronutrient (125)
minimal defined medium (137) mother cell (158)
mycelium (160)
nitrification (128)
nitrogen-fixing bacterium (128) optical density (145)
organotrophy (126)
permease (129)
phosphotransferase system (PTS) (134) photoautotrophy (126)
photolithoautotrophy (or photoautotrophy) (126) photoorganotrophy (127)
phototrophy (126)
planktonic cell (147)
pour plate technique (144) proton potential (proton motive force) (127) pure culture (135)
quorum sensing (154)
rich medium (136)
selective medium (138)
siderophore (133)
spread plate (136)
stationary phase (150)
symbiont (128)
symport (130)
twitching motility (154) uncultured (139)
viability PCR (146)
viable (136)
Recommended Reading
Asfahl, Kyle L., and Martin Schuster. 2017. Social interactions in bacterial cell-cell signaling. FEMS Microbiology Reviews 41 :92– 107.
Bergauera, Kristin, Antonio Fernandez-Guerrab, Juan A. L. Garcia, Richard R. Sprengerd, Ramunas Stepanauskase, et al. 2018. Organic matter processing by microbial communities throughout the Atlantic water column as revealed by metaproteomics. Proceedings of the National Academy of Sciences USA 115 :E400–E408.
Diez, Simon, Jaewook Ryu, Kelvin Caban, Ruben L. Gonzalez, Jr., and Jonathan Dworkin. 2020. The alarmones (p)ppGpp directly regulate translation initiation during entry into quiescence. Proceedings of the National Academy of Sciences USA 117 :15565–15572.
Eswara, Prahathees J., and Kumaran S. Ramamurthi. 2017. Bacterial cell division: Nonmodels poised to take the spotlight. Annual Review of Microbiology 71 :393–411.
Gefen, Orit, Ofer Fridman, Irine Ronin, and Nathalie Q. Balaban. 2014. Direct observation of single stationary-phase bacteria reveals a surprisingly long period of constant protein production activity. Proceedings of the National Academy of Sciences USA 111 :556–561.
Geesink, Patricia, Carl-Eric Wegner, Alexander J. Probst, Martina Herrmann, Anne-Kristin Kaster, and Kirsten Küsel. 2020. Genome-inferred spatio-temporal resolution of an uncultivated Roizmanbacterium reveals its ecological preferences in groundwater. Environmental Microbiology 22 :726–737. https://doi.org/10.1111/1462-2920.14865.
Golonka, Rachel, Beng San Yeoh, and Matam Vijay-Kumar. 2019. The iron tug-of-war between bacterial siderophores and innate immunity. Journal of Innate Immunity 11 :249–262. https://doi.org/10.1159/000494627.
Guilhen, Cyril, Christiane Forestier, and Damien Balestrino. 2017. Biofilm dispersal: Multiple elaborate strategies for dissemination of bacteria with unique properties. Molecular Microbiology 105 :188–210.
Kaur, Amandeep, Neena Capalash, and Prince Sharma. 2019. Communication mechanisms in extremophiles: Exploring their existence and industrial applications. Microbiological Research 221 :15–27.
Lewis, William H., Guillaume Tahon, Patricia Geesink, Diana Z. Sousa. and Thijs J. G. Ettema. 2021. Innovations to culturing the uncultured microbial majority. Nature Reviews. Microbiology 19:225–240. https://doi.org/10.1038/s41579-020-00458-8.
Li, Jing, Dongru Chen, and Huancai Lin. 2021. Antibiofilm peptides as a promising strategy: Comparative research. Applied Microbiology and Biotechnology 105 :1647–1656.
https://doi.org/10.1007/s00253-021-11103-6.
Oliveira, Fernando, Holger Rohde, Manuel Vilanova, and Nuno Cerca. 2021. The emerging role of iron acquisition in biofilm-associated infections. Trends in Microbiology 29 :P772– 775. https://doi.org/10.1016/j.tim.2021.02.009.
Pechter, Kieran B., Liang Yin, Yasuhiro Oda, Larry Gallagher, Jianming Yang, et al. 2017. Molecular basis of bacterial longevity. mBio 8 :e01726-17.
Pengbo, Cao, and Daniel Wall. 2017. Self-identity reprogrammed by a single residue switch in a cell surface receptor of a social bacterium. Proceedings of the National Academy of Sciences USA 114 :3732–3737.
Pletzer, Daniel, Heidi Wolfmeier, Manjeet Bains, and Robert E. W. Hancock. 2017. Synthetic peptides to target stringent response-controlled virulence in a Pseudomonas aeruginosa murine cutaneous infection model. Frontiers in Microbiology 8:1867. https://doi.org/10.3389/fmicb.2017.01867.
Riley, Eammon P., Javier Lopez-Garrido, Joseph Sugie, Roland B. Liu, and Kit Pogliano. 2021. Metabolic differentiation and intercellular nurturing underpin bacterial endospore formation. Science Advances 22 : eabd6385.
https://doi.org/10.1126/sciadv.abd6385.
Saha, Maumita, Subhasis Sarkar, Biplab Sarkar, Bipin Kumar Sharma, Surajit Bhattacharjee, et al. 2016. Microbial siderophores and their potential applications: A review. Environmental Science and Pollution Research International 23:3984–3999.
Schätzle, Hannah, Sergio Arévalo, Enrique Flores, and Enrico Schleiff. 2021. A TonB-like protein, SjdR, is involved in the structural definition of the intercellular septa in the heterocyst-forming Cyanobacterium anabaena. mBio 12 :e00483-21.
https://doi.org/10.1128/mBio.00483-21.
Serra, Diego O., and Regina Hengge. 2014. Stress responses go three dimensional—the spatial order of physiological differentiation in bacterial macrocolony biofilms. Environmental Microbiology 16 :1455–1471.
Teschler, Jennifer K., David Zamorano-Sánchez, Andrew S. Utada, Christopher J. A. Warner, Gerard C. L. Wong, et al. 2015. Living in the matrix: Assembly and control of Vibrio cholerae biofilms. Nature Reviews. Microbiology 13 :255–268. Yin, Liang, Hongyu Ma, Ernesto S. Nakayasu, Samuel H.
Payne, David R. Morris, and Caroline S. Harwood. 2019. Bacterial longevity requires protein synthesis and a stringent response. mBio 10 :e02189-19.
Glossary
essential nutrient A compound that an organism cannot synthesize and must acquire from the environment in order to survive.
macronutrient A nutrient that an organism needs in large quantity.
cofactor A metallic ion or a coenzyme required by an enzyme to perform normal catalysis.
micronutrient A nutrient that an organism needs in small quantity, typically a vitamin or a mineral.
heterotrophy Also called chemoorganoheterotrophy. The use of external sources of organic carbon compounds for biosynthesis. autotrophy The metabolic reduction of carbon dioxide to produce organic carbon for biosynthesis.
organotrophy Also called chemoorganotrophy or chemoheterotrophy. The metabolic oxidation of organic compounds to yield energy without absorption of light.
phototrophy The use of chemical reactions powered by the absorption of light to yield energy.
chemotrophy Metabolism that yields energy from oxidation-reduction reactions without using light energy.
chemolithoautotrophy Metabolism in which single-carbon compounds are fixed into organic biomass, using energy from chemical reactions without light absorption.
photoautotrophy The fixation of single-carbon compounds into organic biomass, using light as an energy source.
photolithoautotrophy A form of metabolism that yields energy from light absorption and uses that energy to fix CO 2 into biomass.
chemoorganoheterotrophy A form of metabolism that uses organic carbon sources to obtain energy and build biomass. Also called heterotrophy.
photoorganotrophy A form of metabolism that obtains energy either from the catabolism of organic compounds or through the absorption of light.
membrane potential Energy stored as an electrical voltage difference across a membrane.
electrochemical potential A type of potential energy formed by the combined concentration gradient of a molecule and the electrical potential across a membrane.
proton potential or proton motive force (PMF)
The potential energy of the concentration gradient of protons (hydrogen ions; H +) plus the charge difference across a membrane.
ATP synthase A protein complex that synthesizes ATP from ADP and inorganic phosphate using energy derived from the transmembrane proton potential. It is located in the prokaryotic cell membrane and in the mitochondrial inner membrane.
nitrogen-fixing bacterium A bacterium that can reduce diatomic nitrogen gas (N 2) to two molecules of ammonium ion (NH +).
4
symbiont An organism that lives in a close association with another organism.
nitrification The oxidation of reduced nitrogen compounds to nitrite or nitrate.
lithotrophy Also called chemolithotrophy. The metabolic oxidation of inorganic compounds to yield energy and fix single-carbon compounds into biomass.
denitrification Also called dissimilatory nitrate reduction. Energy-yielding metabolism in which nitrate (NO −) is reduced to nitrite (NO
3 2
−), diatomic nitrogen (N), and in some cases ammonia (NH
2 3
).
permease A substrate-specific carrier protein in the membrane. facilitated diffusion A process of passive transport across a membrane that is facilitated by transport proteins.
coupled transport The movement of a substance against its electrochemical gradient (from lower to higher concentration or from opposite charge to like charge) using the energy provided by the simultaneous movement of a different chemical down its electrochemical gradient.
symport Coupled transport in which the molecules being transported move in the same direction across the membrane.
antiport Coupled transport in which the molecules being transported move in opposite directions across the membrane.
ABC transporter An ATP-powered transport system that contains an ATP-binding cassette.
siderophore A high-affinity iron-binding protein used to scavenge iron from the environment and deliver it to a siderophore-producing organism.
group translocation A form of active transport in which the transported molecule is modified after it enters the cell, thus keeping a favorable inward concentration gradient for the unmodified extracellular molecule.
phosphotransferase system (PTS)
A group translocation system that uses phosphoenolpyruvate to transfer phosphoryl groups onto the incoming molecule. pure culture A culture containing only a single strain or species of microorganism. A large number of microorganisms that all descended from a single individual cell.
dilution streaking A method of spreading bacteria on a plate in order to obtain colonies arising from an individual bacterium.
colony A visible cluster of microbes on a plate, all derived from a single founding microbe. Usually consists of a clone , except for infrequent mutations.
spread plate A method to grow separate bacterial colonies by plating serial dilutions of a liquid culture.
confluent Describing a mode of growth that results in a lawn of organisms completely covering a surface.
viable Capable of replicating; for instance, by forming a colony on an agar plate.
complex medium Also called rich medium. A nutrient-rich growth solution including undefined chemical components such as beef broth. rich medium Also called complex medium. A nutrient-rich growth solution including undefined chemical components such as beef broth. minimal defined medium A solution of chemically defined compounds for organismal growth that contains only the minimal components required for growth.
enriched medium A growth solution for fastidious bacteria, consisting of complex medium plus additional components.
selective medium A medium that allows the growth of certain species or strains of organisms but not others.
enriched medium A medium whose composition favors the growth of one microbial species over others, increasing (enriching) the presence of the favored species.
differential medium A growth medium that can distinguish between various bacteria on the basis of metabolic differences.
growth factor A compound needed for the growth of only certain cells. uncultured Describing an organism whose requirements for culture remain unknown.
flow cytometry A tool for analyzing cell populations, in which cells of multiple types are detected individually and distinguished by light scatter and fluorescence emission.
fluorescence-activated cell sorting (FACS)
A technique in which cells are counted (via flow cytometry), and then different classes of cells are collected into fractions according to differences in fluorescence (via cell sorting). pour plate technique A procedure in which organisms are added to melted agar cooled to 42°C–45°C and the mixture is poured into an empty Petri plate. Colonies grow in the agar after the agar solidifies. optical density A measure of how many particles are suspended in a solution, based on light scattering by the suspended particles. viability PCR A form of PCR that amplifies DNA only from viable cells. binary fission The process of replication in which one cell divides to form two genetically equivalent daughter cells of equal size.
planktonic cell An isolated cell, growing individually in a liquid without connections to other cells.
growth rate The rate of increase in population number or biomass. generation time The species-specific time period for doubling of a population (e.g., by bacterial cell division) in a given environment, assuming no depletion of resources.
doubling time The generation time of bacteria in culture. The amount of time it takes for the population to double.
growth rate constant The number of organismal generations per unit time; k. batch culture The growth of bacteria in a closed system without additional input of nutrients.
lag phase A period of cell culture, occurring right after bacteria are inoculated into new media, during which there is slow growth or no growth.
exponential phase Also called logarithmic (log) phase. A period of cell culture during which bacteria grow exponentially at their maximal possible rate, given the conditions.
logarithmic (log) phase Also called exponential phase. A period of cell culture during which bacteria grow exponentially at their maximal possible rate, given the conditions.
stationary phase A period of cell culture, following exponential phase, during which there is no net increase in replication.
death rate The rate at which cells die; it is exponential during the death phase.
death phase A period of cell culture, following stationary phase, during which bacteria die faster than they replicate.
continuous culture A culture system in which new medium is continuously added to replace old medium.
chemostat A continuous culture system in which the introduced medium contains a limiting nutrient.
biofilm A community of microbes growing on a solid surface.
twitching motility A type of bacterial movement on solid surfaces in which a specific pilus extends and retracts.
quorum sensing The ability of bacteria to sense the abundance of other bacteria via secreted chemical signals called autoinducers.
extracellular polymeric substances (EPS)
Also called exopolysaccharides. Polysaccharides and entrapped materials that form a thick extracellular matrix around the microbes in a biofilm.
exopolysaccharides (EPS)
Also called extracellular polymeric substance. Polysaccharides and entrapped materials that form a thick extracellular matrix around the microbes in a biofilm.
forespore In sporulation of Gram-positive bacteria, the smaller cell compartment formed through asymmetrical cell division; it develops into the endospore.
mother cell In sporulation of Gram-positive bacteria, the larger cell that forms during the asymmetrical cell division leading to spore formation. The mother cell will engulf the forespore, but then disintegrates as the forespore matures.
germination The activation of a dormant spore to generate a vegetative cell. gliding motility The movement of cells individually or as a collective over surfaces using specialized pili.
hypha pl. hyphae The threadlike filament that forms the mycelium of a fungus. mycelium pl. mycelia A single mass of fungal hyphae that projects into the air (aerial mycelium) or into the growth substrate (surface mycelium).