Chapter introduction
The year 2020 marked the fiftieth anniversary of the discovery of quorum-sensing regulation in bacteria.
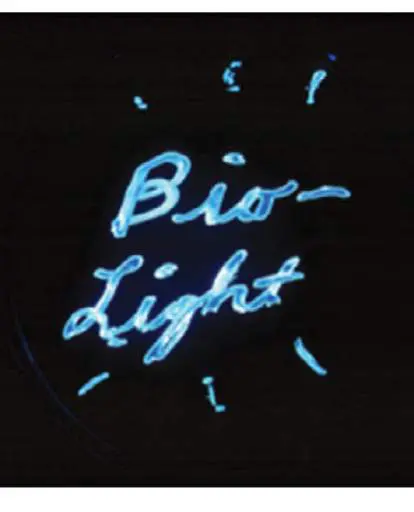
In this image, Ken Nealson, the lead scientist responsible for this discovery, shows the bioluminescent property of the squid symbiont Vibrio (Aliivibrio) fischeri, which has been “drawn” on an agar plate and placed in the dark. In 1970,
A typical bacterial genome encodes thousands of different proteins, many of which are useful in only certain environments. For a number of reasons, cells do not express every gene at maximal level under all conditions. Cells have limited space to house their gene products. In addition, expression requires the energy to synthesize RNA and protein from their monomers and the acquisition of those monomers via biosynthesis or scavenging from the environment. Finally, the activities of some gene products can be counterproductive (or even harmful) to the cell if expressed under the wrong circumstance. Rapid growth of Bacillus in times of plenty would be difficult to achieve if the cells were always producing the machinery to differentiate into dormant spores. Natural selection has therefore favored the evolution of sophisticated mechanisms in microbes that control the expression of genes and the activity of gene products. In this chapter we discuss the fundamental principles of gene regulation in microbes and examine how these individual systems are woven into global regulatory networks that interconnect many processes throughout the cell. Microbes use numerous mechanisms to sense their internal and external environments. The information collected directs the synthesis of specific proteins so that concentrations change directly in response to the changing environments. The cell’s surface, for example, contains an array of sensory proteins that monitor osmolarity, pH, temperature, and the chemical content of the surroundings. Once thought to be an uncontrolled bag of enzymes, a microbial cell, we now recognize, is exquisitely tuned to its dynamic environment.
10.1 Transcription Repressors and ActivatorsUnit 5 · Regulation
The expression of genes is regulated from the initial access of genetic information stored in DNA to the formation of functional proteins and RNA. The different sections of this chapter describe different classes of regulators and the steps in gene expression where they exert their control. For quick reference, examples of regulators that exert their control at different steps of regulation are provided in Table 10.1.
Examples of Regulation
TABLE 10.1
Discussed in This Chapter
Regulated Chapter step Regulator Example(s) section Transcription Repressor LacI of 10.1 initiation Escherichia coli Activator LuxR of Vibrio (10.4 Aliivibrio)
fischeri Repressor AraC of E. coli 10.1 and activator Transcription Attenuator trp operon of E. 10.3 elongation coli
Examples of Regulation
TABLE 10.1
Discussed in This Chapter
Regulated Chapter step Regulator Example(s) section Transcript Small RNA GadY sRNA of 10.3 stability (sRNA) E. coli Translation RNA rpoH 10.5 initiation thermome messenger ter RNA (mRNA)
of E. coli Posttranslational Anti-sigma FlgM of 10.2 protein factor Salmonella activity Regulatory proteins and different types of sigma factors can control the initiation of transcription, the first step in gene expression. Transcription as well as translation can be controlled by RNA. Some proteins and RNAs can regulate expression by behaving as clocks or thermometers. Bacteria regulate some genes by modifying the DNA prior to transcription. As each mode of control is introduced in this chapter, consider the advantages and disadvantages that it offers to the cell as a means of regulation. We begin our discussion of gene expression by describing the regulation of transcription initiation.
Transcription Initiation Control by DNA-Binding Proteins
As the first step in gene expression, initiation of transcription is a major place of regulatory control in bacteria. Transcription initiation is often controlled by regulatory proteins that bind DNA at or near the promoters of genes, where they either stimulate or prevent the binding of RNA polymerase to the promoter, the first step in transcription (see Section 8.2).
The sequence of DNA affects the binding affinity of regulatory proteins. Regulatory proteins usually bind at high affinity to the upstream region of genes they regulate and bind at low affinity elsewhere along the DNA. Regulatory proteins can use the low-affinity binding to remain in contact with the DNA as they scan for high-affinity targets.
High-affinity DNA targets of regulatory proteins often exhibit symmetry in the form of inverted repeats, whose sequences vary for different regulatory proteins (Fig. 10.1). The reason for this symmetry is regulatory proteins often form dimers, and each monomer subunit of the dimer binds to one of the inverted-repeat sequences.
FIGURE 10.1 ■ Examples of DNA regulatory sequences. The sequences shown are located upstream of the genes
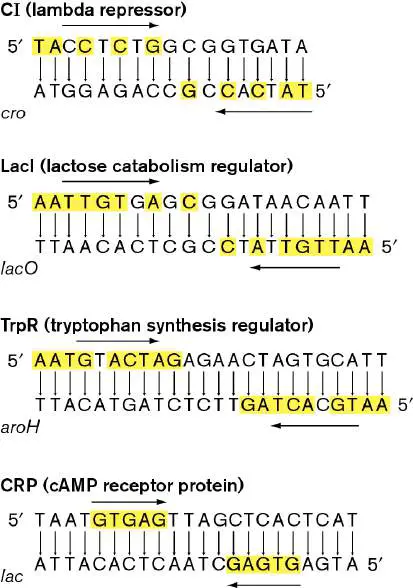
specified below each sequence. Inverted repeats are shown in yellow. Note that in some inverted repeats, occasionally a base is not repeated (only those bases that repeat are highlighted in the diagram). Arrows indicate the direction of symmetry.
Figure 10.2illustrates how one regulatory protein, CI from lambda phage, binds as a dimer to its high-affinity target DNA. CI protein contains a helix-turn-helix motif that serves as its DNA-binding domain. Each helix-turn-helix motif of the dimer binds at one of the inverted-repeat sequences, located within the major groove of the DNA molecule. Binding of CI at this specific sequence, the O R 1 sequence in the lambda genome, helps to keep the phage in a lysogenic state (see Section 11.1).
FIGURE 10.2 ■ Binding of a repressor protein to DNA. The dimer of lambda C I repressor binding to DNA. Note the
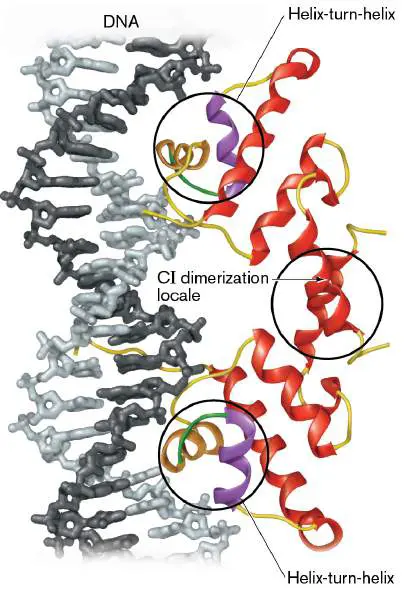
helix-turn-helix motif located in two successive major grooves. Helices in this motif are brown and purple; the turns are green. (PDB code: 1LMB)
Thought Questions
10.1 Why is scanning along the DNA molecule more efficient than a random search within the cell’s cytoplasm for the highaffinity DNA target sequences?
10.2 Knowing that the affinity of regulators for DNA depends on the DNA sequence, propose how evolution could result in the ability of a preexisting regulator to now regulate a newly acquired gene. Why might it be critical that the sequence encoding the regulator itself does not change during this evolutionary step?
Cells use different mechanisms to sense and respond to conditions within the cell and outside the cell membrane. Sensing conditions within the cell to regulate transcription is relatively straightforward. Many regulatory proteins bind specific low-molecular-weight compounds called ligands (Fig. 10.3A). Different regulatory proteins bind different ligands. For example, one regulator binds a carbohydrate ligand and alerts the cell that a new carbon source is available, while a different regulator senses whether enough of the amino acid tryptophan is present in the cytoplasm to carry out protein synthesis. The ligand, once bound, then alters the ability of the regulatory protein to latch onto specific DNA regulatory sequences located near the promoters of target genes.
FIGURE 10.3 ■ General aspects of transcription regulation by repressor and activator proteins. A.
Schematic of a regulatory system. The product of the regulatory gene (the regulatory protein) binds to DNA sequences near the promoter of the target gene and controls whether transcription occurs. Regulatory proteins typically bind DNA as dimers or tetramers. Chemical ligands increase or decrease the ability of regulatory proteins to bind regulatory sequences. B. Repressor proteins bind to DNA sequences and prevent transcription.
Ligands can serve as inducers to decrease repressor binding (scenario 1) or as corepressors to increase repressor binding (scenario 2). Removal of repressors permits binding of RNA polymerase to the promoter. C. Activator proteins stimulate transcription. Ligands generally increase the ability of activators to bind to DNA sequences near target genes and promote the binding of RNA polymerase at the promoter.
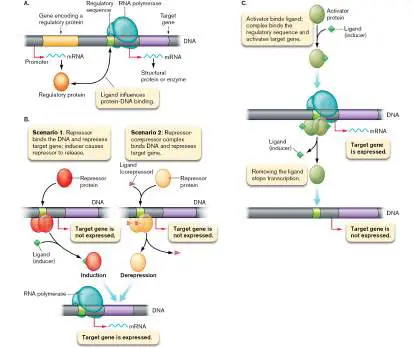
Genes encoding regulatory proteins are usually transcribed separately from the target gene (Fig. 10.3A). Regulatory proteins come in two forms: repressors and activators. Repressor proteins bind to regulatory sequences, referred to as operators, and prevent the transcription of target genes—an event known as repression. Repression happens in one of two ways (scenarios 1 and 2 in Fig. 10.3B ), depending on the repressor. In scenario 1, the repressor binds a specific operator and prevents transcription of a target gene. Relief from repression requires binding of a specific ligand, called an inducer, to the repressor protein, causing the repressor protein to release from the operator. Because a small inducer molecule is required, the increased expression of the target gene is called induction. The lactose operon, discussed later in this section, is one example of an inducible system.
Note: DNA regulatory sequences are called “operators” when
binding to them decreases expression of the target genes. But when binding to them increases expression, they are called “activator sequences.”
Other repressor proteins (scenario 2) bind poorly to operators unless they first bind a small ligand called a corepressor. As the corepressor disappears from the cell, it is no longer available to bind to the repressor protein. Release of the corepressor triggers release of the repressor from the DNA, and the target gene is expressed. This process is called derepression rather than induction.
Repression-derepression systems are often involved in regulating genes encoding biosynthetic enzymes, as exemplified by the tryptophan operon discussed later in this section.
Thought Question
10.3 Operators and repressors were discovered before promoters (the DNA sequences recognized by the sigma factor of RNA polymerase). Why do you think it took longer to discover the promoters? Hint: Finding elements of transcription initiation using genetics involves analysis of mutants; think about the phenotype of a repressor mutant compared to that of a promoter mutant.
Activator proteins also bind DNA, but they stimulate transcription by contacting an RNA polymerase positioned at a nearby promoter, spurring it to initiate transcription (Fig. 10.3C ). Most activator proteins bind poorly to DNA sequences, unless their ligand is present. This ligand is called an inducer because it stimulates binding of the protein to the regulatory DNA sequence. Note that both activators and repressors may have inducers, but the effect of inducer binding on the regulator’s ability to bind DNA is opposite for the two classes of regulators (compare Fig. 10.3B , scenario 1, and Fig. 10.3C ). When the intracellular concentration of inducer falls, the activator protein (without inducer) either leaves the DNA or moves to a nearby site from which it can no longer contact RNA polymerase. As a result, transcription of that target gene decreases or stops entirely.
Sensing the Extracellular Environment
Sensing what goes on outside the cell is more challenging than sensing intracellular conditions because intracellular regulatory proteins cannot reach through the membrane and interact with what is outside the cell. Instead, microbes rely on membrane-embedded signaling receptor proteins to tell the cell what is happening in the outside environment. A common mechanism for collecting and transmitting information from outside the cell relies on two-member protein phosphorylation relay systems called two-component signal transduction systems. Each two-component system regulates a different set of genes. The first protein in each relay, the sensor kinase, spans the membrane (Fig. 10.4). A kinase transfers a phosphoryl group from ATP to a protein. The sensory domain of most sensor kinase proteins contacts the outside environment (or periplasm), while the other end (the kinase domain) protrudes into the cytoplasm.
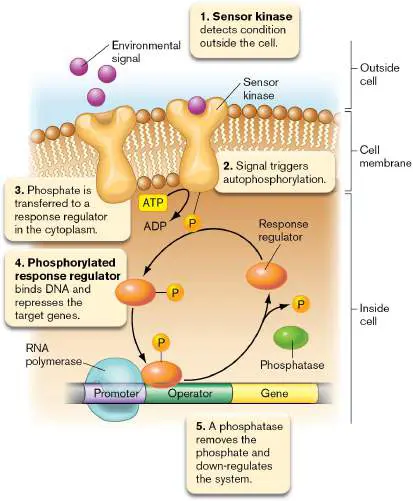
FIGURE 10.4 ■ Two-component signal transduction systems sense the external environment. In this specific example, an environmental signal is relayed to repress expression of a target gene. The sensor kinase undergoes autophosphorylation when it binds the environmental signal. Transfer of the phosphate to the response regulator induces a conformation change (not shown) that allows it to bind the operator and repress transcription of a target gene. If a phosphatase cleaves the phosphate, the response regulator changes back to its original conformation and is released from the operator.
Each sensor protein of a two-component system recognizes a different molecule or condition (for example, PhoQ in Salmonella senses magnesium). Once activated, the external sensory domain triggers a conformation change in the kinase domain that activates a self-phosphorylation reaction. Then, like two relay runners passing a baton, the phosphorylated sensor kinase protein passes the phosphate to activate a cognate (matched) cytoplasmic protein called a response regulator. Most response regulators function as transcription regulators (important exceptions include the CheY and CheB proteins involved in chemotaxis, as discussed in Section 12.1). The specific example of two-component regulation in Figure 10.4 shows the phosphorylated response regulator binding a gene’s operator to repress transcription, but in other cases the response regulator can serve as an activator.
Note that response regulators are controlled by phosphorylation —a covalent modification. Compare this form of regulation with the earlier examples of repressors and activators that are controlled by noncovalent interactions with ligands.
The two-component system is down-regulated when a phosphatase cleaves the phosphate from the response regulator. For some two-component systems, the sensor kinase can serve as the phosphatase that resets the response regulator. Note that in these systems, the phosphate is not transferred back to the sensor kinase but is simply cleaved from the response regulator.
Thought Question
10.4 The transmembrane sensor kinase could have a direct role in gene expression, if its cytoplasmic domain has the ability to bind DNA. Why, then, might it be advantageous for the cell to use the response regulator as an intermediate in this signaling process? Hint: Consider the spatial organization of the cell.
The Lactose Operon
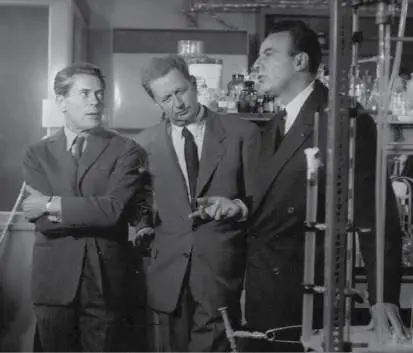
Gene regulation, a universal feature of all life, was discovered in bacteria. In 1961, French scientists Jacques Monod (1910–1976) and François Jacob (1920–2013; Fig. 10.5) investigated the enzymes that enable Escherichia coli to consume the carbohydrates glucose and lactose. They observed that the enzymes that metabolize glucose were always present (that is, constitutive) in the cell, even if glucose was absent. In contrast, the enzyme that metabolized lactose (beta-galactosidase) was produced only when the researchers added lactose. Monod and Jacob coined the term “induction” to describe this phenomenon of beta-galactosidase regulation. This groundbreaking discovery of induction launched the field of gene regulation, a scientific realm where microbes continue to surprise us. For recognition of their pioneering research, Monod and Jacob were awarded a Nobel Prize, which they shared with André Lwoff (1902–1994; Fig. 10.5) for his study of phage lysogeny.
FIGURE 10.5 ■ Discoverers of gene regulation. Jacques Monod (left), André Lwoff (center), and François Jacob (right) in 1965. This trio of scientists worked at the Pasteur Institute and won the 1965 Nobel Prize in Physiology or Medicine for their groundbreaking work on induction and gene regulation.
KEYSTONE PRESS/ALAMY STOCK PHOTO
It took many years after Monod and Jacob’s initial discovery to learn exactly how the expression of the lactose-degrading enzyme beta-galactosidase is regulated. As we will see, regulation involves both repressor and activator proteins that control gene expression, as well as protein interactions at the membrane that control lactose uptake. Many of the concepts presented here apply to numerous other bacterial gene regulatory systems, including some required for
Erwinia infection of plants and Streptococcus pneumoniae infection of humans.
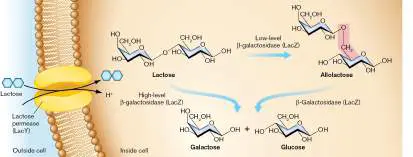
Lactose catabolism. Lactose is a disaccharide sugar made of glucose and galactose that can be used as a carbon and energy source (Fig. 10.6). The E. coli integral membrane protein that imports (transports) lactose from the extracellular environment is LacY. The enzyme that subsequently cleaves lactose into glucose and galactose is a beta-galactosidase (called LacZ). The products, glucose and galactose, are subsequently degraded by the enzymes of glycolysis to harness energy and capture carbon (see Section 13.4 ). Without LacY and LacZ, the catabolic energy of lactose is unavailable to the cell.
FIGURE 10.6 ■ Lactose transport and catabolism. A dedicated lactose permease (LacY) uses the proton motive force to move lactose (and a proton) into the cell. Once there, the enzyme beta-galactosidase (LacZ) can cleave the disaccharide into its component parts (galactose and glucose) or alter the linkage between the monosaccharides to produce allolactose, an important chemical needed to induce the genes that encode this pathway.
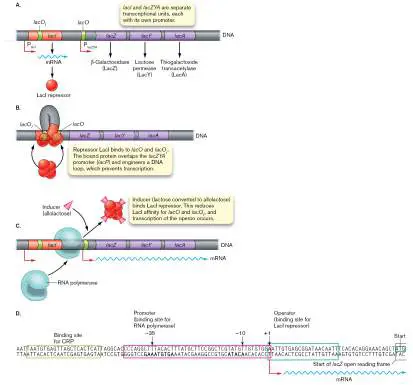
Lactose induces the lac operon. Figure 10.7A shows the genes in E. coli that encode the simple regulatory circuit for lactose catabolism. The genes lacZ, lacY, and lacA form an operon (see
Section 8.1) and are cotranscribed from a common promoter. The role of lacA, which encodes thiogalactoside transacetylase (LacA), is unclear. It is not needed to ferment lactose, but it may detoxify a harmful by-product of lactose metabolism.
FIGURE 10.7 ■ Transcriptional induction of the lactose operon. A. Organization of the operon. Bent arrows mark promoters. Green indicates LacI protein-binding sites on DNA. B. The LacI tetrameric repressor binds to specific DNA sites (the operators lacO and lacO I). C. The inducer allolactose (an altered form of lactose made by low levels of beta-galactosidase) removes the repressor LacI and allows expression of lacZYA. D. DNA sequence of the lac control region.
Note: “Lactose operon,” “ lac operon,” and “ lacZYA operon” all
refer to the same system.
In the absence of lactose, the lac operon is transcribed at extremely low levels (fewer than ten molecules of LacZ per cell). The reason for the low expression is that transcription of lacZYA is repressed by the protein product of the regulator gene lacI (Fig. 10.7B ). The lacI gene is situated immediately upstream of lacZYA and is transcribed from a different promoter. A tetramer of LacI repressor proteins forms in the cell and binds to two operator regions of DNA. One operator sequence is called lacO, which partially overlaps the lacZYA promoter (P lacZYA or lacP; Fig. 10.7A and B ). The second operator site is found within lacI and is called lacO I (Fig. 10.7A).
The lac operators control whether the three structural genes are transcribed. The LacI tetramer simultaneously binds the lacO and lacO I operators (a dimer at each site). As a result, the intervening DNA loops out (Figs. 10.7B and 10.8 ) and prevents RNA polymerase from initiating transcription of the structural lacZYA genes.
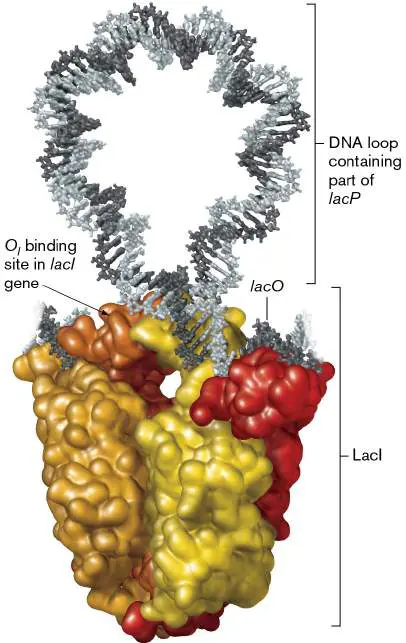
FIGURE 10.8 ■ Regulatory protein interactions with DNA at the lacZYA control region. LacI repressor binds to two operator regions, lacO and lacO I, so that the DNA forms a loop. (PDB codes: 1Z04, 1K8J)
Once lactose is added to the bacterial environment, the lac operon is expressed at 100-fold higher levels. Before lactose addition, the lacZYA operon is repressed by LacI but, as noted earlier, is still transcribed at a low level. This means a small amount of the lactose transporter LacY and the beta-galactosidase LacZ are made. In the presence of lactose outside the cell, LacY transports the lactose into the cell, where LacZ catalyzes the hydrolysis of lactose. But LacZ also carries out a second reaction. Instead of all the lactose being hydrolyzed into glucose and galactose, a small amount of lactose is rearranged into a molecule called allolactose (whose structure is shown in Fig. 10.6). Notably, it is allolactose rather than lactose that activates the lac operon. Allolactose binds the repressor and “unlocks” the protein (by altering the conformation of LacI) so that it is released from the operator (Fig. 10.7C ). Once this happens, RNA polymerase guided by an associated sigma factor (not shown in Fig. 10.7C ) can find the lac promoter sequences and initiate the transcription of large amounts of the lacZYA structural genes. A rapid increase in lactose metabolism results.
cAMP and cAMP receptor protein stimulate transcription.
Another important mechanism that governs the level of lacZYA transcription in E. coli involves a small molecule called cyclic AMP (cAMP), which accumulates when a cell is starved for carbon. Cyclic AMP is a derivative of AMP (adenosine monophosphate) in which the 5′ phosphate is linked to the 3′ OH group of the ribose, making a cyclic structure (Fig. 10.9). Intracellular cAMP levels are controlled by the activities of enzymes that synthesize (adenylyl cyclase) or degrade (phosphodiesterases) this molecule.
FIGURE 10.9 ■ Cyclic AMP (cAMP) is derived from ATP and produced by adenylate cyclase.
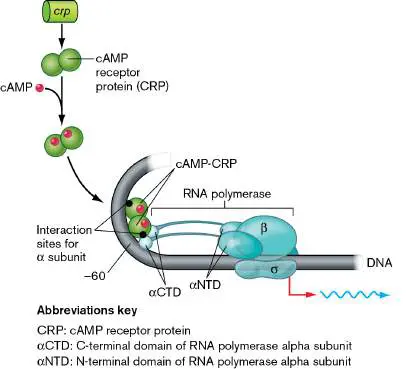
As it accumulates, cyclic AMP controls the expression of many genes by combining with a dimeric regulatory protein called cAMP receptor protein (CRP). The cAMP-CRP complex binds to specific DNA sequences located near many bacterial genes and modifies their transcription, usually acting as an activator. This is the case for the lac operon, which has a CRP-binding site just upstream of the lacZYA promoter (Fig. 10.7D ).
How does the cAMP-CRP complex ultimately activate the expression of lacZYA? The cAMP-CRP complex binds to the region upstream of the lacZYA promoter (Figs. 10.7D and 10.10 ). The cAMP-CRP complex bends the DNA and directly interacts with the C-terminal domain of the alpha subunit of RNA polymerase bound at the lac promoter to activate transcription (Fig. 10.10).
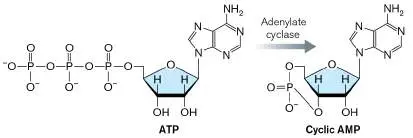
FIGURE 10.10 ■ CRP interactions with RNA polymerase. Promoters like the one at the lacZYA operon possess a CRP-binding site positioned about –60 bp from the transcriptional start. When bound to cAMP, CRP binds these promoters and interacts with the alpha subunit C-terminal domain (αCTD) of RNA polymerase.
Source: Modified from A. G. Moat et al. (eds.). 2002. Microbial Physiology, 4th ed. Wiley-Liss.
Note: Recall that the protein product of a gene is written without
italics, and usually the first letter is capitalized. Thus, lacZ is the gene, but LacZ is the protein. In the presentation of a genotype,
gene names written with a superscript “+” are considered wild-type genes. Gene names written without a superscript “+” are considered mutant genes.
Thought Questions
10.5 Null mutations completely eliminate the function of a given mutated gene. Predict the effects of the following null mutations on the induction of beta-galactosidase by lactose, and predict whether the lacZ gene is expressed at high or low levels in each case. The inactivated, mutant genes to consider are lacI, lacO, lacP, crp, and cya (the gene encoding adenylyl cyclase). What effects will those mutations have on catabolite repression?
10.6 Predict what will happen to the expression of lacZ when a second copy of the lac operon region containing various mutations is present on a plasmid. The genotypes of these partial diploid strains are presented as chromosomal genes/plasmid gene. (a) lacI − lacO + P + Z + Y + A + /plasmid lacI +; (b) lacO − lacI + P + Z + Y + A + /plasmid lacO +; (c) crp − lacI + O + P + Z + Y + A + /plasmid crp +. Glucose represses the lac operon. What happens if, in addition to lactose, the medium contains an alternative carbon source, such as glucose? Enzymes for glucose catabolism (glycolysis) are always produced at high levels because glucose is the favored catabolite (carbon source), providing the quickest source of energy. Many carbohydrates, including lactose, must first be converted to glucose to be catabolized. So, in the interest of greater efficiency, E. coli avoids inducing the lac operon while glucose is present. The phenomenon is known as catabolite repression, in which the presence of a more favorable catabolite (commonly glucose)
prevents the expression of operons that enable catabolism of a second carbohydrate.
When glucose and lactose are both present in the medium, cells initially grow by breaking down glucose until the glucose is depleted. Growth temporarily stops while lactose present in the medium induces the lacZYA operon. Once induced, cells will consume the lactose and resume growth. The resultant biphasic growth curve is often called diauxic growth (Fig. 10.11A). But if lactose was present from the start, why was lacZYA turned off? It was turned off because glucose indirectly prevents the induction of lacZYA. Figure 10.11B illustrates that even when lacZYA is already induced, adding glucose stops (or represses) induction.
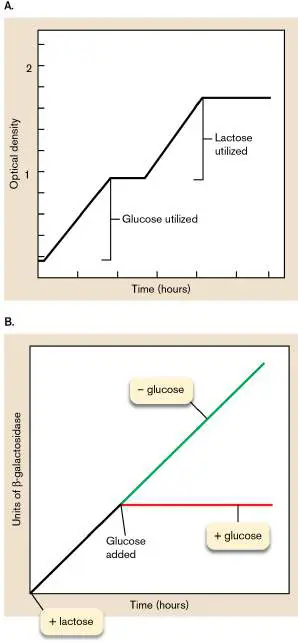
FIGURE 10.11 ■ Catabolite repression of the lacZYA operon. A. The diauxic growth curve of E. coli growing on a mixture of glucose and lactose. B. Glucose repression of LacZ (beta-galactosidase) production. Lactose was added at the beginning of the experiment to parallel cultures, and beta-galactosidase activity was measured. At the point indicated, glucose was added to one culture. From that point on, synthesis of beta-galactosidase continued to increase in the culture that lacked glucose but stopped in the culture that contained glucose. Catabolite repression via inducer exclusion. Failure of lactose to induce lacZYA during growth on glucose (Fig. 10.11B , red horizontal line) is due mainly to the fact that growth on glucose keeps lactose out of the cell. This phenomenon is known as inducer exclusion. If lactose cannot enter the cell, the lacZYA operon cannot be induced. The key to inducer exclusion is that a component of the glucose transport system (phosphotransferase system, or PTS; see Section 4.2), while transporting glucose, will bind to and inhibit LacY permease (Fig. 10.12).
FIGURE 10.12 ■ Glucose transport via the phosphotransferase system inhibits LacY (lactose permease). A. Inducer exclusion. Phosphoenolpyruvate (PEP)
“feeds” phosphate into the PTS, which relays the phosphate to glucose during transport. The level of unphosphorylated II A Glc is high because glucose continually siphons off the phosphate.
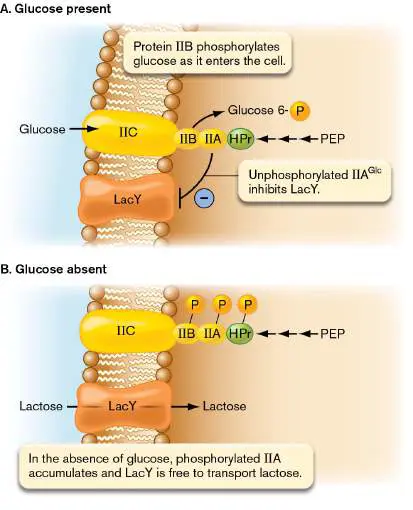
Unphosphorylated II A Glc inhibits LacY (lactose permease)
activity to keep lactose from entering the cell. B. In the absence of glucose, the phosphorylated forms of glucose-specific II A Glc and II BC Glc accumulate and cannot inhibit LacY. LacY transports lactose, and the lac operon is induced. HPr = histidine-rich protein.
The PTS transfers a phosphate from phosphoenolpyruvate (PEP) along a series of proteins to glucose during transport. When glucose is present (Fig. 10.12A), the glucose transport proteins continually transfer phosphate to glucose and, so, are usually left without phosphate. Unphosphorylated Enzyme IIA interacts with LacY in the membrane and inhibits LacY activity. So, lactose cannot enter the cell, and the lac operon remains uninduced. When glucose is absent (Fig. 10.12B ), the PTS proteins remain phosphorylated; Enzyme IIA-P does not interact with LacY, so LacY transports lactose into the cell; and the lac operon is induced.
Transport of some sugars through the PTS also affects the synthesis of cAMP by adenylyl cyclase, but control of cAMP production is not the major cause of glucose/lactose diauxic growth.
Thought Question
10.7 Researchers often use isopropyl-β- D -thiogalactopyranoside (IPTG) rather than lactose to induce the lacZYA operon. IPTG resembles lactose, which is why it can interact with the LacI repressor, but it is not degraded by beta-galactosidase. Why do you think the use of IPTG is preferred in these studies?
The AraC/XylS Family of Transcription Regulators
What could be better than having a regulatory protein that either represses (like LacI) or activates (like CRP) expression of an operon? How about a regulator that can repress and activate gene expression, depending on whether a carbohydrate substrate is available? A regulator this versatile provides very tight control over operon expression. One such regulator, called AraC, regulates the genes encoding arabinose catabolism. When arabinose is absent, AraC represses expression of the genes that break down arabinose, but when it is present, AraC activates these same genes. The products of these genes ultimately convert the five-carbon sugar L - arabinose to D -xylulose 5-phosphate, an intermediate in the pentose phosphate shunt, a pathway that provides reducing energy for biosynthesis (see Section 13.4).
Bioinformatic computer analysis of microbial genomes reveals a family of over 10,000 regulators with homology to AraC and the closely related XylS activator (xylose catabolism). Although first described for sugar metabolism of a harmless strain of E. coli, many of the AraC/XylS regulators are found in pathogens and control genes involved in virulence (Table 10.2). For example, the plague bacillus Yersinia pestis possesses an AraC-type regulator YbtA that governs uptake of iron. This regulator helps Y. pestis extract iron from blood plasma during infection.
Examples of the AraC/XylS TABLE Family of Transcription 10.2 Regulators
Regulator Organism Function ExsA Pseudomonas Controls type III aeruginosa (human secretion system in pathogen) response to Ca 2+
Examples of the AraC/XylS TABLE Family of Transcription 10.2 Regulators
Regulator Organism Function NitR Rhodococcus Regulates synthesis of rhodochrous (plant indole-3-acetic acid pathogen)
ToxT Vibrio cholerae (human Controls several pathogen) virulence genes, including one encoding cholera toxin TxtR Streptomyces scabies Controls synthesis of (taproot pathogen) thaxtomin, a plant toxin YbtA Yersinia pestis (human Controls iron uptake pathogen) transporters The AraC/XylS advantage. One advantage of AraC/XylS family regulators, as displayed by the AraC archetype, is that they remain affixed to their target genes. By contrast, the LacI repressor must fully dissociate from operator DNA during induction and disperse throughout the cell. Reestablishing repression requires slow, random diffusion of bulky LacI proteins back to the chromosome and the lacO DNA sequence. This takes some time. The AraC/XylS family strategy keeps the regulatory protein bound near target operons. The regulators simply shuttle back and forth between repressor and activator DNA-binding sites, shortening the delay between induction and repression. The known small chemical inducer molecules for these regulators quickly diffuse through the cytoplasm to find their cognate regulatory proteins already camped at target promoters. The AraC strategy. The model for regulation by AraC/XylS regulators is based primarily on AraC itself, the most intensely studied family member. AraC is a 33-kDa protein with a DNA-binding C-terminal domain attached by a flexible linker peptide to the N-terminal dimerization domain (Fig. 10.13a ). AraC forms a dimer in vivo that can assume one of two conformations, depending on whether arabinose is available. When arabinose is absent, the dimer exists in a rigid, elongated form because the N-terminal arm of each monomer binds to its own C-terminal domain. This form represses expression of the araBAD operon for arabinose degradation. When arabinose is present, however, the dimer assumes a more compact form because the N-terminal arm of one monomer binds to the N-terminal domain of the other monomer (Fig. 10.13B ). This compact form activates expression of araBAD (Fig. 10.13C ). FIGURE 10.13 ■ Regulation of the araBAD operon by the AraC regulator. A. View of AraC showing dimerization and DNA-binding domains. B. Alternative conformations of the AraC dimer. C. The different conformations change the location of where the dimer can bind DNA. The region shown is about 400 bp. Note that O 2 is an operator, and I 1 and I 2 are other DNA-binding sites that, when occupied by AraC, induce expression. CRP can bind and stimulate expression when the dimer is bound to arabinose, but it is blocked by the DNA loop when the dimer lacks arabinose.
How does AraC act as both repressor and activator? AraC is able to bind to three important DNA-binding sites. Two of them, O 2 and I 1, are widely separated and flank a binding site for cAMP-CRP that, as discussed earlier in this section, is a global activator of many
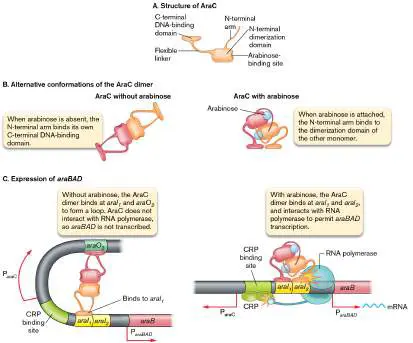
bacterial genes, including araBAD. The elongated AraC dimer (no arabinose) can bind these two sites. The result is a looped DNA structure that blocks the CRP-binding site and limits activation by cAMP-CRP. The araBAD operon is not expressed. However, the I 1 site sits next to another site, I 2, near the promoter. The compact AraC dimer (with arabinose) can bind only to these sites. Binding to I 1 I 2 prevents DNA loop formation, allows cAMP-CRP access to the CRP DNA-binding site, and brings AraC close enough to physically contact an RNA polymerase already bound (but stuck) at the araBAD promoter. Transcription of the araBAD operon begins.
According to this model, the DNA region is rarely free of AraC. Arabinose moves the dimer from one site (repression) to the other (induction). AraC-like proteins show strong family resemblance at their DNA-binding domains, but homology usually disappears at the other end of the protein, the dimerization domain. The dimerization domain is where these proteins appear to bind or respond to a particular ligand (for example, arabinose). For the vast majority of the AraC/XylS family members in bacterial genomes, the identity of the ligand remains a mystery.
Thought Question
10.8 When the lacI gene of E. coli is missing because of mutation, the lacZYA operon is highly expressed regardless of whether lactose is present in the medium. Judging by the illustration of arabinose operon expression in Figure 10.13, what do you think would happen to araBAD expression if AraC were missing? Why?
Repression of Anabolic (Biosynthetic) Pathways
Chapters 13 and 15 cover the catabolic and anabolic diversity of microbes, but here we consider the fundamental difference in the way that these two metabolic processes are regulated. Cells respond to the presence of a carbon and energy source by inducing the machinery to catabolize the substrate. In contrast, cells respond to the presence of biosynthetic end products by repressing the anabolic pathways that produce them, and thus wasteful synthesis of these products is avoided. This difference means that ligand binding affects gene expression regulators in different, usually opposite, ways for catabolic versus anabolic pathways.
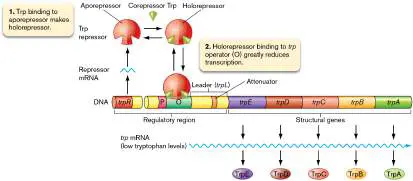
Repressor proteins that control catabolic pathways, such as lactose degradation, typically bind the initial substrate or a closely related product (for example, allolactose in the case of the lac operon). Binding the substrate decreases repressor protein affinity for operator DNA. Thus, increased concentration of the substrate or inducer actually removes the repressor from the operator and derepresses expression of the operon (Fig. 10.3B , scenario 1). In contrast, genes encoding biosynthetic enzymes are regulated by repressors (called inactive aporepressors) that must bind the end product of the pathway (for example, tryptophan for the trp operon) to become active repressors (Fig. 10.3B , scenario 2). The pathway product that binds the aporepressor is called a corepressor. Binding of the corepressor (end product) to the repressor increases the repressor’s affinity for the operator sequence upstream of the target gene or operon.
As just noted, many amino acid biosynthetic pathways are controlled by transcriptional repression, in which a repressor protein binds to a DNA operator sequence to prevent transcription. For instance, when internal tryptophan levels exceed cellular needs, the excess tryptophan (acting as a corepressor) will bind to an inactive repressor protein, TrpR, converting it to an active repressor (Fig. 10.14). TrpR repressor then binds to an operator DNA sequence positioned upstream of the tryptophan (trp) operon, which encodes the enzymes required for tryptophan biosynthesis. Repressor bound to the operator represses expression of the trp operon by preventing the RNA polymerase from binding the promoter.
FIGURE 10.14 ■ The tryptophan biosynthetic pathway in Escherichia coli and repression of the trp operon. The tryptophan biosynthetic enzymes and their encoding genes are shown. TrpR aporepressor (inactive repressor) binds excess tryptophan when intracellular concentration exceeds need. The holorepressor (active repressor) then binds to the trp operator and blocks access of RNA polymerase (not shown) to the promoter, reducing transcription about 100-fold. Note the long polycistronic message in blue.
Transcription Regulators of Eukaryotes and Archaea
As in bacteria, transcription in eukaryotes is regulated by activators and repressors. In eukaryotes, the sites where activator proteins bind DNA are called enhancers. In contrast to the situation in bacteria, these activator binding sites are usually positioned thousands of bases upstream or downstream of the transcription start site. How can an activator protein regulate transcription when it is bound to DNA so far away?
Recall from Chapter 8 that eukaryotes use RNA polymerase II to transcribe the DNA of protein-coding genes into mRNA. The transcription initiation complex (see Fig. 8.5) forms at the promoter upstream of the transcription start site. The TATA-binding protein (TBP) binds to the TATA box of the promoter and recruits
RNA polymerase II and additional transcription factors to the site. This initiation complex is unstable by default and, without stabilizing assistance, falls off the promoter before transcription can initiate. One class of transcription activators stabilizes the complex long enough that the polymerase can eventually “escape” the complex and proceed with transcription elongation.
Transcription activators bound to enhancers stabilize the initiation complex through a multiprotein bridge called Mediator. When the intervening DNA is looped out, Mediator can bind both the RNA polymerase II complex and the activator protein (Fig. 10.15). Mediator can bind a broad array of different activator proteins, and often binds to activators at multiple enhancer sites during transcription initiation.
FIGURE 10.15 ■ Eukaryotic gene activation at a distance through the Mediator connector. The gaps in the DNA indicate long stretches of intervening DNA between enhancer and promoter, often thousands of bases long. In this simplified example, a single activator binds an enhancer upstream of the promoter. In other cases, multiple activators are
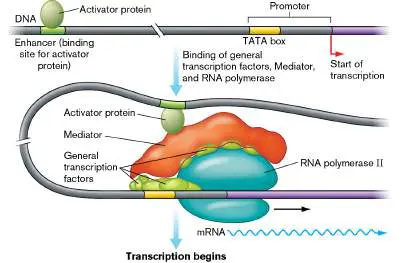
involved, binding enhancers located upstream as well as downstream of the gene.
Source: Modified from B. Alberts et al. 2019. Essential Cell Biology, 5th ed., Norton, fig. 8–10.
Transcription regulation in eukaryotes has even greater complexity, through the dynamics of chromatin formation and remodeling. Nucleosomes are histone-DNA complexes that, when positioned at a promoter, can silence gene expression. Both activators and repressors can function in gene regulation by their ability to cause or prevent remodeling of these nucleosomes around the promoter region.
How are genes regulated in archaea? Like the other two domains, archaea regulate their genes with both activators and repressor proteins. Recall from Chapter 8 that the RNA polymerase of archaea is structurally and functionally related to RNA polymerase II of eukaryotes (see Fig. 8.10). Despite these similarities, regulation of transcription initiation in archaea lacks the complexity found in eukaryotes and in some aspects is more similar to regulation in bacteria. Archaea lack the Mediator complex of eukaryotes, and their activator proteins bind close to the promoter to help assemble the initiation complex. Their repressor proteins typically bind the promoter regions to prevent assembly of the initiation complex. Although archaea contain histones that package their DNA into nucleosomes, the involvement of nucleosome formation and remodeling in gene regulation appears to be less complex than in eukaryotes, and it may be restricted to only certain lineages of archaea.
To Summarize
Regulatory proteins help a cell sense changes in its internal environment and alter gene expression to match. DNA-binding domains of proteins often recognize symmetrical DNA sequences.
Repressor and activator proteins bind to operator and activator DNA sequences, respectively, in front of target genes. Repressors prevent transcription; activators stimulate it.
Two-component signal transduction systems , consisting of a sensor kinase and a response regulator, help the cell sense and respond to both its inside and outside environments.
The lacZYA operon of E. coli is controlled by repression and activation. The tetrameric LacI repressor binds operator DNA sequences to prevent RNA polymerase from accessing the promoter. Allolactose (rearranged lactose) binds LacI, reduces repressor affinity for the operator, and allows induction of the operon.
The cAMP-CRP complex activates lacZYA transcription by interacting with the C-terminal domain of the RNA polymerase alpha subunit. cAMP-CRP regulates many types of operons. In catabolite repression , a preferred carbon source (for example, glucose) prevents the induction of an operon (for example, lac) that enables catabolism of a different carbon source (lactose). Glucose transport through the phosphotransferase system causes catabolite repression by inhibiting LacY permease activity (inducer exclusion) and lowers cAMP levels.
AraC-like proteins are a large family of regulators, present in many bacterial species, that can activate and repress a target operon to provide a tight on/off switch.
Many anabolic pathway genes (for example, for tryptophan biosynthesis) are repressed by the end product of the pathway (for example, the amino acid), which binds to a corepressor that inhibits transcription.
Regulation of transcription in eukaryotes is more complex than in bacteria, can involve activators that bind distant DNA sites called enhancers, and also involves extensive chromatin reorganization.
Archaeal gene regulation involves activators and repressors that bind near the promoter, as in bacteria.
Glossary
regulatory protein A protein that can bind DNA and modulate transcription in response to a metabolite.
domain 1. In taxonomy, one of three major subdivisions of life: Archaea, Bacteria, and Eukarya. 2. In protein structure, a portion of a protein that possesses a defined function, such as binding DNA. 3. In membranes, a region of membrane consisting of certain types of phospholipids that are distinct from surrounding lipids. repressor A regulatory protein that can bind to a specific DNA sequence and inhibit transcription of genes.
activator A regulatory protein that can bind to a specific DNA sequence and increase transcription of genes.
operator A region of DNA to which the repressor protein binds. Operators are usually located near promoters.
repression The down-regulation of gene transcription.
inducer A molecule that stimulates transcription of gene(s) by changing the DNA-binding properties of a regulatory protein. When an inducer binds a repressor protein, the repressor loses the ability to bind the operator and block transcription. When an inducer binds an activator protein, the activator gains the ability to bind the DNA and the RNA polymerase to stimulate transcription. induction Increased transcription of target genes because an inducer binds to a repressor and prevents repressor-operator binding. corepressor A small molecule that must bind to a repressor to allow the repressor to bind operator DNA.
derepression An increase in gene expression caused by the decrease in concentration of a corepressor.
two-component signal transduction system A message relay system composed of a sensor kinase protein and a response regulator protein that regulates gene expression in response to a signal (usually an extracellular signal). sensor kinase A transmembrane protein that phosphorylates itself in response to an extracellular signal and transfers the phosphoryl group to a receiver protein.
response regulator A cytoplasmic protein that is phosphorylated by a sensor kinase and modulates gene transcription depending on its phosphorylation state.
catabolite repression The inhibition of transcription of an operon encoding catabolic proteins in the presence of a more favorable catabolite, such as glucose.
diauxic growth A biphasic cell growth curve caused by depletion of the favored carbon source and a metabolic switch to the second carbon source.
inducer exclusion The ability of glucose to cause metabolic changes that prevent the cellular uptake of less favorable carbon sources that could cause unnecessary induction.
Fig. 8.5 FIGURE 8.5 ■ The initiation of transcription. Sigma factor helps RNA polymerase find promoters but is discarded
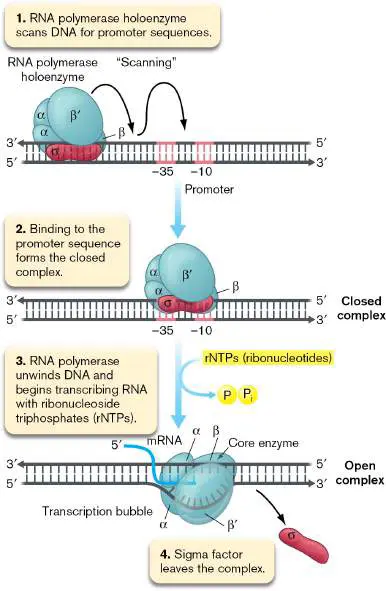
after the first few RNA bases are polymerized. (Omega is not shown.)
Fig. 8.10 FIGURE 8.10 ■ RNA polymerases from Archaea and Eukarya exhibit homology. The core RNA polymerase (RNAP) subunits of the archaeon Sulfolobus (A) show homology to those of the eukaryotic RNA polymerase II (RNAP II) (B) . The TATA-binding protein (TBP; green) and transcription factor B (TFB; pink) of Sulfolobus also show homology to eukaryotic counterparts. The bent red arrows indicate transcription start sites.
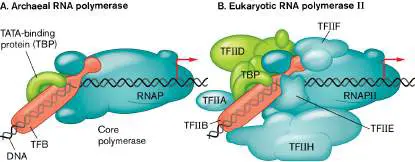
10.2 Alternative Sigma Factors and Anti-Sigma FactorsUnit 5 · Regulation
In bacteria, some regulatory proteins, such as the repressor LacI, control transcription of a single operon, whereas others can control multiple operons. The collection of coregulated operons is referred to as a regulon. Multi-operon transcriptional coordination is particularly useful for responses to environmental stresses, as these often require the products of many genes for the cell to survive. Regulons can be controlled by activators and repressors, but also by alternative sigma factors.
Alternative sigma factors differ from the “housekeeping” sigma factor (RpoD, or sigma-70) in several ways. First, their promoter recognition sequence is different from that of the housekeeping sigma factor (see Section 8.2), and when expressed, these sigma factors compete with the housekeeping sigma factor to deliver RNA polymerase to the promoters of their regulon. Second, whereas the housekeeping sigma factor is always expressed and functioning in the cell, the expression or activation of alternative sigma factors is usually triggered by an environmental change. The regulons controlled by these sigma factors typically help the cell survive this change. One example of a stress-induced alternative sigma factor, sigma S, is described next.
Sigma S and Its Regulon
Many Gram-negative bacteria such as Escherichia coli have an alternative sigma factor (sigma S, or RpoS) that is expressed in the stationary phase of growth. Its regulon protects the cell from starvation and other stresses that may occur during stationary phase, such as acid stress or oxidative stress. In large part, E. coli orchestrates the stationary phase–dependent accumulation of sigma S by modulating its degradation (protein degradation is discussed in Section 8.4). ClpXP protease degrades sigma S rapidly during exponential growth. When cells enter stationary phase or experience an environmental stress that slows growth, degradation of sigma S stops. Sigma S levels increase in these situations, and the increase triggers the expression of the stress survival regulon.
How are the genes of regulons, such as that of sigma S, identified in the lab? Historically, genes of regulons have been identified through genetic screens or gel electrophoresis of total cell proteins, which can be quite laborious to perform. Thanks to recent developments in nucleic acid techniques, regulons can now be identified more quickly. By comparing the expression of every gene in the genome, what is called the transcriptome, between the wild type and a mutant strain that lacks a regulator such as sigma S, one can identify regulon members.
The state of the art in transcriptomic analysis is RNAseq, which is an RNA-based application of high-throughput DNA sequencing technology. Because most high-throughput sequencers can read only DNA (see eAppendix 3), transcriptomes analyzed by RNAseq are first reverse-transcribed from RNA to DNA. Sequence reads are then compared to the reference genome in order to calculate transcript abundances for each gene.
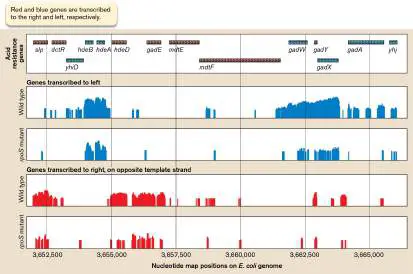
Tyrrell Conway and colleagues at the University of Oklahoma used transcriptomics to identify acid resistance genes in E. coli that are members of the bacterium’s sigma S regulon. Conway (now at Oklahoma State University) used RNAseq to quantify transcript levels of the known acid resistance genes in stationary-phase cells of wild-type and rpoS mutants of E. coli lacking sigma S. RNAseq provides only short reads of transcripts, but if all the individual reads are compiled together as in Figure 10.16, transcript abundances for each gene can be compared between the wild type and the rpoS mutant. The relative expression of the dctR, gadA, and yhiD acid resistance genes in the rpoS mutant strain (third and fifth panels in Figure 10.16) was lower than the wild-type (second and fourth panels), indicating that these genes are under RpoS control. FIGURE 10.16 ■ Transcriptomics of Escherichia coli acid resistance genes. RNAseq was used to quantify the relative numbers of transcripts made from each gene in wild-type and rpoS mutant strains. Each vertical bar in the bottom four panels represents a short, partial read of a transcript. The experiments actually captured data from all genes expressed from the genome, but only some of these data are shown.
Source: Modified from University of Oklahoma Gene Expression Database.
Note: While the expression of a gene may change in the absence
of a transcription regulator such as sigma S, one cannot automatically conclude that the regulator binds to the promoter region of that gene. The effect may be indirect if, for instance, the expression of the direct regulator of the gene is itself under the control of sigma S.
Regulation by Anti-Sigma Factors, Anti-Anti-Sigma Factors, and Phosphorylation
Some sigma factors are controlled by anti-sigma factor proteins that inhibit sigma factor activity. Anti-sigma factor proteins bind specific sigma factors and block access to core RNA polymerase. The anti-sigma strategy prevents the expression of target genes until they are needed. Many mechanisms can liberate sigma factors from anti-sigma factors, and one of the more impressive examples involves a sigma factor that regulates the construction of flagella, complex multiprotein machines (see Fig. 3.40).
In Salmonella, the sigma factor FliA (sigma-28) is required to synthesize proteins used in the final stages of flagellar biosynthesis: the flagellin subunits that compose the flagellum and the flagellum’s motor. FliA also controls expression of the chemotaxis proteins that control the spin of the flagellum in response to environmental stimuli (see Section 12.1). The anti-sigma factor FlgM, however, keeps FliA function at bay until membrane assembly of the flagellar basal body and hook is complete (Fig. 10.17).
FIGURE 10.17 ■ Liberation of sigma factor FliA during flagellum assembly in Salmonella. The FlgM anti-sigma factor keeps FliA (sigma-28) inactive until the first part of the flagellum is assembled. FliA controls genes that make the final parts of the flagellum and the chemotaxis machinery.
Source: Modified from F. F. V. Chevance and K. T. Hughes. 2008. Nat. Rev. Microbiol. 6 :455–465, fig. 3.
In a remarkable mode of regulation, inactivation of FlgM does not involve degradation or covalent modification of the protein. Rather, FlgM is ejected from the cell. The basal body and hook form a secretory channel, and in an unusual mode of protein trafficking, the FliA sigma factor delivers the attached FlgM anti-sigma factor to this channel for secretion. Once the FlgM is ejected from the cell, FliA becomes free to direct transcription of the final set of flagellar
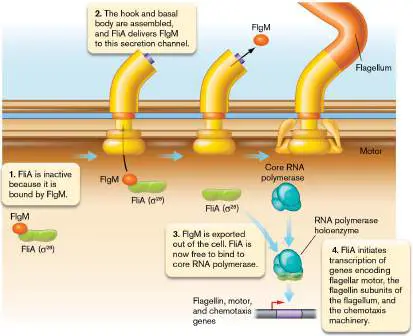
assembly genes. The ability of the partially assembled flagellum to eject FlgM thus provides “proof” that flagellum assembly has progressed to the final phase of construction.
Anti-sigma factors can themselves be neutralized by anti-anti-sigma factors that bind the anti-sigma factor more tightly than sigma factor does. The anti-anti-sigma factor acts as a decoy to release the actual sigma factor from the anti-sigma factor. Freed sigma factor can then join core RNA polymerase and direct the transcription of target genes.
Alternative sigma factors may also be regulated by phosphorylation, not unlike the response regulators of two-component signal transduction systems. Shankar Chandrashekar Iyer, Simon Ringgaard, and colleagues at the Max Planck Institute for Terrestrial Microbiology in Marburg, Germany, discovered that the EcfP sigma factor of the marine species Vibrio parahaemolyticus is unable to bind to the RNA polymerase core enzyme unless it is first phosphorylated by a serine/threonine kinase called PknT, which is activated in the presence of the antibiotic polymyxin. When PknT phosphorylates EcfP, EcfP binds to the core polymerase and recruits it to the promoters of genes whose products confer resistance to polymyxin.
To Summarize
Changing the synthesis or activity of a sigma factor will coordinately regulate a set of related genes termed the regulon .
The sigma S regulon protects cells from starvation and other stresses during stationary phase.
Anti-sigma factors bind sigma factors to prevent them from initiating transcription.
Anti-anti-sigma factors release sigma factors from anti-sigma factors.
The phosphorylation state of sigma factors can control their ability to initiate transcription.
Glossary
regulon A group of genes and operons located at different positions in a genome that are coordinately regulated and share a common function.
alternative sigma factor A sigma factor, distinguished from the housekeeping sigma factor, sigma-70, that has a distinct promoter consensus sequence to which it binds. Genes under control of an alternative sigma factor typically protect the cell from environmental stresses, such as heat shock or starvation. transcriptome The set of transcribed genes in a cell at a given time. The “complete transcriptome” includes all the possible RNA transcription products from a given genome. The “expressed transcriptome” is the set of RNAs present during a given condition.
anti-sigma factor A protein that inhibits a specific sigma factor, preventing transcription initiation.
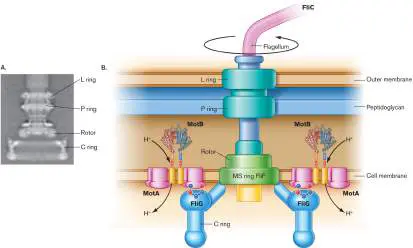
anti-anti-sigma factor A protein that inhibits an anti-sigma factor, allowing the target sigma factor to participate in initiating transcription. Fig. 3.40 FIGURE 3.40 ■ The flagellar motor. A. The basal body, or motor, of the bacterial flagellum (TEM). This image is based on digital reconstruction, in which electron micrographs of purified basal bodies were rotationally averaged. B. H⁺ flow through the MotA-MotB complex drives rotation of the flagellar motor.
N. R. FRANCIS ET AL. 1994. J. MOL. BIOL. 235 :1261.
10.3 Regulation by RNAUnit 5 · Regulation
Studies of the lactose and arabinose operons in Escherichia coli established the paradigm of gene regulation at the step of transcription initiation. Subsequent studies revealed that bacteria can also regulate gene expression after transcription begins. Such regulation after initiation is often conferred by RNA, either as a regulatory element within the mRNA transcript or as a separately transcribed regulatory RNA that interacts with the mRNA. We begin this section with a discussion of regulatory sequences within the transcribed mRNA.
Transcriptional Attenuation
In Section 10.1 we described how transcription of the trp operon is regulated by repressor binding to tryptophan, the biosynthetic product of the encoded proteins of the operon. Repression, however, is not the whole story in regulating the trp operon. Many amino acid biosynthetic operons, including the trp operon, have adopted a second strategy for down-regulating amino acid synthesis, which can be used alone or in conjunction with repression. This second mechanism is called transcriptional attenuation. Attenuation halts transcription in progress, before it even reaches the first gene. This mechanism affords the cell an even quicker response to changing amino acid levels than does simple repression.
Transcriptional attenuation was discovered by Charles Yanofsky ( Fig. 10.18A) and his colleagues at Stanford University. While examining the beginning of the trp operon in E. coli, they discovered an odd DNA region, called the leader sequence, located between the trp operator and trpE, the first structural gene of the operon. The leader sequence encodes a short peptide, but the peptide has no enzymatic function. However, the leader sequence includes a pair of tryptophan codons, and this information was key to discovering the mechanism of attenuation because it prompted the question: What happens at these codons when the cell has no tryptophan?
FIGURE 10.18 ■ The transcriptional attenuation mechanism of the trp operon. A. Charles Yanofsky was
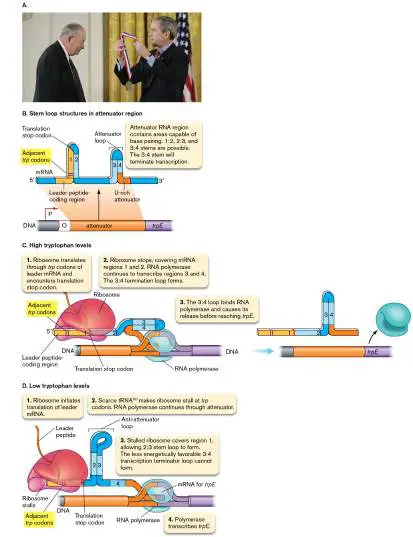
instrumental in discovering attenuation and several other gene regulatory mechanisms while studying tryptophan metabolism. Here he is seen receiving the National Medal of Science from President George W. Bush in 2003. B. Relationship between the mRNA attenuator region and encoding DNA. C. Attenuation when E. coli is growing in high tryptophan concentrations. D.
Transcriptional read-through when E. coli is growing in low tryptophan concentrations. tRNA Trp = tryptophanyl-tRNA.
AP PHOTO/J. SCOTT APPLEWHITE
Recall from Chapter 8 that in bacteria, ribosomes can begin to translate mRNA before transcription is complete. When a ribosome latches on to a nascent mRNA from the trp operon and translates the leader sequence, it will stall at the tryptophan codons if the cell lacks transfer RNAs (tRNAs) charged with tryptophan. If the ribosome stalls, it transmits a message to the RNA polymerase: the cell lacks tryptophan, so the operon needs to be transcribed so that more tryptophan can be synthesized. How does the ribosome transmit this message?
Transmission of the message involves four complementary nucleotide stretches within the leader mRNA. These regions, numbered 1–4, can base-pair to form competing stem loop structures (Fig. 10.18B ). Two of the stem loop structures are critical to the mechanism. These are the anti-attenuator stem loop formed by regions 2 and 3 and the attenuator stem loop (or terminator stem loop) formed by regions 3 and 4. Downstream of the attenuator stem loop is a stretch of U’s (Fig. 10.18B ). Recall from Chapter 8 that one type of transcription terminator (Rho-independent) is composed of a run of U’s after a stem loop. Thus, if the 3:4 attenuator stem loop forms, the RNA polymerase is ejected and transcription stops before it reaches trpE (Fig. 10.18C ). Formation of the 2:3 anti-attenuator stem loop, however, prevents formation of the 3:4 stem loop because the 2:3 stem is longer and more thermodynamically stable than the 3:4 stem. The anti-attenuator stem, if it forms, enables RNA polymerase to transcribe into trpE and the remainder of the operon (Fig. 10.18D ). But what controls which stem loop forms?
High tryptophan levels. Because the ribosome is very large, it can barrel through RNA stem loop structures. When the cell is replete with charged tryptophanyl-tRNA and needs no more (Fig. 10.18C ), the ribosome quickly translates through the key tryptophan codons in the leader sequence but runs into a translation stop codon between regions 1 and 2. The ribosome stops in this position, enveloping region 2 and preventing formation of the 2:3 stem. As a result, once RNA polymerase transcribes through region 4, the 3:4 attenuator stem snaps together. The attenuator stem then interacts with the RNA polymerase ahead of it and halts transcription. As you would expect, the ribosome dissociates after reaching the region 2 stop codon, but because the 3:4 stem loop is already in place, the anti-attenuator 2:3 stem loop does not form. Subsequent ribosome release leads to the formation of a 1:2 stem structure, precluding all possibility of regions 2 and 3 annealing.
Low tryptophan levels. If the level of charged tryptophanyl-tRNA is low (Fig. 10.18D ), then the ribosome following behind RNA polymerase stalls over the tryptophan codons. Because these codons are right at the beginning of region 1, the ribosome does not cover region 2. So, as soon as RNA polymerase transcribes region 3, the 2:3 anti-attenuator stem loop forms and stops formation of the 3:4 attenuator stem loop. The result is that RNA polymerase can continue into the structural genes, and ultimately more tryptophan is made. (A new ribosome binds to a ribosome-binding site at the trpE message.) Note that for the trp operon, attenuation is a fine-tuning mechanism. The repressor provides the majority of control. However, transcriptional attenuation is a common regulatory strategy used to control many operons that code for amino acid biosynthesis. Note that even though translation is part of the attenuation control mechanism, attenuation is not considered translational control. The reason is that RNA polymerase, rather than the ribosome, is the target of the control.
Thought Question
10.9 In a newly discovered bacterium, an operon encoding enzymes suspected to synthesize an amino acid has what appears to be the following leader sequence: 5′-ATGCCCTTCTTCAGTTGA-3′. Assuming the microbe uses the standard genetic code (see Fig. 8.12), predict which amino acid is synthesized by the enzymes encoded in the operon.
Riboswitches Sense Cytoplasmic Molecules
As we have just described, transcriptional attenuation involving a translated leader sequence is an effective method for feedback regulation of operons involved in amino acid biosynthesis. The absence of the amino acid is sensed indirectly by the stalling of the ribosome in the leader sequence at the codons that encode that amino acid. What about biosynthetic operons that make molecules other than amino acids, such as vitamins? These molecules are not subunits of polypeptides, so a translatable leader sequence could not work to sense their abundance. Is there a way that the molecule can be sensed directly by the mRNA?
In fact, many molecules can be bound by RNA as ligands, at sequences called riboswitches. Riboswitches are usually found in the 5′ untranslated region of the mRNA. The binding of the ligand causes a change in the stem loop structures of the mRNA. This change in structure can affect expression of the gene(s) encoded downstream of the riboswitch, much as ribosome binding can affect expression during transcriptional attenuation.
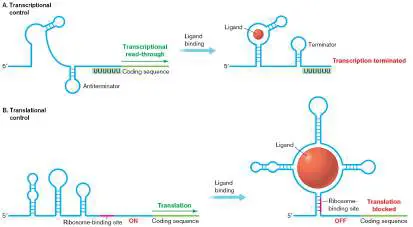
Some riboswitches control gene expression through early termination of transcription. In the absence of ligand, these riboswitches form an antiterminator stem that permits transcriptional read-through (Fig. 10.19A). When ligand binds, the antiterminator stem disassembles and a terminator stem forms. Together with a run of U’s located downstream, this stem functions as a Rho-independent terminator, similar to those found at the ends of some genes (see Section 8.2) and at the transcriptional attenuator (described in the previous subsection).
FIGURE 10.19 ■ Riboswitch regulation. A. Transcriptional control. Ligand binding stabilizes a secondary structure that forms a transcription termination stem. Transcription terminates before the coding sequence is transcribed. B. Translational control. Ligand binds to a riboswitch and stabilizes a structure that sequesters a ribosome-binding site. The coding region is not translated.
Riboswitches of another class control translation of the mRNA ( Fig. 10.19B ). In the absence of ligand, these riboswitches form a structure that exposes the ribosome-binding site (RBS), thereby facilitating the initiation of translation. When ligand binds to the riboswitch, it stabilizes a 3D structure that sequesters the RBS. The buried RBS prevents translation of the coding region. Riboswitches in this class do not interfere with transcription, and they can operate on mature, fully transcribed mRNA.
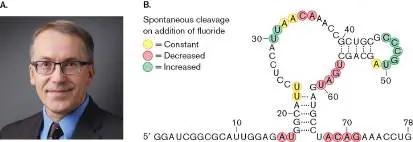
Riboswitches bind to a diverse set of ligands, including vitamins, metals, and regulatory molecules such as cyclic di-GMP (discussed later). Ron Breaker’s laboratory at Yale University discovered an unusual riboswitch in bacteria and archaea that specifically senses fluoride, which is not a cell metabolite (Fig. 10.20). Fluoride has been used for decades to inhibit dental caries, but it is also abundant in Earth’s crust. The fluoride riboswitch was found attached to genes such as enolase that are inhibited by this halide. Fluoride buildup in bacteria will be detected by the fluoride riboswitch, which triggers increased translation of the enzyme being inhibited. The result is increased fluoride resistance in the microbe.
FIGURE 10.20 ■ A fluoride riboswitch. Ron Breaker (A) discovered the fluoride riboswitch called WT 78 Psy (B) . Colored circles mark bases that become susceptible to spontaneous cleavage after the riboswitch binds fluoride—an indication that the structure of the RNA molecule changes. A pseudoknot contains at least two stem loop structures that form a knot-shaped 3D conformation.
DR. RONALD R. BREAKER, YALE UNIVERSITY
Untranslated Regulatory RNAs
Attenuators and riboswitches are part of the mRNA transcript that they control. Messenger RNA can also be regulated by RNAs transcribed from different promoters. A surprisingly
large fraction of a bacterial chromosome does not encode mRNA, ribosomal RNA (rRNA), or tRNA, but instead makes untranslated RNA with regulatory functions. Regulatory RNAs help control a variety of processes, such as plasmid replication, transposition, phage development, viral replication, bacterial virulence, environmental stress responses, and developmental control in eukaryotic microbes. For instance, the untranslated RNA product GadY stimulates the expression of amino acid decarboxylases that confer acid resistance on E. coli, an important factor in the ability of this bacterium to survive the stomach and colonize the human gut (see Section 5.3). The laboratories of Susan Gottesman and Gisela Storz at the National Institutes of Health (Fig. 10.21) were instrumental in discovering that regions between genes (intergenic regions) can encode small RNA (sRNA) molecules (100–200 nt) that affect the expression of many other genes.
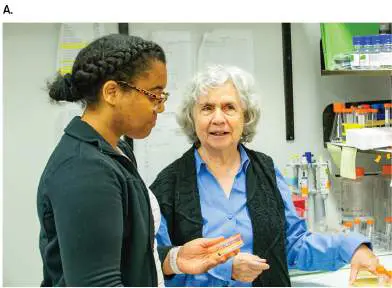
FIGURE 10.21 ■ Susan Gottesman and Gisela Storz. Gottesman (A , right ) and Storz (B) played instrumental roles in
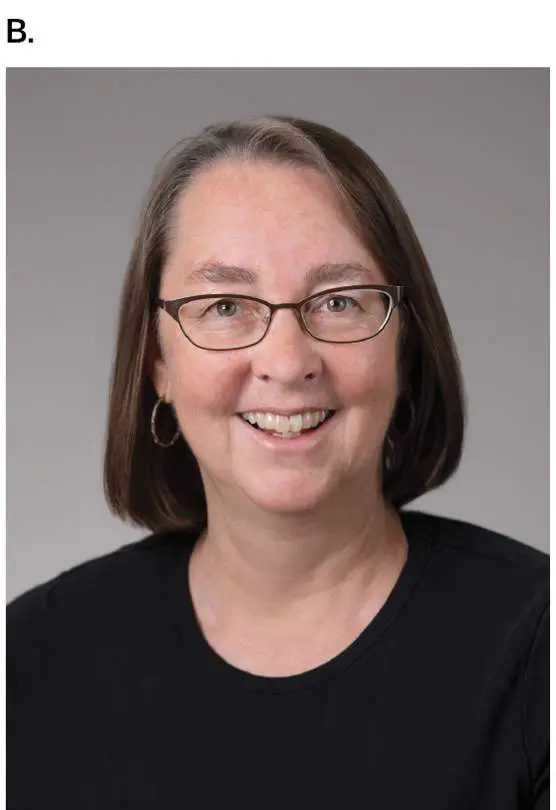
establishing the importance of sRNA molecules in bacteria.
DALE LEWIS
NIH MEDICAL ARTS
Mechanisms of sRNA function. Regulatory sRNA molecules can either increase or decrease gene expression. They typically operate after transcription (posttranscriptional control) by binding to complementary sequences located within target mRNA transcripts. These hybridizations can affect either translation or degradation. Table 10.3groups sRNA molecules by mechanism. Many sRNAs require an RNA chaperone protein called Hfq to stabilize the sRNA and promote its regulatory effects on target mRNAs. Hfq is a hexameric ring protein with sRNA-and mRNA-binding faces.
Classes of sRNA
TABLE 10.3
Molecules
Function (example Mechanism sRNA species) 1. Inhibits translation OxyS Regulates oxidative by blocking stress gene ribosome-binding site expression (E. coli). (RBS). CyaR Represses porin OmpX (E. coli).
ChiX Prevents transport of chitosugars by preventing the synthesis of ChiP porin (E. coli).
SprD Regulates Sbi (S taphylococcus aureus b inder of I gG)
immune evasion molecule.
Qrr3 Controls quorum sensing by sequestering luxO ( Vibrio cholerae).
sRNA 162 Inhibits translation of regulator MM2241; affects methyltransferases ( Methanosarcina mazei).
Classes of sRNA
TABLE 10.3
Molecules
Function (example Mechanism sRNA species)
2. Permits translation DsrA Increases translation of by exposing RBS. sigma S mRNA (E. coli).
3. Promotes RNAIII Regulates global degradation of regulator of agr - mRNA. controlled virulence genes; also encodes a delta hemolysin ( S. aureus).
RyhB Expands regulation by Fur repressor (E. coli ).
Qrr3 Controls quorum sensing via luxR, luxM (V. cholerae).
4. Inhibits degradation SgrS Controls sugar of mRNA. transport by sequestering an RNase E site (E. coli ).
5. Stimulates GadY Regulates acid processing of mRNA resistance (E. coli). to make more stable transcripts.
6. Titrates regulatory CsrB Regulates carbon proteins away from storage (E. coli).
Classes of sRNA
TABLE 10.3
Molecules
Function (example Mechanism sRNA species)
target mRNAs.
Most known sRNAs inhibit translation by base-pairing to a region of mRNA that overlaps the RBS. Binding, therefore, prevents the ribosome from accessing the RBS (Fig. 10.22A). Other sRNA molecules can enhance translation by binding to part of a long, 5′, untranslated mRNA sequence located upstream of an RBS (Fig. 10.22B ). Without the sRNA, the untranslated mRNA sequence folds in a way that occludes the RBS and prevents translation. However, when sRNA binds the target mRNA sequence, the untranslated region refolds to expose the RBS (an example is DsrA, a regulator of sigma S translation; Table 10.3). Ribosomes can now bind the mRNA and translate the message.
FIGURE 10.22 ■ Mechanisms of regulatory sRNA function. Some sRNA molecules will (A) inhibit or (B) activate translation by blocking or exposing a ribosome-binding site (RBS). Other groups of sRNA molecules can (C) promote or (D) prevent the degradation of target mRNA; (E) mediate processing of long, unstable multigene mRNAs into more stable, shorter molecules; or (F) interfere with regulatory protein activity.
Some sRNA molecules control gene expression by affecting mRNA stability. These sRNAs operate by exposing or masking sites on the mRNA that are cleaved by different types of RNases (Fig. 10.22C–E ). RNase III cleaves double-stranded RNA, while RNase E cleaves single-stranded RNA. Some sRNAs form a duplex with the mRNA to promote degradation by RNase III (Fig. 10.22C ). Other sRNAs prevent degradation of the message by binding to and masking an RNase E–binding site (Fig. 10.22D ).
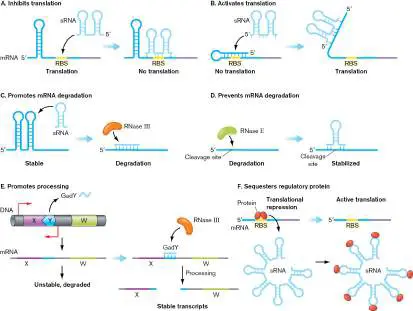
Sometimes cleavage by RNases serves to stabilize rather than degrade the mRNA. Assisted by sRNA, a long, unstable polycistronic transcript can be processed to make shorter, more stable monocistronic mRNAs. For instance, the GadY sRNA of E. coli binds between two coding regions of a polycistronic message and generates a double-stranded target for cleavage by RNase III (Fig. 10.22E ).
In a final class of regulatory sRNA molecules, sRNAs bind to proteins that control translation of certain mRNAs (Fig. 10.22F ). When bound by the sRNA, the regulatory proteins are sequestered away from their mRNA target sequences, and translation of the mRNA is affected.
Small RNA molecules can expand the reach of regulatory proteins. While large regulatory proteins (for example, LacI or TrpR) typically control only a few genes, their reach can be extended by sRNAs. One example involves the f erric u ptake r egulator (Fur) repressor. Iron is hugely important for pathogens growing in the human body and for the quality of soil, where it determines which communities of bacteria and plants can grow. However, too much iron increases oxidative stress and damages the cell. As a result, iron content must be tightly controlled. In many bacteria, including intestinal E. coli, iron uptake is regulated by Fur, which senses iron and regulates several genes whose products either scavenge iron from the environment or store iron in the cell (see Section 4.2). When intracellular iron levels are high, Fur represses the expression of scavenging genes and induces the production of iron-containing and iron-storing proteins (Fig. 10.23A). Fur represses gene expression by directly binding DNA operator sequences in front of target genes. But how does a repressor protein like Fur activate genes like the iron storage genes?
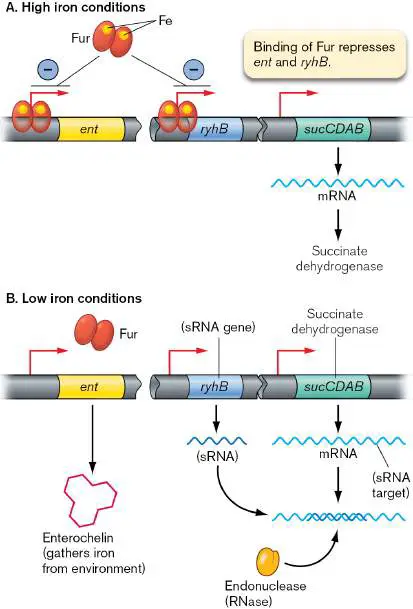
FIGURE 10.23 ■ Activity of a regulatory sRNA molecule. A. When iron levels are high, Fur repressor protein binds to the ent and ryhB Fur box DNA sequence (a short, specific DNA sequence in front of the genes regulated by Fur) and represses their expression. Enterochelin is no longer made, but the sucCDAB message encoding succinate dehydrogenase can be translated. B. Under low iron conditions, RyhB sRNA is expressed. RyhB sRNA binds to the sucCDAB message and renders it susceptible to an RNase.
Fur can activate iron storage genes indirectly by repressing the expression of an inhibitory sRNA called RyhB (Fig. 10.23B ). RyhB sRNA is made under conditions of low iron (such as within the human body) because the Fur repressor is not active. RyhB hybridizes to mRNAs of several iron-storing and iron-using proteins (such as succinate dehydrogenase made from the sucCDAB operon) and promotes their degradation by generating a cleavage site for an RNase. As a result, dwindling iron reserves can be put to more productive use. When iron is plentiful, however, Fur will directly repress ryhB. The lack of RyhB sRNA stabilizes the expression of the iron storage genes. Thus, succinate dehydrogenase is made, binds intracellular iron, and enables the use of succinate as a carbon and energy source.
Thought Question
10.10 The relationship between the small RNA RyhB, the iron regulatory protein Fur, and succinate dehydrogenase is shown in Figure 10.23. Given this regulatory circuit, will a fur mutant grow on succinate?
Small RNAs in archaea. Archaeal species also use several classes of sRNA molecules to fine-tune their physiology. One class, called small nucleolar RNAs (snoRNAs), is also prominent in eukaryotes. The snoRNA designation was retained for archaea even though archaea lack a nucleolus—or nucleus, for that matter. Some archaeal snoRNAs help guide the activity of enzymes that modify other RNAs. For example, one snoRNA (in Pyrococcus and Sulfolobus) guides a methylation enzyme to methylate rRNA at specific sites. Another snoRNA guides the conversion of uridine to pseudouridine in rRNAs. A second class of archaeal sRNA molecules is called tRF. One example is a tRF produced by the halophile Haloferax volcanii during alkali stress. This tRF binds to Haloferax ribosomes and inhibits translation, thereby helping the organism survive high pH.
Cis -antisense RNA. Some operons can be read backward, generating an RNA that can regulate the mRNA transcript made in the forward direction. A cis -antisense RNA (asRNA) is transcribed from the nontemplate (coding) DNA strand that lies opposite an mRNA-encoding template strand (see Fig. 8.1). Cis -antisense regulatory transcripts can base-pair with cognate sense mRNAs and control their expression. Typically, asRNAs are 700–3,000 nt long, originate within a protein-coding gene, and affect only that gene. These features distinguish asRNA from sRNA. Deep sequencing of the E. coli transcriptome revealed the presence of about 1,000 different cis - antisense RNA genes out of 4,290 protein-encoding genes. In fact, every microbe examined to date produces asRNA molecules.
Different asRNAs have different effects on their target genes. When bound to their sense mRNA counterparts, asRNAs can engineer attenuator loops that stop transcription, prevent mRNA translation, or trigger mRNA degradation. Even the simple act of asRNA transcription can produce collisions between converging RNA polymerase complexes that prematurely terminate transcription. An example of the collision mechanism was found for Clostridium acetobutylicum. The ubiG-mccB-mccA operon encodes proteins needed to convert methionine to cysteine (Fig. 10.24A), but it is expressed only when methionine levels are high. When cytoplasmic methionine concentration is low, the RNA polymerase that transcribes the antisense mccA gene will collide with, and stop, the RNA polymerase transcribing the ubiG-mccB-mccA operon (Fig. 10.24B ). The sense MccA transcript is not made, and the premature transcript is degraded. However, when methionine concentration is high, S - adenosylmethionine (made from methionine) binds to the asRNA at the S-box (a riboswitch) and stabilizes a transcription termination loop (Fig. 10.24C ). The mccA antisense RNA is not produced, and because the RNA polymerase making asRNA disengages, no polymerase collision happens. The ubiG-mccB-mccA operon mRNA is completed, MccA is made, and cysteine is synthesized.
FIGURE 10.24 ■ A cis -antisense RNA gene produces colliding RNA polymerases. The MccA protein from the Clostridium acetobutylicum ubiG-mccB-mccA operon helps convert methionine to cysteine when cellular methionine levels are high.
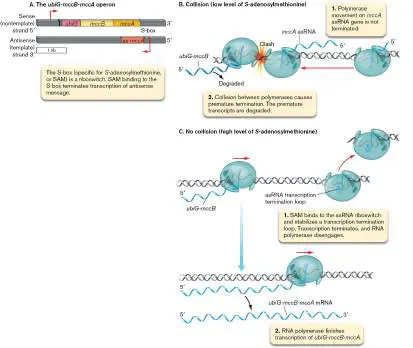
A. Gene arrangement for the ubiG-mccB-mccA operon. Red arrows indicate promoters and transcription start points for the ubiG operon and the antisense gene. B. Antisense RNA is synthesized when methionine levels are low. The MccA transcript is not made, and the premature transcript is degraded. C. Antisense message is not synthesized when methionine concentration is high.
Transcription of the ubiG-mccB-mccA operon is completed, and cysteine can be made. (Red arrows indicate the direction of polymerase movement.)
To Summarize
Attenuation is a transcriptional regulatory mechanism in which translation of a leader peptide affects mRNA structure to influence the transcription of a downstream structural gene. Riboswitches are secondary structures at the 5′ end of specific mRNA molecules that can obscure access to ribosome-binding sites or transcriptional terminator stems.
Regulatory sRNA molecules found within bacterial intergenic regions regulate the transcription or stability of specific mRNA molecules and broaden the reach of protein regulators.
Cis -antisense RNAs are produced from the sense DNA strand of a protein-encoding gene and affect the expression of only that gene. They bind to complementary target mRNA and either stabilize the mRNA or make it susceptible to degradation.
Glossary
transcriptional attenuation A regulatory mechanism that terminates transcription in progress, before it even reaches the first gene.
anti-attenuator stem loop An mRNA secondary structure whose formation prevents assembly of a downstream transcriptional termination (attenuator) stem loop. The anti-attenuator stem loop structure permits transcription of the downstream structural genes. attenuator stem loop Also called terminator stem loop. An intramolecular mRNA structure consisting of a base-paired stem connected by a single-stranded loop. The stem loop structure causes transcription to terminate. Its formation requires efficient translation of a leader peptide sequence.
riboswitch A secondary structure (hairpin) within some mRNA transcripts that can interact with metabolites or antisense RNA molecules, change structure, and affect the production or translation of the mRNA.
small RNA (sRNA)
A non-protein-coding regulatory RNA molecule that modulates translation or mRNA stability.
cis -antisense RNA.
Noncoding RNA from transcription of a DNA sequence complementary to the template strand of a gene that encodes a protein. A cis -antisense RNA binds and regulates the coding transcript made from the template strand of the gene. These regulatory RNAs can stop transcription, promote transcript degradation, or prevent translation.
Fig. 8.12 FIGURE 8.12 ■ The standard genetic code. Codons within a single box encode the same amino acid. Blue-and green-highlighted amino acids are encoded by codons in two boxes. Stop codons are highlighted red. Often, single-letter abbreviations for amino acids are used to convey protein sequences (see legend).
Fig. 8.1 FIGURE 8.1 ■ Alignment of structural genes in a bacterial operon, the mRNA transcript, and protein products. In this figure, the term “gene” refers to the region
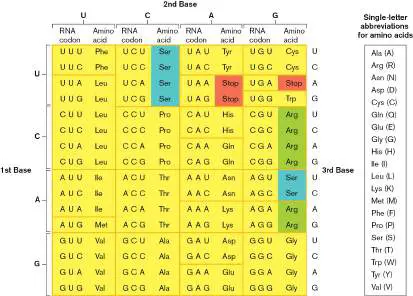
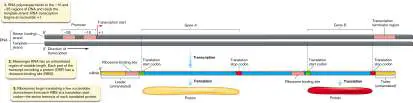
of DNA that encodes a product. In this example, both genes encode protein. ORF = open reading frame.
10.4 Second MessengersUnit 5 · Regulation
Recall from Section 10.1 that the small molecule cAMP can activate operons such as lac. Molecules that don’t serve as biosynthetic precursors but rather have a regulatory function, like cAMP, are sometimes called second messengers. They transmit messages within and even between cells, often controlling expression of multiple operons. They can activate regulatory proteins as cAMP does, but they also bind and modulate regulatory RNAs. In this section we describe the mechanisms by which some regulatory molecules control complex physiological responses to environmental change. We begin with two examples of intracellular signaling molecules that, like cAMP, are derivatives of nucleotides. Then we discuss the variety of extracellular signaling molecules that cells use to communicate with each other.
The Stringent Response
During transitions from nutrient-rich to nutrient-poor conditions, microbes must contend with dramatic fluctuations in growth rate. This variation presents a problem. When a cell is growing rapidly, its molecular machinery is geared for peak performance. The pace of synthesizing new ribosomes is frenetic, trying to keep up with rapid cell division. The more ribosomes a cell contains, the faster that cell can make new proteins and the faster it can grow. But what happens when the party’s over—when poor carbon and energy sources cannot supply enough energy to maintain rapid cell division? Without a way of curbing ribosome construction, cells would soon fill with idle ribosomes.
Under these conditions, bacteria undergo a process called the stringent response. The stringent response causes a decrease in the number of rRNA transcripts made for ribosome assembly and alters the expression of numerous other genes. Stringent response enables some bacteria to resist an antibiotic until they evolve more specific resistance (see Chapter 17).
In the stringent-response strategy, idling ribosomes trigger the synthesis of a small signaling molecule called guanosine tetraphosphate (ppGpp), which interacts with RNA polymerase and lowers the enzyme’s ability to transcribe genes encoding ribosomal RNA (Fig. 10.25). How is ppGpp production regulated by stalled ribosomes? When an uncharged tRNA binds at the ribosome A site, which can happen during amino acid starvation, a ribosome-associated protein called RelA transfers phosphate from ATP to GTP to form ppGpp. This signal nucleotide interacts with the beta subunit of RNA polymerase and diminishes its recognition of promoters for operons producing rRNA and tRNA. The result is down-regulation of rRNA and tRNA synthesis. The less rRNA that is available for building ribosomes, the fewer ribosomes will be produced.
FIGURE 10.25 ■ Ribosome-dependent synthesis of guanosine tetraphosphate and the stringent response.
This raises another question. Even though the synthesis of ribosomal RNA has been curtailed, won’t the cell continue to waste resources on the synthesis of ribosomal proteins? It turns out that some ribosomal proteins can bind to the mRNA that encodes them and inhibit translation. So, when rRNA levels in the cell are low, free ribosomal proteins accumulate in the cytoplasm, unassociated with ribosomes. These excess ribosomal proteins begin to bind to their own mRNA molecules and inhibit the translation of their own coding regions, as well as the coding regions of other ribosomal proteins residing on the same polycistronic mRNA. This process is called
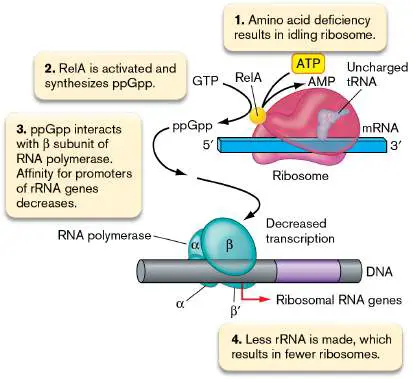
translational control because regulation affects the translation of an mRNA by ribosomes rather than transcription by RNA polymerase.
Cyclic Di-GMP and Biofilm Formation
Escherichia coli cells transition between a motile, single-cell state (planktonic) and an adhesive multicellular biofilm. The transition can be seen clearly in batch cultures. The highly motile state appears during post-exponential growth when nutrient limitation forces E. coli to “forage” for food. When resources diminish further (stationary phase), the organism changes strategy: growth slows, motility decreases (a huge energy savings), and the synthesis of adhesins such as pili increases. After adhering to a surface, the cells start synthesizing exopolysaccharide matrix (see Chapter 4). The molecule cyclic di-GMP (c-di-GMP; Fig. 10.26) coordinates the transition by repressing flagellar synthesis genes and activating biofilm-promoting genes such as those encoding pili.
FIGURE 10.26 ■ Cyclic di-GMP [bis-(3 ′ -5 ′ )-cyclic dimeric guanosine monophosphate], or c-di-GMP.
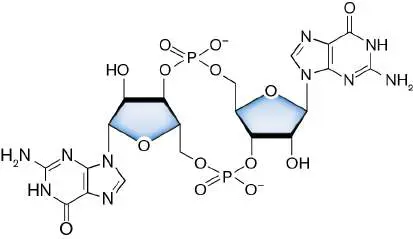
This coordinated shift in physiology is achieved by the balance between synthesis and degradation of c-di-GMP. Synthesis of c-di-GMP from GTP is carried out by many diguanylate cyclases (DGCs) in the cell, all of which contain the amino acid motif GGDEF (see Figure 8.12for explanation of the single-letter amino acid abbreviations). Dedicated phosphodiesterases (PDEs) degrade c-di-GMP to GMP (Fig. 10.27A). Each DGC and PDE protein becomes activated by a different signal, thus increasing or decreasing c-di-GMP levels under different conditions. As shown in Figure 10.27B , PDEs predominate in post-exponential-phase cells, which keeps c-di-GMP level low. Low c-di-GMP concentration favors motility and scavenging. In contrast, DGCs predominate in stationary phase and increase c-di-GMP level. High c-di-GMP inhibits motility and scavenging. Thus, highly motile cells are made in post-exponential phase, while sessile, adherent cells able to form biofilms are produced in stationary phase. Figure 10.27C shows that c-di-GMP is required for Salmonella to make biofilms. Deleting all known GGDEF-motif proteins eliminates c-di-GMP synthesis and halts biofilm formation. Section 12.2 provides a more in-depth exploration of how c-di-GMP controls the development and dispersal of biofilms in the opportunistic pathogen Pseudomonas aeruginosa.
FIGURE 10.27 ■ Cyclic di-GMP coordinates the switch from planktonic growth to biofilm formation. A, B. The relative levels of PDEs and DGCs at different growth phases. C. Surface biofilm production by Salmonella requires c-di-GMP.
C. SOLANO ET AL. 2009. PNAS 106 :7997–8002.
Quorum Sensing and Cell-Cell Communication
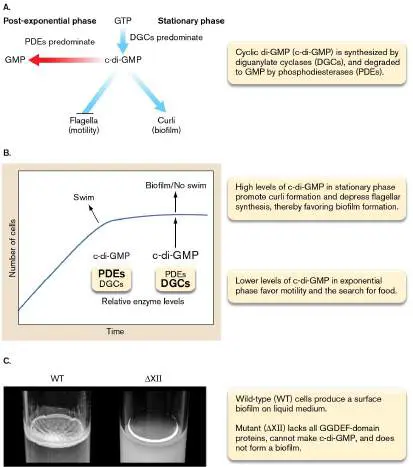
Studies of the Hawaiian bobtailed squid (Euprymna scolopes; Fig. 10.28) led to a discovery that fundamentally changed the way we think about microbes. During the day, this tiny squid remains buried in the sand of shallow reef flats around Hawaii. After sunset, the animal emerges from its hiding place and begins its search for food. As it swims in the moonlit night, its light organ projects light downward in an apparent attempt to camouflage the squid from predatory fish swimming below. Looking up, the fish see only light (called counterillumination), not a squid’s shadow moving against the surface-filtered light of the moon. The light, however, is not made by the squid.
FIGURE 10.28 ■ Visual demonstration of quorum sensing. A. The luminescent bacterium Vibrio (Aliivibrio)
fischeri colonizes the light organ of the Hawaiian bobtailed squid (Euprymna scolopes). The light organ is deep inside the squid and therefore cannot be seen. B. Edward Ruby (University of Hawaii) has studied various aspects of the symbiotic relationship between V. fischeri and its squid host. C. When colonies of V. fischeri are observed in a well-lit place, the light emitted by the bacteria is not visible. D. If the same colonies are viewed in darkness, the intensity of luminescence is remarkable.
M. J. MCFALL-NAGI AND E. G. RUBY, UNIVERSITY OF HAWAII
COURTESY OF EDWARD RUBY, UNIVERSITY OF HAWAII
COURTESY J. W. HASTINGS, HARVARD UNIVERSITY, THROUGH E. G. RUBY,
UNIVERSITY OF HAWAII
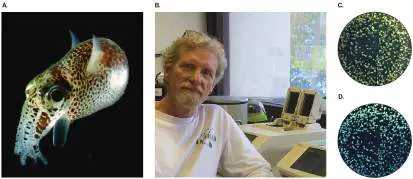
Inside the squid’s light organ are luminescent bacteria called Vibrio (Aliivibrio) fischeri. Bacteria, not the squid, produce the light. However, these microbes do not glow all the time. They light up only when their cell number and the concentration of a secreted signaling molecule rise above a threshold level. The critical density of bacteria is attained by nightfall each day, and the genes needed to make light are “turned on.” The bacteria and the squid have formed a symbiotic relationship known as mutualism (see Section 21.3): The bacteria feed on nutrients provided in the light organ, and the bacterial bioluminescence allows the squid to survive another night.
What, then, accounts for the dependence of gene expression on cell density? How do cells “know” they are crowded?
The phenomenon of density-dependent light production in V. fischeri was discovered by Ken Nealson (Fig. 10.29A) and colleagues in 1970. Nealson noted that as populations of V. fischeri grew in culture, their rate of increase in bioluminescence did not track with the rate of biomass increase, unlike many other cell components and activities (Fig. 10.29B ). In fact, almost no light was produced until the cells were dense and nearly finished with growth. At this point, the rate of increase in bioluminescence far exceeded the rate of biomass increase. Clearly, something triggered the rapid induction of light production. Nealson named this phenomenon autoinduction to reflect the fact that cells need no external factors or stimuli to promote this rapid increase in luciferase-based light production. After this study the term quorum sensing was applied to this phenomenon because it seemed akin to parliamentary rules of order that require a minimum number of members (a quorum) to be present at a meeting in order to conduct business.
FIGURE 10.29 ■ Bioluminescence of Vibrio (Aliivibrio) fischeri is controlled by quorum sensing. A. Ken Nealson.
B. His experiment began with a dilute culture, whereby the biomass of the population increased at a constant rate until nutrient depletion. Bioluminescence of the growing population did not increase until 3 hours after inoculation, at a rate that far exceeded biomass increase.
Source: Part B modified from K. H. Nealson et al. 1970. J. Bacteriol. 104 :313– 322, fig. 4.
COURTESY OF K. NEALSON UNIV. OF S. CAL.
What triggers the eventual burst in luciferase production in V. fischeri? Cells do not count each other directly. Instead, induction of a quorum-sensing gene system involves the accumulation of a membrane-permeable small molecule called an autoinducer. In V. fischeri, the autoinducer is synthesized by the LuxI protein, the product of the first gene in the lux operon (Fig. 10.30). At low cell densities, the operon is transcribed at a low but constitutive rate. Consequently, these cells have low levels of LuxI protein and therefore make only small quantities of autoinducer. Autoinducer can
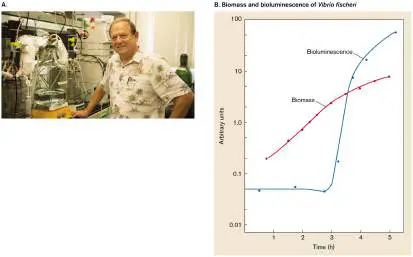
diffuse across the membrane into the medium, such that the concentrations inside and out are the same. If growth proceeds in a relatively fixed volume, such as the light organ of the squid, the concentration of autoinducer in the environment and in the cell increase in parallel as a function of cell density.
FIGURE 10.30 ■ Microbial communication through quorum sensing. The lux system of Vibrio fischeri mediates that organism’s bioluminescence. Synthesis and accumulation of an autoinducer (AI) trigger expression of the lux operon. The greater the cell number and the smaller the container, the faster AI will accumulate. The resulting luciferase enzymes catalyze bioluminescence. The luciferase reaction, catalyzed by LuxA and LuxB, uses oxygen and reduced flavin mononucleotide (FMN) to oxidize a long-chain aldehyde (RCHO) and, in the process, produces blue-green light. Other lux gene products are involved in synthesis of the aldehyde.
When growth reaches a threshold concentration of cells and autoinducer, the intracellular concentration of autoinducer becomes high enough to bind and activate the regulatory molecule LuxR ( Fig. 10.30). The LuxR-autoinducer complex activates transcription of the lux operon, which has two important effects.
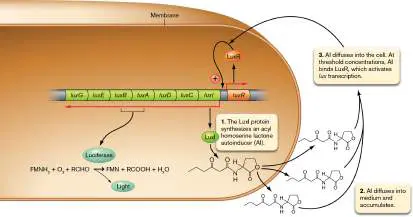
First, more LuxI is produced from luxI, the first gene of the operon. More LuxI synthesizes more autoinducer, which in turn increases expression of the lux operon. This chain of steps establishes a positive feedback loop that rapidly generates high concentrations of LuxI and autoinducer. The second effect of LuxR-autoinducer activation of the lux operon involves the genes downstream of luxI. These genes are cotranscribed with luxI and experience the same rapid elevation in expression. These downstream genes confer bioluminescence, and their rapid increase in expression can be witnessed by the rapid increase in luciferase expression and bioluminescence evident in Figure 10.29B . Luciferase is encoded by luxA and luxB, while the remaining genes in the operon are involved in providing substrate for the luciferase reaction (Fig. 10.30).
Thought Question
10.11 What would be the outcome if purified autoinducer were experimentally provided to a low-density culture?
The autoinducer of V. fischeri is a homoserine lactone molecule ( Fig. 10.30). Homoserine lactones serve as autoinducers for many Gram-negative microbes (Table 10.4). In general, homoserine lactone autoinducers are species-specific, which allows individual species to count their numbers within often complex communities. Whereas the V. fischeri homoserine lactone regulates light production, those of other species regulate genes involved in a variety of behaviors, including gene transfer (conjugation) and exoenzyme production. Gram-positives such as Streptococcus pneumoniae (discussed later) usually use short peptides as autoinducers. Additional classes of autoinducers also exist, including gamma-butyrolactones and furanosyl borate diesters (Table 10.4 ). As will be discussed later, furanosyl borate diesters have unusual ability to mediate interspecies communication.
TABLE Examples of Microbial Quorum-
10.4 Sensing Systems
Autoinducer System Organism family Function TraR/TraI Agrobacterium Homoserine Conjugation tumefaciens lactone LuxR/LuxI Vibrio Homoserine Bioluminescence (Aliivibrio) lactone fischeri LasR/LasI Pseudomonas Homoserine Exoenzyme aeruginosa lactone production Rhl Pseudomonas Homoserine Exoenzyme aeruginosa lactone production LuxN/LuxLM Vibrio harveyi Homoserine Bioluminescence lactone Agr Staphylococcus Peptide Exotoxin production StrR Streptomyces γ- Aerial hyphae; griseus Butyrolacto antibiotic ne production LuxQ/LuxS Vibrio harveyi Furanosyl Bioluminescence borate diester SdiA Escherichia coli Unknown Cell division YpeR/YpeI Yersinia pestis Unknown Unknown TABLE Examples of Microbial Quorum-
10.4 Sensing Systems
Autoinducer System Organism family Function Structures of different autoinducer families: Quorum-sensing systems control a variety of functions (Table 10.4) and are widely employed in the microbial world. This broad distribution suggests that there are many reasons why the coordinated behavior of the population based on cell numbers is advantageous. One important use of quorum sensing is for pathogens to time the production of virulence factors for optimal effect on the host. As described in eResearch Activity 10, the quorum-sensing system of V. fischeri performs several important roles once the cells colonize the light organ of the squid host: It not only controls light production but also signals the squid to constrict the pathway into the light organ, thereby preventing other microbes from entering.
Quorum Sensing and Pathogenesis
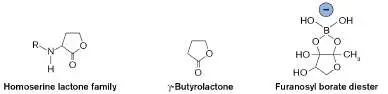
Pseudomonas aeruginosa is a human pathogen that commonly infects patients who have cystic fibrosis, a genetic disease of the lung. The organism forms a biofilm in the lung and secretes virulence factors (such as proteases and other degradative enzymes) that destroy lung tissues (and thereby severely compromise lung function). These virulence proteins, however, are not made until cell density is fairly high; that is, at a point where the organism might have a chance of overwhelming its host. Made too early, virulence proteins would alert the host to launch an immune response. Scientists such as Peter Greenberg at the University of Washington (Fig. 10.31) have discovered that the induction mechanism involves two interconnected quorum-sensing systems, called Las and Rhl, both composed of regulatory proteins homologous to LuxR and LuxI of Vibrio (Aliivibrio) fischeri. Many pathogens besides Pseudomonas appear to use chemical signaling to control virulence genes. These include Staphylococcus, Yersinia pestis, Vibrio cholerae, the plant pathogen Agrobacterium tumefaciens (Table 10.4), and many others.
FIGURE 10.31 ■ Peter Greenberg, one of the pioneers of cell-cell communication research. Greenberg has studied quorum sensing in Vibrio species and various other pathogenic bacteria, such as Pseudomonas.

E. PETER GREENBERG, UNIVERSITY OF WASHINGTON
Interspecies Communication
Some microbial species not only chemically talk among themselves but can communicate with other species. The marine bacterium Vibrio harveyi, for example, uses three different, but converging, quorum-sensing systems to coordinate control of its luciferase. These sensing pathways are very different from the Vibrio fischeri system. One utilizes an acyl homoserine lactone (AHL) as an autoinducer (AI-1) to communicate with other V. harveyi cells. A second system produces a different autoinducer (AI-2; furanosyl borate diester, Table 10.4), which contains borate. Bonnie Bassler (Fig. 10.32) and colleagues at Princeton University found that distantly related organisms such as Salmonella can activate the AI-2 pathway of V. harveyi, dramatically supporting the concept of cross-species communication. Because many bacterial species can produce this second signaling molecule, it is thought that mixed populations of microbes use it to “talk” to each other. Karina Xavier (NOVA University of Lisbon, Portugal) demonstrated that E. coli engineered to overproduce AI-2 could change the composition of gut microbiota when fed to mice. FIGURE 10.32 ■ Bonnie Bassler. Bassler was instrumental in characterizing interspecies communication in bacteria.
ZACH DONNELL
The third quorum-sensing system of V. harveyi was discovered initially in Vibrio cholerae and was named cholera autoinducer 1 (CAI-1). Whereas AI-1 is species-specific and AI-2 allows for communication between distantly related species, CAI-1 falls in between with its specificity, allowing different species of the Vibrio genus to communicate. Clearly, cell-cell communication is a highly sophisticated regulatory mechanism for light production by V. harveyi.
The three autoinducers of V. harveyi are synthesized by cytoplasmic enzymes and are recognized by specific membrane sensor kinase proteins (Fig. 10.33). Note that these systems detect autoinducers in the periplasm, not within the cytoplasm like the systems of V. fischeri (Fig. 10.30). At low cell densities (no

autoinducer), all three sensor kinases initiate phosphorylation cascades that converge on a shared response regulator, LuxO, to produce phosphorylated LuxO. LuxO-P activates expression of small RNAs called Qrr that promote degradation of mRNA encoding the lux operon activator LuxR (LuxR is not a homolog of the V. fischeri LuxR, but it plays a similar role). Thus, at low cell densities the culture does not display bioluminescence. At high cell densities, the autoinducers prevent signal transmission by inhibiting phosphorylation. The cell stops making Qrr sRNA and starts making LuxR. LuxR activates the lux operon, and the “lights” are turned on.
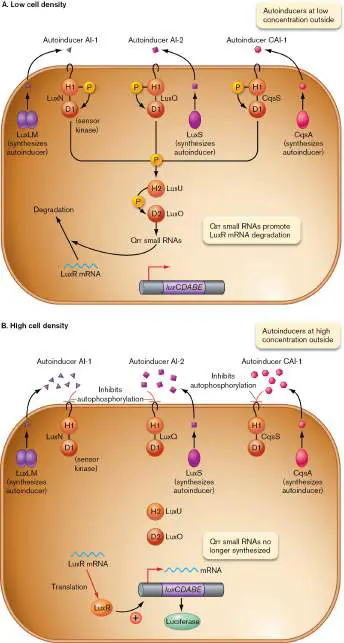
FIGURE 10.33 ■ Three quorum-sensing systems of Vibrio harveyi. A. At low cell concentration, autoinducers (AI-1, AI-2, and CAI-1) are also at low concentration, and all three sensor kinases trigger converging phosphorylation cascades that end with the phosphorylation of LuxO. Phosphorylated LuxO (LuxO-P) activates the expression of Qrr small RNAs that promote the degradation of LuxR mRNA. Luciferase is not made. B. As autoinducer concentrations increase, they inhibit autophosphorylation of the sensor kinases and the phosphorylation cascade. As a result, Qrr levels decrease, allowing synthesis of the LuxR regulator, which activates the lux operon, and luciferase is synthesized. H = histidine residue; D = aspartate residue.
A report by Ian Joint and his colleagues at Plymouth Marine Laboratory, Plymouth, UK, showed that bacteria can even communicate across the prokaryotic-eukaryotic boundary. The green seaweed Enteromorpha (a eukaryote) produces motile zoospores that explore and attach to Vibrio anguillarum bacterial cells in biofilms (Fig. 10.34). They attach and remain there because the bacterial cells produce AHL molecules that the zoospores sense. Part of the evidence for this interdomain communication was the demonstration that the zoospores would even attach to biofilms of E. coli carrying the Vibrio genes for AHL synthesis. The implications of possible interdomain conversations are staggering. Does our microbiome “speak” to us? Do we “talk” back? For further discussion of molecular communication between prokaryotes and eukaryotes, see Chapter 21.
FIGURE 10.34 ■ Enteromorpha zoospores. Zoospores of the alga Enteromorpha (red) attach to biofilm-producing bacteria (blue) in response to lactones produced by the bacteria.
IAN JOINT
Thought Questions
10.12 Genes encoding luciferase can be used as “reporters” of gene expression when placed under the regulatory control of other genes. Luminometers are machines that can quantify light production (luminescence) from luciferase. From the discussion in Section 9.2, propose an experiment to confirm that RecA is induced during the SOS response.
10.13 What would happen if a culture were coinoculated with Vibrio (Aliivibrio) fischeri luxI and luxA mutants, neither of which produces light?
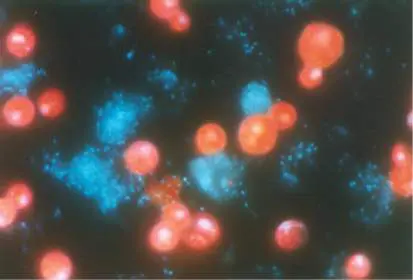
Quorum Sensing in Gram-Positive Organisms, and the Activation of Natural Transformation
Natural transformation (see Section 9.3) in Gram-positive organisms typically involves the growth phase–dependent assembly of a transformasome complex across the cell membrane (Fig. 10.35). The transformasome is composed of a binding protein that captures extracellular DNA floating in the environment, plus proteins that form a transmembrane pore. A nuclease degrades one strand of a double-stranded DNA molecule while pulling the other strand intact through the pore and into the cell. Once inside, the strand can be incorporated into the chromosome by recombination, a process discussed in Section 9.2.
FIGURE 10.35 ■ Quorum-sensing regulation of transformation in Streptococcus. The process of transformation in Streptococcus begins with the synthesis of a signaling molecule (competence stimulation peptide; CSP) and concludes with the import of a single-stranded DNA strand through a transformasome complex.
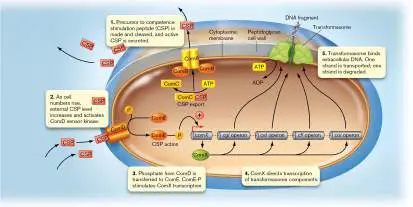
Once the transformasome is assembled, the cell is competent, meaning that it can import free DNA fragments and incorporate them into its genome by recombination. What triggers growth phase–dependent competence? For some Gram-positive bacteria, competence for transformation is generated by quorum sensing that takes place between members of the culture. Every individual in a growing population produces and secretes a small peptide (15–20 amino acids), called competence stimulation peptide (CSP), that progressively accumulates in the medium until it induces a genetic program that makes the population competent (Fig. 10.35, step 1). The CSP sequence is unique to each species, as are the specifics of the induction process. For Streptococcus pneumoniae, the level of CSP in the medium increases (step 2) as the population increases; that is, as the cell density increases.
Above a certain concentration threshold, CSP is able to bind to a sensory protein built into the cell membrane (ComD for S. pneumoniae). This binding begins what is called a phosphorylation cascade (the passing of a phosphate group from one protein to another; Fig. 10.4). In the competence phosphorylation cascade, the sensory protein phosphorylates itself using ATP and then passes the phosphate to a cytoplasmic regulatory protein, ComE, which stimulates expression of comX (Fig. 10.35, step 3). ComX is an alternative sigma factor specifically used to transcribe genes encoding the transformasome (step 4). The protein products of these genes are assembled at the membrane, and the cell becomes competent (step 5).
Why would organisms use quorum sensing to regulate transformation competence? One hypothesis holds that cells are unlikely to encounter stray DNA when growing in dilute natural environments such as ponds, where other bacteria are scarce. So, in this situation, why waste energy making the transformasome? When these same cells are growing at high density, as in a biofilm, they are more likely to encounter DNA released from dying neighbors. This is DNA they could use to repair their own damaged genomes, to consume as food, or to sample for a new survival mechanism, should the DNA come from a different species present in a biofilm consortium. Regulation by quorum sensing would ensure that the transformasome would not form until there was a good chance that free foreign DNA was available.
Thought Question
10.14 Figure 10.35 illustrates the process of transformation in Streptococcus pneumoniae. Would a mutant of Streptococcus lacking ComD be able to transform DNA?
To Summarize
The stringent response is triggered during nutrient limitation when low cellular amino acid levels cause ribosomes to idle and synthesize the signaling molecule ppGpp. Binding of ppGpp to RNA polymerase decreases synthesis of rRNA, which slows the rate of new ribosome synthesis. The overall rate of translation, then, will match growth rate.
The second messenger cyclic di-GMP (c-di-GMP) is made by numerous proteins containing a GGDEF amino acid motif. Many cell functions are influenced by c-di-GMP, including biofilm formation and motility.
Quorum sensing involves the synthesis, secretion, and extracellular accumulation of small autoinducer signaling molecules. Cells within a population sense a threshold concentration of autoinducer and simultaneously respond by expressing a subset of genes.
Quorum sensing enables communication between cells of a single species or between multiple species.
Pathogens use quorum sensing to time the expression of virulence genes during growth within a host.
Quorum sensing can control natural transformation in Gram-positive bacteria such as Streptococcus pneumoniae.
Glossary
second messenger A regulatory molecule such as cAMP that is produced in response to a primary signal. Second messengers typically affect the expression of numerous genes.
stringent response A cellular response to idle ribosomes (often indicating low carbon and energy stores) that includes a decrease in rRNA and tRNA production.
translational control A regulatory mechanism that modulates protein production by influencing the translation of mRNA.
autoinduction A mode of gene regulation independent of outside intervention, involving the conditioning of the medium by the cells. Usually refers to quorum-sensing control mediated by secreted autoinducer molecules.
quorum sensing The ability of bacteria to sense the abundance of other bacteria via secreted chemical signals called autoinducers.
autoinducer A secreted molecule that induces quorum-sensing behavior in bacteria.
competent Able to take up DNA from the environment.
Figure 8.12 FIGURE 8.12 ■ The standard genetic code. Codons within a single box encode the same amino acid. Blue-and green-highlighted amino acids are encoded by codons in two boxes. Stop codons are highlighted red. Often, single-letter abbreviations for amino acids are used to convey protein sequences (see legend).
Fig. 10.4
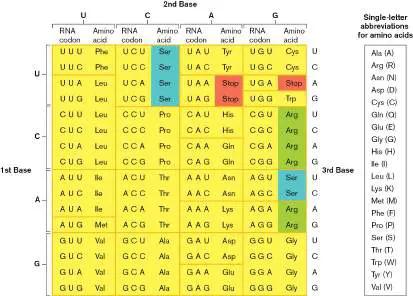
FIGURE 10.4 ■ Two-component signal transduction systems sense the external environment. In this specific example, an environmental signal is relayed to repress expression of a target gene. The sensor kinase undergoes autophosphorylation when it binds the environmental signal. Transfer of the phosphate to the response regulator induces a conformation change (not shown) that allows it to bind the operator and repress transcription of a target gene. If a phosphatase cleaves the
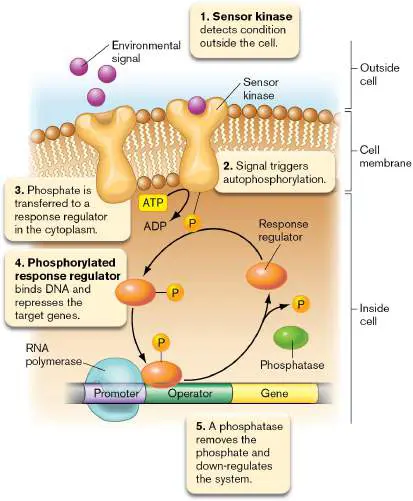
phosphate, the response regulator changes back to its original conformation and is released from the operator.
10.5 Clocks, Thermometers, and SwitchesUnit 5 · Regulation
In this section we further explore the diversity of regulatory mechanisms in microbes. We will examine how cells use protein clocks, RNA thermometers, and changes in DNA sequence to control gene expression. Another interesting example—regulation by protein splicing—is discussed in Special Topic 10. These examples all show how regulation can be customized to fit the specific demands that the environment places on the cell.
SPECIAL TOPIC 10 Inteins, Exteins, and “Spliced-Up” Regulation
Pyrococcus horikoshii is a marine, thermophilic member of the Archaea, isolated from hydrothermal vent fluid in the Okinawa Trough, located in the western Pacific Ocean. Like most microbes, it utilizes a recombinase system to repair DNA (see Section 9.2). Its RecA homolog (called RadA) has a very unusual feature: It contains a special polypeptide fragment, called an “intein,” that keeps the protein in an inactive state. Remarkably, the substrate of the RadA protein, single-stranded DNA, triggers this intein to excise itself, splicing the two fragments of the RadA protein together, which enables this enzyme to perform its function in DNA recombination. This process was discovered by Marlene Belfort and Christopher Lennon at the University of Albany (Fig. ST 10.1 ).
FIGURE ST 10.1 ■ Christopher Lennon (left) and Marlene Belfort.
COURTESY OF CHRISTOPHER LENNON AND MARLENE BELFORT
Inteins are a special form of mobile genetic element found in bacteria, archaea, and single-celled eukaryotes (Fig. ST 10.2A ). They have a unique and remarkable relationship with their host gene: They insert as DNA but can excise as protein. Their DNA sequence encodes endonucleases that insert a copy of the DNA of the mobile element into the coding region of genes by exploiting the cell’s double-strand-break repair recombination mechanism. When the target gene is expressed, it translates the element’s code as well, resulting in a hybrid protein, with the intein-encoded peptide between the split halves of the protein, called “exteins” (Fig. ST 10.2A ). This hybrid protein is usually inactive, because the inteins bias their insertion to the active sites of enzymes. However, the intein peptide is catalytic and is capable of excising itself perfectly out
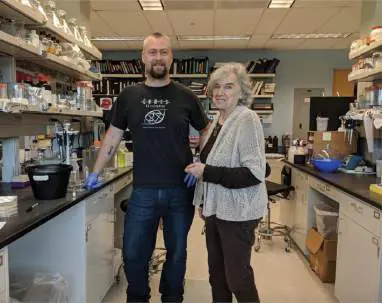
of the host protein, even after the host protein folds into its 3D structure. When excision happens, the host protein’s function is restored, because the intein splices together the extein fragments that the host leaves behind, without a trace of its presence remaining (Fig. ST 10.2A ).
FIGURE ST 10.2 ■ Intein excision from RadA is induced by ssDNA. A. The intein (red) is situated between two “extein” fragments of RadA (blue and green). B. Coomassie blue–stained gel of the products of in vitro reactions at time zero and after 10 minutes of incubation with various substrates. The first lane is a set of size standards (units in kilodaltons; kDa). TE is a buffer-only negative control. C. Model for how ssDNA activates the excision machinery of the intein.
Sources: Part B modified from C. Lennon et al. 2016. Genes Dev. 30:2663–2668, fig. 1A; part C, from M. Belfort. 2017. Curr. Opin. Microbiol. 38 :51–58, fig. 4C.
C. LENNON ET AL. 2016. GENES DEV. 30: 2663–2668. DOI
10.1101/GAD.289280.116
COURTESY OF CARL JOHNSON, VANDERBILT UNIVERSITY
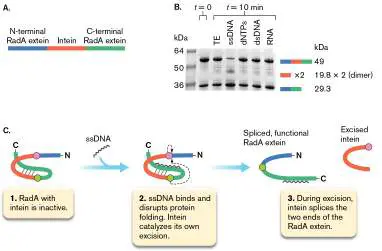
Although inteins were originally viewed as “selfish”
elements, some inteins have been recently observed to serve as sensors: They regulate their excision events in response to environmental stimuli, and by this excision they activate the host protein. Some of these proteins are involved in responding to environmental stress, such as oxidative stress, and remarkably, the stress triggers intein excision and protein activation. In this way, inteins serve as an unusual but nonetheless effective means of posttranslational regulation of gene expression.
Belfort and Lennon used an in vitro assay of purified RadA to analyze the intein excision event. Different stimuli were provided, and they ran the products on a polyacrylamide gel to separate the proteins by size. Proteins were visualized with the Coomassie blue stain (Fig. ST 10.2B ). At time zero, before any stimulus was provided, the RadA protein consisted mostly of a 49-kDa “precursor” protein, indicating that the intein was present. A smaller amount of intein-free RadA (29.3 kDa) was also present, representing “baseline” intein excision in the absence of stimulus. When incubated in TE buffer alone, the protein profile did not change. Exposure to single-stranded DNA (ssDNA), however, increased intein excision and yielded more intein-free RadA and a new product consistent with the excised intein dimer (19.8 kDa × 2). This result demonstrated that ssDNA activates intein excision and extein splicing. Stimulation of excision was specific for single-stranded DNA, the specific substrate for RadA when it is a functional enzyme. When the investigators substituted ssDNA with deoxyribonucleotides (dNTPs), double-stranded DNA (dsDNA), or RNA, they saw no stimulation. Hence, excision and resulting activation of the enzyme is triggered by the presence of the enzyme’s substrate. Subsequent study of this system led Belfort and Lennon to propose a model for how ssDNA stimulates intein excision ( Fig. ST 10.2C ). In the absence of ssDNA, the intein-containing RadA precursor folds such that the intein component interacts with the C-terminal RadA extein to keep the intein’s excision machinery inactive. When present, ssDNA disrupts the interaction between the intein and the C-terminal extein. This disruption activates the intein machinery to excise the intein and join the two exteins to make an active RadA recombinase. The RadA enzyme can now bind its ssDNA substrate and perform its function in DNA recombination for repair and/or horizontal gene transfer.
RESEARCH QUESTION
If you found that a protein became activated posttranslationally, during exposure to an environmental stimulus, what steps would you take to determine whether this change was due to the presence of an intein in the protein that could sense the stimulus?
Lennon, Christopher W., Matthew Stanger, and Marlene Belfort. 2016. Protein splicing of a recombinase intein induced by ssDNA and DNA damage. Genes and Development 30 :2663–2668.
Circadian Clocks: Anticipation Rather than Response
Thus far in our discussion of molecular regulation, we have considered how microbes respond to environmental changes that arise sporadically, or unexpectedly, during the lifetime of a microbe— a sudden influx of lactose or a rapid rise in temperature, for instance. Such events induce rapid changes in gene expression and physiology, which enable the cell to acclimate to the new conditions. But what if the environmental change were predictable in the sense that it happened at regular time intervals? In this case, might evolution favor organisms that could anticipate this change and optimize its activities in preparation? The answer is yes, and we need not look any further than our own bodies, which have the ability to measure out time of day through the use of a circadian clock, which helps to set our sleep rhythms. As we will discuss, some microbes also possess clocks that help them regulate their activities in anticipation of the changes that occur over the day.
Circadian clocks maintain a period of approximately 24 hours because that is how long it takes Earth to rotate on its axis (Fig. 10.36A). Cells at a fixed position on the globe receive exposure to sunlight that varies as a function of this 24-hour period of rotation. Because the 24-hour light-dark cycles are highly reproducible, natural selection has generated biological clocks that can keep pace. FIGURE 10.36 ■ Circadian expression in cyanobacteria is defined by light-dark periodicity. A. The 24-hour circadian period is set by the speed of Earth’s rotation on its axis. B. Oscillation of gene expression over the light-dark photoperiod entrains the clock. In continual light, the clock maintains the 24-hour oscillations in output during this “free-running” condition. Source: Part A modified from Wikimedia.org; part B modified from C. H. Johnson et al. 2017. Nat. Rev. Microbiol. 15 :232–242, box 1 fig.
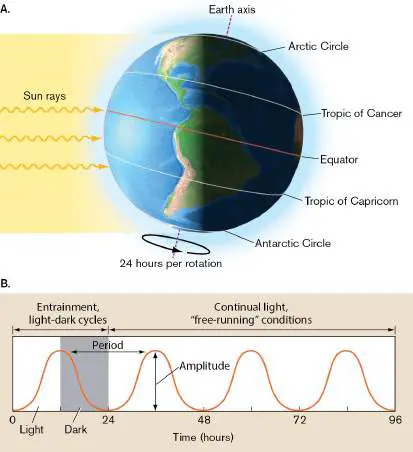
Photosynthetic bacteria of the phylum Cyanobacteria possess circadian clocks that help cells prepare for activities at specific times of day. For example, cyanobacteria perform photosynthesis during the day, converting light into chemical energy to fix carbon dioxide into biomass, producing oxygen as a waste product. Some cyanobacteria can also fix N 2 gas, but the key enzyme nitrogenase is inhibited by oxygen. Unicellular nitrogen-fixing cyanobacteria solve this dilemma by expressing nitrogenase at night, when oxygen is not being actively produced.
The expression of genes under circadian clock control oscillates over a 24-hour period (Fig. 10.36B ). The phasing of the oscillation—that is, the changes in gene expression from a maximum level to a minimum level and back again—is often tied to the function of that regulated gene or set of related genes. For instance, genes involved in photosynthesis and production of energy storage molecules such as glycogen tend to peak at dawn, in anticipation of the coming daylight. In contrast, genes involved in “nighttime” processes peak at dusk. These genes include those that consume the glycogen made during the day. Deprived of light energy at night, cells catabolize glycogen as an energy source for nighttime activities, which can include cell division. While the clock sets the daily oscillation in gene expression, other transcription factors can set the baseline expression of those genes. For instance, they can dictate whether a gene is expressed (and subject to oscillation by the clock) or is turned off entirely. Scientists use three criteria to establish the presence of a circadian clock regulator of gene expression. First, the 24-hour periodicity of gene expression oscillation must persist if the cell is shifted to constant light (or dark) conditions (Fig. 10.36B ). Second, it must be possible to entrain (reset) the period by manipulating the environmental cycle of light and dark, which can help the cell make subtle adjustments to the clock. Third, the oscillator must be temperature compensated, meaning that it will maintain a 24-hour period even when temperature is changed. This third criterion is important because temperature can affect the rate of enzymatic reactions and potentially alter the timing mechanism of the circadian clock, unless compensation is possible.
The proteins that make up the circadian clock, or oscillator, of cyanobacteria are KaiA, KaiB, and KaiC. These proteins are not homologous to the clock proteins of animals and thus have a different evolutionary origin. The cyanobacterial clock operates by cycling between phosphorylated and dephosphorylated states of KaiC. Phosphorylation of KaiC changes its structure and consequently its ability to bind other proteins. KaiC performs autophosphorylation and autodephosphorylation of itself, but uses the activity of KaiA and KaiB to control the timing of (de)phosphorylation and output of the clock. This three-protein clock has a remarkable property (Fig. 10.37): If it is reconstituted in a test tube and supplied with ATP, it can keep 24-hour time for days or even weeks, even in constant darkness!
FIGURE 10.37 ■ Purified circadian clock proteins in a test tube maintain 24-hour periodicity in the phosphorylation state of KaiC. KaiA, KaiB, and KaiC proteins were incubated with ATP, and the phosphorylation state of KaiC was assayed every 2 hours for several days. P-KaiC and NP-KaiC refer to phosphorylated and nonphosphorylated states, respectively, which can be distinguished because they migrate as separate bands through a gel during electrophoresis. Band intensity is a function of protein concentration.
The clock controls global gene expression through the ability to modify the extent of chromosome compaction and the ability to regulate the activity of a two-component regulatory system. Toward the end of the day, KaiC is in a semiphosphorylated state and is able to bind and activate a two-component regulatory system that activates some genes and represses others. Some of these proteins encode sigma factors and anti-sigma factors that disseminate the clock signal to a wider set of genes in the genome. At dusk, the two-component system also turns on genes involved in catabolism, important for energy production at night, and turns off genes involved in photosynthesis.
What happens to cyanobacteria if their clock is broken? Mutants that lack a clock are still viable and grow relatively well under a normal light-dark photoperiod. Thus, clocks are not essential for life in these organisms, but perhaps their contributions to fitness are more subtle. To address this possibility, Carl Johnson (Fig. 10.38A ) and colleagues at Vanderbilt University first generated mutants of Synechococcus that had different free-running clock periods. Some mutants had free-running periods (FRPs) that were shorter (22 hours) or longer (30 hours) than that of the wild type (25 hours; Fig. 10.38B ). These strains were placed in cocultures and subjected to different lengths of day to determine whether clock period affected fitness. The mutants with 22-hour periods outgrew the wild type when a 22-hour day (11 hours light, 11 hours dark) was imposed (Fig. 10.38C ). Likewise, mutants with 30-hour periods outgrew the wild type when a 30-hour day was imposed. Importantly, this advantage was specific to day length, since the 22-hour mutants were less fit than the wild type in 30-hour days, while the 30-hour mutants were less fit than the wild type in 22-hour days. This study did not identify the physiological basis of the fitness advantages but did demonstrate clearly that when clocks match the light-dark cycle, they provide a growth advantage to the organism. FIGURE 10.38 ■ The clock confers a fitness advantage in cyanobacteria. A. Carl Johnson. B. Johnson and colleagues isolated mutants with free-running periods (FRPs) that were shorter (22 hours) or longer (30 hours) than that of the wild type (25 hours) when grown in continual light. C. In competition with wild type under a period consisting of equal amounts of light and dark, the fraction of the total population composed of the clock mutants is dictated by the length of the day.
Source: Parts B and C modified from M. A. Woelfle et al. 2004. Curr. Biol. 16:1481–1486, figs. 3A and 3C.
COURTESY OF CARL JOHNSON, VANDERBILT UNIVERSITY
Clocks are not restricted to light-harvesting microbes like cyanobacteria and can even control bacterial motility within the sun-deprived human gut. While gut bacteria such as Enterobacter aerogenes do not photosynthesize, their environment is affected by the human circadian clock. E. aerogenes has homologs to the clock genes of cyanobacteria, and these may provide this organism with a selective advantage in the dynamic gut environment. Vincent Cassone and colleagues at the University of Kentucky examined the
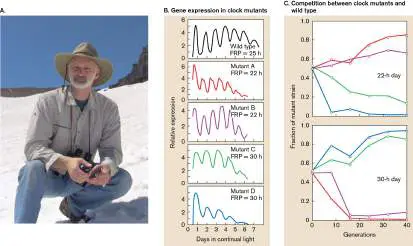
swarming behavior of E. aerogenes in the presence of melatonin, a hormone that regulates our night-day sleep patterns and is present in high concentrations in the gut (see Section 12.2 for more on swarming motility). Swarming produced concentric rings on agar plates as the bacterial population expanded from a single point of inoculation. Rings on plates without melatonin had no periodicity ( Fig 10.39A), but cells grown on plates containing melatonin formed rings every 25 hours (Fig 10.39B ). The results indicate that members of the gut microbiome may possess a circadian clock that is turned on by, and synchronized with, its host.
FIGURE 10.39 ■ Melatonin activates circadian rhythm in the gut bacterium Enterobacter aerogenes. Enterobacter aerogenes exhibits different swarming behavior from a central point of inoculation in the absence (A) and the presence (B) of melatonin. Rings in panel B formed every 25 hours.
J. K. PAULOSE ET AL. 2016. PLOS ONE 11 :E0146643
Sigma Factor Control by RNA Thermometers and Proteolysis
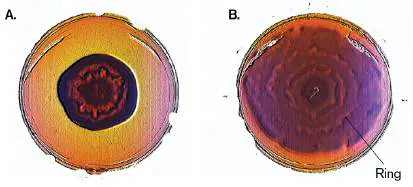
Excessive heat, above 42°C for Escherichia coli, causes many proteins to denature and membrane structure to deteriorate. All cells subjected to heat above their optimal growth range will express a set of proteins called heat-shock proteins. These proteins include chaperones that refold damaged proteins (see Fig. 8.33), as well as a variety of other proteins that affect DNA and membrane integrity. The transcription of many E. coli heat-shock genes requires the heat-shock sigma factor sigma H (also called sigma-32, RpoH, σ H, or σ 32). So, one of the first responses to exposure to elevated temperature is an increase in the amount of sigma H protein. The concentration of sigma H protein is tightly regulated by two temperature-sensitive processes: RNA melting and protein degradation (Fig. 10.40).
FIGURE 10.40 ■ The heat-shock response of Escherichia coli. Two mechanisms control sigma H levels. The small amount of sigma H that can be made at 30°C (left) is met by the DnaK-DnaJ-GrpE chaperone system and shuttled toward degradation. At 42°C (right), however, misfolded cytoplasmic proteins siphon
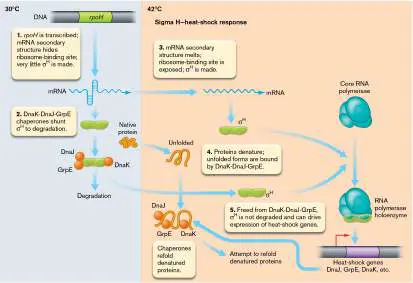
off the chaperone trio and release sigma H to direct transcription of the heat-shock genes.
J. K. PAULOSE ET AL. 2016. PLOS ONE 11 :E0146643
The gene encoding sigma H is rpoH. At 30°C, rpoH mRNA adopts a secondary structure at the 5′ end that buries a ribosome-binding site, so rpoH mRNA is poorly translated. The 5′ region of rpoH mRNA is called the ROSE element for r epression o f heat-s hock gene e xpression. A sudden rise in temperature melts this secondary structure and exposes the ribosome-binding site, enabling translation to initiate more frequently. Thus, heat shock increases sigma H synthesis, which in turn increases transcription of the heat-shock genes whose products include chaperones and proteases. Proteolysis also controls sigma H accumulation. At 30°C, the rpoH mRNA is poorly translated, as previously described, but some sigma H protein is made. Inappropriate expression of heat-shock genes at 30°C is prevented by the DnaK-DnaJ-GrpE chaperone system, which interacts with sigma H and shuttles it to various proteases for digestion (Fig. 10.40). At 42°C, however, proteolysis of sigma H decreases, and sigma H is allowed to accumulate. Sigma H degradation decreases because at the higher temperature, the chaperones are engaged in refolding and rescuing the large number of heat-denatured proteins in the bacterial cell. This chaperone redeployment frees sigma H to transcribe the heat-shock genes, which include the chaperone genes dnaK, dnaJ, and grpE. These genes also have promoters that depend on other sigma factors to drive basal expression. Thus, as the temperature rises, the amount of sigma H is increased by two temperature-dependent mechanisms: One increases translation by exposing the ribosome-binding site (a so-called RNA thermometer), while the second redeploys the chaperones that direct its proteolysis.
Many other examples of RNA thermometers exist, some of which are involved in pathogenesis. Bacteria that infect mammals have RNA thermometers set to body temperature, 37°C—a set point that helps the microbe sense entry into the mammalian host. The Gram-positive bacillus Listeria monocytogenes, for instance, causes mild gastroenteritis or serious meningitis in humans. When the organism is ingested, it synthesizes a regulatory protein, PrfA, that activates transcription of a number of virulence genes. Like rpoH in E. coli, the 5′ end of prfA mRNA contains a ROSE element that prevents translation until the temperature rises—after ingestion.
DNA Rearrangements That Alter Gene Expression
Most regulatory mechanisms that alter gene expression use interactions between proteins and DNA, proteins and RNA, or RNA and RNA. These control mechanisms are easily reversible. A more drastic means of control, however, involves altering the DNA sequence itself. A classic example of this strategy is phase variation. Phase variation helps microbial pathogens avoid the immune system.
Any infection of a host will trigger the production of antibodies specific to the invading microbe’s component parts, such as pili, flagella, and lipopolysaccharides (discussed in Chapter 24). Antibodies that bind to these microbial surface structures are useful for clearing an infection. However, some microbes use gene regulation to periodically change their immunological appearance, like a chameleon changing its color, by changing the amino acid composition of a particular surface protein. This “shape-shifting” by the microbe, called phase variation, renders useless those antibodies specific for the old structure of the targeted bacterial component. The embattled immune system must start all over again making new antibodies, thus prolonging the course of infection. Two types of DNA rearrangement can be used to generate phase variations: gene inversions and slipped-strand mispairing.
Gene inversion: an on/off switch. Flagellar phase variation in the Gram-negative bacterium Salmonella enterica involves a DNA recombination event known as gene inversion that flips the orientation of a gene or DNA segment in the chromosome. S.
enterica has two genes, widely separated on the chromosome, that encode different forms of flagellin, the main structural protein from which flagella are made. A reversible DNA inversion turns off one gene while turning on the other. The invertible switch is a 993-bp DNA fragment (or cassette), called the H region. The H region is flanked by short (26-bp) inverted repeats called hixL (left) and hixR (right). These inverted repeats are where the inversion occurs.
Note: A direct repeat is a sequence found in identical form at two
sites on the same double helix (for example, 5′- ATCGATCG nnnnnnATCGATCG-3′). A tandem repeat is a direct repeat without any intervening DNA sequence (for example, ATCG ATCGATCGATCGATCGATCG). Like a direct repeat, an inverted repeat is a sequence found in identical forms at two sites on the same double helix; however, the sequences are inverted relative to one another (for example, 5′- ATCGATCG nnnnnnCGATCGAT-3′).
The H region contains the hin gene, controlled by the P hin promoter. The hin product Hin recombinase mediates the inversion ( Fig. 10.41). In antigenic terms, “H antigen” refers to flagella, so the acronym “Hin” stands for H in version. The final important component of the H region is the P fljB promoter, found at the 3′ end of the region.
FIGURE 10.41 ■ Phase variation of flagellar proteins in Salmonella enterica. An invertible region containing a promoter controls the expression of two unlinked flagellar protein genes. In one orientation (A) , the fljB promoter drives synthesis of H2 flagellin (fljB) and a repressor (FljA) of the H1 flagellin gene (fliC). Action by Hin recombinase causes the segment to invert (B, C) , thereby reorienting the promoter. Because the repressor FljA is no longer synthesized, the gene for H1 can be expressed (D) .
Hin recombinase collaborates with other less specific DNA remodeling proteins to link the 26-bp left (hixL) and right (hixR) ends of the invertible DNA element. The two ends, each bound to a Hin monomer, are brought together by Hin-Hin protein interactions. DNA within the cassette then forms a loop. Hin cuts within the center of each hix site, producing staggered ends. An exchange of
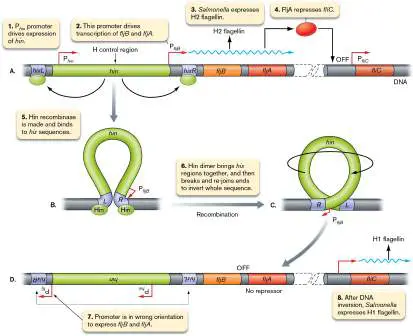
Hin subunits leads to strand inversion, so that the orientation of the DNA cassette is reversed relative to the flanking DNA on either side. In one orientation, the P fljB promoter of the H region directs expression of H2 flagellin (encoded by fljB) and a repressor (FljA) that prevents transcription of the other flagellin gene, fliC (Fig. 10.41A). After the inversion, however, the P fljB promoter points in the wrong direction, so there is no production of H2 flagellin or FljA, the repressor of fliC (Fig. 10.41D ). Once the existing repressor proteins degrade or become diluted during cell replication, the fliC flagellin gene can be expressed. Thus, H1 flagellin (present in phase 1 cells) is synthesized instead of H2 flagellin (present in phase 2 cells). The amino acid sequences, and thus the antigenicity, of the two flagellar proteins are different. Inversion of the H region enables Salmonella to change how it appears to a host immune system. In each generation, the rate of the reversible switch varies from about one cell in 10 3 to one in 10 5. Flagellar switching is especially important for the late stage of infection by Salmonella, once it has passed through the intestine and reaches the blood and spleen (see Chapter 25).
Thought Question
10.15 While viewing Figure 10.41, imagine the phenotype of a cell in which fljA has been deleted but fljB is still expressed. Would cells be motile? What type of flagella would be produced? Would the cells undergo phase variation? What would happen if fliC alone were deleted?
Slipped-strand mispairing. A different type of phase variation relies on multiple, short sequence repeats within a gene. The repeats “confuse” DNA polymerase as it replicates, causing it to slip occasionally during replication. Slippage either adds a repeat to the gene or deletes a repeat from it and alters the gene’s translational reading frame. If the mRNA produced during transcription is out of frame, the protein is not made. This random process can alternately turn a gene off and then back on again in subsequent generations. Like gene inversion in Salmonella, slipped-strand mispairing can contribute to virulence in pathogenic microbes. Neisseria gonorrhoeae, the causative agent of gonorrhea, uses slipped-strand mispairing to vary the types of outer membrane proteins expressed and exposed to the immune system. Eukaryotic microbes, especially pathogenic sporozoa, possess elaborate phase variation mechanisms. The trypanosome that causes “sleeping sickness” undergoes extensive genetic shuffling and mutation of its coat proteins over successive generations, essentially overwhelming the host immune system by presenting every possible form of antigen.
To Summarize
Circadian clocks provide oscillations in gene expression that anticipate recurring changes in environment, such as the daily light-dark cycle on Earth.
RNA thermometers are secondary structures at the 5′ end of specific mRNA molecules that can obscure access to ribosome-binding sites or transcriptional terminator stems. Cold conditions that stabilize the secondary structures will block translation of an mRNA.
Gene rearrangement controls include invertible promoter switches or repetitive DNA sequences within a coding region that cause DNA polymerase to “slip” during DNA synthesis.
Glossary
circadian clock From the Latin circa (“about”) and dies (“day”). A regulatory machine akin to a clock that controls cellular activity as a function of time of day.
phase variation A gene regulatory mechanism that reversibly changes the DNA sequence within or near the gene. One mechanism involves site-specific recombination that flips a DNA sequence in a chromosome.
direct repeat A DNA sequence that is found close to another sequence with the identical form and that is aligned in the same direction (e.g., 5′-ATCGATCGnnnnnnATCGATCG-3′).
tandem repeat A stretch of directly repeating DNA sequence (direct repeats) without any intervening DNA.
inverted repeat A DNA sequence that is found in an identical but inverted form at two sites on the same double helix (e.g., 5′- ATCGATCGnnnnnnCGATCGAT-3′).
Fig. 8.33 FIGURE 8.33 ■ E. coli protein folding-versus-degradation triage pathways. The diagram depicts what can happen to a newly synthesized protein. However, a protein that unfolds in response to environmental stress (for example, heat) will undergo the same triage process.
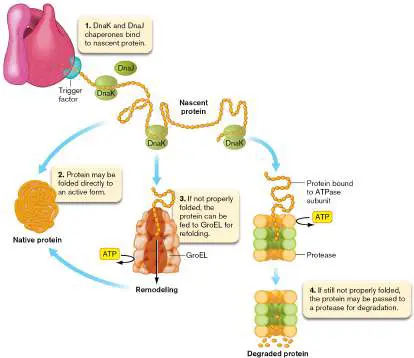
eResearch Activity 10
How Do Colonizing Symbiotic Bacteria Tell Their Hosts to Shut the Door Behind Them?
As discussed in Section 10.4 of the printed book, the squid Euprymna scolopes relies on the light production of symbiotic bacteria, Vibrio (Aliivibrio) fischeri, to avoid predation during nocturnal feeding. V. fischeri cells produce light within the crypts of a special light organ of the squid. This light production is under quorum-sensing control and occurs only when the cells achieve high cell density. Cells achieve high density by growth within the light organ crypt, but what keeps them in place, and what keeps other microbes from joining them and possibly interfering with light production? Tara Essock-Burns, Margaret McFall-Ngai, Edward Ruby, and colleagues at the University of Hawaii discovered that V. fischeri works with its squid host to shut the door behind them.
Colonizing cells of V. fischeri enter the crypt from the marine environment via a migration path consisting of a surface pore, duct, antechamber, and bottleneck (Fig. ERA 10.1 ). After entry, the bottleneck constricts to a diameter of only a few micrometers (Fig. ERA 10.1C ). This constriction limits additional cells from entering the crypt while also helping to keep the V. fischeri cells within the crypt. This latter ability could be observed when the squid was treated with a chemical that relaxed the bottleneck constriction. The bottleneck requires the polymerization of actin in the squid cells. Cytochalasin D (CD) inhibits the actin polymers, and CD-treated squid showed a much larger bottleneck diameter compared to that in a negative control treated only with the solvent (dimethyl sulfoxide; DMSO) used to dissolve the CD (Fig. ERA 10.1C ). In the CD-treated squid, an increase in bottleneck diameter caused a drop in V. fischeri abundance within the crypt and a concomitant increase in abundance in the migration path, showing that they “leaked” out of the crypt if bottleneck constriction was prevented ( Fig. ERA 10.2 ).
FIGURE ERA 10.1 ■ Constriction of the bottleneck of the squid light organ by Vibrio fischeri. A. Euprymna scolopes hatchling, with left half of the light-emitting organ enclosed by the yellow hatched box. B. Schematic of the migration path
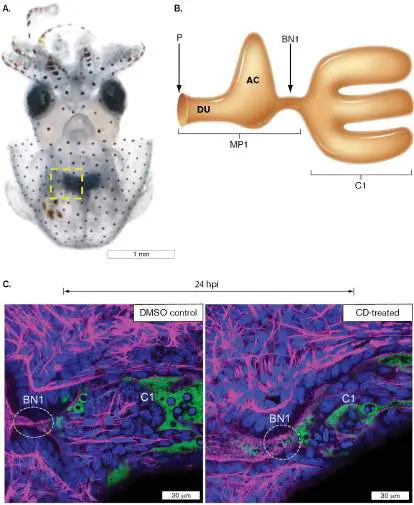
(MP1)—consisting of the surface pore (P), duct (DU), antechamber (AC), and bottleneck (BN1)—that connects the seawater environment to the major crypt (C1) of the light organ. C. In the presence of Vibrio fischeri (green, GFP-tagged) within the crypt, the bottleneck was constricted (left, DMSO solvent control) at 24 hours post-inoculation (hpi), but this constriction was relieved when treated with cytochalasin D (right, CD), an actin polymerization inhibitor.
T. ESSOCK-BURNS ET AL. 2021. MBIO 12 :E02402–21.
T. ESSOCK-BURNS ET AL. 2021. MBIO 12 :E02402–21.
FIGURE ERA 10.2 ■ Abundance of wild-type (WT) Vibrio fischeri (GFP-tagged) within the C1 crypt or MP1 migration path in relation to bottleneck BN1 diameter.
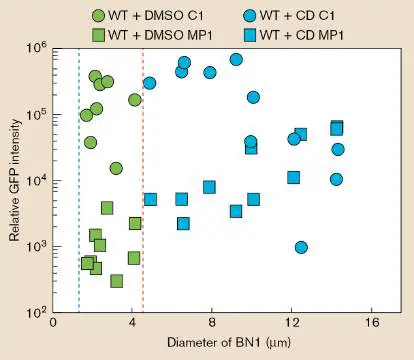
Squid were treated with either cytochalasin D (CD) or just the solvent used to dissolve the CD (DMSO).
The researchers noted that bottleneck constriction happened about the same time that the V. fischeri cells began to glow in the crypt. They hypothesized that the regulator of luminescence, the quorum-sensing system, might also be signaling the host to constrict the bottleneck. They tested this hypothesis with a series of mutants defective in quorum sensing. Recall from Section 10.4 in the printed book that the LuxR protein activates transcription of the light-producing lux operon when bound to the autoinducer 3O-C6, which is produced by the luxI gene (Fig. ERA 10.3A ).
FIGURE ERA 10.3 ■ Quorum sensing contributes to bottleneck constriction. A. Schematic for the activation of the lux operon by the product of LuxI, 3O-C6. B. Bottleneck (BN1) diameter measured 48 hours post-inoculation with strains of
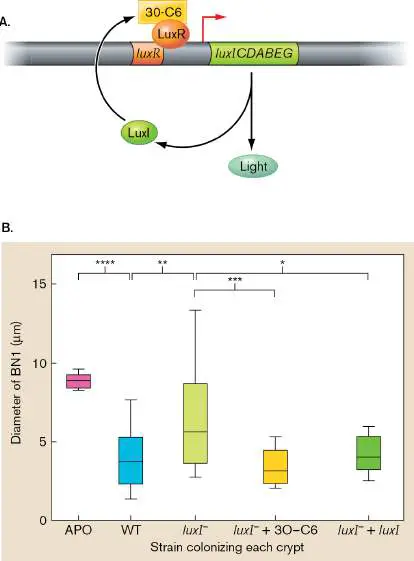
Vibrio fischeri. BN1 diameter was more constricted in squid inoculated with wild-type V. fischeri (WT) than in uninoculated control squid (Apo; aposymbiotic). Mutants lacking luxI had less constricted BN1 compared to wild type, unless provided with the 3O-C6 LuxI product or with a second, functional copy of the luxI gene. Asterisks above the brackets indicate that the results from the indicated treatment groups were significantly different. As a control group, wild-type V. fischeri cells were able to induce significant constriction of the bottleneck 48 hours post-inoculation relative to squid that were not colonized by the symbiont (aposymbiotic; Apo) (Fig. ERA 10.3B ). Mutants lacking the autoinducer synthase (luxI −) had significantly larger bottlenecks relative to the wild type at 48 hours. These results strongly implicated the lux system in inducing bottleneck constriction. While constructing mutants such as the luxI − mutant, secondary mutations sometimes occur spontaneously elsewhere in the genome, and on rare occasions, it is these unknown mutations that are responsible for the phenotype. To rule out this possibility, the researchers verified that the phenotype of the luxI − mutant was due to the absence of the product of the LuxI enzyme, 3O-C6. When purified 3O-C6 was added to the squid, bottleneck size returned to wild-type level in the luxI − mutants (Fig. ERA 10.3B ). Likewise, expressing a second, wild-type version of the luxI gene on a plasmid restored the bottleneck size to wild-type levels in the luxI − mutant. LuxR, when bound to the LuxI product 3O-C6, controls expression of 30 genes including those of the lux operon. Could the product of the lux operon, light, be triggering bottleneck constriction? Light generated by V. fischeri is known to affect gene expression of the light organ and of other tissues of the squid, so this hypothesis was worth testing. However, light did not appear to be an effector for bottleneck constriction. The researchers demonstrated this with a genetically engineered construct that expresses the lux operon independent of the LuxR quorum-sensing control. They knocked out the luxR and luxI genes, and they cloned the lux operon on a plasmid. This cloned lux operon was under control of a constitutive lac promoter (called lacZp-lux) and was always expressed. These mutant cells could generate light, but they could not stimulate bottleneck constriction at 24 hours post-inoculation, unlike the wild-type control (Fig. ERA 10.4 ). This meant another gene or genes under the control of LuxR must be directing the squid to constrict the bottleneck at the same time the LuxR is also directing the cell to make light. Just what is this mystery signal that V. fischeri cells produce once they reach a quorum that keeps them securely beyond the bottleneck? Future studies will tell.
FIGURE ERA 10.4 ■ Light production by Vibrio fischeri is not sufficient for bottleneck constriction. Bottleneck diameter 24-hours post-inoculation with Vibrio fischeri. Asterisks or “ns” above the brackets indicate whether the results from the indicated treatment groups were or were not significantly
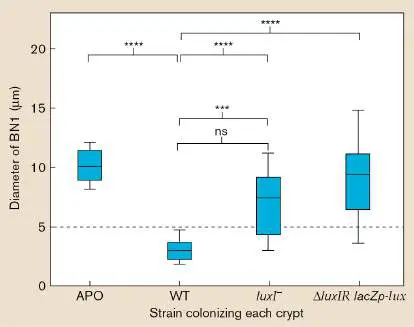
different, respectively. Results for Apo, WT, and luxI − are similar to those of FIGURE ERA 10.3B , but the Δ luxIR lacZp-lux result shows that light production alone was not sufficient to constrict the bottleneck: Something else controlled by LuxR is needed.
Further Exploration
Figure ERA 10.4 shows evidence that light production by Vibrio fischeri is not sufficient to induce bottleneck constriction of the host squid. Other factors are likely involved, but this result does not rule out a necessary (albeit insufficient) contribution of light production to bottleneck constriction. Propose an experiment that could address whether light production is necessary for bottleneck constriction. Essock-Burns, T., B. D. Bennett, D. Arencibia, S. Moriano-Gutierrez, M. Medeiros, et al. 2021. Bacterial quorum-sensing regulation induces morphological change in a key host tissue during the Euprymna scolopes-Vibrio fischeri symbiosis. mBio 12 :e02402-21.
CHAPTER REVIEW
Review Questions
1. List regulatory mechanisms discussed in this chapter that work at each of the following levels: DNA, transcription, translation, and posttranslation.
2. Describe a two-component signal transduction system. 3. How does lactose induce the lacZYA operon?
4. If lacY is induced only when lactose is present, how does external lactose induce the system?
5. How does tryptophan repress the tryptophan operon? 6. Discuss how glucose affects the utilization of lactose as a carbon source.
7. Name a regulatory protein that can activate and repress an operon’s expression. How does it do that?
8. Describe four ways that sigma factor production/activity can be regulated.
9. What is the regulatory mechanism that uses translation to control transcription? How does it work?
10. Compare the regulation mechanisms of transcriptional attenuators versus riboswitches.
11. Discuss how small regulatory RNA molecules can regulate gene expression by affecting translation or mRNA decay. 12. What are cAMP, ppGpp, and cyclic di-GMP, and how are they related in structure and function?
13. What is quorum sensing?
14. Describe how Synechococcus regulates its gene expression as a function of time of day.
15. Describe how phase variation can contribute to the virulence of pathogenic microbes.
Thought Questions
1. What would happen to the expression of the tryptophan operon if you replaced the key tryptophan codons in the attenuator region with tyrosine codons?
2. Adding tryptophan to E. coli will cause repression of the trp operon genes. Mutations in the trpR repressor gene and the trp operator will have the same phenotype; that is, adding tryptophan will no longer repress expression of the trp genes. What will happen to the phenotype if you transform each mutant with a plasmid carrying the wild-type trpR gene or the wild-type trp operator region? 3. When the cyanobacteria arose 3.5 billion years ago, Earth spun much faster, with a period of 6 hours! The moon’s gravitational force has progressively slowed Earth’s rotation and lengthened its day from 6 hours to the current 24 hours. Assuming the circadian clock is as old as the cyanobacterial lineage, what do you think all this implies about the ability of complex machines such as clocks to evolve over billions of years?
4. Phase variation occurs at low rates, such as one cell in 10 3 to one in 10 5 for flagellar switching in Salmonella. Why might a higher frequency of genetic switching be disadvantageous to the microbe, especially if it is a pathogen?
5. This chapter has outlined the many ways that bacteria sense their environment, their neighbors, and their location (rock, intestine, ocean). Can we then say that bacteria are conscious?
Key Terms
activator (371)
alternative sigma factor (382) anti-anti-sigma factor (384) anti-attenuator stem loop (386) anti-sigma factor (383)
attenuator stem loop (386) autoinducer (394)
autoinduction (394)
catabolite repression (377) circadian clock (401)
cis -antisense RNA (asRNA) (390) competent (399)
corepressor (372)
derepression (372)
diauxic growth (377)
direct repeat (406)
domain (371)
inducer (371)
inducer exclusion (377)
induction (372)
inverted repeat (406)
operator (371)
phase variation (406)
quorum sensing (394)
regulatory protein (370)
regulon (382)
repression (371)
repressor (371)
response regulator (373)
riboswitch (386)
second messenger (392)
sensor kinase (373)
small RNA (sRNA) (388)
stringent response (392)
tandem repeat (406)
transcriptional attenuation (385) transcriptome (382)
translational control (392) two-component signal transduction system (373)
Recommended Reading
Babski, Julia, Lisa-Katharina Maier, Ruth Heyer, Katharina Jaschinski, Daniela Prasse, et al. 2014. Small regulatory RNAs in Archaea. RNA Biology 11 :484–493.
Battesti, Aurelia, Nadim Majdalani, and Susan Gottesman. 2011. The RpoS-mediated general stress response in Escherichia coli. Annual Review of Microbiology 65 :189–213.
Fozo, Elizabeth M., Matthew R. Hemm, and Gisela Storz. 2008. Small toxic proteins and the antisense RNAs that repress them. Microbiology and Molecular Biology Reviews 72 :579–589. Helmann, John D. 2019. Where to begin? Sigma factors and the selectivity of transcription initiation in bacteria. Molecular Microbiology 112 :335–347.
Irving, Sophie E., Naznin R. Choudhury, and Rebecca M. Corrigan. 2021. The stringent response and physiological roles of (pp)pGpp in bacteria. Nature Reviews. Microbiology 19 :256– 271.
Iyer, Shankar Chandrashekar, Delia Casas-Pastor, David Kraus, Petra Mann, Kathrin Schirner, et al. 2020.
Transcriptional regulation by σ factor phosphorylation in bacteria. Nature Microbiology 5 :395–406.
Johnson, Carl H., Chi Zhao, Yao Xu, and Tetsuya Mori. 2017. Timing the day: What makes bacterial clocks tick? Nature Reviews. Microbiology 15 :232–242.
Jones, Christopher W., and Judith P. Armitage. 2015.
Positioning of bacterial chemoreceptors. Trends in Microbiology 23 :247–256.
Lewis, Mitchell. 2005. The lac repressor. Critical Reviews in Biology 328 :521–548.
Lyon, Patricia. 2015. The cognitive cell: Bacterial behavior reconsidered. Frontiers in Microbiology 6 :264.
Mellin, J. R., and Pascale Cossart. 2015. Unexpected versatility in bacterial riboswitches. Trends in Genetics 31 :150–156. Merino, Enrique, and Charles Yanofsky. 2005. Transcription attenuation: A highly conserved regulatory strategy used by bacteria. Trends in Genetics 21 :260–264.
Nealson, Kenneth H. 2020. On the 50th anniversary of the discovery of autoinduction and the ensuing birth of quorum sensing. Environmental Microbiology 22 :801–807.
Papenfort, Kai, and Bonnie L. Bassler. 2016. Quorum sensing signal-response systems in Gram-negative bacteria. Nature Reviews. Microbiology 14 :576–588.
Papenfort, Kai, and Carin K. Vanderpool. 2015. Target activation by regulatory RNAs in bacteria. FEMS Microbiology Reviews 39 :362–378.
Parker, Christopher T., and Vanessa Sperandio. 2009. Cell-to-cell signaling during pathogenesis. Cellular Microbiology 11:363–369.
Schleif, Robert. 2010. AraC protein, regulation of the L -arabinose operon in Escherichia coli, and the light switch mechanism of AraC action. FEMS Microbiology Reviews 34 :779–796.
Sesto, Nina, Omri Wurtzel, Cristel Archambaud, Rotem Sorek, and Pascale Cossart. 2013. The excludon: A new concept in bacterial antisense RNA-mediated gene regulation. Nature Reviews. Microbiology 11 :75–82.
Staron, Anna, and Thorsten Mascher. 2010. Extracytoplasmic function sigma factors come of age. Microbe 5 :164–170. Tseng, Roger, Nicolette F. Goularte, Archana Chavan, Jansen Luu, Susan E. Cohen, et al. 2017. Structural basis of the day-night transition in a bacterial circadian clock. Science 355 :1174–1180.
Turnbough, Charles L. 2019. Regulation of bacterial gene expression by transcription attenuation. Microbiology and Molecular Biology Reviews 83 :e00019–19.
Vink, Cornelis, Gloria Rudenko, and H. Steven Seifert. 2012. Microbial antigenic variation mediated by homologous DNA recombination. FEMS Microbiology Reviews 36 :917–948.
Yang, Ji, Marija Tauschek, and Roy M. Robins-Browne. 2011. Control of bacterial virulence by AraC-like regulators that respond to chemical signals. Trends in Microbiology 19 :128– 135.
Glossary
regulatory protein A protein that can bind DNA and modulate transcription in response to a metabolite.
domain 1. In taxonomy, one of three major subdivisions of life: Archaea, Bacteria, and Eukarya. 2. In protein structure, a portion of a protein that possesses a defined function, such as binding DNA. 3. In membranes, a region of membrane consisting of certain types of phospholipids that are distinct from surrounding lipids.
repressor A regulatory protein that can bind to a specific DNA sequence and inhibit transcription of genes.
activator A regulatory protein that can bind to a specific DNA sequence and increase transcription of genes.
operator A region of DNA to which the repressor protein binds. Operators are usually located near promoters.
repression The down-regulation of gene transcription.
inducer A molecule that stimulates transcription of gene(s) by changing the DNA-binding properties of a regulatory protein. When an inducer binds a repressor protein, the repressor loses the ability to bind the operator and block transcription. When an inducer binds an activator protein, the activator gains the ability to bind the DNA and the RNA polymerase to stimulate transcription. induction Increased transcription of target genes because an inducer binds to a repressor and prevents repressor-operator binding. corepressor A small molecule that must bind to a repressor to allow the repressor to bind operator DNA.
derepression An increase in gene expression caused by the decrease in concentration of a corepressor.
two-component signal transduction system A message relay system composed of a sensor kinase protein and a response regulator protein that regulates gene expression in response to a signal (usually an extracellular signal).
sensor kinase A transmembrane protein that phosphorylates itself in response to an extracellular signal and transfers the phosphoryl group to a receiver protein.
response regulator A cytoplasmic protein that is phosphorylated by a sensor kinase and modulates gene transcription depending on its phosphorylation state.
catabolite repression The inhibition of transcription of an operon encoding catabolic proteins in the presence of a more favorable catabolite, such as glucose.
diauxic growth A biphasic cell growth curve caused by depletion of the favored carbon source and a metabolic switch to the second carbon source.
inducer exclusion The ability of glucose to cause metabolic changes that prevent the cellular uptake of less favorable carbon sources that could cause unnecessary induction.
regulon A group of genes and operons located at different positions in a genome that are coordinately regulated and share a common function.
alternative sigma factor A sigma factor, distinguished from the housekeeping sigma factor, sigma-70, that has a distinct promoter consensus sequence to which it binds. Genes under control of an alternative sigma factor typically protect the cell from environmental stresses, such as heat shock or starvation. transcriptome The set of transcribed genes in a cell at a given time. The “complete transcriptome” includes all the possible RNA transcription products from a given genome. The “expressed transcriptome” is the set of RNAs present during a given condition.
anti-sigma factor A protein that inhibits a specific sigma factor, preventing transcription initiation.
anti-anti-sigma factor A protein that inhibits an anti-sigma factor, allowing the target sigma factor to participate in initiating transcription. transcriptional attenuation A regulatory mechanism that terminates transcription in progress, before it even reaches the first gene.
anti-attenuator stem loop An mRNA secondary structure whose formation prevents assembly of a downstream transcriptional termination (attenuator) stem loop. The anti-attenuator stem loop structure permits transcription of the downstream structural genes. attenuator stem loop Also called terminator stem loop. An intramolecular mRNA structure consisting of a base-paired stem connected by a single-stranded loop. The stem loop structure causes transcription to terminate. Its formation requires efficient translation of a leader peptide sequence.
riboswitch A secondary structure (hairpin) within some mRNA transcripts that can interact with metabolites or antisense RNA molecules, change structure, and affect the production or translation of the mRNA.
small RNA (sRNA)
A non-protein-coding regulatory RNA molecule that modulates translation or mRNA stability.
cis -antisense RNA.
Noncoding RNA from transcription of a DNA sequence complementary to the template strand of a gene that encodes a protein. A cis -antisense RNA binds and regulates the coding transcript made from the template strand of the gene. These regulatory RNAs can stop transcription, promote transcript degradation, or prevent translation.
second messenger A regulatory molecule such as cAMP that is produced in response to a primary signal. Second messengers typically affect the expression of numerous genes.
stringent response A cellular response to idle ribosomes (often indicating low carbon and energy stores) that includes a decrease in rRNA and tRNA production.
translational control A regulatory mechanism that modulates protein production by influencing the translation of mRNA.
autoinduction A mode of gene regulation independent of outside intervention, involving the conditioning of the medium by the cells. Usually refers to quorum-sensing control mediated by secreted autoinducer molecules.
quorum sensing The ability of bacteria to sense the abundance of other bacteria via secreted chemical signals called autoinducers.
autoinducer A secreted molecule that induces quorum-sensing behavior in bacteria.
competent Able to take up DNA from the environment.
circadian clock From the Latin circa (“about”) and dies (“day”). A regulatory machine akin to a clock that controls cellular activity as a function of time of day.
phase variation A gene regulatory mechanism that reversibly changes the DNA sequence within or near the gene. One mechanism involves site-specific recombination that flips a DNA sequence in a chromosome.
direct repeat A DNA sequence that is found close to another sequence with the identical form and that is aligned in the same direction (e.g., 5′-ATCGATCGnnnnnnATCGATCG-3′).
tandem repeat A stretch of directly repeating DNA sequence (direct repeats) without any intervening DNA.
inverted repeat A DNA sequence that is found in an identical but inverted form at two sites on the same double helix (e.g., 5′- ATCGATCGnnnnnnCGATCGAT-3′).