Chapter introduction
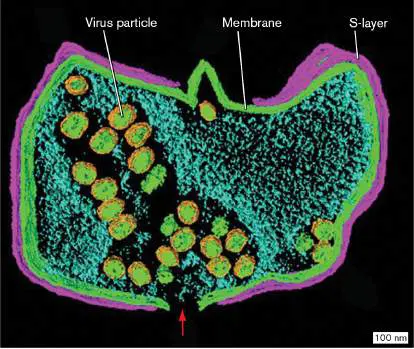
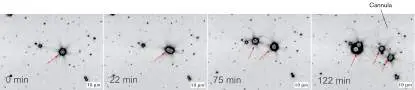
A Sulfolobus archaeon from an acid hot spring in Costa Rica is infected by a virus. At temperatures near boiling, the virus programs its assembly within the archaeal cell. A viral enzyme breaks through the cell membrane and S-layer, allowing exit of progeny (red arrow). Cryo-electron
In 1977, Carl Woese revealed the existence of a third kind of life: the Archaea, a domain of life forms very different from the plants, animals, and bacteria that had long been known. Archaea are found in all soil and water habitats, in symbiosis with animals and plants, and in extreme environments that exclude bacteria and eukaryotes. Archaea include hyperthermophiles inhabiting Earth’s hottest habitats, as well as Arctic and Antarctic psychrophiles. Other taxa grow in anaerobic soil and water, where they collaborate with bacteria in multispecies biofilms. Methanogens inhabit the digestive tracts of humans and other animals, where they interact with our immune system yet do not cause disease. Their methane production emphasize the unique structures and metabolic pathways of archaeal cells. While surveying their major taxonomic categories, we introduce research techniques used to study organisms in extreme environments and those with unique forms of metabolism.
Extremophiles have interesting applications in industry, such as the production of high-temperature enzymes, and even a fuel cell that
19.1 Archaeal Diversity at a Glancenot assigned
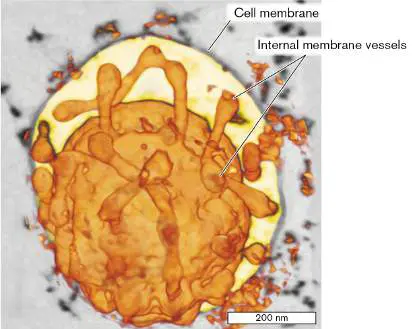
Archaea are known for including extremophiles such as Sulfolobus, which survives acid hot springs without even a cell wall—as do the viruses that infect it (see the chapter-opening image). Yet archaea also show surprising similarities to eukaryotes. Ignicoccus hospitalis is a spaghetti-tubed hyperthermophile whose form could be mistaken for a eukaryote (Fig. 19.1). This archaeon was isolated by the famed extremophile hunter Karl Stetter from a thermal vent off the coast of Iceland, 600 meters below sea level, where it grows best at 90°C. Microscopists Thomas Heimerl and Reinhard Rachel showed that I. hospitalis possesses an extensive endomembrane system within its cytoplasm. They used low-temperature processing and electron tomography on serial sections to map the extensive protrusions and tubules of the Ignicoccus endomembranes, which surprisingly resemble nuclear membranes with endoplasmic reticulum.
FIGURE 19.1 ■ Ignicoccus hospitalis, from a hydrothermal vent 600 meters below sea level, at Kolbeinsey Ridge volcano. Ignicoccus hospitalis has an extensive endomembrane system (orange) within an outer compartment contained by the cell membrane (yellow). Cryo-electron tomography, colorized.
COURTESY OF THOMAS HEIMERL
Other kinds of archaea proliferate throughout mesophilic soil and water and within the digestive tracts of humans and other animals. Even human skin microbiota include more than 4% archaea. Other archaea cooperatively colonize the surface of plant roots. Throughout these habitats, methanogens make a living off the H 2 and CO 2 from bacterial mixed-acid fermentation (see Chapter 13).
Do archaea more closely resemble bacteria or eukaryotes? Archaea share many metabolic traits with bacteria, such as multigene operons and the metabolic pathways of redox metabolism (discussed in Chapter 14). But archaea share with eukaryotes some core traits of DNA-RNA machinery and transcription factors. Key traits such as ether-linked membrane lipids are found mainly in archaea and in some bacteria via horizontal transfer from archaea ( Table 19.1).
Archaeal Traits Distinct
TABLE 19.1 from Bacteria and
Eukaryotes
Alternative traits of bacteria Archaea showing and/or Trait the trait eukaryotes Cell envelope Membrane lipids: All archaea Membrane isoprenoid sn - lipids: sn - glycerol 1 - glycerol 3 - phosphate ethers phosphate or diethers hydrocarbon diesters.
Eukaryotic membranes have ~20% Sources: O. Kandler and H. König. 1998. Cell. Mol. Life Sci. 54 :305–308; C. Bullock. 2000. Biochem. Mol. Biol. Ed. 28 :186–191. ether-linked lipids.
Membrane lipid Most archaea Chains stiffened chains stiffened by by saturation covalent cross-links or by pentacyclic rings S-layer of Crenarchaeota and Peptidoglycan glycoprotein Thaumarchaeota (bacteria); cellulose and other polysaccharid es (eukaryotes)
S-layer of protein, Methanogens and Peptidoglycan methanochondroiti Haloarchaea (bacteria); n, or sulfated cellulose and polysaccharide other polysaccharid es (eukaryotes)
Pseudopeptidoglycan Methanobacteriales, Peptidoglycan sacculus contains Methanopyrales (bacteria); talosaminuronic cellulose and acid; peptide other bridges contain polysaccharid only l-amino acids es (eukaryotes)
Metabolism Sources: O. Kandler and H. König. 1998. Cell. Mol. Life Sci. 54 :305–308; C. Bullock. 2000. Biochem. Mol. Biol. Ed. 28 :186–191. Nonphosphorylated All archaea EMP pathway of intermediates of glycolysis, sugar catabolism with and synthesis phosphorylati [Embden-on mediated Meyerhof-Parnas by NAD or (EMP) glycolysis in NADP [or some cases] Entner-Doudoroff (ED)
pathway] Methanogenesis Methanogens Anaerobic from H 2 and CO 2 metabolism; or from CO, such as methanol, methyl fermentation; sulfides, formate, no methane or acetate production Archaeal coenzymes: Most methanogens Flavin cofactors F 420 and mononucleoti F 430, and de, coenzyme coenzyme M A, others Retinal-associated Haloarchaea Chlorophyll-light-driven based membrane pumps photosynthesi for H + or Na + s (bacteria and eukaryotic chloroplasts)
Sources: O. Kandler and H. König. 1998. Cell. Mol. Life Sci. 54 :305–308; C. Bullock. 2000. Biochem. Mol. Biol. Ed. 28 :186–191. Nucleic acid structure and function Positive superturns Hyperthermophilic Negative generated by archaea superturns reverse gyrase, generated by which protect DNA gyrase from extreme acid Unique base Most archaea tRNA bases, structures in tRNA, such as such as the queuosine, guanine analog found only in archaeosine bacteria and eukaryotes Sources: O. Kandler and H. König. 1998. Cell. Mol. Life Sci. 54 :305–308; C. Bullock. 2000. Biochem. Mol. Biol. Ed. 28 :186–191.
Ether-Linked Isoprenoid Membranes
The most distinctive structure of archaea is their ether-linked phospholipids with methyl branches.
The ether linkage resists hydrolysis, compared to the mostly ester-linked lipids of bacteria and eukaryotes. In other words, it takes more energy to break the bonds in ether-linked membranes. Another major difference is that the ether linkages of archaea attach hydrocarbon chains to sn -glycerol 1 -phosphate, whereas bacterial and eukaryotic lipid chains are attached to sn -glycerol 3 -phosphate (the mirror image or enantiomer of sn -glycerol 1 -phosphate). Thus, archaeal membrane lipids differ from most of those found in bacteria and eukaryotes, with the exception of a few thermophilic bacteria that obtained ether lipids horizontally from archaea in their shared high-temperature environment. Most features of archaeal lipids increase lipid stability in extreme environments such as high temperature or extreme acidity. Nevertheless, these ether lipids are also widespread in mesophilic archaea that grow at moderate temperatures.
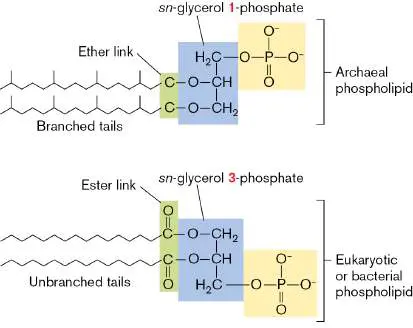
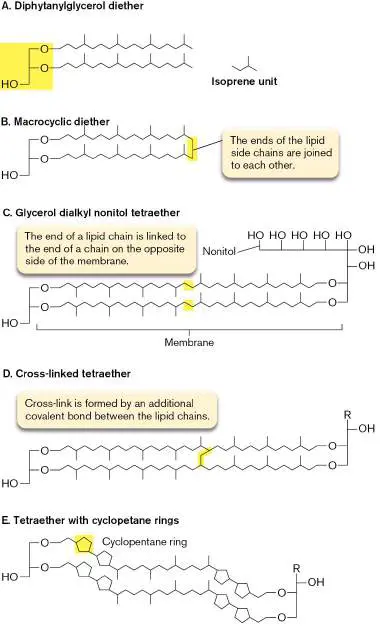
Overall, the distinctive features of archaeal ether lipids include: sn -glycerol 1-phosphate. Archaeal membrane lipids incorporate sn -glycerol 1 -phosphate (Fig. 19.2A), rather than the mirror-symmetrical form sn -glycerol 3 -phosphate, which is used by bacteria and eukaryotes. The two chiral forms show similar thermal stability, but their biochemistry requires different enzymes, and thus they represent a deep divergence in ancestry. In some archaea the glycerol is extended by six carbons, forming nonitol (nine OH groups).
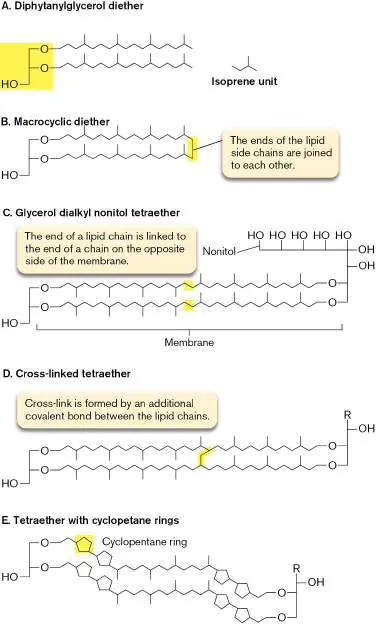
FIGURE 19.2 ■ Branched-chain ether lipids are characteristic of archaeal membranes.
Source: Modified from R. M. Daniel and D. A. Cowan. 2000. Cell. Mol. Life Sci. 57 :250–264.
Isoprenoid chains. The side chains of archaeal lipids are branched at every fourth carbon. The methyl branches arise by condensation (C–C bond formation) of units of isoprene (Fig. 19.2A). Condensed isoprene chains are called isoprenoid or diphytanyl chains; thus, the overall lipid is diphytanylglycerol diether. Isoprenoid branched chains increase membrane stability by hooking each other in place.
Cross-linked lipids. In some hyperthermophiles, the ends of side chains are linked covalently, either to each other (Fig. 19.2B ) or to a lipid on the opposite side of the membrane ( Fig. 19.2C ). Two pairs of lipid chains cross-linked across the membrane form a tetraether, so called because the complex contains four ether links in all. In some cases, an additional covalent bond links the two linked pairs of side chains across the middle (Fig. 19.2D ).
Cyclopentane rings. In some archaea, the lipid’s methyl branches cyclize, forming cyclopentane rings (Fig. 19.2E ). Cyclopentane rings strengthen membranes at high temperature. Most archaea possess a single cell membrane, without any outer membrane such as that of Gram-negative bacteria (shown in Chapter 3). Many possess no cell wall at all, only an S-layer of proteins plugged into the tetraether membrane (discussed in Section 19.2). Some archaea, such as methanogens and haloarchaea, do have a cell wall, but the structure differs fundamentally from the bacterial peptidoglycan (see Sections 19.4 and 19.5).
Similarly, many archaea possess filamentous protein structures for attachment and motility that are analogous to bacterial pili and flagella. Despite functional similarity, the archaeal protein structures are very different from those of bacteria. Archaeal flagella are called archaella (singular, archaellum ). Archaella have rotary motors, but they evolved independently from bacterial flagella, showing greater similarity to type IV pili.
Archaeal Gene Structure and Regulation
How do archaeal genomes compare with those of bacteria and eukaryotes? The genomes of archaea generally resemble those of bacteria in size and gene density, and genes of related function are arranged in operons, like those of bacteria. The genes encoding most archaeal proteins contain uninterrupted coding sequences, as in bacteria, but certain transfer RNA (tRNA) gene sequences are interrupted by introns (nontranslated sequences), similar to the tRNA introns found in eukaryotes.
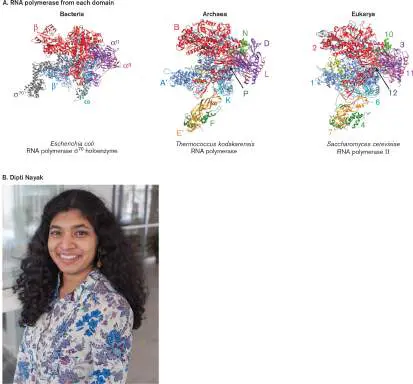
The archaeal apparatus for DNA and RNA polymerases, transcription factors, and protein synthesis show remarkable similarity to those of eukaryotes. Figure 19.3Acompares the components of an archaeal RNA polymerase (from Thermococcus) with those of a bacterium (Escherichia coli) and those of a eukaryote (Saccharomyces cerevisiae). Evidence for these models has come from many researchers, including Katie Shalvarjian and Dipti Nayak at UC Berkeley. The archaeal polymerase possesses two transcription factors (regulatory protein components) that are found in eukaryotes: TATA-binding protein (TBP, a subunit of transcription factor II D, TFIID) and transcription factor II B (TFIIB, which in archaea is designated TFB). By contrast, bacteria have no homologs of these factors. A consequence of the eukaryotic-like transcription and translation in archaea is that archaea are resistant to antibacterial antibiotics that target transcription and translation. FIGURE 19.3 ■ Genetic enzyme complexes of Archaea resemble those of Eukarya. A. Structural overview of RNA polymerase (RNAP) derived from a bacterium (Escherichia coli, PDB ID: 4YG2); an archaeon (Thermococcus kodakarensis, PDB ID: 4QIW); and a eukaryote (polymerase II from Saccharomyces cerevisiae, PDB ID: 1WCM). Color indicates orthologous subunits of RNAP shared by the different organisms. B. Dipti Nayak leads research on the molecular biology of archaea at UC Berkeley.
K. E. SHALVARJIAN ET AL. 2021. CURR OPIN MICROBIOL. 60 :8–15
DIPTI NAYAK
Another eukaryotic structure for which archaeal homologs were discovered is that of histones, the fundamental packaging proteins
of DNA. The histone complex found in eukaryotic chromosomes contains a histone (H3 + H4) 2 tetramer flanked by two histone (H2A + H2B) dimers. The archaeal chromosome complex consists solely of (H3 + H4) 2 homologs. Histone homologs pack the DNA for many kinds of archaea, including Sulfolobus, Thermococcus, and methanogens.
A unique feature of archaeal DNA function is the reverse gyrase enzyme. Reverse gyrase adds superturns to overwind the DNA helix. By contrast, all bacteria and eukaryotes, as well as mesophilic archaea, have gyrase to form negative superturns that maintain their DNA in an “underwound” supercoiled state (presented in Chapter 7). But hyperthermophilic archaea with reverse gyrase maintain positive supercoiling to stabilize their DNA. Figure 19.4 shows a model for the reverse gyrase mechanism and includes data from Taisaku Ogawa and colleagues at Waseda and Nagoya Universities, Japan. The enzyme catalyzes DNA strand breakage and then passes the complementary strand through the gap, adding a helical turn. To finalize the added turn, the broken strand is ligated. FIGURE 19.4 ■ Reverse gyrase overwinds DNA. A. The reverse gyrase catalyzes DNA strand breakage, then passes the complementary strand through the gap, adding a helical turn. The broken strand is ligated. Overall the reaction consumes one molecule of ATP. B. Catalysis of turn addition at 71°C. Adding helical turns increases torsional stress and slows the rate of catalysis. N = newtons.
Source: Taisaku Ogawa et al. 2016. FEBS J. 283 :1372.
Adding a twist that overwinds DNA causes torsional stress and therefore requires energy provided by ATP hydrolysis. The positive
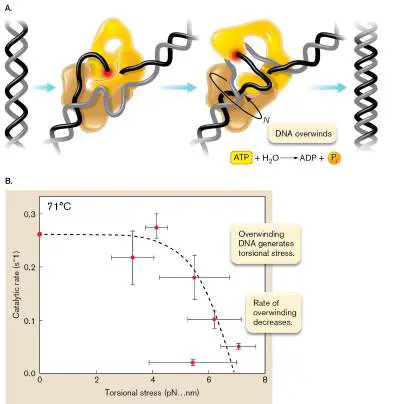
superturns decrease melting of DNA and thus prevent the helix from coming apart at high temperature. Reverse gyrase originated in Archaea, though it was transferred horizontally to some bacterial hyperthermophiles such as Thermotoga (discussed in Chapter 18). Another unique feature of archaeal genetics is their modified bases in tRNA. In particular, the guanosine analog archaeosine (7-formamidino-7-deazaguanosine) occurs in tRNA of nearly all archaea, but not in tRNA of any bacteria or eukaryotes. Other unusual tRNA bases, such as queuosine, are found only in bacteria and eukaryotes, not in archaea.
Phylogeny of Archaea
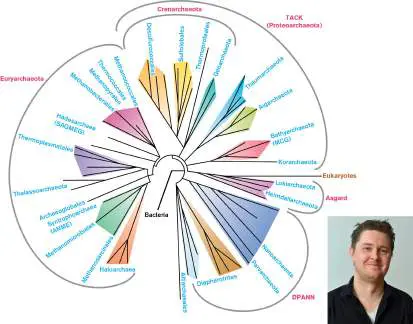
What are the major kinds of Archaea? The answer to this question keeps changing, as DNA sequencing of uncultured organisms reveals a growing number of previously unknown phyla (Fig. 19.5). Two major advances in genomic analysis have enabled this remarkable pace of discovery, as described by Thijs Ettema (Uppsala University, Sweden) and colleagues.
FIGURE 19.5 ■ Archaeal phylogeny. Major superphyla, phyla, and orders of Archaea. Divergence is based approximately on small-subunit ribosomal RNA (SSU rRNA) and genome sequences. (See Table 19.2 for abbreviations.) Inset: Thijs Ettema.
COURTESY OF THIJS ETTEMA
The first major advance in phylogenetics was the assembly of metagenomes (the genome sequences of a microbial community) from mixed environmental samples (discussed in Chapter 21). Metagenomes enable construction of “genomic bins” that approximate the genomes of uncultured organisms. These genomic bins enable comparison of entire small-subunit ribosomal RNA (SSU rRNA) genes and ribosomal operons encoding ribosomal proteins and transfer RNAs, as pioneered by Jillian Banfield’s lab at UC Berkeley. Ribosomal protein operons and other well-conserved
marker genes expand the volume of data available from SSU rRNA comparison, improving the resolution of taxonomic distances. The second advance was the sequencing of single-cell genomes, most prominently developed at the Bigelow lab in Maine and by Tanja Woyke at the Joint Genome Institute of the U.S. Department of Energy. When a sequence is obtained from a single cell, it may be more fragmented than a genomic bin (Chapter 21), but we know that the entire sequence comes from one individual, not an artifactual hybrid. Thus, for example, we can see when an organism possesses multiple metabolic capabilities, such as the ability of some marine archaea to combine autotrophic and heterotrophic lifestyles.
Major archaeal taxa are outlined in Table 19.2. As of this writing, the clades labeled in blue in Figure 19.5are the most commonly studied.
TABLE 19.2 Archaeal Diversity a TACK (Thaumarchaeota, Aigarchaeota, Crenarchaeota, Korarchaeota).
Aigarchaeota. Aerobic hyperthermophilic filaments in hot springs.
Bathyarchaeota (formerly Miscellaneous Crenarchaeote Group; MCG). Widely divergent autotroph-heterotrophs in diverse soil and water.
Korarchaeota. Anaerobic hyperthermophiles in Yellowstone hot springs and in deep-sea thermal vents.
Thaumarchaeota. Tetraether membranes include crenarchaeol. Marine and soil archaea that oxidize NH 3 with O 2. Important marine sources of nitrates for phytoplankton, and of methylphosphonate (CH −PO 2−),
3 3
which bacteria convert to methane.
Cenarchaeales. Sponge symbionts; grow at 10°C.
Cenarchaeum symbiosum.
Nitrosopumilales. Ammonia-oxidizing archaea (AOA), marine and soil. Nitrosopumilus maritimus, Nitrososphaera gargensis.
Psychrophilic marine thaumarchaeotes (uncharacterized). Marine water, deep sea, and Antarctica. Anaerobic heterotrophs, sulfate reducers, nitrite-reducing methanotrophs.
Thermoproteota. Most have tetraether membranes surrounded by S-layer. Includes thermophiles in hot springs and marine vents; also marine mesophiles and psychrophiles. Crenarchaeota is an alternative name encompassing Desulfurococcales, Sulfolobales, Thermoproteales, Geoarchaeota.
Caldisphaerales. Thermoacidophilic heterotrophs that grow in hot springs. Caldisphaera spp.
Desulfurococcales. Anaerobic sulfur reduction with organic electron donors. Irregularly shaped cells with glycoprotein S-layer; no cell wall (Aeropyrum pernix, Desulfurococcus fermentans). Ignicoccus islandicus.
Pyrodictium abyssi, Pyrodictium occultum, Pyrolobus fumarii grow at marine thermal vents, up to 110°C.
Geoarchaeota. Acidic thermal mats.
Sulfolobales. Aerobic acidophiles; moderate thermophiles. Oxidize H 2 S to H 2 SO 4. Sulfolobus, Sulfurisphaera, Acidianus.
Thermoproteales. Pyrobaculum, Thermoproteus, Vulcanisaeta.
Euryarchaeota. Metabolism includes methanogenesis, halophilic photoheterotrophy, and sulfur and hydrogen oxidation; acidophiles and alkaliphiles. Methanogens and halophiles have rigid cell walls.
Anaerobic Methane-Oxidizing Euryarchaeota (ANME).
Found in anoxic marine sediments. Oxidize methane from methanogens, in syntrophy with sulfate-reducing bacteria. Archaeoglobales. Hyperthermophiles; sulfate oxidation of H 2 or organic hydrogen donors; reverse methanogenesis. Archaeoglobus fulgidus.
Hadesarchaea. Formerly South African Gold Mine Miscellaneous Euryarchaeotic Group (SAGMEG). Found in water from gold mines deep underground.
Haloarchaea. Halophiles; grow in brine (concentrated NaCl). Conduct photoheterotrophy by light-driven H + pump and Cl − pump. Haloarcula, Halobacterium, Haloferax grow in salterns and salt lakes. Haloquadra (Haloquadratum) are square-shaped. Halorubrum lacusprofundi is an Antarctic psychrophile. Natronococcus spp. are alkaliphiles in soda lakes.
Methanogens (many classes). Generate methane from CO 2 and H 2, formate, acetate, other small molecules; strict anaerobes. Pseudopeptidoglycan or sulfated chondroitin cell walls. Grow in anaerobic soil, water, or animal digestive tracts. Deep-sea psychrophiles generate methane hydrates. Methanobacteriales. Lack cytochromes; reduce CO 2, formate, or methanol with H 2 by electron bifurcation. Methanobrevibacter smithii and Methanosphaera stadtmanae inhabit human digestive tract.
Methanomicrobiales, Methanococcales, and Methanopyrales. Lack cytochromes; reduce CO 2, formate, or methanol with H 2 by electron bifurcation. Methanocaldococcus jannaschii, vent thermophile.
Methanosarcinales. Includes acetoclastic methanogens. Thermococcales. Hyperthermophiles (grow above 100°C)
and barophiles (up to 200 atm pressure). Anaerobes; reduce sulfur. Thermococcus, Pyrococcus abyssi, P. furiosus.
Thermoplasmata. Extreme acidophiles; oxidize sulfur from pyrite (FeS 2), generating sulfuric acid. Mesophiles or moderate thermophiles.
Thermoplasmatales. Ferroplasma acidiphilum and F.
acidarmanus grow at 37°C–50°C. Oxidize sulfur from FeS 2, generating ambient pH as low as pH 0. No cell wall. Thermoplasma acidophilum grows at 59°C and pH 2.
Asgard. Vent thermophiles named for Norse gods. Molecular features such as tubulin suggest shared ancestry with Eukarya.
Heimdallarchaeota. Formerly Ancient Archaeal Group (AAG).
Lokiarchaeota. Isolated from Loki’s Castle hydrothermal vent, off coast of Norway. Formerly called Deep Sea Archaeal Group (DSAG) or Marine Benthic Group B (MBGB). DPANN (Diapherotrites, Parvarchaeota, Aenigmarchaeota, Nanoarchaeota, Nanohaloarchaeota). Diminished genomes and metabolic capabilities suggest obligate symbionts.
Nanoarchaeota. Vent hyperthermophiles; obligate symbionts attached to Ignicoccus. Nanoarchaeum equitans.
Altiarchaeales. Form grappling-hook biofilms in cold sulfidic water. Altiarchaeum. The position of Altiarchaeales within DPANN is uncertain.
For several reasons, the phylogeny of Archaea is a challenge to define. Most archaea are uncultured and are known solely through metagenomic bins. Many of their genomes are highly “recombinogenic.” For example, two different samples of Ferroplasma acidarmanus show 99% identical SSU rRNA, yet their overall genomes differ by 22%, implying extensive horizontal gene exchange. And many archaeal genomes, particularly those of mesophiles, include large portions of DNA transferred from bacteria. Microbial ecologist Purificación López-García, at Paris-Sud University, proposes that hyperthermophilic archaeal species evolved into mesophiles by acquiring genes from bacteria. According to her model, the bacterial genes provided key metabolic pathways and cell structures optimized for growth at moderate or cold temperatures.
TACK Superphylum
The TACK superphylum is named for four taxa: T haumarchaeota (or Nitrososphaerota), A igarchaeota, C renarchaeota (or Thermoproteota), and K orarchaeota (Fig. 19.5and Table 19.2). TACK includes many taxa that grow at temperatures above 90°C. Most TACK hyperthermophiles were discovered at deep-sea marine hydrothermal vents or at hot springs such as those of Yellowstone National Park. Major clades (designated orders) include Desulfurococcales, sulfur-reducing anaerobes at marine hydrothermal vents; Sulfolobales, sulfide-oxidizing acidophiles at hot springs; Thermoproteales, vent thermophiles; and Geoarchaeota, found in acid iron mats.
Many TACK thermophiles metabolize sulfur, either by anaerobic reduction (such as by H 2 to form H 2 S) or by aerobic oxidation (by O 2 to form sulfuric acid). Anaerobic sulfur metabolizers include moderate thermophiles (growth range about 60°C–80°C) as well as hyperthermophiles (90°C–120°C). Many of the hyperthermophiles are also barophiles, growing under high pressure at hydrothermal vents on the ocean floor; an example is Pyrodictium abyssi. Besides thermophiles, the TACK clades include a substantial proportion of mesophilic soil, marine, and benthic (marine sediment) microbial communities. Many are found in the microbiomes of plants and animals. Understanding these organisms is important for assessing their contribution to the global carbon cycle. The Bathyarchaeota (formerly Miscellaneous Crenarchaeote Group; MCG) include vast populations throughout the open ocean. The Thaumarchaeota are ammonia-oxidizing archaea (AOA), which oxidize ammonia to nitrite. These ammonia oxidizers play a major role in the nitrogen cycle (discussed in Chapters 21 and 22). Other Thaumarchaeota include mesophilic heterotrophs and sulfur oxidizers in soil and water. Yet other TACK organisms are psychrophiles (growing at temperatures below 20°C) found in Antarctic lakes. Overall, the TACK superphylum spans the widest range of growth temperatures of any division of life.
Euryarchaeota: Methanogens, Halophiles, and Thermophiles
The superphylum Euryarchaeota also includes members throughout soil and water, and associated with plants and animals. The most highly divergent group of Euryarchaeota is methanogens, including several polyphyletic clades (clades not sharing a single common ancestor). Methanogens serve a key energetic role in ecosystems by offering an anaerobic mechanism for removing excess H 2 and other small-molecule reductants. But their metabolism releases methane —a potent greenhouse gas. The accelerating release of methane from Arctic tundra and from marine benthic sources has drastic consequences for our global climate (discussed in Section 19.4 and Chapter 22).
Another branch of euryarchaeotes is the Haloarchaea, extreme halophiles that are the only form of life to grow in concentrated brine (NaCl). Most Haloarchaea, such as Halobacterium species NRC-1, are photoheterotrophs that can supplement their metabolism with retinal-containing light-driven ion pumps, called bacteriorhodopsin. These ion pumps (for protons or for sodium ions) are the only known form of phototrophy in archaea (discussed in Chapter 14). Bacteriorhodopsins are found in Haloarchaea such as Halobacterium halobium; the species was named before it was known to be an archaeon (discussed in Section 19.5). It turns out that Haloarchaea have transferred genes encoding light-absorbing proton pumps into many marine bacteria. By contrast, the chlorophyll-based phototrophy found in bacteria and plants is completely unknown in archaea.
Note: In Table 19.2 , certain archaeal names contain a
“bacteria” component; for example, the genus Halobacterium. Such organisms were known and named as bacteria before 1977, when the category “archaea” was first defined.
Euryarchaeotes include extreme acidophiles, as well as extreme alkaliphiles—from Ferroplasma (Thermococcales), growing at pH 0, to Natronococcus, growing at pH 10. With respect to pH, the euryarchaeotes show the widest range of any taxonomic group. Unique metabolic pathways. Some archaea use distinctive metabolic pathways. TACK archaea catabolize glucose via several variants of the Entner-Doudoroff (ED) and Embden-Meyerhof-Parnas (EMP) pathways that rarely occur in bacteria (Fig. 19.6). For example, the sulfur thermophiles Sulfolobus and Thermoplasma convert glucose to gluconate without phosphorylation, ultimately generating pyruvate with no net production of ATP. (ATP is still produced by further breakdown of pyruvate.)
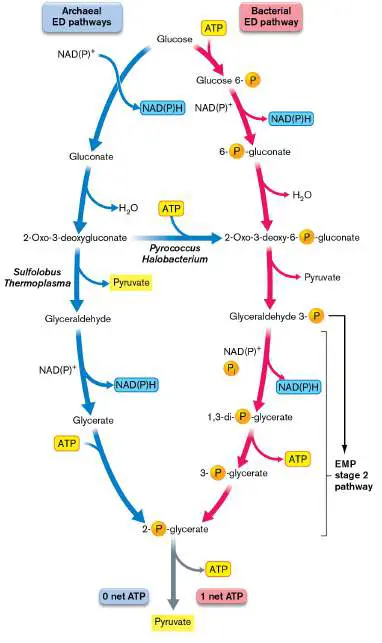
FIGURE 19.6 ■ Glucose catabolism in archaea. Left: Sulfolobus and Thermoplasma species catabolize glucose to pyruvate via a modified ED pathway without phosphorylating glucose and produce no net ATP. Right: Halobacterium species phosphorylate 2-oxo-3-deoxygluconate and produce one net ATP via the EMP stage 2 pathway. Pyrococcus furiosus oxidizes glyceraldehyde 3-phosphate using ferredoxin instead of NAD + and avoids phosphorylation.
Among the Euryarchaeota, halophilic archaea such as Halobacterium phosphorylate the dehydrated product of gluconate (2-oxo-3-deoxygluconate), which enters the “standard” ED pathway. The ED pathway generates one molecule of pyruvate and one molecule of 3-phosphoglycerate, which produces one net ATP through the second stage of the EMP pathway. This variant may be compared with different variants of the EMP pathway seen outside the TACK group, in the euryarchaeotic vent thermophile Pyrococcus furiosus. P. furiosus oxidizes glyceraldehyde 3-phosphate using ferredoxin instead of NAD + and avoids phosphorylation. The reduced ferredoxin is then used to reduce 2H + to H in an energy-
2
yielding reaction. Nevertheless, P. furiosus performs highly effective metabolism, and it can power a fuel cell that runs at near-boiling temperature (eResearch Activity 19).
Asgard, Eukaryotes, and DPANN
A fascinating clade of deep-sea archaea, the Lokiarchaeota, branch from a marine benthic microbial community. First identified at a thermal vent named Loki’s Castle, the Lokiarchaeota genomes share surprising traits with eukaryotes. Several related phyla have been described and given similar Norse mythological names, such as the Heimdallarchaeota (formerly Ancient Archaeal Group; AAG). These clades are collectively known as the Asgard superphylum. Eukaryotic-like genes found in Asgard archaea include those associated with an actin cytoskeleton and phagocytosis. These features, and phylogenetic trees, imply that the ancestor of all Eukarya—which includes protists, fungi, and plants and animals— branched relatively late from the Asgard line of Archaea. For further discussion, see Section 19.6.
Another vast superphylum revealed by metagenomics is DPANN (named for the phyla D iapherotrites, P arvarchaeota, A enigmarchaeota, N anoarchaeota, and N anohaloarchaeota). The genomes of these organisms all show evolutionary loss of many genes, typical of obligate symbionts. The most studied example is the Nanoarchaeota species Nanoarchaeum equitans, a cellular parasite of Ignicoccus hospitalis (see Section 19.6).
Meanwhile, sequencing of metagenomes and single-cell genomes continues to reveal new deeply branching phyla with unexpected traits. For example, the Altiarchaeales clade includes Altiarchaeum hamiconexum, a soil archaeon that forms networked biofilms connected by harpoon-like appendages. As of this writing, the taxonomic position of Altiarchaeales (within DPANN or outside) remains in dispute.
Thought Question
19.1 Suppose that two deeply diverging clades each show a wide range of growth temperature. What does this suggest about the evolution of thermophily or psychrophily?
To Summarize
Archaeal membranes are composed of sn -glycerol 1-phosphate diether or tetraether lipids having isoprenoid side chains that may include cross-links or pentacyclic rings. The membrane may be covered by a protein S-layer, but no cell wall. A few clades of Archaea possess a cell wall of pseudopeptidoglycan.
Glucose is catabolized by variants of the Entner-Doudoroff pathway. Other metabolic pathways found in archaea include methanogenesis and retinal-associated light-driven ion pumps such as bacteriorhodopsin.
Central gene functions of archaea resemble those of eukaryotes. These include the structure of DNA and RNA polymerases and of histone-like DNA-binding proteins. Reverse gyrase overwinds DNA. Reverse gyrase is unique to archaea and to a few bacteria that obtained it by horizontal gene transfer.
The TACK superphylum includes hyperthermophiles, sulfur reducers and oxidizers, and Thaumarchaeota ammonia oxidizers. TACK organisms grow across the widest range of temperatures.
Euryarchaeota include methanogens and halophiles. Methanogens reduce CO 2 and fermentation acids to methane, adding to climate change.
The deep-sea Asgard superphylum of hyperthermophiles may include the archaeal ancestor of all eukaryotes.
Metagenomics reveals uncultured organisms. We continue to discover deeply branching clades of archaea by sequencing metagenomes.
Glossary
isoprenoid A condensed isoprene chain, found in archaeal membrane lipids. tetraether A molecule containing four ether links. An example is found in archaeal membranes, when two lipid side chains form ether linkages with a pair of side chains from the other side of the bilayer.
archaellum pl. archaella A rotary complex for motility in archaea, analogous to the bacterial flagellum.
histone A protein that binds eukaryotic DNA and compacts chromosomes in nucleosomes.
reverse gyrase An enzyme that adds positive superturns to DNA in addition to the fundamental twist of the DNA helix. Found mainly in archaea, reverse gyrase differs from the gyrase of bacteria and eukaryotes, which adds negative superturns, against the twist. Desulfurococcales A phylum of thermophilic archaea in the TACK superphylum that metabolize sulfur and organic compounds.
Sulfolobales A phylum of thermophilic archaea in the TACK superphylum that includes sulfur oxidizers.
Thermoproteales A clade of the phylum Thermoproteota, thermophilic archaea including hyperthermoacidophiles, in the TACK superphylum. Geoarchaeota A clade of Thermoproteota, thermophilic archaea including mats at thermal vents, in the TACK superphylum.
Bathyarchaeota A phylum of thermophilic archaea in the TACK superphylum, widely distributed in anoxic soil, water, and marine sediments. Thaumarchaeota A phylum of archaea in the TACK superphylum that includes ammonia oxidizers and symbionts of marine invertebrates Euryarchaeota A major division of Archaea, containing methanogens, halophiles, acidophiles, and thermophiles, as well as soil archaea that are not extremophiles.
bacteriorhodopsin A haloarchaeal membrane-embedded protein that contains retinal and acts as a light-driven proton pump; it is homologous to the bacterial proteorhodopsin.
Lokiarchaeota A phylum in the Asgard superphylum of Archaea that contains deep-sea thermophiles isolated from a thermal vent named Loki’s Castle. Formerly known as the Deep-Sea Archaeal Group or Marine Benthic Group B (DSAG or MBGB).
Nanoarchaeota A phylum in the DPANN superphylum of Archaea that includes very small cells, which are obligate symbionts of vent hyperthermophiles.
Endnotes
1. Note a: Blue shade indicates superphylum. Return to reference a
19.2 TACK Hyperthermophiles Eat Sulfurnot assigned
As noted earlier, the TACK acronym (Table 19.2) designates a superphylum including four clades identified as Thaumarchaeota, Aigarchaeota, Crenarchaeota, and Korarchaeota. Added branches such as Geoarchaeota and Bathyarchaeota continue to be discovered. Many TACK organisms are hyperthermophiles found in hot springs or in undersea hydrothermal vents.
Hot Springs
Thermophilic archaea commonly grow in hot springs and geysers such as those of Yellowstone National Park (Fig. 19.7) or the Solfatara volcanic area near Naples, Italy. A hot spring occurs where water seeps underground above a magma chamber, which heats the water to near boiling. The heated water expands and is forced upward through fissures, coming out in a heated spring. In a geyser, the water is heated under pressure. As the water escapes upward, it turns into steam, which expands and jets upward, falling into a heated pool. These heated pools and their surrounding edges generate extreme ranges of temperature, mineral content, and acidity. They support a diverse range of microbial life, including thermophilic cyanobacteria and firmicutes, as well as archaea.
FIGURE 19.7 ■ Thermophiles colonize a hot spring. Morning Glory Pool, a hot spring in Yellowstone National Park, supports thermophilic archaea and bacteria.
HSUEH-YI CHEN/ALAMY STOCK PHOTO
Several features of hot springs and geysers are important for thermophiles: Reduced minerals. The heated water dissolves high concentrations of sulfides and other reduced minerals. When the water emerges and cools, the minerals precipitate. These reduced minerals serve as rich energy sources for autotrophs.
Low oxygen content. At higher temperatures, the oxygen concentration of water declines. Therefore, hyperthermophiles tend to be anaerobic, although there are important exceptions, such as the aerobic sulfur oxidizer Sulfolobus.
Steep temperature gradients. The temperature of the water falls dramatically within a short distance from the source, forming a steep gradient. Different species of thermophiles are adapted to different temperatures and grow in separate patches at the different temperatures, causing a variegated pattern.
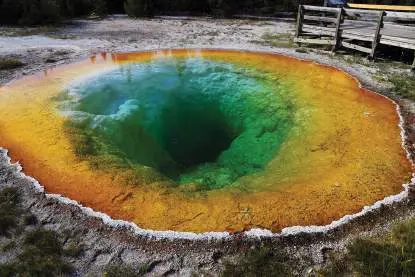
Acidity. Some hot-spring environments show extreme acidity. The acidity results from oxidation of sulfur or iron in reactions that generate strong inorganic acids, such as sulfuric acid (H 2 SO 4).
A special subcategory of volcanic hot-spring habitats is that of submarine hydrothermal vents on the ocean floor. The vent thermophiles must evolve to grow at high pressure under several kilometers of ocean. Pressure increases by approximately 100 atm per kilometer of ocean depth. Organisms that grow only at high pressure are called barophiles (discussed in Chapter 5).
Desulfurococcales: Reducing Sulfur
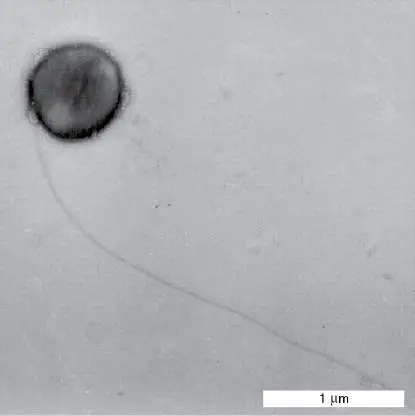
In the TACK Crenarchaeota group, the Desulfurococcales archaea show distinctive cell structures and forms of metabolism (Table 19.3). All possess a membrane with a combination of diethers and tetraethers, surrounded by an elaborate S-layer. Many take advantage of the high temperatures that increase the thermodynamic favorability of sulfur redox reactions. An example is Desulfurococcus fermentans (Fig. 19.8), a motile coccoid cell with archaella, isolated from hot springs. D. fermentans grows optimally at 85°C. The species respires anaerobically by reducing elemental sulfur (S 0) to sulfide (HS −). (Anaerobic respiration was discussed in Chapter 14.) Sulfur reduction is coupled to oxidation of small organic molecules such as sugars.
TABLE 19.3 TACK Hyperthermophiles Growth Representative temperature Growth Cell species (°C) pH shape Metabolism Aeropyrum 70–100ºC pH 5–9 Cocci O 2 respiration pernix Desulfurococcus 78–87ºC pH 6 Motile Anaerobic S 0 fermentans cocci respiration with or archaella fermentation TABLE 19.3 TACK Hyperthermophiles Growth Representative temperature Growth Cell species (°C) pH shape Metabolism Ignicoccus 70–98ºC pH 5–7 Cocci with Anaerobic islandicus periplas lithotrophy, mic S 0 oxidation space of H 2 Pyrodictium 80–110ºC pH 5–7 Disks Anaerobic abyssi linked by oxidation of cannulae H by S 0 or
2
S O 2− or
2 3
fermentation Sulfolobus 50–87ºC pH 2–4 Irregular O 2 respiration solfataricus cocci on S 0, producing H 2 SO 4 Thermosphaera 65–90ºC pH 5–7 Motile Anaerobic aggregans cocci in fermentation aggregat es FIGURE 19.8 ■ TACK hyperthermophile. Desulfurococcus fermentans (stain shadow, TEM).
A. A. PEREVALOVA ET AL. 2005. INT. J. SYST. EVOL. MICROBIOL. 55 :995–999
Another coccoid cell, Ignicoccus hospitalis, introduced earlier (Fig. 19.1), has an outer membrane surrounding its cytoplasmic membrane, with a large aqueous compartment between them. This outer compartment suggests a model for an intermediate stage of evolution of the eukaryotic nucleus. I. hospitalis, unlike Desulfurococcus, is a marine organism, growing at temperatures as high as 90°C. It is a lithotroph, oxidizing hydrogen with sulfur: H + S 0 ⟶ H S
2 2
Most of the cultured species of Desulfurococcales are obligate anaerobes. An exception is Aeropyrum pernix, one of the first archaea to have its genome sequenced. A. pernix is an aerobic heterotroph, respiring with O 2 on complex compounds during growth at 70°C–100°C.
While Desulfurococcus species are motile, other TACK hyperthermophiles form dense biofilms. Thermosphaera aggregans forms colonies so tightly bound that they cannot be dissociated by protease treatment or sonication.
Thought Question
19.2 What might be the advantages of archaellar motility for a hyperthermophile living in a thermal spring or in a black smoker vent? What would be the advantages of growth in a biofilm?
Sulfolobales: High Temperature and Extreme Acid
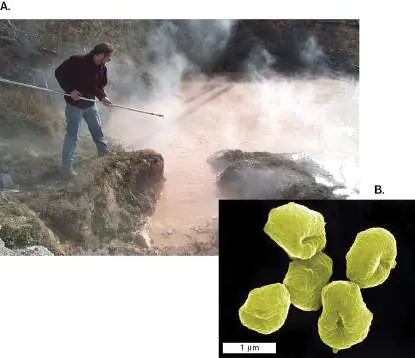
Some archaea grow in extreme acid, as well as high temperature. Organisms that grow under multiple conditions considered “extreme” are called “polyextremophiles.” The phylum Sulfolobales includes species that respire by oxidizing sulfur (instead of reducing it as Desulfurococcus does). These organisms, such as Sulfolobus species, grow at 80°C–90°C within hot springs and solfataras (volcanic vents that emit only gases). Ken Stedman and colleagues at Portland State University study Sulfolobus solfataricus, a species that grows at 80°C and pH 2 (Fig. 19.9). Unlike most archaea, S. solfataricus is readily cultured in the laboratory, and thus many interesting traits have been documented.
FIGURE 19.9 ■ Isolating Sulfolobus at Yellowstone. A. A researcher holds a collecting tube at length to obtain samples from a steaming spring, Rabbit Creek, at Yellowstone National Park. B.
Sulfolobus species grow at 80°C at pH 2–3.
COURTESY OF KEN STEDMAN
EYE OF SCIENCE/SCIENCE SOURCE
Cell membrane and S-layer. Sulfolobus cells have a membrane composed mainly of tetraethers that join the two membrane leaflets into one; the membranes are further stiffened by forming cyclic pentanes (Fig. 19.2E). Tetraether membranes are common in acidophilic thermophiles, probably because they are exceptionally impermeable to protons. The number of cyclic pentanes can vary with temperature, pH, and energy stress; in this way, the cell adjusts its membrane fluidity.
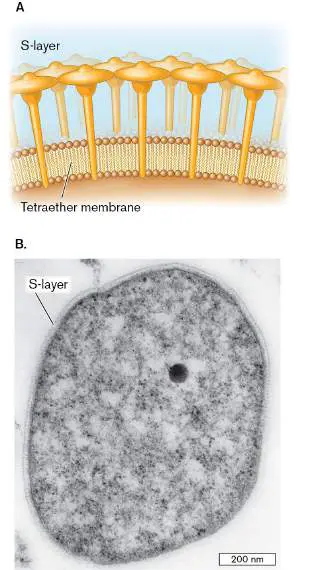
Like most hyperthermophiles, Sulfolobus lacks any cell wall but has an S-layer of glycoprotein (Fig. 19.10; also see Chapter 3). The S-layer proteins
of Sulfolobus species lock together in a geometric array, forming a sturdy protective coating. While keeping the cell intact, the S-layer protein array nonetheless allows a flexible cell, in contrast to the more rigid structures of most bacteria.
FIGURE 19.10 ■ Sulfolobus. A. S-layer proteins plugged into the tetraether membrane of Sulfolobus. B. Sulfolobus cell with tough, flexible S-layer.
EYE OF SCIENCE/SCIENCE SOURCE
Sulfolobus species swim using archaella (Fig. 19.11). Like bacterial flagella, Sulfolobus archaella are helical filaments driven by a motor embedded in the plasma membrane (Fig. 19.11B ). The motor structure is embedded between S-layer proteins. Unlike the bacterial flagellum, which is driven by proton motive force, the archaellum is driven by ATP hydrolysis catalyzed by FlaI motor subunits (orange in Fig. 19.11B ).
FIGURE 19.11 ■ Sulfolobus sp. A20 possesses archaella. A. Motile Sulfolobus cell with archaella (TEM). B. Archaellum structure is embedded between S-layer subunits.
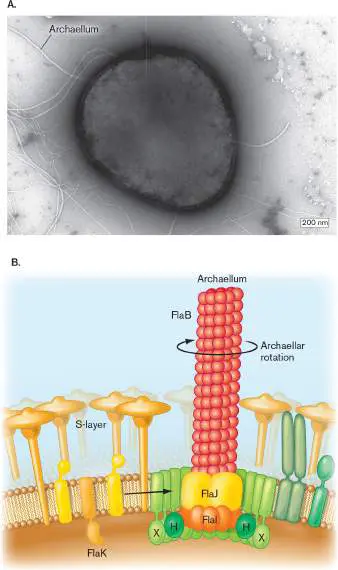
Source: Part B modified from Sonja-Verena Albers and Ken F. Jarrell. 2015. Front.
Microbiol. 6 :23, fig. 1B.
COURTESY OF LI HUANG
Sulfide oxidation. Sulfolobus species oxidize organic compounds with oxygen or they oxidize S 0 or H S to sulfuric acid:
2
2S 0 + 3O + 2H O → 2H SO ⟶ 4H + + 2SO 2−
2 2 2 4 4
As a result of sulfuric acid production, the pH of the organism’s surroundings falls to pH 2–3, effectively excluding all but acidophiles. While other archaea grow at higher temperatures (up to 120°C) or lower pH (below pH 0), Sulfolobus is of interest as a “double extremophile,” requiring both high temperature and extreme acidity simultaneously.
Sulfolobus species can grow heterotrophically on sugars or amino acids. In fact, many species are easily cultured in tryptone broth at 80°C, pH 3. Their internal pH is typically pH 6.5; thus, they maintain more than three units of pH difference across their membrane. The full metabolic potential of this organism is revealed by annotation of its genome, which contains homologs of sugar and amino acid transporters, as well as the non-ATP-forming Entner-Doudoroff pathway of glucose catabolism. Genes are present for enzymes to oxidize HS − and thiosulfate (S O 2−), as well as S 0. The main redox
2 3
carrier for respiration appears to be ferredoxin (instead of NADH, which is relatively unstable at high temperature).
Thought Question
19.3 What problem with cell biochemistry is faced by acidophiles that conduct heterotrophic metabolism?
Viruses of Sulfolobus. A fascinating discovery in Sulfolobus was that of archaeal viruses. Sulfolobus species are attacked by a number of viruses (see the chapter-opening image). The sequential process of a viral infection has been observed in S. solfataricus (Fig. 19.12). Cells were infected with Sulfolobus turreted icosahedral virus (STIV), a virus isolated from a boiling-acid hot spring in Yellowstone National Park. Each icosahedral particle of STIV has 12 turret-like projections, as shown in the cryo-electron microscopy (cryo-EM) image reconstruction in Figure 19.12A. Mature virions contain a double-stranded DNA genome coated with lipid within the capsid. The thin section of an infected cell (Fig. 19.12B ) shows progeny virions packed into a hexagonal array, portions of which poke through the host cell’s S-layer in pyramidal bulges. After lysis (Fig. 19.12C ), the S-layer complex is all that remains of the empty cell. The overall S-layer appears surprisingly intact, indicating the strength of its subunit interactions.
FIGURE 19.12 ■ Sulfolobus turreted icosahedral virus (STIV) infects Sulfolobus solfataricus. A. STIV capsid with “turrets” (cryo-EM). Capsid diameter 60 nm. B. A cell of S. solfataricus packed with a hexagonal array of STIV particles. Arrows point to pyramidal bulges where virus arrays poke through a breach in the S-layer. C. Empty cell membrane and S-layer following lysis and viral release. Arrow points to released virus particles.
GEORGE RICE ET AL. 2004. PNAS 101 :7716–7720, FIG. 2A
SUSAN K. BRUMFIELD ET AL. 2009. J. VIROL. 83 :5964–5970. © 2009, AMERICAN SOCIETY FOR
MICROBIOLOGY. ALL RIGHTS RESERVED
SUSAN K. BRUMFIELD ET AL. 2009. J. VIROL. 83 :5964–5970. © 2009, AMERICAN SOCIETY FOR
MICROBIOLOGY. ALL RIGHTS RESERVED
The STIV lytic cycle resembles lytic and fast-release cycles of bacterial and eukaryotic viruses, although the capsid “turrets” of the capsid and the
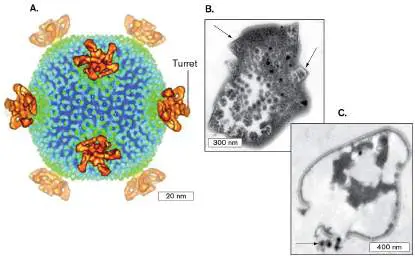
pyramidal bulges of the lysing cell are unique to archaea. The structure of a capsid protein component shows surprising homology to both bacterial and eukaryotic viral proteins.
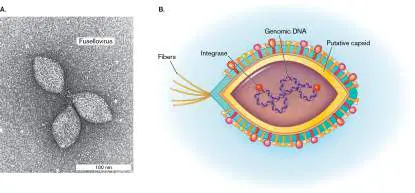
Another unusual virus infecting Sulfolobus species is the fusellovirus (Fig. 19.13). The spindle shape of fusellovirus is found only in viruses of archaea. The DNA genome of this virus—which must retain its structure at high temperatures—is positively supercoiled. The structure and genetics of fusellovirus have been studied, including its ability to integrate in the host genome at a tRNA-encoding gene.
FIGURE 19.13 ■ Fusellovirus of Sulfolobus species. A. Spindle-shaped fusellovirus particles (TEM, with heavy-atom stain shadowing). B. Virion structure, including positively supercoiled DNA genome with integrase and capsid and envelope proteins.
REPRINTED BY PERMISSION FROM SPRINGER NATURE: D. PRANGISHVILI, D. BAMFORD, P.
FORTERRE, ET AL. 2017. NAT. REV. MICROBIOL. 15 :724–39
Numerous other archaeal viruses have been discovered in high-temperature environments, including icosahedral, tailed, and filamentous forms. Nearly all known viruses of archaea have genomes consisting of double-stranded DNA, suggesting that only double-stranded DNA is stable enough for virus particles to persist at high temperature. Nevertheless, in 2012, Eugene Koonin’s group at the National Center for Biotechnology Information identified gene sequences of an RNA virus from a Yellowstone hot spring, including an archaeal RNA-dependent RNA transcriptase. This finding suggests there may exist RNA viruses that infect hyperthermophilic archaea.
Thought Question
19.4 What hypotheses might we propose about archaeal evolution if viruses of mesophilic archaea are found to have RNA genomes? What if, instead, all archaeal viruses have DNA genomes only?
Besides Sulfolobales, the group Thermoproteota includes other clades of thermoacidophiles. Caldisphaerales is a clade of thermoacidophiles first isolated from a Philippine hot spring at Mount Makiling. Members of Caldisphaerales, such as Caldisphaera, typically grow at pH 3 up to 80°C. Unlike Sulfolobus species, Caldisphaera species are anaerobes or microaerophiles, tolerating only low concentrations of oxygen. They grow by fermentation or anaerobic respiration. Another clade, Thermoproteales, includes hyperthermoacidophiles isolated from marine vents; thus, they survive extreme pressure, as well as heat and acid! Thermoproteus species grow at temperatures up to 97°C and at pH values lower than pH 3. Their rod-shaped cells are less than 0.3 μm in length—one of the smallest cell types known. They have autotrophic metabolism, gaining energy by reducing sulfur with H 2 to H 2 S.
Barophilic Vent Hyperthermophiles
The most extreme hyperthermophiles are barophiles adapted to grow near hydrothermal vents at the ocean floor. The high pressure beneath several kilometers of ocean allows water to remain liquid at temperatures above 100°C; the highest known temperature for growth of an organism is 125°C (for Pyrolobus fumarii).
A common feature of thermal vents is the black smoker (Fig. 19.14). A black smoker is a chimney-like structure resulting from the upwelling of seawater superheated by an undersea magma chamber. As in a geyser aboveground, the heated water is forced upward through a small opening. Because the thermal vent is under steam pressure, the water can reach temperatures of over 400°C, enabling it to dissolve high concentrations of minerals such as iron II sulfide (FeS). When the rising water escapes, however, it immediately cools, depositing iron sulfide around the edge of the vent chimney and precipitating iron sulfide particles that cloud the water— hence the term “black smoker.” While no organism can grow at 400°C, various species of archaea are adapted to grow in the range of 100°C–120°C, where the vent stream meets the seawater and minerals precipitate (Fig. 19.14B ).
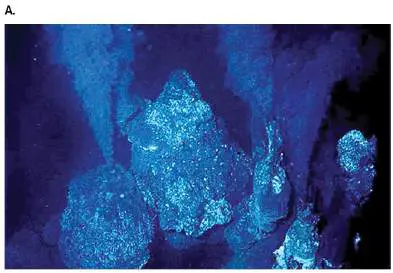
FIGURE 19.14 ■ Extreme temperature and pressure: black smoker vents. A. Black smoker vent with fluid escaping from “chimneys” of sulfide minerals that crystallize as the 350°C fluid hits the cold, 2°C ocean seawater. The photo was taken by the submersible Alvin at a depth of 2,250 m, at the Juan de Fuca Ridge, off the coast of Oregon. B.
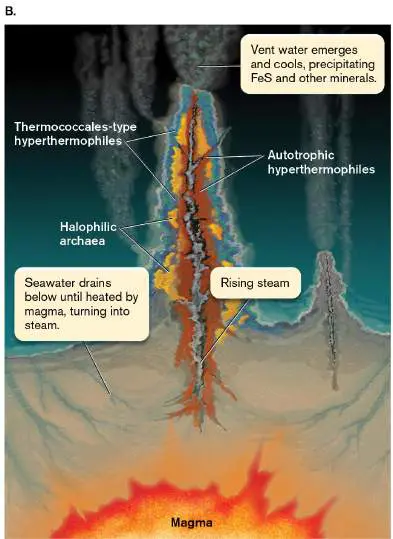
Different parts of the smoker vent system support different classes of archaea.
DR. MICHAEL PERFIT, UNIVERSITY OF FLORIDA, AND NOAA VENTS PROGRAM
How do we study organisms under such extreme conditions? To study hyperthermophiles from black smoker vents requires specialized equipment. The isolation of such organisms is a challenge because their habitats endanger our own survival. Undersea vent systems must be approached by a special submersible device with a robotic arm. An example is the Environmental Sample Processor from the Monterey Bay Aquarium Research Institute (Fig. 19.15A). The robotic system samples temperature and other properties of fluid emerging from a black smoker hydrothermal vent. It can then sample organisms for study. An advanced version of this device can actually process the organism’s DNA. Thus, the DNA can be obtained from vent-adapted microbes that could not survive transfer to a laboratory at sea level. The robotic sample processor is supported by NASA as a model for a future space probe to explore one of Jupiter’s moons, Europa, considered a possible source of extraterrestrial life.
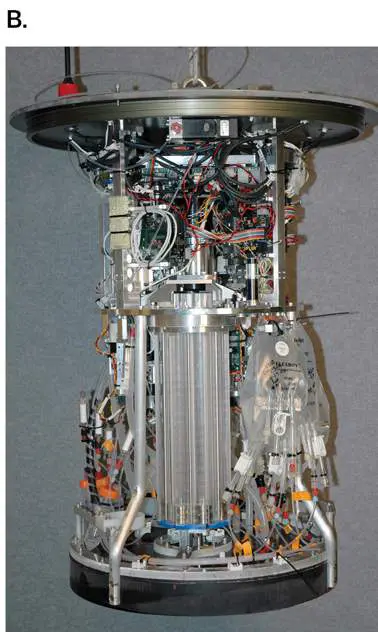
Organisms that do survive transport to sea level must nonetheless be maintained at high pressure and temperature to ensure viability. In the laboratory, all devices for microscopy and cultivation must be kept under pressure and at high temperature (Fig. 19.15B ). The culture must be provided with reduced minerals and gases needed for the growth of vent microbes.
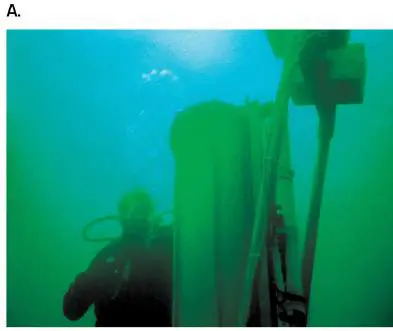
FIGURE 19.15 ■ Robotic sampling from a black smoker vent. A. Engineer Gene Massion, from the Monterey Bay Aquarium Research Institute, deploys the submersible Environmental Sample Processor with robotic collection arm at an ocean site off the coast of Maine. B. Pressurized device for sampling and cultivation of vent organisms.
© 2006 MBARI
TODD WALSH © 2006 MBARI
Vent-adapted members of Desulfurococcales include Pyrodictium abyssi ( Fig. 19.16), P. occultum, and P. brockii; the latter is named for Thomas Brock (1926–2021) of the University of Wisconsin–Madison, a pioneering researcher of hyperthermophiles. For energy, Pyrodictium species reduce
sulfur to H 2 S, either with molecular hydrogen or with organic compounds. A membrane-embedded sulfur-reducing complex and a proton-translocating ATP synthase have been isolated from P. abyssi. The complexes are extremely heat stable, exhibiting a temperature optimum of 100°C. FIGURE 19.16 ■ Pyrodictium abyssi, growing as networks of cells linked by cannulae. SEM.
S. Y. M. NG ET AL. 2008. J. BACTERIOL. 190 :6039. REPRODUCED WITH PERMISSION FROM
AMERICAN SOCIETY FOR MICROBIOLOGY
Pyrodictium species grow as flat, disk-shaped cells that can be as thin as 0.1 μm. The cells contain a periplasm and outer membrane with an S-layer that is coated with zinc sulfide, a mineral that precipitates from the vent. The cell disks are interconnected by glycoprotein tubules called cannulae (singular, cannula). The cannulae can extend to more than 0.1 mm, forming complex networks of connections (Fig. 19.16). In liquid culture, the networks grow into white balls up to 10 mm in diameter. Cryo-electron tomography of a Pyrodictium cell shows that the cannulae bridge the
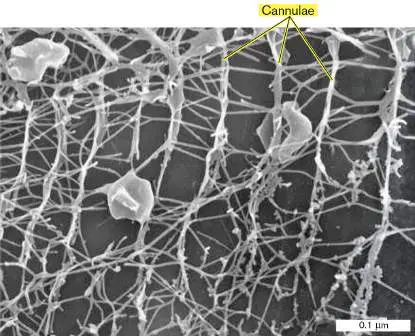
periplasm between cells, but not the cytoplasm. The cannulae may enable Pyrodictium cells to share nutrients and maintain a biofilm, while keeping their cellular identity distinct with separated cytoplasm.
What happens when a Pyrodictium cell divides? Cells of P. abyssi generate new cannulae as they undergo fission (Fig. 19.17). Some of the new cannulae form as loops connecting the two daughter cells while simultaneously pushing the two cells apart. In this fashion, the cell division process expands the cell network.
FIGURE 19.17 ■ Pyrodictium abyssi, undergoing cell division. Cells of Pyrodictium abyssi (arrows) generate new interconnecting cannulae as they divide.
CHRISTIAN HORN ET AL. 1999. J. BACTERIOL. 181 :5114–18
Note: Two genera of vent thermophiles have similar names but only
distant genetic relatedness: Pyrodictium abyssi, from TACK Desulfurococcales; and Pyrococcus abyssi, from Euryarchaeota.
Korarchaeota and Aigarchaeota: Cryptic Filaments of the Deep
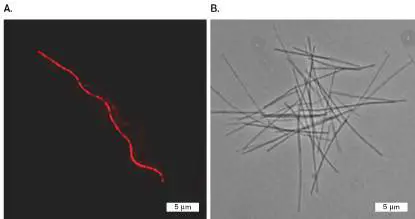
Metagenomic analysis continues to reveal previously unknown branches of life. An example of a deeply branching clade is the Korarchaeota (the “K” in TACK). Korarchaeota are hydrothermal vent hyperthermophiles isolated by Susan Barns and Norman Pace. The organisms have not been isolated in pure culture, but in 2008 the genome of one korarchaeote was sequenced from an enriched mixed culture at 80°C–90°C at Obsidian Pool, Yellowstone National Park (Fig. 19.18). The organism, provisionally named “ Candidatus Korarchaeum cryptofilum,” grows in long, thin filaments less than 200 nm wide. Its genes suggest that it gains energy mainly from anaerobic peptide
fermentation, yet we still do not know enough to culture this organism in the laboratory.
FIGURE 19.18 ■ Korarchaeota: a filamentous vent hyperthermophile. A. Filamentous chain of a candidate species: Korarchaeum cryptofilum (fluorescence microscopy, FISH with fluorescent DNA probe). B. K. cryptofilum under phase contrast.
J. G. ELKINS ET AL. 2008. PNAS 105 :8102, FIG. 1A
J. G. ELKINS ET AL. 2008. PNAS 105 :8102, FIG. 1B
Another interesting discovery, from a terrestrial subsurface hydrothermal ecosystem, is the phylum Aigarchaeota. The Aigarchaeota include filamentous heterotrophs that are aerobic, catabolizing many organic molecules using oxygen as their electron acceptor. Aigarchaeota is the “A” in the TACK superphylum name.
To Summarize
Habitats for hyperthermophiles include hot springs and submarine hydrothermal vents. Vent organisms are barophiles as well as thermophiles. Anaerobic hyperthermophilic acidophiles include Caldisphaerales and Thermoproteales.
Desulfurococcales includes diverse thermophiles. Most are anaerobes that use sulfur to oxidize hydrogen or organic molecules. Sulfolobus species oxidize sulfur or H 2 S to sulfuric acid, and they catabolize organic compounds.
Archaella are driven by rotary motors. Rotation is powered by ATP hydrolysis. The archaellum may share ancestry with type IV pili. Viruses infect Sulfolobus. Archaeal viruses show unique shapes and positively supercoiled DNA.
Marine hydrothermal vents support archaea that are barophiles as well as hyperthermophiles. Pyrodictium species are disk-shaped cells interconnected by cytoplasmic bridges called cannulae.
Korarchaeota and Aigarchaeota are filamentous hyperthermophiles.
Glossary
Desulfurococcales A phylum of thermophilic archaea in the TACK superphylum that metabolize sulfur and organic compounds.
Sulfolobales A phylum of thermophilic archaea in the TACK superphylum that includes sulfur oxidizers.
black smoker An oceanic thermal vent containing high concentrations of dark minerals such as iron sulfide.
cannula pl. cannulae A narrow tubule. For Pyrodictium species, glycoprotein cannulae interconnect cells at their periplasm.
Korarchaeota A phylum of archaea in the TACK superphylum that contains anaerobic hyperthermophiles in hot springs and deep-sea thermal vents. Aigarchaeota A phylum of archaea in the TACK superphylum that contains filamentous aerobic hyperthermophiles in hot springs.
barophile Also called piezophile. An organism that requires high pressure to grow. Fig. 19.1 FIGURE 19.1 ■ Ignicoccus hospitalis, from a hydrothermal vent 600 meters below sea level, at Kolbeinsey Ridge volcano. Ignicoccus hospitalis has an extensive endomembrane system (orange) within an outer compartment contained by the cell membrane (yellow). Cryo-electron tomography, colorized.
COURTESY OF THOMAS HEIMERL
Fig. 19.2E
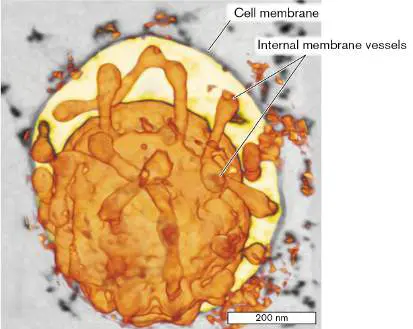
FIGURE 19.2 ■ Branched-chain ether lipids are characteristic of archaeal membranes.
Source: Modified from R. M. Daniel and D. A. Cowan. 2000. Cell. Mol. Life Sci. 57
:250–264.
19.3 Thaumarchaeota: Ammonia Oxidizers and Animal Symbiontsnot assigned
Because archaea were first isolated from extreme habitats, it came as a surprise when SSU rRNA probes revealed mesophilic TACK archaea (then identified as Crenarchaeota) in moderate habitats throughout the biosphere. The first marine mesophilic archaea were found in 1992 by Jed Fuhrman, University of Southern California ( Fig. 19.19A). Edward DeLong (Fig. 19.19B ), Massachusetts Institute of Technology, further sampled the Pacific Ocean at the Hawaii Ocean Time-series station, where he found high numbers of mesophilic archaea, then called Crenarchaeota (now the “C” in TACK; Fig. 19.19C ). The abundance of archaea, predominantly Thaumarchaeota, varied according to season and increased with depth, typically comprising 40% of the total microbial population at depths of 1,000 meters, where temperatures are cold.
FIGURE 19.19 ■ Crenarchaeota in the Pacific Ocean. A. Jed Fuhrman samples mesophilic archaea in the Pacific Ocean. B. Ed DeLong mapped the abundance of marine mesophilic archaea. C. The proportion of TACK mesophilic archaea (color profile), measured as a function of depth and season, in the Hawaii Ocean Time-series station. Archaea were identified by fluorescence in situ hybridization (FISH). A fluorescein-labeled DNA probe specific to TACK archaea was hybridized to a cellular rRNA sequence; DNA
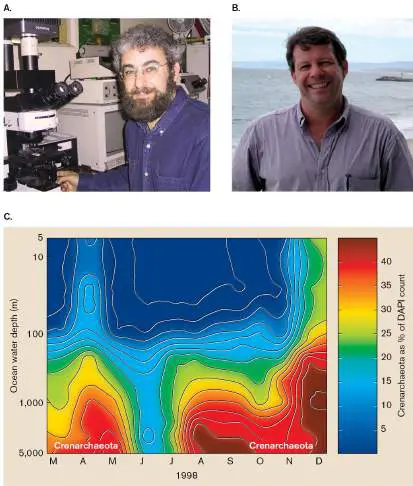
was detected using the DNA-binding fluorophore 4′,6-diamidino-2-phenylindole (DAPI).
Source: Part C modified from Markus Karner et al. 2001. Nature 409 :507.
COURTESY OF JED FUHRMAN
COURTESY OF ED DELONG
Mesophilic archaea may have evolved from hyperthermophiles by gene acquisition from mesophilic bacteria. Many—perhaps the majority of archaea overall—grow in water or soil, often in association with plants and animals.
Ammonia-Oxidizing Thaumarchaeotes Cycle Global Nitrogen
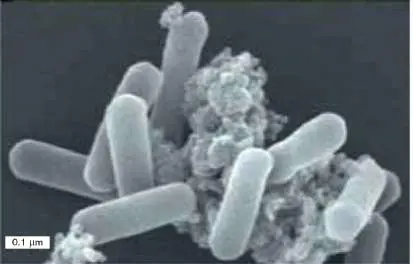
From a global standpoint, the most significant thaumarchaeotes discovered are the ammonia-oxidizing archaea (AOA), such as those of the order Nitrosopumilales. The best-studied ammonia-oxidizing thaumarchaeote, Nitrosopumilus maritimus, was isolated from a marine water tank at the Seattle Aquarium by David Stahl and colleagues at the University of Washington (Fig. 19.20).
FIGURE 19.20 ■ Nitrosopumilus, an ammonia-oxidizing archaeon. Nitrosopumilus maritimus cells clustered on sediment (SEM).
M. KÖNNEKE ET AL. 2005. NATURE 437 :543–546, FIG. 2D
Ammonia-oxidizing archaea gain energy by aerobically oxidizing ammonia to nitrite: 2NH + 3O ⟶ 2NO − + 2H O + 2H +
3 2 2 2
This lithotrophic reaction yields redox energy, enabling the microbe to fix CO 2 for biomass (discussed in Chapter 14). In marine environments, excreted ammonia can build up to high levels, until it is oxidized by archaea and bacteria. In some habitats, the Thaumarchaeota perform most of the recycling of ammonia, such as the ammonia excreted by fish in your aquarium. The thaumarchaeotes thus help balance the ecology of intertidal pools and beaches. The reaction plays a key role in the global nitrogen cycle, as the first step of returning organic nitrogen to atmospheric N
2 (discussed in Chapters 21 and 22). It also provides a major source of nitrite for marine phytoplankton.
Ammonia-oxidizing archaea are ubiquitous in marine environments. Tatsunori Nakagawa and colleagues at Nihon University, Japan, used enrichment culture (described in Chapter 4) to hunt for new kinds of AOA (Fig. 19.21). Samples of sand from the seafloor at Tanoura Bay, Japan, were serially diluted in medium containing ammonium sulfate and adjusted to pH 8, a pH high enough for significant deprotonation of ammonium ion (NH +)
4
to ammonia (NH 3). During the enrichment culture, ammonia was progressively consumed and converted to nitrite (NO −). In the
2
culture, the gene encoding ammonia oxidase (amoA) was identified by polymerase chain reaction (PCR) amplification. The AOA were identified by fluorescence in situ hybridization (FISH) using a fluorophore attached to DNA that hybridizes to rRNA of Nitrosopumilus species.
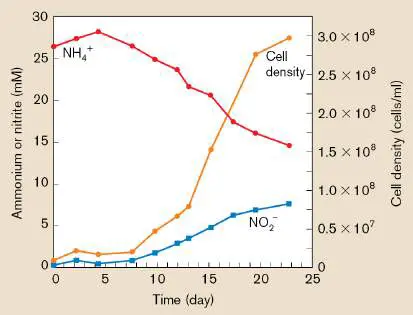
FIGURE 19.21 ■ Enrichment culture for ammonia oxidizers. Ammonia-oxidizing microbes from eelgrass seafloor samples convert ammonia to nitrite.
Source: Modified from Naoki Matsutani et al. 2011. Microbes Environ. 26 :23–
29.
Nitrosopumilus and related AOA oxidize ammonia at extremely low concentrations. Thus, AOA quickly remove a substance toxic to fish. AOA have since been found throughout marine and freshwater communities, as well as in soil, where they perform the important function of ammonia removal. They appear in industrial waste sludge, revealed by fluorescent DNA probes (Fig. 19.22). While ammonia is also oxidized by bacteria, in many habitats the AOA are the dominant oxidizers. Ammonia-oxidizing thaumarchaeotes continue to be discovered in other habitats, including Antarctic lakes down to the temperature of −20°C—as well as habitats closer to home, such as the sponge filter of your own freshwater aquarium (Special Topic 19 ).
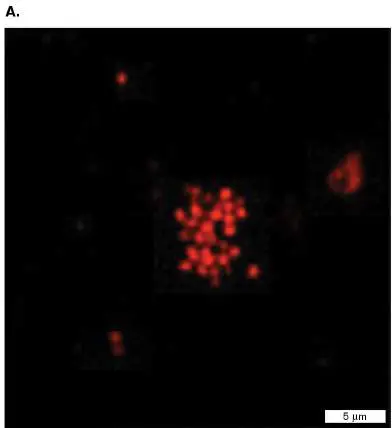
FIGURE 19.22 ■ Ammonia-oxidizing Thaumarchaeota in nitrogen-rich industrial sludge. A. FISH probe hybridizes with rRNA sequence specific to thaumarchaeotes. B. Ammonia-oxidizing archaea within a particle of sewage sludge (LM).
MARK MUSSMANN ET AL. 2011. PNAS 108 :16771
MARK MUSSMANN ET AL. 2011. PNAS 108 :16771
SPECIAL TOPIC 19 Ammonia-Oxidizing Archaea Keep Your Fish Healthy
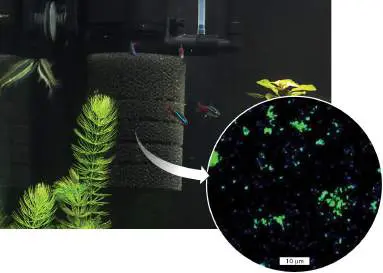
We often think of archaea as living in exotic environments far from a human home. But many kinds of archaea live in our homes, on our skin, and even in the water of a typical home aquarium (Fig. ST 19.1 ). How do they interact with the fish? Laura Sauder and colleagues at the University of Waterloo, Canada, hypothesized that unidentified Thaumarchaeota would be found oxidizing ammonia that the fish excrete. Some bacteria are known to oxidize ammonia, and commercial cultures can be purchased to improve the aquarium water and extend the life of the fish. But what if in natural systems archaea are more prevalent, and perhaps do a better job than bacteria?
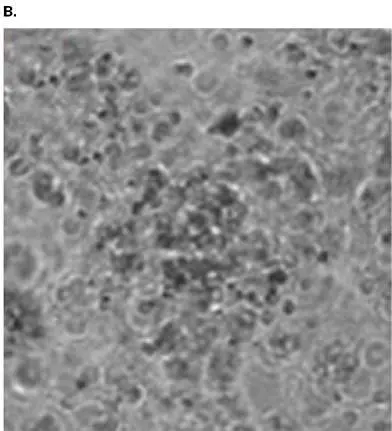
Sauder sought to find ammonia-oxidizing thaumarchaeotes in an aquarium’s sponge filter. A sponge filter traps particulate matter as a motor pumps water through, thus providing cleaner water for the fish. But microbes from the trapped particles can proliferate as a biofilm on the sponge, where they continually receive nutrients from the pumped water. Sauder investigated whether any of these sponge biofilms contain archaea. She cultured the sponge biofilm in a mineral salts medium supplemented with ammonium chloride (NH 4 Cl), providing the ammonium ion that Thaumarchaeota can oxidize. This approach to favoring the culture of a metabolic type is known as enrichment culture (discussed in Chapter 4). The medium also contained antibiotics that target bacteria but not archaea (see Section 19.1). Samples of the culture were then observed by fluorescence microscopy with fluorescence in situ hybridization (FISH; described in Chapter 2). The FISH fluorophore-labeled DNA probe hybridizes to SSU rRNA at a sequence specific to archaea (Fig. ST 19.1 , inset). In the micrograph, spots showing green fluorescence indicate archaea, whereas blue fluorescence arises from a different fluorophore that generally stains all DNA. A majority of the spots are green, showing the presence of archaea.
FIGURE ST 19.1 ■ “ Candidatus Nitrosotenuis aquarius” cultured from a sponge filter. In a freshwater aquarium, fish benefit from ammonia-oxidizing archaea on a sponge filter. Inset: “ Candidatus Nitrosotenuis aquarius” (green fluorophore, FISH) and other microbes (blue fluorophore, FISH) were cultured from a sponge filter. Source: Laura Sauder et al. 2018. Appl. Environ. Microbiol. 84 :e01430.
MPRODUCTION/DEPOSITPHOTOS
L. A. SAUDER ET AL. 2018. APPL ENVIRON MICROBIOL. 84 :E01430–18
The archaea obtained were then isolated as clones, and their genomes were sequenced by Illumina sequencing. The genomes resembled those of several ammonia-oxidizing marine archaea within the genus Nitrosotenuis. For Sauder’s aquarium isolate, the researchers proposed the name “ Candidatus Nitrosotenuis aquarius.” (For a candidate species, “Candidatus” is italicized but
the proposed genus and species name is not.) The genome of this isolate shows the genes amoABC encoding the classic enzyme ammonia monooxygenase as well as ammonium transporters.
Sauder’s team also characterized her isolate by electron microscopy (Fig. ST 19.2A ). The archaeal cell is an elongated lozenge with the hexagonal packing of S-layer subunits. The pattern resembles that of the Nitrosopumilus sp. S-layer imaged by cryo-electron tomography.
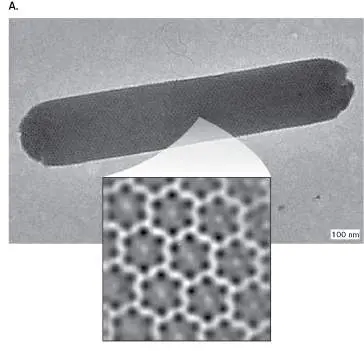
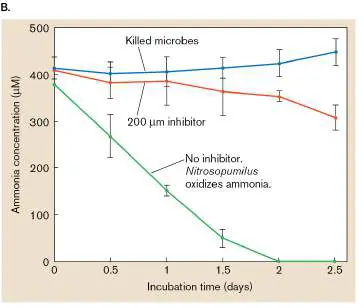
FIGURE ST 19.2 ■ “ Candidatus Nitrosotenuis aquarius” S-layer and ammonia filtration. A. Cell stained with uranyl acetate shows hexagonal pattern of S-layer. Inset: S-layer of related species, Nitrosopumilus SCM1 (cryo-electron tomography). B. Ammonia removed by the sponge filter biomass. Source: Laura Sauder et al. 2018. Appl. Environ. Microbiol. 84:e01430. Inset source: Wei Qin et al. 2017. Int. J. Syst. Evol. Microbiol. 67 :5067.
L. A. SAUDER ET AL. 2018. APPL ENVIRON MICROBIOL. 84 :E01430–18
W. QIN ET AL. 2017. INT J SYST EVOL MICROBIOL. 67 :5067–5079
The effectiveness of the sponge filter biomass was confirmed by ammonia assay (Fig. ST 19.2B ). The assay was conducted with controls including an inhibitor of the ammonia monooxygenase, and a control with the microbes inactivated. Overall, these newly described archaea turn out to be hard-working partners in a microbial ecosystem close to home. Laura
Sauder has now joined a biotech company, Indigo Ag, that develops sustainable approaches to agriculture including microbial partners.
RESEARCH QUESTION
How do archaea regulate their ammonia oxidation? What environmental factors enhance the microbial ammonia removal in your fish tank?
Sauder, Laura A., Katja Engel, Chien-Chi Lo, Patrick Chain, and Josh
D. Neufeld. 2018. “ Candidatus Nitrosotenuis aquarius,” an ammonia-oxidizing archaeon from a freshwater aquarium biofilter. Applied and Environmental Microbiology 84 :e01430.
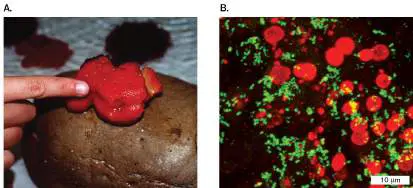
Symbiotic ammonia-oxidizing archaea. Human sweat glands release nitrogenous materials that bacteria break down to ammonia. Are ammonia-oxidizing archaea found on humans? Christine Moissl-Eichinger, at the Medical University of Graz, Austria, discovered AOA on human skin, where they are the major archaeal component of the skin microbiome. The human body continually emits ammonia, so AOA may help metabolize this toxic substance while controlling skin pH for the microbial community. The finding of ammonia-oxidizing thaumarchaeotes on the skin, as well as methanogens in the gut, may help explain another discovery made by Moissl-Eichinger; namely, the DNA signatures of thaumarchaeotes and methanogens in hospital intensive care units and industrial clean-room facilities. In the deep ocean, there are thaumarchaeote psychrophiles (cold-adapted microorganisms). Some psychrophilic thaumarchaeotes live as endosymbionts of marine animals such as sponges. The thaumarchaeote Cenarchaeum symbiosum inhabits the sponge Axinella mexicana (Fig. 19.23A). C. symbiosum has yet to be grown in culture, but the presence of the microbes is shown by the fluorescence of a DNA probe that hybridizes to sequences specific to C. symbiosum (Fig. 19.23B ). How the microbe benefits its sponge host is unknown, but the sponge and its endosymbionts can be cocultured in an aquarium for many years. A hypothesis investigated by researchers is that C. symbiosum produces antimicrobial agents that protect the sponge from pathogens or predators (see Chapter 15). Products of C. symbiosum are now being tested for their pharmacological properties.
FIGURE 19.23 ■ Symbiosis between a thaumarchaeote and a sponge. A. Cenarchaeum symbiosum inhabits the sponge Axinella mexicana. B. Differential fluorescent staining of C. symbiosum (green fluorescence) present in sponge tissue visualized by FISH (fluorescent probes that hybridize rRNA; discussed in Chapter 2). Host cell nuclei fluoresce red (propidium iodide stain).
EDWARD F. DELONG. 2003. ASM NEWS 69 :503–511, FIG. 3A
CHRISTINA PRESTON, MONTEREY BAY AQUARIUM RESEARCH INSTITUTE
To Summarize
Oceans, soil, plant roots, and animals provide habitats for mesophilic and psychrophilic TACK archaea.
Nitrosopumilus and other ammonia-oxidizing archaea (AOA) gain energy by aerobically oxidizing ammonia to nitrite.
Ammonia-oxidizing archaea make essential contributions to local and global nitrogen cycling in water and soil. Ammonia-oxidizing archaea comprise a significant part of the human skin microbiome.
Thaumarchaeotes include symbionts of marine sponges. Emerging thaumarchaeotes include mesophiles, psychrophiles, and thermophiles in many environments.
19.4 Euryarchaeota: Methanogens from Gut to Globenot assigned
A third major branch of known archaea is Euryarchaeota, the “broad-ranging archaea” (
Table 19.2 ). The euryarchaeotes include multiple branches of methanogens, species
that derive energy through reactions producing methane. Methanogenesis is a form of
energy-yielding metabolism unique to archaea—another profound distinction of the
archaeal domain.
Most methanogens are strict anaerobes; while their metabolism is
chemolithotrophic, they depend on bacterial communities releasing CO 2, H 2,
and other simple carbon compounds. Methanogens release methane from soil
and animal digestive habitats found nearly everywhere on Earth. For the methanogen,
methane is just a by-product of its energy-yielding metabolism, but this by-product is a
greenhouse gas with profound consequences for our biosphere (discussed in Chapter 22
).
Figure 19.5 shows the approximate branch points of five major clades of
methanogens. The branches are polyphyletic—that is, they lack a distinctive shared
ancestor—and they are interspersed by nonmethanogens.
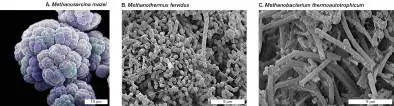
Methanosarcinales (Fig. 19.24A ) are found in ocean and soil, breaking down
acetate, alcohol, and amines to methane.
FIGURE 19.24 ■ Methanogens show a wide range of shapes. A.
Methanosarcina mazei, a lobed coccus form lacking flagella (SEM). B.
Methanothermus fervidus, a short bacillus (SEM). C. Methanobacterium
thermoautotrophicum, an elongated bacillus (SEM).
RALPH ROBINSON/VISUALS UNLIMITED AND D. L. MAEDER ET AL. 2006. J. BACTERIOL. 188 :7922
P. J. SALLIS ET AL. 2003. BIORESOUR. TECHNOL. 89 :255
P. J. SALLIS ET AL. 2003. BIORESOUR. TECHNOL. 89 :255
Methanobacteriales (Fig. 19.24B and C ) inhabit soil and animal digestive tracts.
They include main human gut methanogens Methanosphaera stadtmanae and
Methanobrevibacter smithii.
Methanopyrales include hyperthermophilic methanogens growing at up to 122°C.
Methanococcales include mesophilic and hyperthermophilic marine organisms.
Methanomicrobiales are marine methanogens.
The methanogens branch deeply, as diverse as all the euryarchaeotes together. A
possible explanation of this phylogeny would be that the ancestral euryarchaeote was a
methanogen, but many descendant lineages lost the metabolism. Alternatively,
divergent euryarchaeotes could have acquired the genes for methanogenesis later,
independently, by horizontal gene transfer. As yet, we lack sufficient genomic data to
determine which model is correct. Furthermore, genes encoding enzymes of
methanogenesis were found in one deep-branching clade outside the Euryarchaeota,
the TACK phylum Bathyarchaeota.
Biogenic Paths to Methane
Biogenic methane formation has actually been observed since 1776, when the Italian
priest Carlo Campi and physicist Alessandro Volta (1745–1827) investigated bubbles of
“combustible air” from a wetland lake. Volta wrote:
Being in a little boat on Lake Maggiore, and passing close to an area covered
with reeds, I started to poke and stir the bottom with my cane. So much air
emerged that I decided to collect a quantity in a large glass container.... This
air burns with a beautiful blue flame.
Volta noted that methane arose from wetlands containing water-saturated decaying
plant material. In 1882, the German medical researcher Hermann von Tappeiner
(1847–1927) combined plant materials with ruminant stomach contents (a source of
methanogens) and showed that both components were essential to produce methane.
During the late nineteenth century, in England, methane was collected from manure
and sewage and used as a fuel for street lamps.
Different species generate methane from different substrates, such as CO 2 and H 2
or small organic compounds, generally fermentation products of bacteria. Each pathway
of methanogenesis generates a small free energy change (Δ G °′) that is just enough to
drive processes of carbon fixation and biosynthesis. All types of methanogenesis are
poisoned by molecular oxygen and therefore require extreme anaerobiosis. Major
substrates and reactions include:
Carbon dioxide: CO 2 + 4H 2 ⟶ CH 4 + 2H 2 O
Formic acid: 4CHOOH ⟶ CH 4 + 3CO 2 + 2H 2 O
Acetic acid: CH 3 COOH ⟶ CH 4 + CO 2
Methanol: 4CH 3 OH ⟶ 3CH 4 + CO 2 + 2H 2 O
Methylamine: 4CH 3 NH 2 + 2H 2 O ⟶ 3CH 4 + CO 2 + 4NH 3
Dimethyl sulfide: 2(CH 3) 2 S + 2H 2 O ⟶ 3CH 4 + CO 2 + 2H 2 S
In CO 2 reduction, the most common form of methanogenesis, carbon dioxide plus
molecular hydrogen combine to form water and methane. CO 2 -reducing methanogens
are autotrophs, growing solely on CO 2 and H 2 with a source of nitrogen and other
minerals. Methanogenesis from other carbon sources, such as formate, acetate, or
methanol, is heterotrophic and generates CO 2 as a product in addition to methane.
The nitrogen-containing substrate methylamine generates ammonia in addition to
methane and CO 2, whereas the sulfur-containing substrate dimethyl sulfide generates
hydrogen sulfide.
Note that only a narrow range of substrates supports methanogenesis. For unknown
reasons, most methanogens lack the vast array of energy-yielding pathways found in
soil bacteria such as Rhodopseudomonas or Streptomyces. Thus, methanogens
generally require close association with bacterial partners to provide their substrates—a
relationship called syntrophy (discussed in Chapter 13). Syntrophic methanogens
usually grow in habitats with minimal resource flux, where hydrogen and carbon dioxide
gases can be trapped for their use. Removal of these gases then enhances the
metabolism of partner bacteria.
Thought Question
19.5 Anoxic soil contains bacteria and methanogens. What will happen to the
microbial populations when the soil is tilled and aerated?
Many kinds of methanogens can be cultured in the laboratory. Their culture poses
special challenges because the reactions of methanogenesis are halted by oxygen.
Thus, most methanogens are strict anaerobes, although a few that tolerate oxygen
have been found. To exclude oxygen, microbes are cultured and manipulated within an
anaerobic chamber. Furthermore, methanogens that use CO 2 and H 2 as substrates
must receive a steady supply of these gases. Even more challenging is the culture of
hyperthermophilic methanogens, such as Methanopyrus, a deep-ocean vent
hyperthermophile that grows at scorching temperatures up to 122°C. For these
organisms, we must maintain both high temperature and high pressure.
During growth, how do methanogens form biomass? Many euryarchaeotes fix CO 2
into biomass by the Wood-Ljungdahl pathway of acetogenesis (acetate formation), also
known as the reductive acetyl-CoA pathway (presented in Chapter 15). Biochemical
and genomic comparisons suggest that two-carbon assimilation by acetogenesis may
be the oldest means of carbon fixation, used by the ancient ancestral archaea.
A striking feature of methanogens is the wide range of growth temperatures among
closely related species. Thermophiles and even hyperthermophiles branch from closely
related mesophiles; for example, the order Methanobacteriales includes
Methanobrevibacter ruminantium (37°C–39°C), Methanobacterium
thermoautotrophicum (50°C–75°C), and Methanothermus fervidus (60°C–97°C). Table
19.4 summarizes five major orders of methanogens.
TABLE 19.4 Methanogens
Growth
Representative temperature Growth Cell Substrates for
species (°C) pH shape methanogenesis
Methanobacteriales
Methanobrevibacter 37–39°C pH 6–9 Chains of H 2 and CO 2
ruminantium short
rods
Methanobacterium 50–75°C pH 7–8 Filaments H 2 and CO 2,
thermoautotrophicum of long formate
rods
Methanothermus 60–97°C pH 6–7 Rods H 2 and CO 2
fervidus
Methanococcales
Methanococcus 20–40°C pH 7–9 Cocci with H 2 and CO 2
vannielii archaella
Methanocaldococcus 48–94°C pH 6–7 Cocci with H 2 and CO 2
jannaschii archaella
Methanomicrobiales
Methanoculleus 30–50°C pH 6–8 Cocci Acetate, complex
olentangii nutrients
Methanospirillum 20–45°C pH 6–7 Spirilla Acetate
hungatei
Methanopyrales
Methanopyrus kandleri 84–122°C pH 6–8 Long rods H 2 and CO 2
(2–14
μm)
Methanosarcinales
Methanosarcina barkeri 20–50°C pH 5–7 Aggregates H 2 and CO 2,
of cocci methanol,
methylamine,
acetate
Methanosaeta concilii 10–45°C pH 6–8 Filaments Acetate
of rods
Methanohalophilus 45°C pH 8–10 Cocci Methanol,
zhilinae methylamine,
dimethyl sulfide
Source: Harald Huber and Karl O. Stetter. 2002. The Prokaryotes. Springer.
Methanogens Show Diverse Cell Forms
Despite their metabolic similarity, methanogens display an astonishing diversity of
form, perhaps as diverse as the entire domain of bacteria (Fig. 19.24 ). For example,
Methanocaldococcus jannaschii cells grow as cocci with numerous archaella attached to
one side, while Methanosarcina mazei forms peach-shaped cocci lacking archaella.
Methanothermus fervidus cells are short, fat rods without archaella, and
Methanobacterium thermoautotrophicum grows as elongated rods reminiscent of the
bacterial genus Bacillus. Still others, such as Methanospirillum hungatei, form wide
spirals.
The morphological diversity of methanogens may be explained in part by their rigid
cell walls, which can maintain a distinctive shape. The composition of methanogen cell
walls is much more diverse than that of bacteria. Methanobacterium species have a cell
wall composed of pseudopeptidoglycan, or pseudomurein , a structure in which
chains of alternating amino sugars are linked by peptide cross-bridges analogous to
those of peptidoglycan (Fig. 19.25 ). The bacterial N -acetylmuramic acid, however, is
replaced by a related sugar, N -acetyltalosaminuronic acid, and the sugar linkage is
β(1,3) instead of β(1,4) as in bacteria. As a result, these archaea are resistant to
lysozyme, which degrades bacterial cell walls at the β(1,4) sugar linkage. The peptide
cross-bridges of pseudopeptidoglycan differ as well, causing resistance to penicillin
(discussed in Chapter 3).
FIGURE 19.25 ■ Methanobacteriales and other methanogenic species
have a cell wall of pseudopeptidoglycan between their membrane and S-
layer.
By contrast, Methanosarcina species have a cell wall composed of sulfated
polysaccharides. The genera Methanomicrobium and Methanococcus have protein-
derived cell walls.
Filamentous methanogens form chains of large cells similar to those of filamentous
cyanobacteria. Filaments of Methanosaeta perform a key function in the treatment of
sewage waste (Fig. 19.26 , presented in Section 22.2). In waste treatment, the raw
sewage first undergoes aerobic respiration by bacteria, in which the organic materials
are converted into small molecules such as CO 2 and acetate, and then the remainder is
digested anaerobically. The bacteria performing anaerobic decomposition become
trapped in filaments of Methanosaeta species, which convert bacterial fermentation
products such as acetate into methane and CO 2. The methanogenic filaments serve a
key function by trapping bacteria into granules that settle out from the liquid.
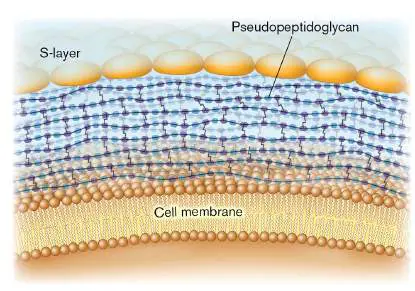
FIGURE 19.26 ■ Filamentous methanogens bind bacterial communities
in waste treatment. A. Raw sewage is aerated and decomposed by bacteria,
followed by anaerobic incubation. Under anaerobiosis, the bacterial waste products
are converted to methane and CO 2. The bacteria are packed together by
filamentous methanogens to form sludge. B. Sludge (wastewater sediment) forms
granules packed with bacteria and methanogens (discussed in Chapter 22). C.
Filamentous methanogens entangle bacteria, forming “flocs” that settle in the
waste treatment tank. Methanogens fluoresce green with a DNA probe, while other
wastewater microbes fluoresce blue (DAPI stain).
P. J. SALLIS ET AL. 2003. BIORESOUR. TECHNOL. 89 :255
NATUSCHKA M. LEE (TECHN. UNIVERSITY OF MUNICH, GERMANY) AND FRANK E. LÖFFLER (GEORGIA
INSTITUTE OF TECHNOLOGY, USA)
Methanogenesis in soil and landfills. A major methanogenic environment
is the anaerobic soil of wetlands. The wetlands that generate the most
methane are typically disturbed or artificial wetlands, particularly rice paddies,
which contain high levels of added fertilizer that bacteria convert to the substrates used
by methanogens. From the standpoint of the organism, methane is an incidental by-
product, but this product has great significance for our biosphere as a greenhouse gas
(discussed in Chapter 22).
Chinese farmers have found that one way to decrease methane production is to
drain the soils used for rice production. Changsheng Li and colleagues at the University
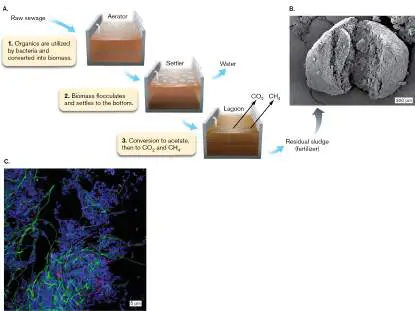
of New Hampshire showed in experimental plots that drained soil produces less
methane. The drained soil receives more oxygen, which blocks methanogenesis.
Draining soil also stimulates rice root development and accelerates decomposition of
organic matter in the soil to release nitrogen. Sufficiently dry rice paddy soil can
actually become a sink for atmospheric methane, thanks to methane-oxidizing bacteria.
Another major source of methanogens is landfills. Landfills such as those outside
New York City are among the largest human-made structures on Earth. They are rich in
organic wastes, which bacteria ferment to CO 2, H 2, and short-chain organic
molecules that methanogens convert to methane. As a result, large amounts of gas can
build up and spontaneously combust, causing explosions. To avoid explosions, the
methane needs to be piped out. In some cases, the gas can be collected and used to
generate electricity.
In Arctic tundra, from Alaska and Canada to Siberia, many psychrotrophic
methanogens lie buried. As the planet’s temperature increases, formerly frozen
regions thaw. Buried communities of bacteria activate their metabolism,
releasing fermentation products that include CO 2 and H 2. These molecules then serve
as substrates for methanogens. So much methane is released that, trapped beneath
ice, it can burst into flame (Fig. 19.27 ). Rising temperatures accelerate
methanogenesis, and the methane bubbles up so fast that it melts holes in the ice
sheets covering Arctic lakes. In 2012, Andrew McDougall and colleagues at the
University of Victoria, British Columbia, modeled the permafrost carbon release and its
feedback effect on global warming. They project that permafrost could release more
than a quarter of its carbon stores by the year 2100, and that this amount could add
another 1.5°C to the global temperature by the year 2300.
FIGURE 19.27 ■ Polar methane release. Dr. Katey Walter Anthony
determines if an Alaskan lake contains methane by igniting the gas flux.
UNIVERSITY OF ALASKA FAIRBANKS/NICHOLAS HASSON
Methane hydrates and Syntrophoarchaeota. Psychrophilic marine methanogens
grow at or beneath the seafloor. These seabed methanogens generate large volumes of
methane that seep up slowly from the sediment. Under the great pressure of the deep
ocean, the methane becomes trapped as methane gas hydrates, which are crystalline
materials in which methane molecules are surrounded by a cage of water molecules.
The methane hydrates accumulate in vast quantities. Methane hydrates are of interest
as a potential source of natural gas. But if a large part of this methane were to be
released, it could greatly accelerate global warming (discussed in Chapter 22).
Fortunately, much of the methane produced by seafloor methanogens is
oxidized to CO 2 by anaerobic methanotrophs. These methanotrophs are
methane oxidizers, classified as Anaerobic Methane-Oxidizing Euryarchaeota
(ANME), also known as Syntrophoarchaeota. The ANME euryarchaeotes oxidize
methane in syntrophy with sulfate-reducing bacteria such as Desulfobacterales
(discussed in Chapter 18). The bacteria reduce sulfate (abundant in seawater) to
sulfide. Coupled together, the reactions of methane oxidation and sulfate reduction
have the negative value of Δ G needed to drive metabolism for both kinds of
organisms.
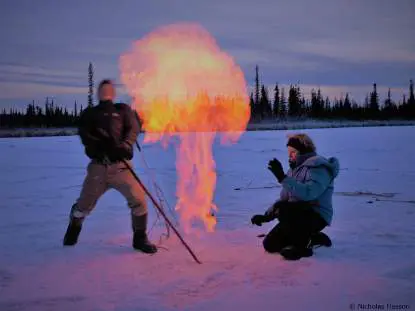
Digestive methanogenic symbionts. Numerous methanogens also grow within the
digestive fermentation chambers of animals such as termites and cattle (Fig. 19.28 ;
discussed in Chapter 21). Termites have to aerate their mounds continually in order to
remove methane; when rainfall temporarily clogs the mound, the mound can be ignited
by lightning and explode. Cattle support methanogenesis within their rumen and
reticulum (a common veterinary trick is to insert a tube into the rumen and ignite the
escaping methane gas). Bovine methanogenesis diverts carbon from meat production,
and it makes a significant contribution to global methane.
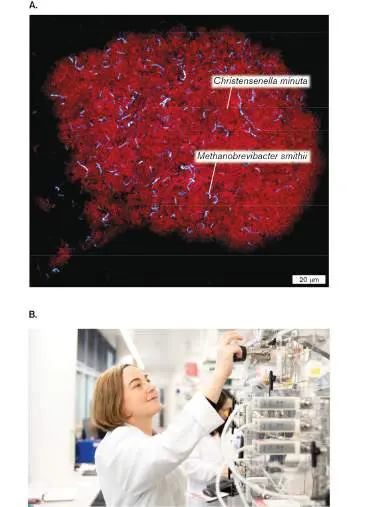
FIGURE 19.28 ■ Methanogens in the human gut microbiome. A.
Coculture of Methanobrevibacter smithii (blue fluorophore, FISH) and bacteria
Christensenella minuta (red fluorophore, FISH) from human gut microbiome. B.
Ruth Ley’s laboratory group at Max Planck Institute, Tübingen, Germany.
A. RUAUD ET AL. 2020. MBIO 11 :E03235–19
MAX PLANCK INSTITUTE FOR BIOLOGY TÜBINGEN
Methanogens also contribute to human digestion. Species such as
Methanobrevibacter smithii and Methanosphaera stadtmanae may constitute about
10% of gut anaerobes. Methanobrevibacter smithii increases the efficiency of digestion
by consuming excess reduced products (formate and H 2) from bacterial mixed-acid
fermentation (discussed in Chapter 13). High levels of H 2 inhibit bacterial NADH
dehydrogenases and thus decrease the proton potential for ATP production. Figure
19.28 shows a coculture of Methanobrevibacter smithii with a gut bacterium,
Christensenella minuta, obtained by the lab group of Ruth Ley at the Max Planck
Institute, Tübingen, Germany. Ley’s group showed that M. smithii metabolism is
intimately connected with that of the H 2 -producing bacteria, for a net energy yield
favorable to both—another example of syntrophy.
If methanogens influence the fermentation efficiency of gut bacteria, do
they affect the caloric content we obtain from food? Studies have found that
mice colonized with both Bacteroides thetaiotaomicron and M. smithii store
more fat after consuming the same quantity of food than do mice colonized solely with
B. thetaiotaomicron. Human studies suggest that methanogenesis may increase the
efficiency of gut bacterial catabolism and human fat storage. How the composition of
intestinal microbiota may influence obesity is discussed in Section 23.2.
Biochemistry of Methanogenesis
Methanogenesis is extremely important for our environment because the process
releases a potent greenhouse gas. Knowledge of methanogenic biochemistry may help
us develop ways to minimize methane output from cattle. For example, feeding red
seaweed to cattle decreases their methane release by 80%. How does this happen?
Cofactors for methanogenesis. The process of methanogenesis uses a
series of specific cofactors to carry each carbon from CO 2 (or other substrates)
as it becomes progressively reduced by hydrogen. The hydrogen atoms also require
redox carriers. Most of the cofactors are unique to methanogens, although the general
structural types resemble those of redox cofactors that we saw in Chapter 14 (Fig.
19.29 ). For example, cofactor F 420 is a heteroaromatic molecule (containing nitrogens
in the aromatic rings) that undergoes a redox transition by acquiring or releasing two
hydrogens (Fig. 19.29C )—a transition similar to that of the nicotinamide ring of
NADH.
FIGURE 19.29 ■ Cofactors for methanogenesis. Cofactors specific for
methanogenesis transfer the hydrogens and the increasingly reduced carbon to
each enzyme in the pathway. Inset: Ermias Kebreab, UC Davis, showed that
feeding seaweed to cattle inhibits methanogenesis by blocking the enzyme that
reduces methyl-coenzyme M.
ERMIAS KEBREAB
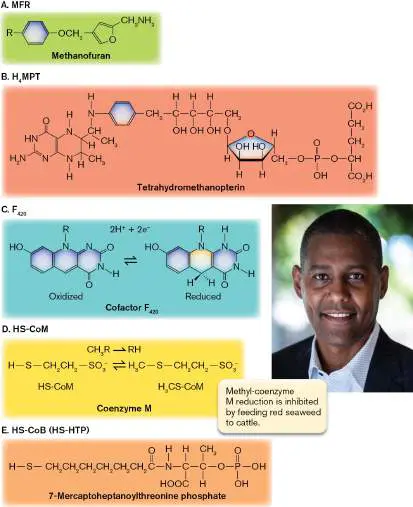
One key reaction in methanogenesis is the reduction of methyl-coenzyme M to form
methane. This reduction step can be inhibited by a halogenated defense molecule
produced by the red seaweed Asparagopsis. Ermias Kebreab, at UC Davis, showed that
feeding seaweed to cattle inhibits methanogenesis. Thus, by understanding the
biochemistry of methanogenesis, we could potentially decrease the global methane
emissions from cattle.
Methanogenesis from CO 2. The formation of methane from CO 2 and H 2 (Fig.
19.30 ) is technically a form of anaerobic respiration in which H 2 is the electron donor
and CO 2 is the terminal electron acceptor (discussed in Chapter 14). The process fixes
CO 2 onto the cofactor methanofuran (MFR) and then passes the carbon stepwise from
one cofactor to the next, each time losing an oxygen to form water or gaining a
hydrogen carried by another cofactor.
FIGURE 19.30 ■ Methanogenesis from CO 2 and H 2. All steps require
specific enzymes (not shown). A. At high [H 2], the initial incorporation of H 2
requires a coupled sodium potential (ΔNa +). The step from CH 3 –H 4 MPT to CH 3
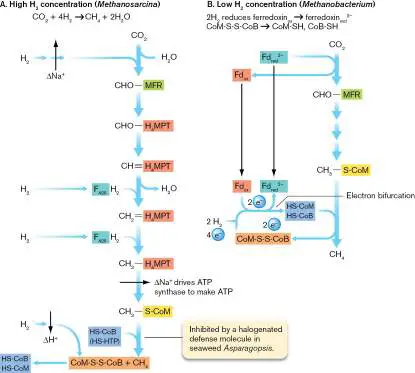
–S-CoM generates a transmembrane sodium potential (ΔNa +), which drives ATP
synthesis. B. At low [H 2], electron donation to ferredoxin (Fd) requires energy
input from coupled electron donation to CoM-S-S-CoB. This coupled process
involves electron bifurcation.
The first step in the conversion of CO 2 and H 2 to methane is fixing the carbon onto
methanofuran (for its chemical formula, see Fig. 19.29A ). This fixation step requires
reaction of protons with oxygen to form water. The mechanism of methanogenesis
depends on the available concentration of H 2. High-H 2 environments, such as oil
wells and sewage sludge, favor genera such as Methanosarcina (Fig. 19.30B ). The
high H 2 concentration allows electron donation to CO 2 from an electron transport
system (ETS). The ETS may provide energy from a sodium potential (ΔNa +). Most
methanogens require Na + for growth, unlike bacteria, many of which can grow without
sodium. Methanogenesis ultimately generates a Na + potential that drives ATP
synthesis. The sodium requirement of methanogens is something they share with
another division of Euryarchaeota, the halophiles (discussed in Section 19.5).
Other methanogens, such as Methanobacterium and Methanococcus, use much
lower concentrations of H 2 (<1/10,000 atm), common in soil or water. At lower
concentrations of substrate, the free energy change (Δ G) of reaction becomes less
favorable (discussed in Chapters 13 and 14). So the methanogen needs to couple CO 2
reduction to an energy-spending reaction, the reduction of CoM-S-S-CoB (Fig. 19.30B
). This coupling of an energy-spending electron transfer (CO 2 reduction via ferredoxin)
to an energy-yielding electron transfer (CoM-S-S-CoB reduction) is called electron
bifurcation. The cost of electron bifurcation (compared to the ETS used with high H 2)
is that fewer ATPs can be made, but it allows many more types of methanogens to
grow in a much wider range of natural habitats. Electron bifurcation is shown in Figure
19.30B .
Later steps in methanogenesis reduce the carbon with H 2 to methane. In the final
step, CoM-S-S-CoB serves as an anaerobic terminal electron acceptor for an ETS
accepting electrons from H 2. Overall, H 2 reduces CoM-S-S-CoB back to the two
cofactors HS-CoM and HS-CoB through an ETS, generating a proton motive force. The
proton motive force drives ATP synthase.
Another important feature of methanogenesis is that the enzymes catalyzing each
step require several transition metals. For example, the hydrogenase that reduces F 420
requires both nickel and iron. The enzyme catalyzing the reaction
CO 2 + methanofuran + 3H ⟶
CHO-methanofuran + H 2 O
requires either molybdenum or tungsten, depending on the species; some species have
two alternative enzymes, depending on which metal is available. Another metal, cobalt,
is required for a B 12 -related cofactor that participates in methane production from
methanol and methylamines.
Thought Question
19.6 What do the multiple metal requirements suggest about how and where the
early methanogens evolved?
Methanogenesis from acetate. Methane production from acetate is particularly
important for wastewater treatment, where most of the substrate consists of short-
chain bacterial fermentation products. The acetate methanogenesis pathway is not fully
understood, but the initial incorporation of H 2 probably requires a coupled gradient of
sodium ion, as it does for CO 2 methanogenesis. The two carbons from acetate enter
different pathways, which eventually converge:
CH 3 −S-CoM + HS-CoB ⟶ CH 4 + CoM-S-S-CoB
To Summarize
Methanogens gain energy through redox reactions that generate
methane by using H 2 to reduce CO 2, formate, acetate, and other small
molecules. Methanogens require association with bacteria whose fermentation
generates the needed substrates.
Methanogens have rigid cell walls of diverse composition in different
species , including pseudopeptidoglycan, protein, and sulfated polysaccharides.
Species of methanogens show a wide range of different shapes ,
including rods (single or filamentous), cocci (single or clumped), and spirals.
Methanogens inhabit anaerobic environments such as wetland soil, marine
benthic sediment, and animal digestive organs.
Methanobrevibacter smithii and Methanosphaera stadtmanae are the
main methanogens of the human colon. They show possible involvement with
caloric efficiency of digestion.
Biochemical pathways of methanogenesis involve transfer of the
increasingly reduced carbon to cofactors that are unique to methanogens.
Glossary
Anaerobic Methane-Oxidizing Euryarchaeota (ANME) or anaerobic methane oxidizers
A group of archaea in the superphylum Euryarchaeota that oxidize methane. Some,
such as the Methanoperedenaceae, oxidize methane independently whereas
others oxidize methane syntrophically with sulfate-reducing bacteria (SRB).
methanogen
An archaeon that uses hydrogen to reduce CO 2 and other single-carbon
compounds or acetate to methane, yielding energy. Clades of methanogens branch
within the superphylum Euryarchaeota.
methanogenesis
An energy-yielding metabolic process that releases methane, commonly from
hydrogen gas and oxidized one- or two-carbon compounds. It is unique to archaea.
syntrophy
Metabolic cooperation between two different species; usually one member releases
a product whose removal by the second species enables the pair to metabolize
with a negative value of Δ G.
pseudopeptidoglycan or pseudomurein
A peptidoglycan-like molecule composed of sugars and peptides that is found in
some archaeal cell walls.
methane gas hydrate
A crystalline material in which methane molecules are surrounded by a cage of
water molecules. This molecular configuration is found in the deep ocean.
electron bifurcation
A biochemical reaction in which an electron transfer that yields energy is coupled
to an electron transfer that consumes energy.
Figure 19.5
FIGURE 19.5 ■ Archaeal phylogeny. Major superphyla, phyla, and orders
of Archaea. Divergence is based approximately on small-subunit ribosomal
RNA (SSU rRNA) and genome sequences. (See Table 19.2 for abbreviations.)
Inset: Thijs Ettema.
COURTESY OF THIJS ETTEMA
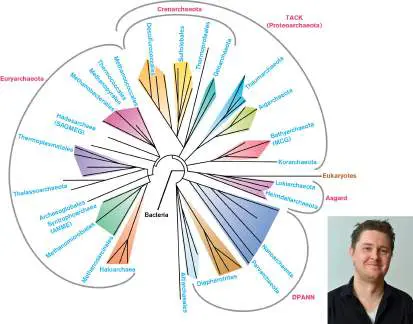
19.5 Haloarchaea and Other Euryarchaeotes: Underground and Under Oceannot assigned
In the saturated brine of Utah’s Great Salt Lake or Israel’s Dead Sea, few living
things can grow except for halophilic euryarchaeotes called Haloarchaea.
Elsewhere, still other euryarchaeotes include sulfur hyperthermophiles. Some are
also acidophiles—hyperthermoacidophiles that grow under the most extreme acid
as well as high temperatures.
Haloarchaea: Life in Salt
The halophilic archaea require at least 1.5-M NaCl or equivalent ionic strength, and
most grow optimally at near saturation (about 4.3 M, seven times the
concentration of seawater). Salted foods such as meat and fish and salt-cured
hides can be spoiled by haloarchaea.
Most haloarchaea belong to a monophyletic clade that was formerly named
Halobacteria, before the archaea were classified as distinct from bacteria.
Haloarchaea show relatedness to methanogens (Fig. 19.5), but they do not
conduct methanogenesis. Most haloarchaea grow as photoheterotrophs, using light
energy to drive a retinal-based ion pump to establish a proton potential. Their
photopigments color salterns, brine pools that are evaporated to mine salt (Fig.
19.31A ). The red pigment bacterioruberin protects cells from damage by light (
Fig. 19.31B ).
FIGURE 19.31 ■ A saltern for salt production. A. Aerial view of a solar
saltern facility in Grantsville, Utah. B. The red pigment bacterioruberin protects
Haloarchaea from damage by light.
COURTESY OF DON GREEN PHOTOGRAPHY
Note: The terms “Halobacteria” and “Haloarchaea” are synonymous; all
members of this clade are indeed archaea. Outside the Haloarchaea, true bacteria
that grow in elevated NaCl are called halophilic bacteria or bacterial halophiles.
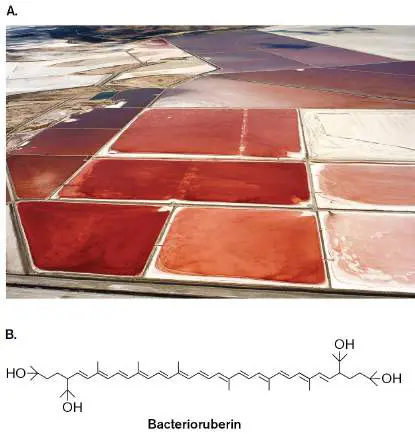
Haloarchaeal form and physiology. Halophilic microbes need a way to
maintain turgor pressure; that is, to avoid cell shrinkage as cytoplasmic water runs
down the osmotic gradient toward external high salt. Most bacterial halophiles
compensate for high external salt by uptake or synthesis of other kinds of
osmolytes, such as small organic molecules. Haloarchaea, however, adapt to high
external NaCl by maintaining a high intracellular concentration of potassium
chloride (about 4-M KCl). Potassium ion concentrations are moderately high in
most microbial cells (commonly 200 mM), but the exceptionally high KCl
concentration within haloarchaea requires major physiological adaptations:
High GC content of DNA. High salt concentration decreases the fidelity in
base pairing of DNA. Because the triple hydrogen bonds of GC pairs hold more
strongly than the double hydrogen bonds of AT pairs, the exceptionally high
GC content of haloarchaea (above 60% for most species) may protect their
DNA from denaturation in high salt.
Acidic proteins. Most haloarchaeal proteins are highly acidic, with an
exceptional density of negative charges at their surface. The high negative
charge maintains a layer of water in the form of hydrated potassium ions (K +
). This unusual hydration layer keeps the acidic proteins soluble in the high
salt within the cytoplasm.
The high salt content of haloarchaea provides a convenient way to lyse cell
contents for analysis: Simply transfer cells into low-salt buffer, and they fall apart
owing to osmotic shock. This technique provides a quick way for beginning
students to isolate DNA. This and other techniques have made the organism
Halobacterium sp. NRC-1 a model system for molecular biology education.
The properties of diverse halophiles are presented in Table 19.5 . The
haloarchaea are generally uniform with respect to temperature range (mesophilic).
With respect to pH, some halophiles grow at neutral pH, whereas others are
alkaliphiles, growing in soda lakes above pH 9, such as Lonar Lake, Maharashtra
State, India. The cell envelopes of most haloarchaea contain rigid cell walls of
glycoprotein, as do some of the methanogens. Most species possess archaella for
phototaxis and gas vesicles for maintaining their buoyancy in the upper layer of the
water column. Unlike phospholipid vesicles, gas vesicles are made entirely of
protein, and they are filled with air.
TABLE 19.5 Halophilic Archaea
NaCl Growth Location
Representative range temperature Growth of
species (M) (°C) pH Cell shape isolate
Haloarcula 2.7– 53°C pH 7 Square flat; Sabkha, quadrata 4.3 pleomorph Sinai,
ic Egypt
Haloarcula 3.5– 40°C pH 7.5 Pleomorphic Salt valismortis 4.3 rods pools,
Death
Valley,
CA
Halobacterium 3.0– 35–50°C pH 7 Rods Salted salinarum 5.2 cowhid
e
Halococcus 2.5– 30–45°C pH 7 Cocci Dead morrhuae 5.2 Sea,
Israel
Haloferax 1.5– 40°C pH 7 Pleomorphic; Dead volcanii 5.2 dish-Sea,
shaped Israel
Halorubrum 1.5– 1–44°C pH 7 Long rods Deep lacusprofundi 5.2 (12 μm) Lake,
Antarcti
ca
Natronococcus 1.4– 30–45°C pH 9.5 Cocci Lake occultus 5.2 Magadi
, Kenya
Natronomonas 2.0– 45°C pH 9–10 Rods Wadi El pharaonis 5.2 Natrun,
Egypt
Sources: Aharon Oren. 2006. The order Halobacteriales. In M. Dworkin et al. (eds.), The
Prokaryotes, Vol. 3. Springer. The Halorubrum lacusprofundi growth temperature range comes
from Ricardo Cavicchioli. 2006. Nat. Rev. Microbiol. 4 :331.
Shiladitya DasSarma at the University of Maryland School of Medicine proposed
to use recombinant gas vesicles of Halobacterium NRC-1 as a delivery vehicle for
recombinant vaccines against typhoid bacteria. The recombinant haloarchaeal
vaccine can be embedded in salt crystals (Fig. 19.32 )—a cheap and convenient
delivery method for developing countries where typhoid is widespread.
FIGURE 19.32 ■ Pink-pigmented salt crystals deliver haloarchaeal vaccine. Halobacterium NRC-1 embedded in salt crystals contain gas vesicles
formed of a recombinant protein. The protein is harvested as a vaccine.
Crystals are held here by Shiladitya DasSarma.
PERMISSION FROM BALTIMORE SUN MEDIA. ALL RIGHTS RESERVED
With respect to cell shape, Haloarchaea display considerable diversity. Some
species form symmetrical rods, as in Halobacterium NRC-1. Other species form
pleomorphic cells, flattened like pancakes, and still others form regular cocci (
Haloferax mediterranei; Fig. 19.33A). A few species grow as flattened squares— the only microbial cells known to be square (Haloquadratum walsbyi; Fig.
19.33B and C ). The mechanism that maintains the various shapes is unknown.
In oligotrophic (low-nutrient) environments, it is likely that the greater surface-to-
volume ratio gives flattened cells a competitive edge in obtaining nutrients.
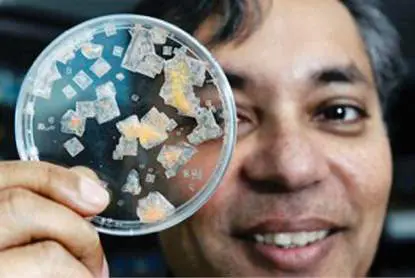
FIGURE 19.33 ■ Diverse haloarchaea. A. Haloferax mediterranei (SEM). B. Square haloarchaea (Haloquadratum walsbyi) during their sixth round of
cell division, which alternates in vertical and horizontal directions
(photomicrograph, Nomarski optics). C. Cross-sectioned cells of square
haloarchaea show their thinness (TEM).
EYE OF SCIENCE/SCIENCE SOURCE
W. STOECKENIUS. 1981. J. BACTERIOL. 148 :352–360
M. KESSEL AND Y. COHEN. 1982. J. BACTERIOL. 150 :851–860
Hypersaline habitats. Hypersaline (high-salt) habitats differ with respect to pH,
temperature, and the presence of other minerals, such as magnesium ion.
Different kinds of hypersaline habitats support different species of haloarchaea (
Table 19.5 ), as well as halophilic bacteria. Major types of habitats include:
Thalassic lakes. Thalassic lakes (from the Greek thalassa, meaning
“ocean”), such as the Great Salt Lake in Utah, contain saturated salts with
ionic proportions similar to those of the ocean: Na + and Cl − (NaCl)
predominate, followed by Mg 2+, K +, and SO 4 2−. Thalassic lakes (also
called brine lakes) support genera such as Halobacterium. Antarctic brine lakes support growth of cold-adapted halophiles such as Halorubrum lacusprofundi.
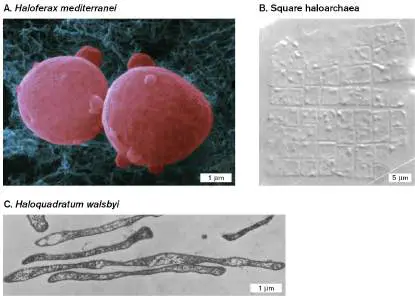
Athalassic lakes. Athalassic lakes, such as the Dead Sea in Israel, contain
higher proportions of magnesium ions. These habitats favor genera such as
Haloarcula species, which require 100 mM Mg 2+ for growth and grow best at
magnesium concentrations above 1 M.
Solar salterns. These are artificial pools of brine, or saturated NaCl, that
evaporate in sunlight, precipitating halite (salt crystals) for commercial
production. Commercial evaporation pools for salt actually benefit from the red
microbes, whose light absorption accelerates heating and evaporation.
Brine pools beneath the ocean. Undersea brine pools collect near
geothermal vents, as in the Gulf of Mexico, Mediterranean Sea, and Red Sea.
These hypersaline regions contain salts brought up by vent water. They
support hyperthermophilic halophiles.
Alkaline soda lakes , such as Lake Magadi in Kenya, where carbonate salts
drive the pH above pH 9. These lakes support alkaliphilic haloarchaea such as
Halobacterium.
Underground salt deposits contain micropockets of salt-saturated water
where halophiles may survive for thousands of years.
Retinal-based photoheterotrophy. Most haloarchaea are photoheterotrophs,
in which light-directed energy acquisition supplements respiration on complex
carbon sources.
Haloarchaea respire with oxygen or anaerobically with nitrate. A typical habitat
for haloarchaea starts out as a pool with moderate salt content, containing a range
of bacterial and archaeal species with varied tolerance to salt. As the pool
evaporates, the salt concentrates, and the various bacteria die and lyse, releasing
cell components that the haloarchaea can metabolize. The halophiles supplement
their utilization of organic substrate energy by using light-driven ion pumps.
Respiration is supplemented by light-driven proton pumps containing retinal.
Light in the green-yellow range is captured by retinal-containing proton pumps
called bacteriorhodopsin and the chloride pump halorhodopsin (Fig. 19.34 ).
(The role of light-driven ion pumps in phototrophy is discussed in Chapter 14.) The
proton pump bacteriorhodopsin was named to indicate that it is a prokaryotic
version of the better-known eukaryotic retinal rhodopsins; the name was chosen
before the domain Archaea was recognized. The chloride pump halorhodopsin was
discovered and named in reference to the chloride ion (a halide). The two proteins
are homologs with similar structure and mechanism. In the cell membrane, they
form complexes that aggregate in patches called purple membrane.
FIGURE 19.34 ■ Light-driven ion pumps and sensors. A.
Bacteriorhodopsin absorbs light and pumps H + out of the cell (PDB code:
1QKO), whereas light-activated halorhodopsin pumps chloride into the cell (not
shown). B. Rhodopsin family molecules in the membrane of Halobacterium:
bacteriorhodopsin, light-driven proton extrusion; halorhodopsin, light-driven
chloride intake; sensory rhodopsins I and II, with their signal transduction
proteins Htr I and Htr II. The sensory transduction proteins phosphorylate and
dephosphorylate a protein that regulates the direction of rotation of the
flagellar motor.
Each bacteriorhodopsin proton pump contains seven alpha helices that traverse
the membrane (Fig. 19.34A ), surrounding a buried molecule of retinal, the same
light-absorbing molecule found in photoreceptors of the human retina. Light
absorption triggers a conformational change that enables a proton from the
cytoplasmic face to be picked up by an aspartate residue. The proton is then
transferred stepwise through several other amino acid residues in the protein,
leading to release of the proton outside the cell. The net result of proton transfer
by bacteriorhodopsin is generation of a proton motive force that can run a proton-
driven ATP synthase, storing energy as ATP (Fig. 19.34B ).
Halorhodopsin has a similar structure, in which chloride (instead of H +) is
pumped into the cell instead of outward. Because chloride is negatively charged,
this chloride transport contributes to the proton motive force. Light-driven chloride
pumps are unique to haloarchaea.
Haloarchaea also possess homologs of bacteriorhodopsin that serve as sensory
devices: the sensory rhodopsins I and II. These proteins, too, each have seven
alpha helices containing retinal. When the sensory rhodopsins absorb light, they
signal the cell to swim using its archaella. The activated sensory rhodopsin I
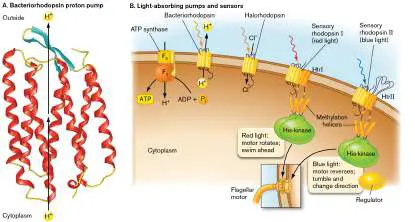
directs the cell to swim toward red light. Sensory rhodopsin II is activated to
reverse the archaellar motor and make the cell swim away from blue and
ultraviolet light, which causes photooxidative damage to DNA. The rhodopsins
signal through the chemotaxis machinery to the archaellar motor, using histidine
kinase enzymes that phosphorylate regulatory proteins (see Fig. 19.34B ). This
response to light, or phototaxis, is an important model for archaeal molecular
regulation.
Anaerobic haloarchaea. Until recently, all haloarchaea were thought to be
aerobic or facultative respirers—essentially, heterotrophs with an added boost from
light-driven ion pumps. In 2016, Dmitri Sorokin’s group at the Russian Academy of
Sciences, Moscow, discovered a strictly anaerobic haloarchaeon (Hal anaero archaeum) from a Siberian chloride-sulfate lake. This anaerobe requires 3-to 5-M
NaCl and oxidizes acetate with sulfate, a form of sulfate respiration (discussed in
Chapter 14). A related genus from anaerobic sediment of a brine lake was shown
to oxidize H 2 or formate with sulfur. Thus, the known metabolic capacity of
Haloarchaea has been expanded to include anaerobes with sulfur reduction.
Hot and Hotter: Thermococcales and Archaeoglobales
A major group of hyperthermophilic euryarchaeotes is the order Thermococcales,
including genera such as Thermococcus and Pyrococcus (Fig. 19.35). These
genera are most commonly isolated from thermal vents at the ocean floor and
from submarine solfataras, volcanic vents that emit only gases. Besides high
temperature, most of these microbes experience high pressure (they are
barophiles). Most Thermococcales are anaerobes that ferment complex carbon
sources such as peptides or carbohydrates. Despite deep genetic divergence, their
traits superficially resemble those of TACK (crenarchaeote) sulfur
hyperthermophiles. Unfortunately, their names also are similar.
FIGURE 19.35 ■ Hyperthermophilic Euryarchaeota. Pyrococcus horikoshii, isolated from a hydrothermal vent at the Okinawa Trough (TEM).
J. GONZALES ET AL. 1998. EXTREMOPHILES 2 :123–130
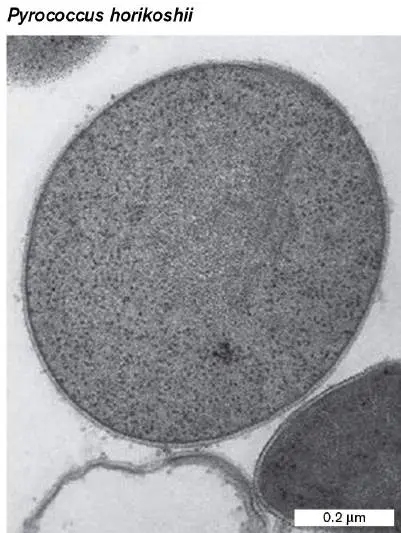
Note: Distinguish the euryarchaeotes Thermococcus and Pyrococcus from the TACK genera Thermoproteus and Pyrodictium, respectively.
Sulfur reducers and oxidizers. Most Thermococcus and Pyrococcus species grow at temperatures well above 90°C; Pyrococcus woesei, for example, grows at
temperatures as high as 105°C. Their growth is accelerated by the use of
elemental sulfur as a terminal electron acceptor for anaerobic respiration:
2H + + 2 e − + S 0 ⟶ H 2 S
Alternatively, these species can oxidize molecular hydrogen with sulfur:
H 2 + S 0 ⟶ H 2 S
Species of Thermococcales are the source of “vent polymerases” for PCR
amplification. They now replace the enzyme Taq polymerase obtained from the
Yellowstone hot-spring bacterium Thermus aquaticus, which grows only at
temperatures up to 90°C. The Taq enzyme has only limited stability at or above
95°C, but DNA polymerases with greater stability at higher temperatures and
increased accuracy in replication have been produced from vent-dwelling archaea
such as Pyrococcus furiosus and Thermococcus litoralis. These vent polymerases
now allow higher-temperature denaturation and synthesis of GC-rich sequences
that were difficult to amplify with the original thermostable enzyme.
The first member of Thermococcales whose genome was sequenced was
Pyrococcus abyssi. (Remember to distinguish Pyro coccus abyssi from the TACK species Pyro dictium abyssi.) The genome of Pyrococcus abyssi reveals an
especially high number of eukaryotic homologs for DNA replication, transcription,
and protein translation. Examples of homologs include the eukaryotic-like primase,
helicase, and endonuclease for generation of Okazaki fragments in the lagging
strand of DNA synthesis. At the same time, the Pyrococcus genome also shows bacterial homologs for cell division and DNA repair. Thus, Pyrococcus abyssi offers
a striking view of mixed heritage from the common ancestor of the three domains.
Pyrococcus species possess enzymes conducting most of the classic conversions
of the EMP pathway of glycolysis, but several steps use enzymes unrelated to
those in bacteria. Examples include two ADP-dependent enzymes—glucokinase and
phosphofructokinase—as well as the phosphate-independent enzyme
glyceraldehyde 3-phosphate ferredoxin oxidoreductase. The glyceraldehyde 3-
phosphate conversion is unique in that it sidesteps the use of inorganic phosphate,
which is required at this step by bacterial glycolysis (shown in Fig. 19.6).
Pyrococcus and other members of Thermococcales have enzymes requiring
tungsten, a metal rarely required outside the archaea. (Tungsten is present in
elevated concentrations at hydrothermal vents.) Another unusual feature of
Pyrococcus is that both proton motive force generation and the ATP synthase
appear to involve a Na + /H + antiport system. This dependence on sodium is a
trait shared with the methanogens and the halophiles.
Thought Question 19.7 Compare and contrast the metabolic options available for Pyrococcus and for the TACK organism Sulfolobus.
Archaeoglobales reduce sulfate and reverse methanogenesis. While many
benthic archaea reduce sulfur (S 0), only one clade, Archaeoglobales, is known to
reduce sulfate ion (SO 4 2−) without a bacterial partner. Archaeoglobus fulgidus
reduces sulfate by way of an acetyl-CoA degradation pathway that reverses part of
methanogenesis. This process may be important for eliminating methane from
methane hydrates before they release gas to the atmosphere.
Life in Hot Acid: Thermoplasmatales
A clade whose habitat is extreme even by archaeal standards is
Thermoplasmatales. This clade includes thermophilic acidophiles with no cell wall
and no S-layer, but only a plasma membrane. How they maintain their cells against
the most extreme conditions known on Earth is poorly understood.
An example is a thermophile isolated from self-heating coal refuse piles,
Thermoplasma acidophilum, growing at 59°C and pH 2. Thermoplasma cells are
motile, but it is unclear how their archaella maintain a torque against the
membrane without a rigid envelope or S-layer for support. The metabolism of T. acidophilum, like that of Pyrococcus, is sulfur (S 0) respiration of organic
molecules.
The genome sequence of T. acidophilum contains just 1.5 million base pairs—
one of the smallest known for a free-living organism. It shows substantial evidence
of horizontal transfer from Sulfolobus, a TACK hyperthermophile that shares the
same range of habitats. Horizontal transfer between distant relatives turns out to
be common among the hyperthermophiles. For example, T. acidophilum has genes
encoding an entire protein degradation pathway that was transferred horizontally
from an ancestor of Sulfolobus.
Another acidophilic genus of the order Thermoplasmatales is Ferroplasma (Fig. 19.36). Ferroplasma species are mesophiles or thermophiles, found in mines
containing iron pyrite ore (FeS 2). Using dissolved Fe 3+ as an oxidizing agent in
the presence of H 2 O, they oxidize the sulfur to sulfuric acid. The chemical
equation is:
FIGURE 19.36 ■ The extreme acidophile Ferroplasma. A. Ferroplasma acidiphilum grows at pH 0 (TEM). B. Streamers of F. acidarmanus anchored to
deposits of pyrite within the Iron Mountain mine in California. The stream is
about a meter across, its water about pH 0. This level of acidity will dissolve a
metal shovel in a day.
T. A. PIVOVAROVA ET AL. 2002. MICROBIOLOGY 71 :698–706
K. J. EDWARDS ET AL. 2000. SCIENCE 287 :1796
FeS 2 + 14Fe 3+ + 8H 2 O ⟶ 15Fe 2+ + 2SO 4 2− + 16H +
The reaction generates pH values below pH 0 (1-M H +). This degree of acidity
can dissolve a metal shovel within a day.
The amorphous cells of Ferroplasma acidarmanus grow in biofilms that
form long streamers into water draining from the mine (Fig. 19.36B ).
The oxidative disintegration of iron-bearing ores can be useful for leaching
of minerals, but it also causes acid mine drainage into aquatic systems (discussed
in Chapter 22).
Thought Question 19.8 Compare and contrast sulfur metabolism in Pyrococcus and in Ferroplasma.
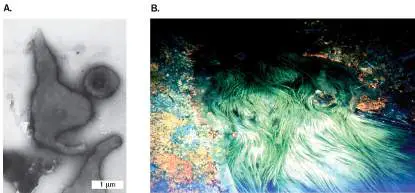
To Summarize
Haloarchaea are extreme halophiles , growing in NaCl at a
concentration of at least 1.5 M. They are isolated from salt lakes, solar
salterns, underground salt micropockets, and salted foods.
Haloarchaea show diverse cell shapes , including slender rods (
Halobacterium), cocci (Halococcus), and flat squares (Haloquadratum).
The cell envelopes of most haloarchaea contain rigid cell walls of
glycoprotein. Gas vesicles enable haloarchaea to remain near the top of the
water column.
Molecular adaptations to high salt include DNA of high GC content and
acidic proteins (proteins with a high number of negatively charged
residues).
Retinal-based photoheterotrophy involves the proton pump
bacteriorhodopsin or the chloride pump halorhodopsin. Both pumps contain
retinal for light absorption.
Thermococcales are hyperthermophiles. Most species use sulfur to
oxidize complex organic substrates.
Pyrococcus and Thermococcus are the source of vent polymerases
for PCR. Thermococcal enzymes notably use tungsten at their active site.
Archaeoglobus hyperthermophiles reduce sulfate and oxidize
benthic methane hydrates. The methyl group of acetate is oxidized to
CO 2 by partly reversing methanogenesis.
Thermoplasmatales includes extreme acidophiles. Ferroplasma
oxidizes iron pyrite ore (FeS 2) in a process that generates concentrated
sulfuric acid, causing acid mine drainage.
Glossary
Haloarchaea
A monophyletic clade of Euryarchaeota that contains extremely halophilic
archaea, inhabiting high-salt environments. Formerly known as Halobacteria.
gas vesicle
An organelle that traps gases to increase the buoyancy of aquatic microbes.
bacteriorhodopsin
A haloarchaeal membrane-embedded protein that contains retinal and acts as
a light-driven proton pump; it is homologous to the bacterial proteorhodopsin.
halorhodopsin
A haloarchaeal membrane-embedded protein that contains retinal and acts as
a light-driven chloride pump; it is homologous to bacteriorhodopsin.
Thermoplasmatales
An order of extreme thermoacidophiles in the Euryarchaeota superphylum.
Fig. 19.5
FIGURE 19.5 ■ Archaeal phylogeny. Major superphyla, phyla, and
orders of Archaea. Divergence is based approximately on small-subunit
ribosomal RNA (SSU rRNA) and genome sequences. (See Table 19.2 for
abbreviations.) Inset: Thijs Ettema.
COURTESY OF THIJS ETTEMA
Fig. 19.6
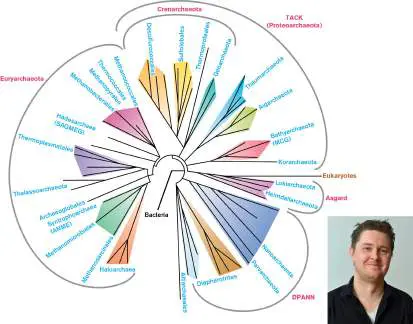
FIGURE 19.6 ■ Glucose catabolism in archaea. Left: Sulfolobus and Thermoplasma species catabolize glucose to pyruvate via a modified
ED pathway without phosphorylating glucose and produce no net ATP.
Right: Halobacterium species phosphorylate 2-oxo-3-deoxygluconate and produce one net ATP via the EMP stage 2 pathway. Pyrococcus furiosus
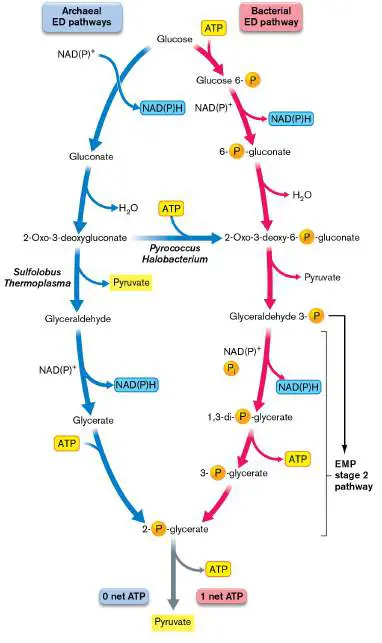
oxidizes glyceraldehyde 3-phosphate using ferredoxin instead of NAD +
and avoids phosphorylation.
19.6 DPANN Symbionts, Altiarchaeales, and Asgard: Branch to Eukaryotesnot assigned
The DPANN superphylum includes several deeply branching clades of ultrasmall cells that have shrunken genomes, have lost major metabolic pathways, and appear to require a symbiotic partner. They are most commonly found in freshwater and marine environments. A related group, Altiarchaeales, is free-living and shows unusual harpoon-like appendages called “hami.” Finally, the deeply branching Asgard group includes marine thermophiles that may be the most closely related to the domain Eukarya.
Nanoarchaeota: Parasites on a Hyperthermophile
The best-studied clade of the DPANN superphylum is the Nanoarchaeota. The cultured species Nanoarchaeum equitans consists of exceptionally small cells that are obligate symbionts of the TACK hyperthermophile Ignicoccus presented earlier (Fig. 19.1). The Ignicoccus-Nanoarchaeum isolates were obtained from Kolbeinsey Ridge hydrothermal vents. The host cell may harbor up to four of the smaller cells (Fig. 19.37A). The N. equitans cell in Figure 19.37B is attached to I. hospitalis by a membrane bridge, which has been shown to connect the intracellular membrane tubules of Ignicoccus. How the Nanoarchaeum symbiont maintains this intimate connection is unknown.
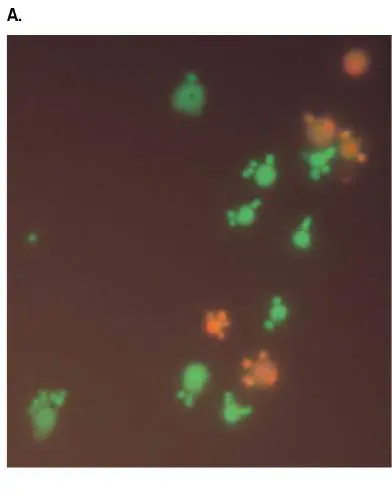
FIGURE 19.37 ■ Nanoarchaeum equitans, a small obligate symbiont attached to Ignicoccus hospitalis. A.
Each Ignicoccus hospitalis cell here has one to four attached cells of Nanoarchaeum equitans. Fluorescence microscopy. Green (live cells); orange (dead cells). B. Ignicoccus, showing intracellular compartment and one cell of N. equitans attached by a membrane bridge (arrow; TEM).
U. JAHN ET AL. 2008. J. BACTERIOL. 190 :1743, FIG. 2B
U. JAHN ET AL. 2008. J. BACTERIOL. 190 :1743. REPRODUCED WITH PERMISSION
FROM AMERICAN SOCIETY FOR MICROBIOLOGY
Both host and symbiont genomes have been sequenced, revealing extensive coevolution of the two. The N. equitans genome is exceptionally small (less than 500 kb) and shows evidence of rapid degenerative evolution. The diminished genome is typical of a dependent organism that has lost numerous genes for functions now
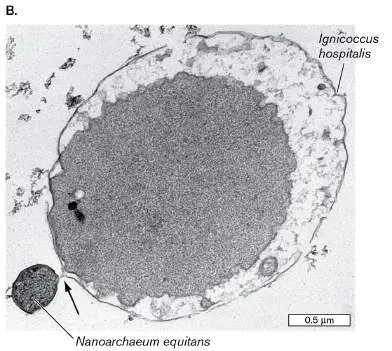
provided by a host. Growth rate comparisons show that the host I. hospitalis grows faster in the absence of N. equitans; thus, N. equitans is inferred to be a parasite. It remains unclear, however, whether N. equitans makes any metabolic contribution to its host. Members of other DPANN phyla, such as Diapherotrites, are identified from marine and underground sources. They show evidence of evolutionary gene loss as symbionts, but also the gain of some bacterial genes that may offer free-living alternatives. Their genes encoding SSU rRNA show multiple differences from the sequences generally used as primers for PCR amplification. Thus, it is hard to identify such organisms, much less study them.
Altiarchaeales: Archaea with Grappling Hooks
An interesting archaeon, Altiarchaeum hamiconexum, was found in sulfide-rich marsh water from the Sippenauer Moor in Germany. First known as the SM1 euryarchaeon, the microbe was discovered in 2004 by Rudolph Huber and his students at the University of Regensburg, Germany. These archaea fix CO 2 by an unusual pathway related to methanogenesis.
A surprising trait of Altiarchaeum was discovered by Christine Moissl-Eichinger. Her students showed how this organism forms netlike biofilms by use of pilus-like grappling-hook appendages called hami (singular, hamus; Fig. 19.38). Each grappling hook contains paired barbs along an extended protein filament many times the length of the cell.
FIGURE 19.38 ■ Altiarchaeum forms chains with grappling hooks (hami). Inset: Christine Moissl-Eichinger.
ALEXANDRA K. PERRAS ET AL. 2014. FRONT. MICROBIOL. 5 :397
MARTIN WIESNER
The filament ends with a triple fishhook that enables filaments to clasp neighboring cells in a biofilm matrix (Fig. 19.39). No other kind of cell is known to make this type of appendage.
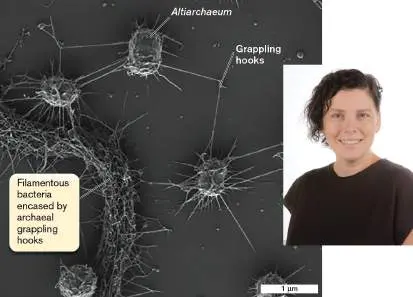
FIGURE 19.39 ■ Grappling hooks (hami) of Altiarchaeum species. A. Hooked appendages extending from a cell (TEM). B. Cryo-electron tomography model of a grappling hook (hamus).
ALEXANDER K. PERRAS ET AL. 2014. FRONT. MICROBIOL. 5 :397
CHRISTINE MOISSL ET AL. 2005. MOL. MICROBIOL. 56 :361, FIG. 4C
The matrix of grappling hooks also coats filaments of sulfide-oxidizing bacteria that may cooperate with Altiarchaeum. Thus, this archaeon represents yet another type of intimate community involving archaea.
Asgard, the Norse Gods Superphylum
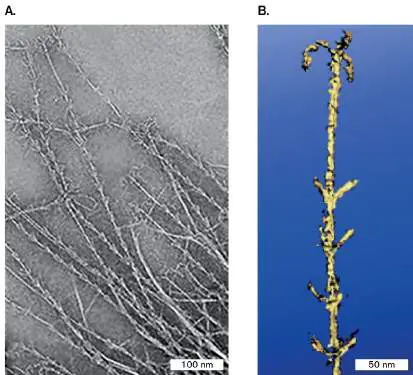
The superphylum Asgard (meaning “world of the gods”) was named for its inclusion of the Lokiarchaeota, originally identified from a hydrothermal ridge known as Loki’s Castle. Related deeply branching phyla were fancifully named for other Norse gods, such as Heimdallarchaeota. Asgard genomes have been sequenced from various marine and freshwater sediments. All show such deeply branching divergence that standard SSU rRNA primers may fail to amplify their DNA.
Asgard genome sequences show genes with unusual similarity to signature genes of the domain Eukarya, such as those encoding components of cytoskeleton, signal transduction, and nucleocytoplasmic transport. Some Asgard archaea possess chromosomal histone proteins with N-terminal “tails” like those that regulate gene expression in eukaryotes. The archaeal phylogenetic tree, as computed by Thijs Ettema and co-workers (Fig. 19.5), shows the domain Eukarya branching from the Lokiarchaeota lineage. These sequence data are evidence that the original eukaryotic ancestor evolved from an Asgard ancestor that later acquired Alphaproteobacterial symbionts such as mitochondria.
The placement of many deep-branching clades, including the Eukarya branch, remains controversial. The sequences diverge so deeply that small adjustments in tree computation may yield different branch points for distant clades.
One artifactual effect that may occur is called long branch attraction (Fig. 19.40), a phenomenon in which two fast-evolving lineages show such a large number of sequence mismatches that their sequences actually appear more similar to each other than to more closely related lineages that evolve more slowly. Long branch attraction occurs because each sequence position has only four possible base pairs, so as the rate of DNA mutation increases, the chance increases that two distant lineages might independently change to the same base at a given position. Thus, two distantly evolved lineages may branch together because they share dissimilarity to more slowly evolving organisms. Further study of emerging genomes, and the culturing of live isolates, may help resolve the fascinating question of the origin of eukaryotes. FIGURE 19.40 ■ Long branch attraction. Two fast-evolving lineages may show such a large number of sequence mismatches that their sequences actually appear more similar to each other than to more closely related lineages that evolve more slowly. Overall, species of archaea inhabit a wider range of environments than either bacteria or eukaryotes do—from extreme heat to extreme cold, from high pH to extreme acid, as well as temperate environments such as soil and animal digestive tracts. Archaea show unique cell structures, such as grappling-hook appendages, and unique forms of metabolism, such as methanogenesis. Yet we probably know less about the actual scope of Archaea than we do about the other two domains because so many members remain uncultured. Much of what we call Archaea remains to be explored.
To Summarize
The DPANN phylum Nanoarchaeota includes Nanoarchaeum equitans, a tiny obligate symbiont of the marine hyperthermophile Ignicoccus hospitalis. N. equitans is a parasite, affecting the growth of its host.
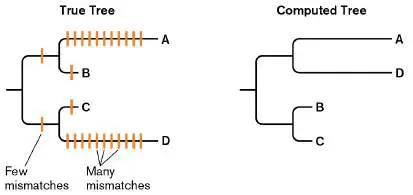
Altiarchaeales includes Altiarchaeum hamiconexum, an archaeon with unique grappling-hook appendages. A. hamiconexum forms netlike biofilms that may include a relationship with sulfide-oxidizing bacteria.
The Asgard superphylum includes archaea that branch with the domain Eukarya. Asgard genomes show a number of signature proteins found in eukaryotes.
Long branch attraction is a computational artifact that can lead distantly branching lineages to appear more similar than, in fact, they are.
Glossary
hamus pl. hami An archaeal cell appendage with grappling hooks that enable cells to connect with each other, adhere to a surface, and form biofilms.
Fig. 19.1 FIGURE 19.1 ■ Ignicoccus hospitalis, from a hydrothermal vent 600 meters below sea level, at Kolbeinsey Ridge volcano. Ignicoccus hospitalis has an extensive endomembrane system (orange) within an outer compartment contained by the cell membrane (yellow). Cryo-electron tomography, colorized.
COURTESY OF THOMAS HEIMERL
Fig. 19.5
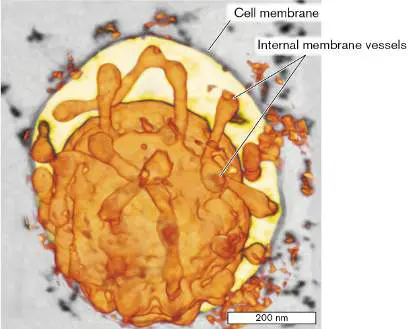
FIGURE 19.5 ■ Archaeal phylogeny. Major superphyla, phyla, and orders of Archaea. Divergence is based approximately on small-subunit ribosomal RNA (SSU rRNA) and genome sequences. (See Table 19.2 for abbreviations.) Inset: Thijs Ettema.
COURTESY OF THIJS ETTEMA
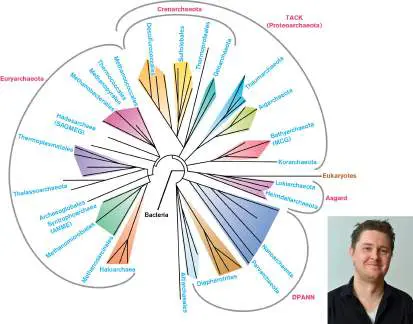
eResearch Activity 19
Can an Archaeal Fuel Cell Make Electric Current in Boiling Water?
In Chapter 14 we learned how bacteria can colonize an electrode and donate electrons, generating an electric current. Such bacterial electricity can be used to make fuel cells for human technology. Could hyperthermophilic archaea do something similar? What if archaea could make a fuel cell at temperatures near boiling? Such a fuel cell could be useful for manufacturing processes that release heat and generate high temperatures.
Narendran Sekar, in the lab of Ramaraja Ramasamy at the University of Georgia, set out to make an archaeal fuel cell at the highest possible temperature. He started with Pyrococcus furiosus, a vent hyperthermophile discovered by Karl Stetter and given a name that means “fireball” (Fig. ERA 19.1 ). The optimal temperature for growth of P. furiosus is 100°C, and Sekar managed to achieve electric current above 90°C. Figure ERA 19.1B shows cells of P. furiosus colonizing the surface of carbon fibers of an anode (an electrode that attracts particles of negative charge).
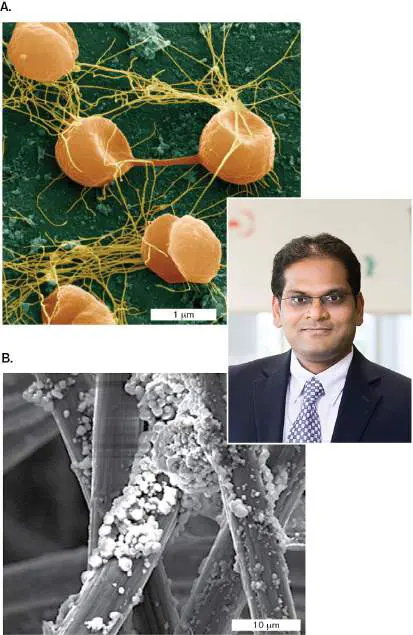
FIGURE ERA 19.1 ■ Pyrococcus furiosus colonizes an electrode. A. Pyrococcus furiosus cells with tuft of archaella (colorized SEM). B. P. furiosus forms biofilm on carbon fibers of an anode (SEM). Inset: Ramaraja Ramasamy, University of Georgia.
Source: Narendran Sekar et al. 2017. Biotechnol. Bioeng. 114 :1419.
EYE OF SCIENCE/SCIENCE SOURCE
N. SEKAR ET AL. 2017. BIOTECHNOL BIOENG. 114 :1419–1427
RAMARAJA P. RAMASAMY
How does P. furiosus generate electricity? In its natural environment, this archaeon can oxidize both organic and inorganic molecules (discussed in Chapter 14). Cytoplasmic enzymes remove electrons from sugar molecules or from H 2 gas (Fig. ERA 19.2A ). These electrons are donated to a specific membrane-bound oxidoreductase (hydrogenase) of an electron transport system (in Fig. ERA 19.2A , a proposed protein complex MBH). The electron transport system then transfers electrons to cytochromes that can extend outside the cell to reach external metals—or, in the fuel cell, an electrode. The electrode then mediates a current with a circuit that ultimately returns electrons to the microbial suspension. The design of such a fuel cell was shown in Figure 14.23. Remarkably, the P. furiosus fuel cell was able to operate at 90°C.
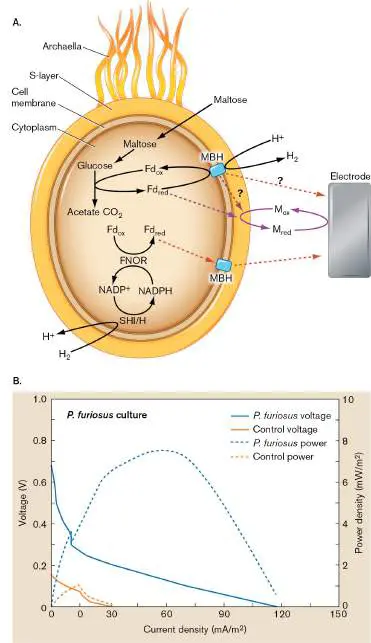
FIGURE 19.2 ■ Pyrococcus furiosus generates electric current. A. Electron transfer pathways of Pyrococcus furiosus. Black solid arrows represent redox pathways of the wild type P. furiosus. Colored arrows represent possible extracellular electron transfer pathways to the electrode. Fd ox = oxidized form of ferredoxin; Fd red = reduced form of ferredoxin; MBH = membrane-bound hydrogenase; SHI/II = soluble hydrogenase I and II; FNOR = ferredoxin NADP + oxidoreductase; M and M
ox red
= oxidized and reduced forms of mediators, respectively. B. Voltage and power density achieved by P. furiosus as a function of current density.
Source: Narendran Sekar et al. 2017. Biotechnol. Bioeng. 114 :1419. The current measured from the P. furiosus fuel cell was 0.2–0.4 mA (milliamps) for up to six hours. This current produced a voltage of 0.2–0.4 V, for a power density of up to 7 mW/m 2 (milliwatts per square meter; Fig. ERA 19.2B ). While this amount of electricity is small, it represents an early step toward generating a source of power that operates under formidable conditions.
Further Exploration
How might the fuel cell be made more efficient to produce greater power? Which would make a better substrate, hydrogen gas or sugars?
Sekar, Narendran, Chang-Hao Wu, Michael W. W. Adams, and Ramaraja P. Ramasamy. 2017. Electricity generation by Pyrococcus furiosus in microbial fuel cells operated at 90° C. Biotechnology and Bioengineering 114 :1419.
Glossary
Figure 14.23 FIGURE 14.23 ■ A microbial fuel cell. A. A bacterial fuel cell. B. Reaction cycle of a bacterial fuel cell.
Source: Part B modified from MURI Microbial Fuel Cell Project, University of Southern California (http://mfc-muri.usc.edu).
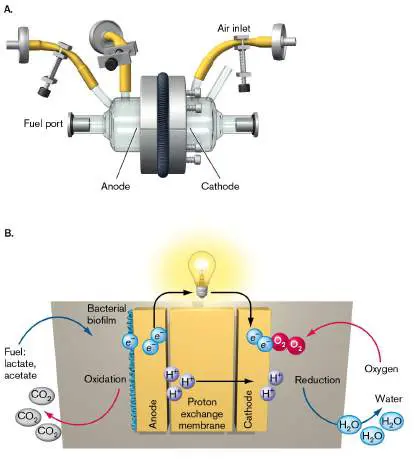
CHAPTER REVIEW
Review Questions
1. What distinctive structures are seen in the archaeal cell membrane and envelope?
2. Which aspects of archaeal genetics resemble the genetics of bacteria, and which aspects have more in common with eukaryotes?
3. Compare and contrast diverse members of the TACK superphylum.
4. Outline the genetic phylogeny and key traits of these groups of archaea: Haloarchaea, methanogens, Thermococcales, Thermoplasmatales.
5. What are some specific physiological adaptations found in hyperthermophiles? Halophiles? Extreme acidophiles? 6. Outline three different specific types of mutualism involving an archaeal symbiont.
7. Explain how different archaea contribute to cycling of nitrogen and sulfur in ecosystems.
8. Explain what is known and what is unknown about the following groups of archaea: marine TACK archaea; marine benthic anaerobes; soil and plant root–associated archaea. What kinds of experiments may reveal additional traits of these organisms?
9. How do methanogens interact metabolically with communities of bacteria, within a host animal or within a soil environment?
Thought Questions
1. What approaches can you use to discover previously unknown deeply branching groups of archaea? Explain the strengths and limitations of each method.
2. Why do you think we have found no archaea that are pathogens of animals or plants?
3. Why do you think methanogens appear in many branches among different groups, whereas Haloarchaea branch as a single group?
Key Terms
Aigarchaeota (779)
Anaerobic Methane-Oxidizing Euryarchaeota (ANME) (788) archaellum (766)
bacteriorhodopsin (771, 794) barophile (773)
Bathyarchaeota (769)
black smoker (777)
cannula (778)
Desulfurococcales (768, 773) electron bifurcation (790) Euryarchaeota (769)
gas vesicle (793)
Geoarchaeota (768)
Haloarchaea (791)
halorhodopsin (794)
hamus (798)
histone (766)
isoprenoid (765)
Korarchaeota (778)
Lokiarchaeota (772)
methane gas hydrate (788) methanogen (784)
methanogenesis (784)
Nanoarchaeota (772)
pseudopeptidoglycan (pseudomurein) (786) reverse gyrase (767)
Sulfolobales (768, 774) syntrophy (785)
tetraether (766)
Thaumarchaeota (769)
Thermoplasmatales (796) Thermoproteales (768)
Recommended Reading
Bang, Corinna, Katrin Weidenbach, Thomas Gutsmann, Holger Heine, and Ruth A. Schmitz. 2014. The intestinal archaea Methanosphaera stadtmanae and Methanobrevibacter smithii activate human dendritic cells. PLoS One 9 :e99411. Bolduc, Benjamin, Daniel P. Shaughnessy, Yuri I. Wolf, Eugene Koonin, Francisco F. Roberto, et al. 2012.
Identification of novel positive-strand RNA viruses by metagenomic analysis of archaea-dominated Yellowstone hot springs. Journal of Virology 86 :5562–5573.
Brumfield, Susan K., Alice C. Ortmann, Vincent Ruigrok, Peter Suci, Trevor Douglas, et al. 2009. Particle assembly and ultrastructural features associated with replication of the lytic archaeal virus Sulfolobus turreted icosahedral virus. Journal of Virology 83 :5964–5970.
Da Cunha, Violette, Morgan Gaia, Arshan Nasir, and Patrick Forterre. 2018. Asgard archaea do not close the debate about the universal tree of life topology. PLoS Genetics 14 :e1007215. DasSarma, Priya, Regie C. Zamora, Jochen A. Müller, and Shiladitya DasSarma. 2012. Genome-wide responses of the archaeon Halobacterium sp. strain NRC-1 to oxygen limitation. Journal of Bacteriology 194 :5530.
DeMaere, Matthew Z., Timothy J. Williams, Michelle A. Allen, Mark V. Brown, John A. E. Gibson, et al. 2013. High level of intergenera gene exchange shapes the evolution of haloarchaea in an isolated Antarctic lake. Proceedings of the National Academy of Sciences USA 110 :16939–16944.
Golyshina, Olga V., and Kenneth N. Timmis. 2005. Ferroplasma and relatives, recently discovered cell wall-lacking archaea making a living in extremely acid heavy metal-rich environments. Environmental Microbiology 7 :1277–1288. Heimerl, Thomas, Jennifer Flechsler, Carolin Pickl, Veronika Heinz, Benjamin Salecker, et al. 2017. A complex endomembrane system in the archaeon Ignicoccus hospitalis tapped by Nanoarchaeum equitans. Frontiers in Microbiology 8: 1072.
López-García, Purificación, Yvan Zivanovic, Philippe Deschamps, and David Moreira. 2015. Bacterial gene import and mesophilic adaptation in archaea. Nature Reviews. Microbiology 13 :447–456.
Perras, Alexandra K., Gerhard Wanner, Andreas Klingl, Maximilian Mora, Anna K. Auerbach, et al. 2014. Grappling archaea: Ultrastructural analyses of an uncultivated, cold-loving archaeon, and its biofilm. Frontiers in Microbiology 5 :397. Pester, Michael, Christa Schleper, and Michael Wagner. 2011. The Thaumarchaeota: An emerging view of their phylogeny and ecophysiology. Current Opinion in Microbiology 14 :300–306.
Sauder, Laura A., Katja Engel, Jennifer C. Stearns, Andre P. Masella, Richard Pawliszyn, et al. 2011. Aquarium nitrification revisited: Thaumarchaeota are the dominant ammonia oxidizers in freshwater. PLoS One 6 :e23281.
Sivabalasarma, Shamphavi, Hanna Wetzel, Phillip Nußbaum, Chris van der Does, Morgan Beeby, et al. 2021. Analysis of cell-cell bridges in Haloferax volcanii using electron cryo-tomography reveal a continuous cytoplasm and S-layer. Frontiers in Microbiology 11 :612239.
Skennerton, Connor T., Karuna Chourey, Ramsunder Iyer, Robert L. Hettich, Gene W. Tyson, et al. 2017. Methane-fueled syntrophy through extracellular electron transfer: Uncovering the genomic traits conserved within diverse bacterial partners of anaerobic methanotrophic archaea. mBio 8 :e00530-17.
Spang, Anja, Eva F. Caceres, and Thijs J. G. Ettema. 2017. Genomic exploration of the diversity, ecology, and evolution of the archaeal domain of life. Science 357 :eaaf3883.
Vanderhaeghen, Sonja, Christophe Lacroix, and Clarissa Schwab. 2015. Methanogen communities in stools of humans of different age and health status and co-occurrence with bacteria. FEMS Microbiology Letters 362 :fnv092.
Zaremba-Niedzwiedzka, Katarzyna, Eva F. Caceres, Jimmy H. Saw, Disa Bäckström, Lina Juzokaite, et al. 2017. Asgard archaea illuminate the origin of eukaryotic cellular complexity. Nature 541 :353–358.
Glossary
Thermoproteales A clade of the phylum Thermoproteota, thermophilic archaea including hyperthermoacidophiles, in the TACK superphylum. Aigarchaeota A phylum of archaea in the TACK superphylum that contains filamentous aerobic hyperthermophiles in hot springs. Anaerobic Methane-Oxidizing Euryarchaeota (ANME) or anaerobic methane oxidizers A group of archaea in the superphylum Euryarchaeota that oxidize methane. Some, such as the Methanoperedenaceae, oxidize methane independently whereas others oxidize methane syntrophically with sulfate-reducing bacteria (SRB). archaellum pl. archaella A rotary complex for motility in archaea, analogous to the bacterial flagellum.
bacteriorhodopsin A haloarchaeal membrane-embedded protein that contains retinal and acts as a light-driven proton pump; it is homologous to the bacterial proteorhodopsin.
barophile Also called piezophile. An organism that requires high pressure to grow.
Bathyarchaeota A phylum of thermophilic archaea in the TACK superphylum, widely distributed in anoxic soil, water, and marine sediments. black smoker An oceanic thermal vent containing high concentrations of dark minerals such as iron sulfide.
cannula pl. cannulae A narrow tubule. For Pyrodictium species, glycoprotein cannulae interconnect cells at their periplasm.
Desulfurococcales A phylum of thermophilic archaea in the TACK superphylum that metabolize sulfur and organic compounds.
electron bifurcation A biochemical reaction in which an electron transfer that yields energy is coupled to an electron transfer that consumes energy. Euryarchaeota A major division of Archaea, containing methanogens, halophiles, acidophiles, and thermophiles, as well as soil archaea that are not extremophiles.
gas vesicle An organelle that traps gases to increase the buoyancy of aquatic microbes.
Geoarchaeota A clade of Thermoproteota, thermophilic archaea including mats at thermal vents, in the TACK superphylum.
Haloarchaea A monophyletic clade of Euryarchaeota that contains extremely halophilic archaea, inhabiting high-salt environments. Formerly known as Halobacteria.
halorhodopsin A haloarchaeal membrane-embedded protein that contains retinal and acts as a light-driven chloride pump; it is homologous to bacteriorhodopsin.
hamus pl. hami An archaeal cell appendage with grappling hooks that enable cells to connect with each other, adhere to a surface, and form biofilms.
histone A protein that binds eukaryotic DNA and compacts chromosomes in nucleosomes.
isoprenoid A condensed isoprene chain, found in archaeal membrane lipids.
Korarchaeota A phylum of archaea in the TACK superphylum that contains anaerobic hyperthermophiles in hot springs and deep-sea thermal vents.
Lokiarchaeota A phylum in the Asgard superphylum of Archaea that contains deep-sea thermophiles isolated from a thermal vent named Loki’s Castle. Formerly known as the Deep-Sea Archaeal Group or Marine Benthic Group B (DSAG or MBGB).
methane gas hydrate A crystalline material in which methane molecules are surrounded by a cage of water molecules. This molecular configuration is found in the deep ocean.
methanogen An archaeon that uses hydrogen to reduce CO 2 and other single-carbon compounds or acetate to methane, yielding energy. Clades of methanogens branch within the superphylum Euryarchaeota.
methanogenesis An energy-yielding metabolic process that releases methane, commonly from hydrogen gas and oxidized one-or two-carbon compounds. It is unique to archaea.
Nanoarchaeota A phylum in the DPANN superphylum of Archaea that includes very small cells, which are obligate symbionts of vent hyperthermophiles.
pseudopeptidoglycan or pseudomurein A peptidoglycan-like molecule composed of sugars and peptides that is found in some archaeal cell walls.
reverse gyrase An enzyme that adds positive superturns to DNA in addition to the fundamental twist of the DNA helix. Found mainly in archaea, reverse gyrase differs from the gyrase of bacteria and eukaryotes, which adds negative superturns, against the twist. Sulfolobales A phylum of thermophilic archaea in the TACK superphylum that includes sulfur oxidizers.
syntrophy Metabolic cooperation between two different species; usually one member releases a product whose removal by the second species enables the pair to metabolize with a negative value of Δ G.
tetraether A molecule containing four ether links. An example is found in archaeal membranes, when two lipid side chains form ether linkages with a pair of side chains from the other side of the bilayer.
Thaumarchaeota A phylum of archaea in the TACK superphylum that includes ammonia oxidizers and symbionts of marine invertebrates Thermoplasmatales An order of extreme thermoacidophiles in the Euryarchaeota superphylum.