30 Epidemiology and Public Health
III Emerging Infectious Diseases, Pandemics, and Other Threats
A New Urgent Threat Is Emerging in Public Health Microbiology
For several years now, epidemiologists have been tracking the emergence of a new, highly invasive and deadly pathogen, but it is neither a bacterium nor a virus. This pathogenic microbe is a nosocomial (healthcare-associated) fungus, and the U.S. Centers for Disease Control and Prevention (CDC) has recently added it to a list of microorganisms considered to be “urgent threats.” The new fungal pathogen, first described in 2009, is a yeast called Candida auris, a relative of the opportunistic yeast Candida albicans, which causes vaginal candidiasis and oral thrush.
Since its initial description, cases of C. auris infection have been documented in hospitals on every continent but Antarctica. Systemic infection by C. auris results in a mortality rate approaching 60%, with immunocompromised patients comprising the largest fraction of these fatalities. One major C. auris outbreak in the United Kingdom occurred among intensive care unit patients. In this incident, the yeast was transmitted between patients through multiuse thermometers that measure temperature in the armpit. Despite staff’s adherence to established protocols to disinfect the equipment between uses, a shocking 86% of patients that had contact with the thermometers subsequently developed C. auris infection.
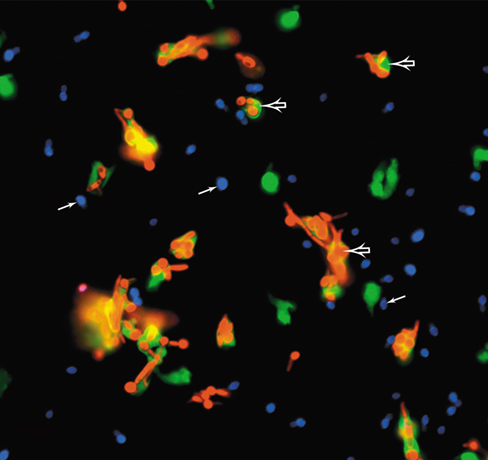
Invasive infections by C. albicans often result from neutropenia (decreased numbers of neutrophils). However, studies have shown that C. auris infection frequently occurs even in the presence of normal numbers of neutrophils, suggesting that innate defenses do not adequately contain the pathogen. In the presence of both C. albicans (red cells, photo) and C. auris (blue), neutrophils (green) readily engaged and killed C. albicans (open arrows) but ignored C. auris (closed arrows). This fascinating but disconcerting finding suggests that C. auris possesses an efficient mechanism of phagocyte evasion. Considering that C. auris is also resistant to several antifungal drugs, healthcare providers and epidemiologists may have a long struggle ahead of them to control this emerging pathogen.
Source: Nett, J.E. 2019. Candida auris: An emerging pathogen “incognito”? PLoS Pathog. 15(4): e1007638. doi:10.1371/journal.ppat.1007638.
Beginning with this chapter and to the end of the book, we focus on the nature and diversity of infectious diseases. Everything we have learned up to this point—cell structure, metabolism, growth, genetics, and genomics; microbial evolution, diversity, and ecology; and host–microbe relationships and the immune response—will help us better understand the disease strategies and exploitable weaknesses of infectious microbial agents.
As a prelude to our coverage of the clinical aspects of infectious diseases in the following four chapters, we explore the “big picture” of how infectious diseases flow through populations. Epidemiology is the study of the occurrence, distribution, and determinants of health and disease in populations and is intertwined with public health, the health of the population as a whole. Although in developed countries infectious diseases are not leading causes of death, in developing countries infectious diseases can account for nearly half of all deaths. Hence, identifying and solving problems associated with infectious disease transmission is a major goal of the epidemiologist.
I Principles of Epidemiology
Focused on the distribution, prevalence, and transmission of disease, epidemiology is foundational to the health and prosperity of the human population on a global scale. Moreover, disease tracking often reveals patterns that improve disease treatment.
In this first part of the chapter we consider the principles of epidemiology and define key terms in the lexicon of the epidemiologist.
30.1 The Language of Epidemiology
The epidemiologist traces the spread of a disease to identify its origin and mode of transmission in a population. The population might be all people in a certain city, country, or region, or it could be the entire human population. Alternatively, the population under study could be a particular demographic within a larger population, such as only males or only those of a specific race or age group. Raw data are gathered from disease-reporting networks such as city, county, state, and national public health departments, clinical records, and patient interviews.
A major job of the epidemiologist is to carry out disease surveillance—the observation, recognition, and reporting of diseases as they occur—and then analyze the data provided by local and national health authorities to reveal trends and signals of disease outbreaks. The epidemiologist thus stands in contrast to the clinical health provider—the one who actually treats the infected patient. However, in order to both track a disease and predict its spread in a population, the epidemiologist must integrate clinical results and surveillance data to formulate effective public health measures for disease control.
Mastering Microbiology
Art Activity: Figure 30.1 The concepts of disease incidence and disease prevalence
Disease Incidence and Prevalence
The epidemiologist often uses the words incidence and prevalence when discussing infectious diseases. The incidence of a particular disease is the number of new cases in a population in a given time period (Figure 30.1). For example, in 2016 there were 38,700 new cases of HIV infection in the United States, for an incidence of 12 new cases per 100,000 people per year. The prevalence of a given disease is the total number of new and existing disease cases in a population in a given time period (Figure 30.1). For example, within the United States there were 1,008,929 persons living with HIV/AIDS at the end of 2016. Expressed another way, the prevalence of HIV/AIDS in the United States was about 317 cases per 100,000 persons in 2016.
Figure 30.1 The concepts of disease incidence and disease prevalence.

Disease incidence is a rate function and is defined as the number of new cases over a given time period (day[s], week, month, etc.); incidence is an indicator of infection risk. Disease prevalence is the total number of diseased individuals at some time point and is a snapshot of the extent of a disease in a population at any given time.
Essentially a rate measurement, disease incidence can be used to predict the risk of disease for an individual in a defined population within a specific time period. By contrast, prevalence measures the total disease burden in a population and can be thought of as a “snapshot” of the disease at a specific instant (Figure 30.1). The incidence and prevalence of disease are also major indicators of the public health of a population.
The Scope of Disease
Other common epidemiological terms speak to the scope of a disease. A disease is an epidemic when it simultaneously infects an unusually high number of individuals in a population; a pandemic is a widespread, usually global epidemic. By contrast, an endemic disease is one that is constantly present—typically in low numbers—in a population (Figure 30.2). An endemic disease implies that the pathogen may not be highly virulent or that the majority of individuals in the population may be immune, resulting in low but persistent numbers of cases. Individuals infected with a pathogen that causes an endemic disease are reservoirs of infection, a source of infectious agents from which susceptible individuals may be infected.
Figure 30.2 Endemic, epidemic, and pandemic disease.

Each dot represents a disease case or outbreak. (a) Endemic diseases are present in the population in specific geographical areas. (b) Epidemic diseases show high incidence in a wider area, usually developing from an endemic focus. (c) Pandemic diseases are distributed intercontinentally.
Sporadic cases of a disease occur one at a time in geographically separated areas, suggesting that the cases are not related. A disease outbreak, on the other hand, is the appearance of a large number of cases in a short time in an area previously experiencing only sporadic or endemic disease. Diseased individuals that show no symptoms or only mild symptoms are said to have subclinical infections. Subclinically infected individuals are frequently carriers of the particular pathogen, with the pathogen reproducing within them and being shed into the environment where it can infect others. Finally, the term virulence, often used in epidemiological parlance, is a measure of the relative ability of a pathogen to cause disease. Some pathogens are highly virulent while others are only weakly so (Section 25.3).
Stages of Disease
A well-adapted pathogen lives in balance with its host, taking what it needs for existence and causing only minimal harm. Such pathogens may cause chronic infections (long-term infections) in the host. When there is a balance between host and pathogen, both host and pathogen survive. Tuberculosis (Section 31.4) is a good example of a chronic infection. On the other hand, a host whose resistance is compromised because of factors such as poor diet, age, and other stressors can be harmed or even killed; for example, a chronic tuberculosis infection can eventually kill the host.
New pathogens occasionally emerge to which specific populations or even an entire species has not developed resistance. Such emerging pathogens often cause acute infections, characterized by rapid and dramatic disease onset and a relatively quick return to health. Influenza caused by a new strain of influenza virus (Section 31.8) would be an example of an acute infection, as would many other infectious diseases that show a rapid onset and recovery, such as various food infections and food poisonings (Chapter 33), or even the common cold (Section 31.7). The progression of clinical symptoms for an acute infectious disease can be divided into stages, and the terms used to describe these stages are also part of the epidemiologist’s lexicon:
Infection: The organism invades, colonizes, and grows in the host.
Incubation period: Some time always passes between infection and the appearance of disease signs and symptoms. Some diseases, like influenza, have very short incubation periods, measured in days; others, like AIDS, have longer incubations, sometimes extending for years. The incubation period for a given disease is determined by the inoculum size, the virulence and life cycle of the pathogen, and the resistance of the host. At the end of the incubation period, the first signs and symptoms, for example, a mild cough and a feeling of general fatigue in the case of an ensuing cold, usually appear.
Acute period: The disease is at its height, with overt symptoms and signs such as fever and chills.
Decline period: Disease signs and symptoms subside. As fever subsides, usually following a period of intense sweating, a feeling of well-being develops. The decline period may be rapid (within one day), in which case decline occurs by crisis, or it may be slower, extending over several days, in which case decline occurs by lysis.
Convalescent period: The patient regains strength and returns to the normal healthy state.
After the acute period, the immune mechanisms of the host (Chapters 26 and 27) become increasingly important for complete recovery from the disease.
Mortality, Morbidity, and DALY
The terms morbidity and mortality are commonly used in epidemiology. Mortality is the incidence of death in a population. Infectious diseases were the major causes of death worldwide in 1900, but they are now less prevalent in developed countries. Noninfectious “lifestyle” diseases such as heart disease and cancer are now much more prevalent in developed regions and cause higher mortality than do infectious diseases (Figure 1.13). However, this could change rapidly if public health measures were to break down. Worldwide, and especially in developing countries, infectious diseases are still major causes of mortality (Table 30.1 and see Figure 30.9).
Table 30.1 Worldwide deaths due to infectious diseasesa

aData show the ten leading causes of death due to infectious diseases in 2016. Worldwide there were nearly 57 million total deaths, and 20% of these were from infectious diseases, mostly in developing countries. In the United States in 2016, deaths from infectious diseases were about 4% of total deaths (influenza, pneumonia and septicemia were leading causes). Data adapted from data published by the World Health Organization (WHO) and the Centers for Disease Control and Prevention (CDC), Atlanta, Georgia, USA.
bFor some acute respiratory agents, such as influenza viruses and Streptococcus pneumoniae, there are effective vaccines; for others, such as colds, there are no vaccines.
cDiseases for which effective vaccines are available.
dVaccines are available for hepatitis A virus and hepatitis B virus. There are currently no vaccines for other hepatitis agents, but a drug is available that can cure hepatitis C infections.
Morbidity is the incidence of disease in a population and includes both fatal and nonfatal diseases. Morbidity statistics indicate the public health of a population more precisely than mortality statistics because many diseases have relatively low mortality. Put another way, the major causes of illness are quite different from the major causes of death. For example, high-morbidity infectious diseases include acute respiratory diseases such as the common cold and acute digestive disorders. However, seldom do these diseases cause death in populations living in developed countries. Thus, both of these diseases have high morbidity, but low mortality. On the other hand, Ebola virus infects relatively few people worldwide every year, but the mortality in some outbreaks approaches 70% and averaged 40% in the West African Ebola outbreak of 2013–2015. Thus, Ebola has low morbidity, but high mortality.
Epidemiologists tend to focus on morbidity and mortality statistics as a means of ranking the severity of pathogens and tracking disease trends. However, illness and death are not the only outcomes of an infectious disease. Lost among these statistics is the reduction in life quality and productivity due to a disease. The disability-adjusted life year (DALY) is a quantitative measure of disease burden and is defined as the cumulative number of years lost due to an illness itself, a disability due to an illness (whether an infectious disease or not), or premature death.
The leading causes of death are not the leading causes of disability; about one-third of all disability years lost are due to psychiatric and neurological conditions. But many infectious diseases cause chronic disability and thus such data are important measures of the overall burden of disease. This is especially true of a series of neglected tropical diseases, a group of infectious diseases found mainly in tropical countries that are major disablers rather than killers. These include in particular parasitic worm infections such as hookworm, filariases, and schistosomiasis (Section 34.7). Hundreds of millions of people suffer from these infections worldwide, and although some die, most do not. However, life quality and longevity of survivors is often greatly diminished, and DALY numbers attempt to quantify this frequently overlooked but nevertheless important aspect of epidemiological statistics.
With some of the epidemiologist’s common terminology in mind, we are now able to move on to consider how infectious diseases spread (or do not spread) in susceptible populations.
Check Your Understanding
Why do epidemiologists acquire population-based data about infectious diseases?
Distinguish between an endemic disease, an epidemic disease, and a pandemic disease.
Which is more severe, a disease with a high mortality or one with a high morbidity? What is a DALY?
30.2 The Host Community
The colonization of a susceptible host population by a pathogen may lead to rapid transmission to uninfected hosts, widespread infections, and an epidemic. As the host population develops resistance, however, the spread of the pathogen is checked, and eventually a balance is reached in which host and pathogen populations reach a state of equilibrium. In an extreme case, failure to reach equilibrium could result in death and eventual extinction of the host species. If the pathogen has no other host, then the extinction of the host also results in extinction of the pathogen. The evolutionary success of a pathogen thus depends on its ability to establish an equilibrium with its host rather than destroy the host population altogether. In most cases, the evolution of the host and the pathogen affect one another; that is, the host and pathogen coevolve.
Coevolution of a Host and a Pathogen
A classic example of host and pathogen coevolution is a case where myxoma virus was intentionally introduced to control an exploding wild rabbit population in Australia. The virus, spread by the bite of mosquitoes and also from animal to animal by direct contact, is extremely virulent for rabbits and causes fatal infections in susceptible animals. Within several months, the introduced epidemic had spread over a large area, rising to peak incidence in the summer when the mosquito vectors were present, and then declining in the winter as mosquitoes disappeared. In this experiment, over 95% of infected rabbits died during the first year, but within six years, rabbit mortality dropped to about 30%, indicating that the resistance of the wild rabbit population to the virus had increased dramatically (Figure 30.3). When viruses isolated from these wild rabbits were used to infect laboratory rabbits that had not previously been exposed to the virus, the virus could be seen to have lost virulence over the six-year period. This was further confirmed by the resistance observed in newborn wild rabbits exposed to the virus. Within three years, viral virulence decreased by about 80% and maintained this diminished level of virulence (Figure 30.3). Thus, within just a few years, the rabbit population had evolved to reach an equilibrium with the pathogen.
Figure 30.3 Myxoma virus and host coevolution.

Myxoma virus was introduced into Australia to control the wild rabbit population. Virus virulence was measured as the average mortality in laboratory rabbits for infection with myxoma virus recovered from the field each year. Rabbit mortality was determined by removing young wild rabbits from dens and infecting them with a viral strain that killed 90–95% of control laboratory rabbits.
For pathogens that do not exhibit host-to-host transmission, there is no selection for decreased virulence to support mutual coexistence, as was seen in the rabbit myxoma virus experiment. An example of this is Clostridium tetani, a common soil bacterium that causes tetanus when accidently introduced into flesh through a penetrating wound (Section 25.6 and Section 32.9). Vectorborne pathogens transmitted solely by the bite of ticks or other arthropods, such as in spotted fever rickettsiosis (Rocky Mountain spotted fever, Section 32.3), are also under no evolutionary pressure to spare the human host. As long as the vector is only a carrier of the pathogen and does not contract the disease itself, there is no selection for weakened strains of the pathogen and thus the pathogen can maintain a high level of virulence.
Herd Immunity
Spread of an infectious disease through a highly susceptible population is typically much different than through a population where many, or even just some, potential hosts are immune, either from a previous natural infection with the same pathogen or by artificial means through vaccination. If a high enough proportion of the individuals in a population are immune to a pathogen, then the population as a whole can be protected from an epidemic, resulting in a collective level of resistance to infection called herd immunity (Figure 30.4).
Figure 30.4 Herd immunity and transmission of infection.

Immunity in some individuals protects susceptible individuals from infection. (a) In a population with no immunity, transfer of a pathogen from one infected individual can ultimately infect (arrows) all individuals as newly infected individuals in turn transfer the pathogen to other individuals. (b) In a population that is only moderately dense and that has some immunity against a moderately transmissible pathogen such as influenza, an infected individual cannot transfer the pathogen to all susceptible individuals because resistant individuals, immune due to previous exposure or immunization, break the cycle of pathogen transmission: Susceptible individual A becomes infected, but susceptible individuals B and C are protected. The proportion of a population that must be immune for herd immunity to be effective also varies with the disease; highly infectious diseases require a higher proportion of immune individuals for herd immunity to prevent transmission (see Table 30.3).
Mastering Microbiology
Art Activity: Figure 30.4 Herd immunity and transmission of infection
The concept of herd immunity is easy to understand. In essence, what herd immunity amounts to is a breakage in the chain of pathogen transmission from one susceptible host to another because most hosts in the population are immune (Figure 30.4). Herd immunity is not a fixed number, and the assessment of herd immunity is important for understanding the development of epidemics. The more highly infectious a pathogen, or the longer its period of infectivity, the greater the proportion of immune individuals necessary to prevent epidemic disease spread. For a highly infectious disease such as measles, 90–95% of the population must be immune to confer herd immunity (see Table 30.3). By contrast, a lower proportion of immune individuals can prevent an epidemic of a less infectious agent or one with only a brief period of infectivity. Mumps virus, which is less infectious than measles virus, exhibits this pattern. In the absence of immunity, even poorly infectious agents can be transmitted from person to person if susceptible hosts have repeated or constant contact with an infected individual. This is the case for the transmission of H5N1 avian influenza among humans (Section 30.8).
Check Your Understanding
Explain coevolution of host and pathogen. Cite a specific example.
How does herd immunity prevent a nonimmune individual from acquiring a disease? Give an example.
30.3 Infectious Disease Transmission and Reservoirs
30.3 Infectious Disease Transmission and Reservoirs
30.3 Infectious Disease Transmission and Reservoirs
Epidemiologists follow the transmission of a disease by correlating geographic, climatic, socioeconomic, and demographic data with disease incidence. These correlations are then used to identify possible modes of transmission and disease patterns. Epidemiologists group infectious diseases by their mode of transmission. This approach reflects the ecology of the organism and is the pattern we will use in Chapters 31, 32, 33 and 34.
Modes of Disease Transmission
Three major modes of infectious disease transmission are known and are summarized in Table 30.2. These include diseases transmitted from person to person, including those transmitted by touching fomites (inanimate objects); diseases transmitted by substances taken into the body (for example, food, water, or air), called vehicles; and diseases transmitted by vectors, that is, other organisms, especially those that access the bloodstream, such as ticks and biting insects. Each mechanism has three stages in common: (1) escape from the host or reservoir, (2) travel, and (3) entry into a new host.
Table 30.2 Major means of human infectious disease transmission

Mastering Microbiology
Art Activity: Table 30.2 Major means of human infectious disease transmission
Person-to-person disease transmission occurs when an infected host transmits a disease directly to a susceptible host without the assistance of an intermediate host. Upper respiratory infections such as the common cold and influenza are most often transmitted person to person by airborne droplets resulting from sneezing or coughing. Many of these droplets, however, do not remain airborne for long, and so transmission requires close, although not necessarily intimate, person-to-person contact. Some pathogens are extremely sensitive to environmental factors such as drying and heat and are unable to survive for significant periods of time away from the host. These pathogens, transmitted only by intimate person-to-person contact, such as exchange of body fluids in sexual intercourse, include those responsible for sexually transmitted diseases including syphilis (Treponema pallidum), gonorrhea (Neisseria gonorrhoeae), and HIV/AIDS (HIV, human immunodeficiency virus; AIDS, acquired immunodeficiency syndrome). Direct person-to-person contact is also how pathogens such as staphylococci (boils and pimples) and fungi (ringworm) are transmitted. Some of these pathogens (Staphylococcus aureus is a good example) can spread by vehicle transmission as well because when inoculated into a vehicle such as food, they grow rapidly and produce poisonous toxins.
In addition to direct contact between hosts, infectious diseases may also be transmitted by contact with inanimate objects or by other organisms. When contaminated with a viable pathogen, inanimate agents, called fomites, can transfer the pathogen to a susceptible host. A huge variety of fomites can harbor pathogens and may include bedding, clothing, toys, books, door knobs, eating utensils, paper and coin currency, and surgical instruments—virtually any object or surface that is accessible to public contact. The term vehicle is used to describe nonliving sources of pathogens that may transmit disease to large numbers of individuals upon entering their bodies. Common disease vehicles include contaminated food and water (Table 30.2), but air and soil may also function as vehicles of disease transmission, such as in the transmission of infectious microbial spores. A key distinction in this terminology is that fomites are nonliving objects that are touched or handled, whereas vehicle-associated epidemics are typically traced to a common contaminated source—shared commodities consumed in large amounts by local or regional populations.
Living disease carriers are called vectors, and arthropods (mites, ticks, fleas, etc.) and vertebrates (usually dogs, cats, or rodents) are common disease vectors. Vectors are often not definitive hosts for the pathogen but simply carry the pathogen from one host to another. For instance, many arthropods obtain their nourishment by biting and sucking blood, and if the pathogen is present in the blood, the arthropod will ingest the pathogen and transmit it when biting another individual. In some cases, viral pathogens multiply in the arthropod vector, which is then considered an alternate host. Such is the case for West Nile virus (in the Culex mosquito) and the bacterium Yersinia pestis (in the rat flea), the causative agent of plague (Sections 32.6 and 32.7, respectively). Such replication leads to greater pathogen abundance in the vector, and this increases the probability that a subsequent bite will lead to infection.
A marked seasonality or periodicity of a disease often signals a particular mode of transmission. Seasonal patterns of transmission can result from environmental factors, such as weather patterns, that influence the survival of the pathogen or its vector. For example, California encephalitis—a viral disease transmitted by mosquitoes—shows a pattern in which the disease peaks during the summer and fall months but disappears in the winter, coinciding with the activity of its mosquito vector (Figure 30.5). By contrast, human influenza occurs in an annual cyclic pattern unrelated to arthropod activities, causing person-to-person epidemics propagated among schoolchildren and other populations of susceptible individuals. Cases of influenza are often high in schools or crowded offices because the virus is transmitted through the respiratory route by airborne droplets; peak incidence occurs in midwinter and early spring when schools are in session and people are indoors much of the day.
Figure 30.5 Cyclical nature of California encephalitis in the United States.

California encephalitis is transmitted by the mosquito Ochlerotatus triseriatus (left photo) and is caused by the La Crosse encephalitis virus, a negative-strand and enveloped RNA virus (right photo). Because it depends on a seasonally available vector, disease incidence shows a sharp rise in late summer, followed by a complete decline in winter. Data are from the CDC, Atlanta, Georgia, USA.
Disease Carriers and Disease Reservoirs and Control
As described earlier, a disease carrier is a pathogen-infected individual who has a subclinical infection and shows either no symptoms or only mild symptoms of the disease; carriers are thus potential sources of infection for others. Carriers may be in the incubation period of the disease, in which case the carrier state precedes the development of actual symptoms (Section 30.1). Respiratory infections such as colds and influenza, for example, are often spread via carriers who are unaware of their infection and so are not taking any precautions against infecting others. The carrier state lasts only a short time for carriers who develop acute disease. However, chronic carriers usually appear healthy and may spread disease for extended periods of time. Some examples here include carriers of hepatitis B, typhoid fever, HIV/AIDS, tuberculosis, and upper respiratory Staphylococcus aureus infections.
Disease reservoirs are sites at which infectious agents remain viable and from which susceptible individuals may become infected. Reservoirs may be either animate or inanimate. Some pathogens whose reservoirs are not in animals only incidentally infect humans and cause disease. For example, some species of Clostridium, common soil bacteria, occasionally infect humans, causing life-threatening diseases such as tetanus, botulism, and gangrene. In these cases, the pathogen is not dependent on the host for survival, so host–pathogen balance is not required. For many pathogens (including many human pathogens), however, living organisms are the only reservoirs. In these cases, the host is essential for the life cycle of the infectious agent; maintenance of human pathogens of this kind requires host-to-host transmission. Many viral and bacterial respiratory pathogens and sexually transmitted pathogens fall into this category. When humans are the main or only disease reservoir, implementing infection controls may or may not be easy and depends to a great extent on the nature of the disease and its mode of transmission. With diphtheria, for example, confirmed cases are isolated and quarantined to prevent spread of the pathogen (Section 30.5). However, for a disease like gonorrhea, where symptoms are often inapparent in females, tracking down and treating disease carriers can be difficult if not impossible.
Some infectious diseases are caused by pathogens that reproduce in both humans and animals. A disease that primarily infects animals and is only occasionally transmitted to humans is called a zoonosis; rabies is a good example. The reservoir for rabies is wild mammals, primarily skunks, raccoons, foxes, and certain bats. Although person-to-person transmission of zoonoses is rare, control of zoonoses in humans is nearly impossible because of the frequent contact some humans have with wild animals and the fact that the animal reservoir can probably never be effectively controlled. Certain other infectious diseases are caused by organisms such as protists and helminths (parasitic worms) that undergo complex life cycles requiring an obligate transfer from a nonhuman host to a human host and back to the nonhuman host; the diseases malaria and schistosomiasis (Chapter 34) are good examples here. In the case of malaria, the major reservoir other than humans is the mosquito Anopheles gambiae, and some control of the disease can be achieved by chemical or physical controls on the insect reservoir. In schistosomiasis, by contrast, the reservoir is an aquatic snail, and so eliminating the reservoir is impossible, although treatments for the disease are possible. Interestingly, “reverse zoonoses” (transmission from humans to animals) are also possible, and for an example, see MicrobiologyNow in Chapter 33.
Check Your Understanding
What is the difference between a disease vehicle and a disease vector?
An effective vaccine is available for human rabies, yet cases continue to occur every year around the world. What aspect of rabies makes it such a challenge to completely eradicate?
30.4 Characteristics of Disease Epidemics
Endemic infectious diseases are constantly present over long periods of time but typically occur at only low incidence in the population. In tropical Africa, for example, malaria is endemic; both morbidity and mortality from malaria have remained relatively constant on a long-term basis. By contrast, the 2014 outbreak of Ebola hemorrhagic fever in West Africa ran to epidemic proportions in major districts of Sierra Leone, Liberia, and Guinea. The 2019 Ebola outbreak in the Democratic Republic of Congo (along with a few cases in Uganda) infected over 3150 people, two-thirds of whom died. The prompt implementation of strict public health measures (Section 30.5) is required to contain outbreaks and limit the spread of Ebola. As a highly transmissible disease (Section 31.12), Ebola has the potential to become pandemic if those infected but not yet showing symptoms travel away from the epidemic area. However, a highly effective Ebola vaccine, now available, may temper this prediction.
Epidemics
Disease epidemics show characteristic features and require that rapid epidemiological conclusions be reached and clinical treatment instituted if the epidemic is to be contained. The characteristic features of epidemics include distinct patterns in the disease cycle and inherent properties of the pathogen that affect its virulence and herd immunity. Major epidemics are usually classified as either common-source epidemics or host-to-host epidemics. The patterns of disease incidence observed in these two types of epidemics are contrasted in Figure 30.6.
Figure 30.6 Types of epidemics.

The shape of the curve that plots incidence of an epidemic disease against time identifies the likely type of the epidemic. For a common-source epidemic, such as cholera resulting from contaminated water shared by many people, the curve rises sharply to a peak and then declines rapidly. Host-to-host infectious disease incidence rises relatively slowly as new cases accumulate. Inset photos: left, scanning electron micrograph of a Vibrio sp. closely related to Vibrio cholerae, the cholera agent; right, transmission electron micrograph of virions of H1N1 influenza virus.
Mastering Microbiology
A common-source epidemic results from an infection (or intoxication) of a large number of people from a contaminated source, such as food or water, that all infected individuals have ingested. Such epidemics are often caused by a breakdown in the sanitation of a central food or water distribution system, but they can also be more local, such as contaminated food in a particular restaurant. Foodborne and waterborne common-source epidemics are primarily intestinal diseases; the pathogen leaves the body in fecal material, contaminates food or water supplies as a result of improper sanitation, and then enters the intestinal tract of the recipient during ingestion of the food or water (Chapter 33).
Common-source disease outbreaks are characterized by a rapid rise to a peak incidence because a large number of individuals become ill within a relatively brief period of time (Figure 30.6). Moreover, assuming that epidemiological surveillance quickly identifies the disease vehicle, cases of a common-source disease decline fairly rapidly, as well. Cholera is the classic example of a common-source epidemic as the disease is almost exclusively waterborne; if a sanitation breakdown occurs (or if sanitation is lacking, as is often the case in developing countries), the cholera bacterium can be shed from a carrier or an active infection into a water source used by many other people and quickly trigger an epidemic (Figure 30.6).
In contrast to the common-source disease pattern, in a host-to-host epidemic the disease incidence shows a relatively slow, progressive rise (Figure 30.6) and a gradual decline. Cases continue to be reported over a period of time equivalent to several incubation periods of the disease. A host-to-host epidemic can be initiated by the introduction of a single infected individual into a susceptible population, with this individual infecting one or more people depending on the extent of herd immunity (Figure 30.4) in that population. In a host-to-host epidemic, the pathogen replicates in susceptible individuals, reaches a communicable stage, is transferred to other susceptible individuals, and again replicates and becomes communicable; such epidemics are often controlled by effective herd immunity due to previous infection or vaccination. Influenza and chicken pox (Chapter 31) are examples of diseases that can spread in host-to-host epidemics.
Basic Reproduction Number (R0)
The infectivity of a pathogen can be predicted using mathematical models that estimate the basic reproduction number (R0) that the pathogen may trigger. The R0 is defined as the number of expected secondary transmissions from each single case of a disease in an entirely susceptible population, and Table 30.3 lists the R0 of selected infectious diseases. R0 directly correlates with the herd immunity necessary to prevent spread of infection; the higher the R0 value, the greater the herd immunity required to stop infection (Table 30.3). Unfortunately, conditions are not always ideal and the mathematical models that predict R0 may not take into account such factors as numbers of recovered individuals, population density (close contact), length of contact time, populations of high-risk individuals, ease of travel, and other variables that may affect disease spread. As a result, R0 is a theoretical construct and can only estimate infectivity. Nevertheless, R0 is still a useful gauge of the relative infectivity of a pathogen and helps to establish targets for immunization coverage to prevent spread of a particular infectious disease.
Table 30.3 Basic reproduction number (R0) and herd immunity necessary for community protection from selected infectious diseases

aR0 and herd immunity values are the highest estimates for each disease.
bValues shown are for the pandemic (H1N1) 2009 influenza. Each influenza epidemic has a different R0 and herd immunity value. Herd immunity values assume a 100% effective vaccine. Vaccine efficacy for influenza is about 60% and observed herd immunity values are 40% or greater depending on the susceptible host populations.
We move on now to consider public health on a global basis. In the era of “globalization,” disease transmission must be considered in a global context if public health personnel are to keep epidemics from becoming pandemics.
Check Your Understanding
Distinguish between common-source and host-to-host epidemics. Cite at least one example of each. Describe how common-source epidemics can be recognized using epidemiological surveillance data.
Define the basic reproduction number for a pathogen. How does this value correlate to immunization requirements for herd immunity?
II Public and Global Health
Establishing and maintaining protocols to control the vehicles and reservoirs of infectious disease is a universal goal of public health programs around the world. International cooperation is key to effectively controlling both localized outbreaks and proliferation of infectious disease.
In Part II, we focus on public health issues including some of the methods and tools used to identify, track, contain, and eradicate infectious diseases within populations. We also draw a stark contrast between the causes of mortality in developed versus developing countries. Although noninfectious diseases are the major killer in developed countries, infectious disease remains the leading cause of mortality in other countries.
30.5 Public Health and Infectious Disease
Public health refers to the health of the general population and to the activities of public health authorities in the control of disease. The incidence and prevalence of many infectious diseases dropped dramatically during the twentieth century, especially in developed countries, because of universal improvements in public health due to advances in basic living conditions. Access to safe water and food, improved public sewage treatment, less crowded living conditions, and lighter workloads have all contributed immeasurably to disease control. Several historically important diseases, including smallpox, typhoid fever, diphtheria, brucellosis, and poliomyelitis, have been controlled (and in the case of smallpox, even eliminated) by active, disease-specific public health measures, and we review these here.
Controls Directed Against Common Vehicles and Major Reservoirs
Common vehicles for pathogen dispersal include food, water, and air. The control of foodborne and waterborne pathogens (Chapter 33) has seen the greatest successes through improved methods of preventing microbial contamination of food and water. For example, water purification procedures in the United States, first instituted early in the twentieth century, dramatically reduced the incidence of typhoid fever (Figure 30.7), and laws controlling food purity, preparation, and storage, coupled with strict monitoring of the food and water distribution network, have greatly decreased the incidence of common-source diseases. However, in contrast to food and water, controlling transmission of respiratory (airborne) pathogens is much more difficult. Other than wearing personal protection such as face masks and avoiding individuals you know are infected, few effective measures of airborne infection control are possible except in specialized environments such as hospital operating rooms where chemical and physical agents can treat the rather small amount of circulating air.
Figure 30.7 Historical progression of typhoid fever in Philadelphia.

The introduction of filtration and chlorination eliminated typhoid fever in Philadelphia and other cities with well-regulated water supplies. The risk of typhoid in the United States today is very low but occasional cases are reported.
When the disease reservoir is primarily domestic animals, infection of humans can be prevented if the disease is eliminated from the infected animal population by vaccinating herds and removing diseased individuals. However, as we have seen (Section 30.3), when the disease reservoir is a wild animal, eradication is much more difficult. Eradication of rabies, for example, would require the immunization or destruction of all wild animal reservoirs, an impossible task. When insect vectors are involved, effective control can often be accomplished with insecticides. However, the use of chemicals must be balanced with health and environmental concerns because in some cases, the elimination of one public health problem (the disease vector) simply creates another (toxic chemical exposure).
When humans are the disease reservoir—as, for example, in HIV/AIDS—control and eradication can be difficult, especially, as mentioned previously in reference to gonorrhea, if there are asymptomatic carriers. By contrast, certain diseases that are limited to humans and have no asymptomatic phase can be prevented through immunization or treatment with antimicrobial or other drugs. However, the disease can be eradicated only if those who have contracted the disease and all possible contacts are immunized, treated, or if necessary, quarantined. Such a strategy was successfully employed by the World Health Organization to eradicate smallpox worldwide (see later) and is currently being used to eradicate polio.
Immunization
Smallpox, diphtheria, tetanus, pertussis (whooping cough), measles, mumps, rubella, and poliomyelitis have been controlled primarily by immunization. Diphtheria, for example, is no longer considered even endemic in the United States. Vaccines are routinely administered in childhood for a number of other infectious diseases (Figure 28.8). As we emphasized in Section 30.4, 100% immunization is not necessary for effective disease control in a population because of herd immunity, although the percentage needed to ensure disease control is still quite high and varies with the infectivity and virulence of the pathogen (Table 30.3).
Measles epidemics offer an example of the power of herd immunity. The occasional resurgence of the highly contagious measles virus (R0=18, Table 30.3) emphasizes the importance of maintaining appropriate immunization levels for a given pathogen. Until 1963, the year an effective measles vaccine was licensed, nearly every child in the United States acquired measles through natural infections, resulting in over 300,000 annual cases. However, after introduction of the vaccine, the number of annual measles infections decreased rapidly (Figure 30.8). Case numbers reached a low of 1497 by 1983. However, by 1990, the percentage of children immunized against measles fell to 70%, and the number of new cases rose to 27,786. A concerted effort to increase measles immunization levels to above 90% (about that needed for effective herd immunity, Table 30.3) virtually eliminated measles in the United States by the early 2000s. However, in the past several years measles incidence is once again rising due to immunization levels insufficient to maintain effective herd immunity.
Figure 30.8 Measles immunization in the United States.

The introduction of a measles vaccine eliminated measles as a common childhood infection within 20 years. Inset photos: left, transmission electron micrograph of a measles virion (a negative-strand enveloped RNA virus); right, photo of an infant showing the spotted rash characteristic of measles. With an extremely high R0 (Table 30.3), measles outbreaks can spike quickly in unvaccinated populations.
Isolation, Quarantine, and Surveillance
Isolation and quarantine are effective public health measures. Isolation is the separation of persons who have an infectious disease from those who are healthy. Quarantine is the separation and restriction of well persons who may have been exposed to an infectious disease to see if they develop the disease. The length of isolation or quarantine for a given disease varies and is typically the longest period of communicability for that disease. To be effective, these measures must prevent infected or potentially infected individuals from contacting uninfected susceptible individuals. By international agreement, six infectious diseases require isolation and quarantine: smallpox, cholera, plague, yellow fever, typhoid fever, and relapsing fever. Each is a very serious, particularly communicable disease. Spread of certain other highly contagious diseases, such as Ebola hemorrhagic fever, SARS, H5N1 influenza, and meningitis, may also be subject to quarantine or isolation as outbreaks emerge in particular regions.
As mentioned earlier (Section 30.1), disease surveillance is a major job of the epidemiologist. Table 30.4 lists the infectious diseases currently under surveillance (referred to as reportable diseases) in the United States. The Centers for Disease Control and Prevention (CDC) is the agency of the United States Public Health Service that tracks disease trends reported by physicians and other health professionals, provides the latest disease information, and forms public policy regarding disease prevention. The CDC operates a number of infectious disease surveillance programs and also carries out surveillance of major noninfectious diseases, such as cancers, heart disease, and stroke. The overall practical goal of disease surveillance is to formulate and implement plans for diagnosis and treatment of infections.
Table 30.4 Reportable infectious agents and diseases in the United States

Pathogen Eradication
Concerted disease eradication programs can sometimes completely eradicate an infectious disease, and such was the case with naturally occurring smallpox, eradicated worldwide in 1980. Smallpox was a viral disease with a virus reservoir consisting solely of the individuals with acute smallpox infections, and transmission was exclusively person-to-person through direct contact. Although smallpox cannot be treated once acquired, immunization practices have been very effective. The World Health Organization (WHO) implemented a smallpox eradication plan in 1967. Because of the success of previous vaccination programs, smallpox had already been confined to endemic status in parts of Africa, the Middle East, and the Indian subcontinent. WHO field health workers proceeded to vaccinate everyone in these areas they could locate with the goal of providing either direct or herd immunity (Section 30.2) to the entire population. Each subsequent outbreak or suspected outbreak was targeted by WHO teams that quickly traveled to the outbreak site, isolated individuals with active disease, and vaccinated all contacts. To break the chain of possible infection, they then immunized everyone who had contact with the contacts, and this aggressive vaccination policy eventually eliminated smallpox.
Several other communicable diseases are candidates for global eradication. Poliomyelitis, like smallpox a viral disease with a human-only reservoir, is on its way to elimination using the same vaccination strategy used against smallpox; in 2018, a total of only 33 cases of wild polio were reported worldwide. Diseases caused by parasites have also been targeted, including Chagas disease (by treating active cases and destroying the insect vector) and dracunculiasis (by treating drinking water to prevent transmission of Dracunculus medinensis, the Guinea helminth parasite). Eradication of certain bacterial diseases is also on the horizon. For example, syphilis is a candidate because the disease is found only in humans and is readily treatable with antibiotics. Diphtheria, caused by the bacterium Corynebacterium diphtheriae, could also be eradicated worldwide by application of the strict immunization protocols that have virtually eliminated diphtheria from North America.
Check Your Understanding
Compare public measures for controlling infectious disease caused by insect vectors and human carriers.
Describe some of the public health activities of the U.S. Centers for Disease Control and Prevention.
30.6 Global Health Comparisons
The World Health Organization (WHO) has divided the world into six geographic regions for the purpose of collecting and reporting health information, such as causes of morbidity and mortality. These geographic regions are Africa, the Americas (North America, the Caribbean, Central America, and South America), the eastern Mediterranean, Europe, Southeast Asia, and the western Pacific. Here we compare mortality data from a relatively developed region, the Americas, to those from a developing region, Africa, to emphasize the fact that infectious diseases are still major causes of morbidity and mortality in many regions of the world.
Infectious Disease in the Americas and Africa
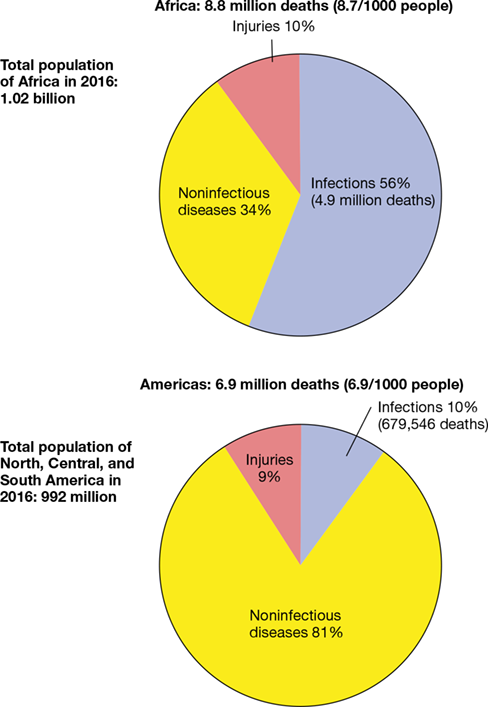
Mortality statistics in developed and developing countries are significantly different, as illustrated by a comparison of data from the Americas and from Africa in 2016 when the worldwide population was nearly 7.5 billion. Worldwide, 56.9 million individuals died, giving a mortality rate of 7.6 deaths per 1000 inhabitants per year, and 11.4 million (20%) of these deaths were attributable to infectious diseases. There were 992 million people in the Americas in 2016, and there were 6.9 million deaths, or 6.9 deaths per 1000 persons per year. In Africa, there were 1.02 billion people in 2016 and 8.8 million deaths, or 8.7 deaths per 1000 persons per year. These statistics show differences in overall mortality between developed and developing regions, but a comparative examination of the causes of mortality is even more instructive.
Figure 30.9 indicates that infectious diseases caused the most deaths in Africa, whereas in the Americas, noninfectious diseases, such as cancer and cardiovascular disease, were the leading causes of mortality. In Africa, there were about 4.9 million deaths due to infectious diseases, and the life expectancy was 61 years of age. The African death toll due to infectious diseases was nearly 9% of the total deaths in the world. In stark contrast, only 679,546 died of infectious disease in the Americas, and the life expectancy was 75 years of age.
Figure 30.9 Causes of death in Africa and the Americas, 2016.
Noninfectious diseases include cancer, cardiovascular diseases, and diabetes. Injuries include accidents, murder, suicide, and war. Data are from the World Health Organization, Geneva.
The higher life expectancy in developed countries is a direct consequence of the reduction in death rates from infection over the last century, and most of these gains are due to advances in public health. By contrast, lack of resources in developing countries limits access to adequate sanitation, safe food and water, immunizations, healthcare, and medicines, leading to increases in infectious diseases and, as a consequence, to significantly shorter life expectancy. Interestingly, some health professionals predict that life expectancies in certain developed regions may soon begin to decrease, but this is not attributed to infectious diseases. On the contrary, lifestyle diseases are emerging as a major health factor in the Americas, and obesity-related health complications, such as type 2 diabetes, coronary heart disease, and hypertension, are becoming more prevalent.
Travel to Endemic Areas
The high incidence of disease in many parts of the world is a concern for people traveling to such areas. However, travelers can be immunized against many of the diseases that are endemic in foreign countries. Specific recommendations for immunization for those traveling abroad are updated biannually and published by the CDC (http://www.cdc.gov/).
For many countries, immunization certificates for yellow fever are required for entry from areas with endemic yellow fever. These areas include much of equatorial South America and Africa. Most other nonstandard immunizations, such as those for rabies and plague, are recommended only for people who are expected to be at high risk, such as veterinary healthcare providers. The CDC summarizes current information for the potential for infectious disease transmission throughout the world, including diseases for which currently there are no effective (or only experimental) vaccines (for example, HIV/AIDS, malaria, Ebola hemorrhagic fever, dengue fever, amebiasis, encephalitis, and typhus). Travelers should take precautions, such as avoiding insect and animal bites, drinking only water that has been properly treated to kill all microorganisms, eating properly stored and prepared food (and avoiding fresh uncooked foods), and undergoing antibiotic and chemotherapeutic programs for prophylaxis or for suspected exposures. Although these precautions do not guarantee that one will remain disease-free, adhering to them greatly reduces the risk of infection.
Sometimes diseases appear to “come out of nowhere” or, alternatively, reappear after a long absence. In the final part of this chapter, we explore these interesting cases of infectious disease.
Check Your Understanding
Contrast mortality due to infectious diseases in Africa and the Americas.
Do you know what vaccinations you have received? List infectious diseases for which you have not been immunized and with which you could come into contact next year.
III: Emerging Infectious Diseases, Pandemics, and Other Threats
III: Emerging Infectious Diseases, Pandemics, and Other Threats
III Emerging Infectious Diseases, Pandemics, and Other Threats
Emerging diseases, infectious disease pandemics, and the malicious use of bioweapons present a constant threat to human welfare. Vigilant surveillance is necessary to detect these threats to global health and to respond in an effective way.
In recent years, new infectious diseases have emerged and established diseases have reemerged with alarming frequency. In Part III of this chapter, we discuss some of these diseases and the reasons for their sudden emergence or reemergence. We also investigate the potential for the purposeful use of infectious microbes as agents of war or civilian terror.
30.7 Emerging and Reemerging Infectious Diseases
Infectious diseases are global, dynamic health problems. In this section we examine some recent patterns of infectious disease, some reasons for the changing patterns, and the methods used by epidemiologists to identify and deal with new threats to public health.
Emerging and Reemerging Diseases
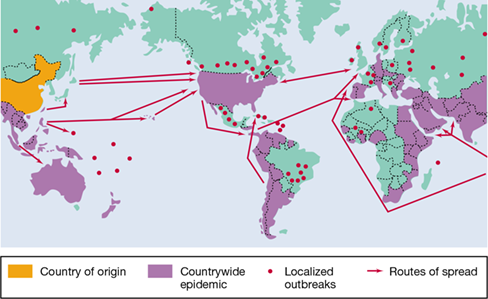
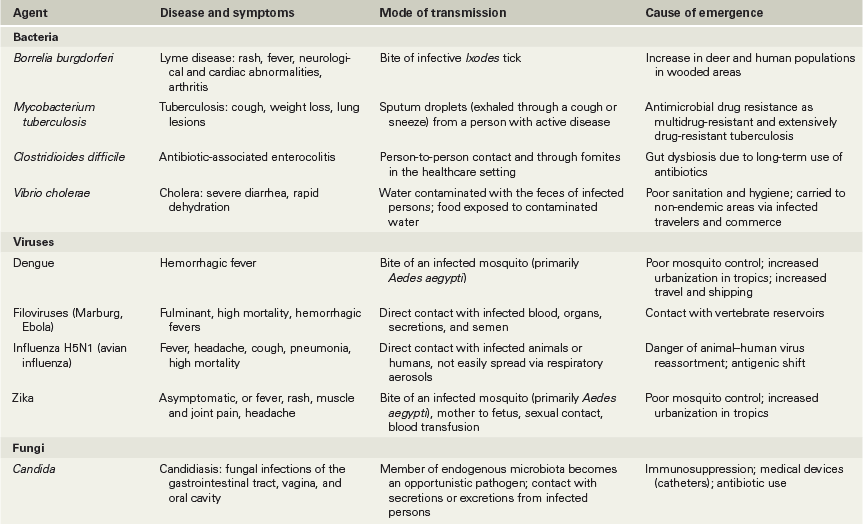
The worldwide distribution of diseases can change dramatically and rapidly. Alterations in the pathogen, the environment, or the host population contribute to the spread of new diseases, with potential for high morbidity and mortality. Diseases that suddenly become prevalent are called emerging diseases and are not limited to “new” diseases; they also include reemerging diseases, diseases that were previously under control but suddenly appear as a new epidemic. Examples of global emerging and reemerging disease are shown in Figure 30.10, and select diseases with high potential for emergence or reemergence are described in Table 30.5. Occasionally, new diseases emerge unexpectedly and for unknown reasons. For example, within just a few years of its discovery, the drug-resistant yeast Candida auris is an emerging pathogen that is becoming a significant concern as a causative agent of serious healthcare-associated infections (see MicrobiologyNow at the opening of this chapter).
Figure 30.10 Recent outbreaks of emerging and reemerging infectious diseases.

The diseases shown are local outbreaks capable of producing widespread epidemics and pandemics. Not shown are established pandemic diseases such as HIV/AIDS and predictable annual epidemic diseases such as seasonal epidemic human influenza. MERS, Middle East respiratory syndrome. Avian influenza is caused by influenza A H5N1 (Section 30.8).
Table 30.5 Emerging and reemerging epidemic infectious diseases

Emerging epidemic diseases are not a new phenomenon. Among the diseases that rapidly and sometimes catastrophically emerged in the past are plague (caused by the bacterium Yersinia pestis) and influenza. For example, in the Middle Ages, up to one-third of all humans were killed by the periodic plague epidemics that swept across Europe, Asia, and Africa. Influenza caused a devastating worldwide pandemic in 1918–1919, claiming up to 100 million lives, and the pandemic H1N1 influenza virus that emerged in 2009 killed up to a half million people in its first year. In the 1980s, HIV/AIDS and Lyme disease emerged as new diseases, and health officials worldwide are paying particular attention to the potential for rapid emergence of pandemic influenza developing from H5N1 avian influenza. In 2014 and again in 2019, isolation of patients and extra protections for their caregivers were practiced during the West African and central African Ebola hemorrhagic fever epidemics (Section 31.12 and Figure 31.34b) to prevent the spread of this extremely dangerous viral disease.
Emergence Factors
Many factors play into the emergence of new pathogens, including human demographics and behavior, economic development, global travel, public health breakdowns, and other factors. The movement of humans from rural to urban areas facilitates disease transmission. For example, high population densities in cities have facilitated transmission of dengue fever (Section 32.5), a serious mosquito-borne viral disease that infects about 400,000 people yearly, mostly in tropical and subtropical urban areas, including far southern reaches of the United States (Figure 30.11). Human behavior in large population centers, such as sexually promiscuous practices that cause the spread of hepatitis and HIV/AIDS, also contributes to disease emergence. Changes in land use may also promote the spread of disease. For example, Lyme disease, the most common vectorborne disease in the United States, is on the rise largely due to residential reforestation efforts, which increase contact between Lyme-infected deer ticks and humans, consequently increasing disease incidence.
Figure 30.11 Dengue virus 2018.

Dengue virus is now found in all tropical and subtropical countries as a result of the spread of its Aedes aegypti mosquito vector. The red areas are now endemic for the virus and mosquito vector. The red dots indicate outbreaks outside the known endemic areas. Prior to 1981, dengue virus was unknown in the Americas. Data are from the CDC, Atlanta, Georgia, USA.
Common-source foodborne disease epidemics occur when sanitation measures in the food industry fail. In 2009, a single U.S. meat-processing plant spread Escherichia coli O157:H7 to people in eight states. The contaminated food source, ground beef, was recalled and the epidemic was eventually stopped, but not before several people died. International travel and commerce also affect the spread of pathogens. For example, a single person harboring Ebola virus on an international flight could infect many other passengers because of the ease with which the Ebola virus spreads (Section 31.12). In such cases, the disease can rapidly spread to major population centers if healthy passengers who had contact with the diseased passenger become infected and then disembark and continue their travels.
Pathogen adaptation can contribute to disease emergence. For example, most RNA viruses, including influenza and HIV, mutate rapidly. These mutant RNA viruses present major epidemiological problems because their altered genomes often affect their antigens, making immunity to old viral antigens ineffective for neutralizing the mutant viruses. Bacterial genetic mechanisms are also capable of enhancing virulence and promoting emergence of new epidemics. Virulence-enhancing factors are often carried by mobile genetic elements (Chapter 13) that can be transferred between members of the same species, and sometimes to other species, as well. Such transfers can quickly generate emerging pathogens, and multidrug-resistant strains of Staphylococcus aureus and Pseudomonas aeruginosa are good examples of this.
A breakdown of public health measures is sometimes responsible for the emergence or reemergence of diseases. For instance, cholera (caused by Vibrio cholerae) can be adequately controlled, even in endemic areas, by providing proper sewage disposal and water sanitation. As discussed in Section 30.8, any compromise to water treatment systems, especially as a result of natural disasters such as earthquakes and flooding, can cause local outbreaks. Inadequate public vaccination programs can also lead to the resurgence of previously controlled diseases. For example, pertussis, a serious but preventable childhood respiratory disease, has increased recently in Eastern Europe and in the United States, partly because of inadequate immunization among adults and children.
Finally, weather patterns can also upset the usual host–pathogen balance. Disease vectors such as mosquitoes have been moving northward in response to climate change. Even a single seasonal weather abnormality can have an effect, as evidenced by the 1993 hantavirus hemorrhagic fever outbreak in the American Southwest (Section 32.2). A very mild winter coupled with record rainfall led to an explosive increase in the population of rodents that can host hantavirus. This increased exposures for susceptible human hosts and led to the spread of this lethal zoonotic disease.
The Emergence of Toxigenic *Clostridioides difficile*
In many cases, antibiotic use itself can be a driver of pathogen emergence. As discussed in Chapter 24, prolonged use of antibiotics to treat infections can lead to enteric dysbiosis, a disruption to the composition of the normal gut microbiota. Opportunistic pathogens that are resistant to these antibiotics can then flourish, causing potentially serious secondary infections. Clostridioides (formerly Clostridium) difficile is one of these pathogens (Figure 30.12), and it has rapidly emerged over the past two decades as a major cause of life-threatening, antibiotic-associated enterocolitis (inflammation of the digestive tract).
Figure 30.12 *Clostridioides difficile*, an emerging pathogen and causative agent of antibiotic-associated enterocolitis.

(a) Plate culture of C. difficile grown on cycloserine–cefoxitin–fructose agar. The culture is illuminated with ultraviolet light, resulting in a chartreuse fluorescence from the colonies. (b) Photomicrograph showing cells of C. difficile. Note the developing endospores (arrows) inside the rod-shaped cells.
Causing nearly half a million cases of illness and about 30,000 deaths every year in the United States alone, mostly among the elderly and immunocompromised, C. difficile has become a considerable medical challenge. About 80% of cases of C. difficile infection (CDI) are healthcare-associated (nosocomial, Section 29.2) and occur in those age 65 and older. In addition to being multidrug resistant, C. difficile is able to form endospores (Figure 30.12b; Section 2.8). These highly resistant structures can remain viable following standard disinfection and hygiene protocols used in the healthcare setting, including resistance to alcohol-based hand sanitizers, and therefore the bacterium tends to persist on fomites and surfaces. Subsequent transfer of the endospores, often through healthcare personnel that have come into contact with contaminated materials, to patients undergoing long-term antibiotic treatment can lead to the onset of life-threatening diarrheal colitis.
The symptoms of CDI are caused by the production of two exotoxins: toxin A (TcdA) and toxin B (TcdB). These toxins are glucosyltransferases that inactivate guanosine triphosphatases in colonic epithelial cells. This activity disrupts actin dynamics in the cytoskeleton and eventually kills the cells. Antibiotic treatment of CDI using metronidazole, vancomycin, or the more recently approved fidaxomicin, a bactericidal antibiotic that inhibits RNA synthesis, is not universally effective. There is evidence that implementing a high-fiber diet can aid in recovery from CDI, but by far the most effective treatment to date has been fecal transplant, the infusion of fecal matter and its associated gut microbiota from a healthy donor into the diseased patient (Section 24.11). This treatment has shown remarkable success in allowing full recovery from C. difficile infection in up to 95% of cases.
Addressing Emerging Diseases
The keys for addressing emerging diseases are prompt recognition of the disease and intervention to prevent pathogen transmission. Emerging diseases have, at least at first, low incidence and are usually absent from the official notifiable disease list for the United States prepared by the CDC (Table 30.4). Emerging diseases are first recognized from their unique epidemic incidence, clusters and other epidemiological patterns, and clinical symptoms unrelated to known pathogens. Such disease patterns trigger intensive public health surveillance followed by specific interventions designed to control further outbreaks. Methods such as isolation, quarantine, immunization, and drug treatment can be applied to contain outbreaks. For vectorborne and zoonotic diseases, the nonhuman host or vector must be identified to intervene in the life cycle of the pathogen and stop human infection.
International public health surveillance and intervention programs were instrumental in controlling the emergence of severe acute respiratory syndrome (SARS), a disease that appeared suddenly in Asia and unpredictably from a zoonotic source. On the other hand, even a rapid and focused response was unsuccessful in containing the spread of pandemic (H1N1) 2009 influenza, as we will see in the next section.
Check Your Understanding
What is the difference between an emerging and a reemerging infectious disease?
What factors are important in the emergence or reemergence of potential pathogens, such as Clostridioides difficile?
Indicate general and specific methods that would be useful for identifying emerging infectious diseases.
30.8 Examples of Pandemics: HIV/AIDS, Cholera, and Influenza
30.8 Examples of Pandemics: HIV/AIDS, Cholera, and Influenza
30.8 Examples of Pandemics: HIV/AIDS, Cholera, and Influenza
Through the centuries, several diseases have reached pandemic proportions. Here we consider three—HIV/AIDS, cholera, and influenza—for which epidemiological studies have been extensive.
HIV/AIDS
HIV/AIDS is a continuum of disease, starting with the infection of an individual with the human immunodeficiency virus (HIV). Eventually, infection results in acquired immunodeficiency syndrome (AIDS), a disease which, if not treated, cripples the immune system, leading to opportunistic infections that can be fatal (Section 31.15). The first reported cases of AIDS were diagnosed in the United States in 1981. Since then, more than 1.2 million cases have been reported in the United States with over 650,000 deaths (Figure 30.13); worldwide, about 35 million AIDS deaths have occurred.
Figure 30.13 Annual new cases of human immunodeficiency virus/acquired immunodeficiency syndrome (HIV/AIDS) in the United States.

Cumulatively, there were about 1.3 million cases of HIV/AIDS through 2016. In 2009, the HIV/AIDS case definition changed to include all new HIV infections and AIDS diagnoses (Section 31.15). Colored arrows indicate the introduction of different anti-HIV drugs. See Sections 28.6 and 31.15 for a discussion of anti-HIV therapies. Data are from the HIV Surveillance Report: Diagnosis of HIV Infection in the United States and Dependent Areas, 2017, CDC, Atlanta, Georgia, USA.
Epidemiological studies in the United States in the 1980s suggested a high AIDS prevalence among men who have sex with men and among intravenous drug abusers. Individuals receiving blood or blood products were also at high risk. Collectively, these epidemiological data indicated a transmissible agent transferred during sexual activity or by contaminated blood. Soon after the discovery of HIV in 1983, laboratory tests were developed to detect antibodies to the virus in blood. With this tool in hand, surveys of HIV incidence and prevalence defined the spread of HIV and showed conclusively that body fluids, primarily blood and semen, were the vehicles for transmission of the virus (Figure 30.14).
Figure 30.14 Distribution of AIDS cases by risk group and gender in the United States, 2016.

Data from the CDC, Atlanta, Georgia, USA, were gathered from 31,931 males and 7,528 females diagnosed with HIV/AIDS in 2016.
The HIV/AIDS data showed that in the United States, the number of AIDS cases was disproportionately high in men who have sex with men, but among women, heterosexuals were the largest risk group (Figure 30.14). Further analyses of the epidemiological data showed that the new infection rate for African American men was seven times that of Caucasian males, indicating that social and economic factors may also influence infection risk. However, regardless of gender or racial specifics, AIDS epidemiology provided a clear picture of HIV transmission: Virtually all who acquired HIV engaged in sex or intravenous drug use in which body fluids—semen or blood—were transferred and commonly had sex or exchanged syringe needles with multiple partners. We discuss the pathology and therapy of HIV/AIDS in Section 31.15.
Cholera
Cholera is primarily a waterborne infection (Section 33.3 and Figure 33.2) that is normally kept in check by appropriate public health measures for water treatment (Chapter 22). Cholera is caused by ingestion of contaminated water containing Vibrio cholerae, a gram-negative, curved rod–shaped species of Proteobacteria that produces a powerful enterotoxin that triggers severe diarrhea (Section 25.6 and Figure 25.16). Cholera is endemic in Africa, Southeast Asia, the Indian subcontinent, and Central and South America. Epidemic cholera occurs frequently in areas where sewage treatment either suffers a major breakdown, as can result from a flood or an earthquake, or is inadequate or altogether absent. Indeed, it is estimated that a greater percentage of the world’s population has access to cellular phones than to water sanitation facilities. In 2016, the World Health Organization (WHO) reported over 130,000 cases of cholera that led to 2420 deaths. However, the WHO estimates that only 5–10% of cholera cases are actually reported because diarrheal diseases from various pathogens are so common (Table 30.1); thus, total worldwide incidence of cholera likely exceeds 1 million cases per year.
Epidemic cholera may develop into pandemics when travelers from endemic areas carry the pathogen to new locations with susceptible populations and poor sanitation. Since 1817, cholera has swept the world in seven major pandemics (Figure 30.15). All but one of these originated on the Indian subcontinent, where cholera is endemic. Two distinct pandemic strains of V. cholerae are recognized, known as the classic and the El Tor biotypes. The V. cholerae O1 El Tor biotype started the seventh pandemic in Indonesia in 1961, and its spread continues to the present day. This pandemic has caused over 5 million cases of cholera and at least 250,000 deaths and continues to be a major cause of morbidity and mortality, especially in developing countries (Figure 30.15).
Figure 30.15 Cholera pandemic timeline.

Seven cholera pandemics have been nearly consecutive for over 200 years. The seventh pandemic started in 1961 and is ongoing. The O139 strain that appeared in 1991 is endemic to Bangladesh and the Bay of Bengal and is causing epidemics that may be the prelude to an eighth pandemic.
In October 2010 Haiti experienced its first cholera in over 100 years, and in just two years experienced nearly 600,000 cases and 8000 deaths. The outbreak began in the aftermath of the catastrophic 2010 earthquake. There were likely two triggers of this cholera outbreak, the first being a classic scenario of poor sanitation following a disaster and the second an accidental importation from an outside source. Vibrio cholerae is present in marine waters, and as a result of the earthquake, cells of this pathogen may have washed into coastal freshwaters where they contaminated drinking water sources. But in addition, United Nations aid workers that arrived from Nepal, where a recent cholera outbreak had occurred, inadvertently shed V. cholerae into sanitation streams that found their way into Haitian drinking water sources.
Pandemic (H1N1) 2009 and Future Influenza Pandemics
Human influenza pandemics occur every 10 to 40 years as a result of major genetic changes in the influenza A virus genome that affect the virus’s immune status (antigenic drift and antigenic shift, Section 31.8 and Figure 31.26). The most devastating influenza pandemic of all time occurred in 1918; this flu infected over half a billion people worldwide and killed approximately 50 million people before it ran its course. The 1918 pandemic was caused by a strain of influenza termed H1N1.
A more recent influenza pandemic began in March 2009 with the outbreak of epidemics in Mexico. The culprit virus, a strain designated (H1N1) 2009, was a hybrid of the 1918 strain and a later strain that caused a pandemic in 1957; (H1N1) 2009 contained genes from bird, swine, and human influenza viruses. Such reassortant viruses, as they are called (Section 31.8), can be highly virulent, as they tend to produce antigens to which humans have no prior exposure and thus no immunity.
Without prior exposure and with no effective vaccine at the ready, the stage was set for the reassortant (H1N1) 2009 flu to spread rapidly and reach pandemic proportions. Within six months of its emergence, (H1N1) 2009 had spread to almost every country in the world, qualifying it as a true pandemic (Figure 30.16). Although official numbers range widely, it is estimated that more than a quarter of the world’s population was infected in the pandemic. In the United States, about 60 million persons were infected, with mortality confirmed as due to (H1N1) 2009 numbering about 3400 persons. By late 2010 the (H1N1) 2009 pandemic was fading, and today few cases are observed because antigens from this strain of virus are typically included in seasonal influenza vaccines (Table 28.3).
Figure 30.16 Pandemic (H1N1) 2009 influenza incidence.

Data show minimal estimates of cases worldwide by country. It is estimated that approximately 1.7 billion people were infected by the (H1N1) 2009 pandemic flu (24% of the total population) and that deaths were between 150,000 and 575,000 [the large range for mortality estimates is because many deaths that were likely due to (H1N1) 2009 were not confirmed as such].
Could new influenza pandemics sweep across the world? Perhaps the greatest threat to global stability would be another influenza pandemic that has the virulence and infectivity of the 1918 pandemic. Because epidemiological surveillance is currently so extensive, this possibility is unlikely, but the risk can never be zero. In recent years public health officials worldwide have been following the emergence and reemergence of a potentially devastating strain of influenza virus designated influenza A H5N1, originally found in birds. This virus first appeared in Hong Kong in 1997, jumping directly from chickens and ducks to humans. Since then H5N1 has reemerged several times in small outbreaks, with the most recent occurring in Egypt, Indonesia, Cambodia, Bangladesh, and China (Figure 30.10). Through 2018, 860 cases of human H5N1 infection have been confirmed, resulting in 454 deaths, for a mortality rate of 53%. This high mortality rate underscores the lethal potential of this virus.
Besides poultry and humans, H5N1 has also infected swine. If a reassortant strain were to emerge from pigs and had the capacity to spread from person to person, such a virus could trigger an influenza pandemic of unprecedented mortality. Because of this, plans are in place nationally and internationally to provide appropriate vaccines and support for potential pandemics initiated by this and other emergent influenza strains. We discuss the disease influenza in detail in Section 31.8.
Check Your Understanding
Describe the major risk factors for acquiring HIV infection in the United States. How do these differ in males and females?
Identify the most likely means of acquiring cholera. Why do cholera epidemics keep occurring?
What is a reassortant influenza virus and why can such viruses be so dangerous?
30.9 Public Health Threats from Microbial Weapons
As if avoiding the wrath of pathogenic microbes that can infect us naturally is not enough, humans have researched the use of certain pathogens as weapons to be intentionally deployed on others. Biological (microbial) warfare is the use of microbial agents to incapacitate or kill a military or civilian population in an act of war or terrorism. Although the use and development of microbial weapons are forbidden by international law, microbial weapons have already seen use, and facilities for their production likely exist in rogue countries and perhaps also in avowed terrorist groups. Because of this, microbial weapons research continues in many peaceful nations so as to best understand the most serious threats and learn how to counter them.
Characteristics of Microbial Weapons
Effective microbial weapons are pathogens, or in a few cases toxins, that are (1) relatively easy to produce and deliver, (2) safe for use by the offensive forces, and (3) able to incapacitate or kill people in a systematic and consistent manner. Although microbial weapons are potentially useful in the hands of conventional military forces, the greatest likelihood of microbial weapons use is by terrorists because of the ready availability and low cost of producing and propagating many of the organisms.
Virtually all pathogenic bacteria or viruses can potentially be used for biological warfare, and select agents that have significant potential for use as microbial weapons are listed in Table 30.6. The most frequently mentioned candidates are smallpox virus and Bacillus anthracis, the bacterium that causes anthrax. Both of these microbes can be easily disseminated, are transmissible from person to person, and typically cause high mortality. Other agents have their advantages and disadvantages as microbial weapons and are categorized as to their potential risk from Category A to Category C in Table 30.6.
Table 30.6 Select agents and diseases by bioweapons threat categorya

aSource: Centers for Disease Control and Prevention, Atlanta, Georgia, USA.
The United States government, through the Centers for Disease Control and Prevention, has developed the Select Agent Program surveillance system to monitor possession and use of potential bioterrorism agents. In addition, the CDC Laboratory Response Network and the Health Alert Network have been upgraded to enhance their diagnostic capabilities and increase the reporting abilities of local and regional healthcare centers to rapidly identify bioterrorism events as well as emerging diseases.
Smallpox and Anthrax
Smallpox virus (Figure 30.17a) has intimidating potential as a microbial weapon because it can be spread easily by direct contact or by aerosol spray; is highly debilitating; causes a high fever, severe fatigue, and the eventual formation of pus-filled skin blisters (Figure 30.17b); and has a mortality rate of 30% or higher. Although an extremely effective smallpox vaccine is available, it has not been in use in the general population since smallpox was eradicated worldwide in 1980. Moreover, the potential of smallpox virus being deployed as a military weapon is considered low because military personnel are routinely vaccinated. Nevertheless, preparations for a potential smallpox attack on civilians in the United States have been made and would include immunization of key individuals, such as those attending smallpox patients or handling clinical specimens from smallpox patients.
Figure 30.17 Smallpox and its use as a microbial weapon.

(a) Smallpox virus, a double-stranded DNA virus (Section 11.6). (b) Characteristic papular smallpox rash and blisters on the arm. Smallpox was officially declared eradicated worldwide in 1980.
Bacillus anthracis is the causative agent of anthrax, and its unique properties allow it to be easily employed as a bioweapon. Chief among these is that it is easily grown aerobically, producing distinctive colonies on enriched culture media, and it differentiates into highly resistant endospores (Figure 30.18a, b; Section 2.8). Once prepared, endospores can be dried and stored indefinitely and then disseminated as a weapon by aerosol or in powdered suspension. There are three clinical forms of anthrax (Section 32.8). Cutaneous anthrax is contracted when abraded skin is contaminated by B. anthracis endospores; the organism grows and kills the skin, forming a necrotic tissue lesion called an eschar (Figure 30.18c). The rarest form, gastrointestinal anthrax, is contracted from consumption of endospore-contaminated plants or meat from animals infected with anthrax. Inhalation anthrax (also called pulmonary anthrax) is the deadliest form and is contracted when B. anthracis endospores are inhaled. The symptoms of inhalation anthrax include pulmonary and cerebral hemorrhaging (Figure 30.18d), which makes this form of anthrax especially dangerous. All forms of anthrax have the potential to become systemic infections; however, cutaneous anthrax is easily treatable with antibiotics and is fatal in only about 20% of untreated cases. Without treatment, gastrointestinal anthrax is fatal in about half of those infected, whereas inhalation anthrax mortality approaches 100%.
Figure 30.18 *Bacillus anthracis* and anthrax.
(a) Bacillus anthracis is a gram-positive, endospore-forming rod approximately 1μm in diameter and 3−4μm in length. Note the developing endospores (arrows). (b) Characteristic “ground glass” appearance of colonies of B. anthracis on blood agar plates. (c) Cutaneous anthrax. The blackened lesion seen on this forearm is called an eschar, and results from tissue necrosis. (d) Inhalation anthrax can cause cerebral hemorrhage, as shown by the dark coloration in this fixed and sectioned human brain removed at autopsy.
Inhalation anthrax is the form of the disease that makers of microbial weapons would aim for, as has already transpired in the United States. At least 22 cases of anthrax leading to five deaths occurred in a 2001 bioterrorism attack in which B. anthracis endospore preparations were mailed in envelopes to certain news outlets and government officials. Of the 22 anthrax cases, 11 were inhalational and 11 cutaneous. These weaponized anthrax endospore preparations were mixed within a fine particulate material that allowed the endospores to be spread by air currents. Thus, opening an envelope containing the lethal mixture (or releasing it into a ventilation system) could contaminate surrounding areas and personnel.
Vaccination for anthrax is possible and is restricted to individuals who are considered at risk. This includes agricultural animal workers (livestock tenders and those working with animal products), laboratory personnel working with anthrax, veterinarians, and military personnel. As was discussed with smallpox, anthrax is an unlikely military weapon but could be a very effective means of terrorizing a civilian population because the vast majority of the population is unvaccinated.
We move on now from our consideration of disease tracking to exploring human infectious diseases themselves, grouped by their mode of transmission in the final four chapters.
Check Your Understanding
What characteristics make a pathogen or its products particularly useful as a biological weapon?
Indicate the steps you would take to identify and treat infections from smallpox virus or anthrax in a bioterror attack.
Chapter Review
Go to Mastering Microbiology for videos, animations, practice tests, and more.
I Principles of Epidemiology
30.1 Epidemiology is the study of the occurrence, distribution, and determinants of health and disease in populations. Epidemiologists employ surveillance measures to record the incidence and prevalence of infectious diseases and track disease outbreaks that may lead to epidemics or pandemics. The morbidity and mortality of any given disease is a function of the transmissibility of the pathogen and the severity of the disease symptoms. Disease carriers may be symptom-free, or they may have chronic infections that are never resolved.
Q Distinguish between disease incidence and disease prevalence. Which value is a predictor of risk of disease?
30.2 Effects on populations as well as individuals must be studied to understand infectious disease. The interactions of pathogens with hosts can be dynamic, affecting the long-term evolution and survival of all species involved. Herd immunity provides disease protection for susceptible hosts.
Q Herd immunity does not need to be 100% to effectively stop disease transmission; why is this?
30.3 Infectious diseases can be transmitted directly from person to person, indirectly from living vectors or inanimate objects (fomites), or from common-source vehicles such as food and water. Disease reservoirs can include soil, insects, infected people before they show symptoms, chronic carriers, and many other sources. An understanding of disease reservoirs, carriers, and pathogen life cycles is critical for controlling disease epidemics.
Q Compared with a fomite, such as a contaminated cup, why is a disease vehicle such as food a much more powerful disease transmitter?
30.4 Epidemics may be of host-to-host origin or originate from a common source. The basic reproduction number (R0) of a pathogen gives a relative picture of its seriousness and an indication of how effective herd immunity must be to prevent its spread.
Q If an emerging pathogen was found to have an R0 of 20, would herd immunity need to be higher or lower than for an emerging pathogen with an R0 of 5?
II Public and Global Health
30.5 Food and water purity regulations, vector control, immunization, quarantine, isolation, and disease surveillance are all public health measures that reduce the incidence of communicable diseases. In the case of some diseases, such as smallpox, total eradication worldwide has been possible.
Q If an outbreak of yellow fever occurred, who would be isolated and who would be quarantined?
30.6 Infectious diseases account for about 20% of all mortality worldwide. Most cases of infectious diseases occur in developing countries. Control of many infectious diseases can be accomplished by public health measures that include adequate sanitation, food and water protections, and widespread vaccination programs. A high infectious disease load can significantly reduce the average life expectancy of the population in a country.
Q Contrast the leading causes of death in Africa and in the Americas.
III Emerging Infectious Diseases, Pandemics, and Other Threats
30.7 Changes in host, vector, or pathogen conditions, whether natural or artificial, can encourage the explosive emergence or reemergence of infectious diseases. Global surveillance and intervention programs by organizations such as the World Health Organization and the U.S. Centers for Disease Control and Prevention are especially attuned to emerging and reemerging pathogens to prevent local epidemics from spreading.
Q How can bacterial genetic exchange fuel the emergence of new pathogens?
30.8 Several infectious diseases with significant mortality show pandemic characteristics. HIV/AIDS affects those who exchange bodily fluids, most often by either promiscuous unprotected sex or intravenous drug use. Cholera is primarily a waterborne infection, and control can be achieved by maintaining adequate clean water and waste sanitation measures. New pandemic influenza strains resulting from bird–swine–human influenza reassortments present the biggest infectious disease threat worldwide.
Q Why is H5N1 avian influenza considered a major threat to public health?
30.9 Bioterrorism from smallpox or anthrax is a threat in a world of rapid international travel and easily accessible technical information. Aerosols or disease vehicles are the most likely modes of delivery of microbial weapons. Prevention and containment measures rely on a well-prepared public health infrastructure.
Q Why are smallpox and anthrax more likely to be bioterrorism threats to civilians than to military personnel?
Application Questions
Smallpox, a disease that was limited to humans, was eradicated, whereas plague, a zoonotic disease with a reservoir in rats and related rodents, will likely never be eradicated worldwide. Explain this statement. Devise a plan to eradicate plague in a limited area such as a town or city. Be sure to consider methods that involve the reservoir, the pathogen, and the host.
Like smallpox, HIV/AIDS is considered to be a disease that could be eliminated worldwide because it is propagated by known means and there are no animal reservoirs. Although eliminating HIV infection is possible, why would it be much more difficult than eliminating smallpox? What would be involved in an HIV infection eradication program?
H5N1 avian influenza has high potential for causing a pandemic under certain circumstances. If such a highly transmissible human–avian strain were to evolve in Asia and you were a national public health official, what measures would you employ to stop the spread of the new influenza strain to other continents? If you failed to contain the new virus, where would you expect to see the first cases of such pandemic influenza, in metropolitan or rural areas?
Chapter Glossary
a short-term infection, usually characterized by dramatic onset Basic reproduction number (R0)
the number of expected secondary transmissions from each single case of a disease in an entirely susceptible population Biological (microbial) warfare
the use of microbial agents to incapacitate or kill a military or civilian population in an act of war or terrorism Carrier
a subclinically infected individual who may spread a disease Centers for Disease Control and Prevention (CDC)
the agency of the United States Public Health Service that tracks disease trends, provides disease information to the public and to healthcare professionals, and forms public policy regarding disease prevention and intervention Chronic infection
an infection (or intoxication) of a large number of people from a contaminated common source such as food or water Disability-adjusted life year (DALY)
a quantitative measure of disease burden defined as the cumulative number of years lost due to an illness itself, a disability due to an illness, or premature death Disease surveillance
the observation, recognition, and reporting of diseases as they occur Emerging disease
an infectious disease whose incidence recently increased or whose incidence threatens to increase in the near future Endemic disease
a disease that is constantly present, usually in low numbers, in a population Epidemic
the occurrence of a disease in unusually high numbers in a localized population Epidemiology
the study of the occurrence, distribution, and determinants of health and disease in populations Fomite
an inanimate object that when contaminated with a viable pathogen can transfer the pathogen to a host Herd immunity
the resistance of a population to a pathogen as a result of the immunity of a large portion of the population Host-to-host epidemic
an epidemic resulting from person-to-person contact, characterized by a gradual rise and fall in number of new cases Incidence
the number of new reported cases of a disease in a population in a given time period Isolation
in the context of infectious disease, the separation of persons who have an infectious disease from those who are healthy Morbidity
the incidence of disease in a population Mortality
the occurrence of a large number of cases of a disease in a short period of time Pandemic
a widespread, usually worldwide epidemic Prevalence
the total number of new and existing cases of a disease reported in a population in a given time period Public health
the health of the population as a whole Quarantine
the separation and restriction of well persons who may have been exposed to an infectious disease to see if they develop the disease Reemerging disease
an infectious disease previously under control but that produces a new epidemic Reservoir
a source of infectious agents from which susceptible individuals may be infected Vector
a living agent that transfers a pathogen (differs from genetic vector, discussed in Chapter 12) Vehicle
a nonliving source of pathogens that transmits the pathogens to large numbers of individuals; common vehicles are food and water Virulence
the relative ability of a pathogen to cause disease Zoonosis
any disease that occurs primarily in animals but can be transmitted to humans
31 Person-to-Person Bacterial and Viral Diseases
## Chapter 31 Person-to-Person Bacterial and Viral Diseases
III Direct-Contact Bacterial and Viral Diseases
Reversing Antibiotic Resistance in a Recalcitrant Pathogen
Tuberculosis (TB) is a highly prevalent and life-threatening respiratory disease, causing nearly 1.5 million deaths annually. Here we highlight a new strategy for effective treatment of this devastating disease.
The causative agent of TB, Mycobacterium tuberculosis (yellow-green cells in photo shown being engulfed by a macrophage, red), is a slow-growing, gram-positive and acid-fast bacterium that is treated clinically by administration of a suite of drugs for many months. Chief among these is isoniazid, a growth factor analog that mimics nicotinamide, a vitamin required by M. tuberculosis to synthesize the waxlike mycolic acids found in its tough cell wall. In the presence of isoniazid, M. tuberculosis cannot construct its normal cell wall, making the cells more easily penetrated by antibiotics. Unfortunately, isoniazid does not always work, and this problem is becoming increasingly common.
Isoniazid resistance in M. tuberculosis has been linked in part to its ability to form a biofilm (a colony of microbial cells encased in a porous organic matrix and attached to a surface) in pulmonary tissues. The biofilm growth mode both facilitates and exacerbates the M. tuberculosis infection. Using a systematic screening process, researchers recently found a compound called C10 that inhibits biofilm formation by M. tuberculosis in laboratory cultures. Although C10 itself showed no bactericidal activity, the bacteria were readily killed when even low concentrations of isoniazid were administered simultaneously with C10, and notably, resistance to this combination never developed. Furthermore, even strains that were already resistant to isoniazid were killed by this treatment, demonstrating that resistance to isoniazid could be reversed when used in combination with C10.
The next step will be to investigate the efficacy of the C10/isoniazid combination in living systems. If these tests are successful, the result may bring new potency to an old weapon against TB.
Source: Flentie, K., et al. 2019. Chemical disarming of isoniazid resistance in Mycobacterium tuberculosis. Proc. Natl. Acad. Sci. (USA) 116(21): 10510. doi:10.1073/pnas.1818009116.
Several million species of microorganisms likely exist in nature, but only a few hundred are known to cause disease. In this and the next three chapters we focus on this vitally important subset of the microbial world. We investigate the biology of the pathogens as well as the diseases they cause, including disease diagnosis, treatment, and prevention.
Our infectious disease coverage is ecological, being organized around each pathogen’s mode of transmission. Although the biology of the different causative agents will certainly be highlighted, an ecological approach to infectious disease coverage emphasizes the single most important feature that links diseases caused by different microbes. Hence, tuberculosis and influenza are caused by a bacterium and a virus, respectively, but both diseases are transmitted from person to person by the airborne route.
In this chapter we explore diseases transmitted from person to person, whether through the air, by direct contact, or through sexual contact. In Chapter 32 we focus on diseases transmitted by animal and arthropod vectors or from soil, and in Chapter 33 we cover diseases transmitted from common sources, including water and food. We end our tour of the microbial world in Chapter 34 where we examine fungal and parasitic infections.
I Airborne Bacterial Diseases
A wide diversity of pathogenic bacteria are transmitted through airborne particles and cause diseases ranging from relatively mild and primarily upper respiratory tract infections to life-threatening upper or lower respiratory tract infections that can compromise a patient’s very ability to breathe.
Worldwide, acute respiratory infections kill more than 4 million people a year, mainly in developing countries. Children and the elderly make up most of the fatalities, but in general, respiratory infections are the most common of all human diseases. Aerosols, such as those generated by a sneeze (Figure 31.1), as well as by coughing, talking, or breathing, are major vehicles for person-to-person transmission of respiratory diseases. Besides directly infecting a new host, infectious mucus from an aerosol can also contaminate objects, such as a door handle, and transmit infection well after the aerosol event. In these ways, respiratory diseases spread quickly, especially in congested areas, as airborne pathogens exploit a simple yet highly effective means of infecting new hosts.
Figure 31.1 High-speed photograph of an unstifled sneeze.

Effluent is expelled at over 100 m/s (200 miles/h).
31.1 Airborne Pathogens
Microorganisms found in air are derived from soil, water, plants, animals, people, surfaces, and other sources. Most microorganisms survive poorly in air. As a result, airborne pathogens are effectively transmitted between people only over short distances. Certain pathogens, however, survive drying well and can remain alive in dust or on fomites for long periods of time. For example, because of their thick cell walls, gram-positive bacteria (such as species of Staphylococcus and Streptococcus) are generally more resistant to drying than are gram-negative bacteria. Likewise, the waxy layer of Mycobacterium cell walls resists drying and promotes survival of pathogens such as Mycobacterium tuberculosis.
Large numbers of droplets can be expelled during a sneeze (Figure 31.1). Infectious droplets are about 10 μm in diameter and each droplet can contain one or more microbial cells or virus virions. The initial speed of the droplet movement is about 100 m/s (200 miles/h) in a violent sneeze and ranges from 15 to 50 m/s during coughing or shouting. The number of bacteria in a single sneeze varies from 104 to 106, and viral numbers can be much higher than this. Because of their small size, the droplets evaporate quickly in the air, leaving behind dried mucus in which the airborne pathogens remain embedded.
Mastering Microbiology
Art Activity: Figure 31.2 The human respiratory system
The human respiratory tract is divided into upper and lower regions, and specific airborne pathogens tend to exploit one region or the other, or sometimes both (Figure 31.2). The speed at which air moves through the human respiratory tract varies, and in the lower respiratory tract the rate is quite slow. As air slows down, particles in it stop moving and settle. Large particles settle first and the smaller ones later; only particles smaller than about 3 μm travel as far as the bronchioles in the lower respiratory tract (Figure 31.2).
Figure 31.2 The human respiratory system.
The microorganisms listed typically initiate infections at the locations indicated. The scale on the left combined with the respiratory tract diagram shows approximately where particles come to rest, determined by their size and air speed.
Upper respiratory infections such as the common cold are typically acute and non-life-threatening. By contrast, lower respiratory infections, such as bacterial or viral pneumonia, are often chronic and can be quite serious, especially in elderly or immunocompromised individuals. Also, although most common respiratory infections are not serious in an otherwise healthy host, they can set the stage for secondary infections that can be life-threatening. For example, death of an elderly person from pneumonia following a severe case of influenza is not an uncommon event.
Most human respiratory pathogens are transmitted from person to person because humans are the only reservoir for the pathogens. However, many airborne pathogens, such as Streptococcus spp., cold viruses, and influenza, can also be transmitted by direct contact (for example, by a handshake) or on fomites. Accurate and rapid diagnosis and treatment of respiratory infections are well developed in the clinical setting and, if practiced effectively, can limit host damage. Many bacterial and viral pathogens transmitted by an airborne route can be controlled by immunization, and most respiratory bacterial pathogens respond readily to antibiotic therapy. Antiviral therapies, on the other hand, are rather limited, and recovery from viral infections is often due solely to the immune response.
Check Your Understanding
Why can it be said that respiratory pathogens have exploited an effective means of transmission?
Identify pathogens more commonly found in the upper respiratory tract. Identify pathogens more commonly found in the lower respiratory tract.
31.2 Streptococcal Syndromes
Streptococcal diseases are transmitted by airborne droplets or by direct contact, and the species Streptococcus pyogenes (Figure 31.3) and Streptococcus pneumoniae are the most important human respiratory pathogens. Streptococci are nonsporulating, homofermentative but aerotolerant gram-positive cocci (Section 16.6). Cells of S. pyogenes typically grow in elongated chains (Figure 31.3), as do many other species of the genus. Pathogenic strains of S. pneumoniae grow in pairs or short chains, and virulent strains produce an extensive polysaccharide capsule (see Figure 31.11). Virulent strains of Streptococcus can form vicious purulent (pus-forming) wounds in humans and other warm-blooded (endothermic) animals (Figure 31.4 and see Figure 31.10). Many other serious conditions whose symptoms are less dramatic than these are also associated with streptococcal infections.
Figure 31.3 *Streptococcus pyogenes.*

(a) Gram stain of cells of Streptococcus pyogenes. Cells grow in chains and range in size from 0.6 to 1 μm in diameter. (b) Computer-generated image of a scanning electron micrograph of cells of S. pyogenes.
Figure 31.4 Pus-forming wound from β-hemolytic streptococci.

(a) Pus and coagulated blood from a Streptococcus equi infection of a horse’s salivary glands (the salivary glands have burst open from the infection). (b) Colonies of S. equi showing β-hemolysis on blood agar (compare with Figure 31.8). (c) Phase-contrast photomicrograph of cells of S. equi. Cells are 1 μm in diameter.
Streptococcus pyogenes
Streptococcus pyogenes (Figure 31.3), the major species in the group A streptococci, is frequently isolated from the upper respiratory tract of healthy adults. Although numbers are typically low, serious infections are possible if host defenses are weakened or a new, highly virulent strain is encountered.
S. pyogenes is the cause of streptococcal pharyngitis, better known as strep throat (Figure 31.5). Most clinical isolates of S. pyogenes produce an exotoxin (Sections 25.6 and 25.7) that lyses red blood cells in culture media, a condition called β-hemolysis (Figure 31.4b and see Figure 31.8). Streptococcal pharyngitis is characterized by a severe sore throat, enlarged tonsils with red spots on the soft palate (Figure 31.5), tender cervical lymph nodes, and a mild fever and feeling of general malaise. S. pyogenes can also cause infections of the middle ear (otitis media) and of the mammary glands (mastitis); infections of the superficial layers of the skin called impetigo (Figure 31.6); erysipelas, an acute streptococcal skin infection (Figure 31.7); and other conditions linked to the aftereffects of streptococcal infections.
Figure 31.5 A case of strep throat caused by *Streptococcus pyogenes*.

The back of the throat is inflamed and shows small red spots, typical of streptococcal pharyngitis.
Figure 31.6 Typical lesions of impetigo.

Impetigo is commonly caused by Streptococcus pyogenes or Staphylococcus aureus.
Figure 31.7 Erysipelas.

Erysipelas is a Streptococcus pyogenes infection of the dermis, shown here on the nose and cheeks, characterized by redness and distinct margins of infection. Other commonly infected body sites include the ears and the legs.
About half of the clinical cases of severe sore throat are due to S. pyogenes; most others are due to viral infections. Because of this, an accurate and rapid diagnosis of a severe sore throat is important. If the sore throat is due to S. pyogenes, immediate treatment is important because untreated group A streptococcal infections can lead to serious secondary diseases such as scarlet fever (see Figure 31.9), rheumatic fever, acute glomerulonephritis, and streptococcal toxic shock syndrome. On the other hand, if the sore throat is due to a virus, treatment with antibiotics will be useless and will only promote drug resistance on the part of the normal microbiota.
Clinical tools for quickly diagnosing strep throat are widely available and in routine use in primary care clinics. These tools include, in particular, rapid antigen detection systems that contain antibodies specific for cell surface proteins of S. pyogenes (Section 29.7 and Figure 29.21). A more sensitive and accurate confirmation is possible by obtaining an actual culture of S. pyogenes from the throat or other suspected lesion on a blood agar plate (Figure 31.8). In contrast to rapid tests, however, results of a throat culture may take up to 48 h to process, and such a delay in treatment can have adverse effects, as we consider now.
Figure 31.8 β-Hemolysis.

The ability of a bacterium to lyse red blood cells and form a clear zone around a colony on a blood agar plate indicates secretion of the protein β-hemolysin. See also Figures 25.17a and 31.4b.
Scarlet and Rheumatic Fevers and Other Group A Streptococcal Syndromes
Certain strains of group A streptococci carry a lysogenic bacteriophage that encodes streptococcal pyrogenic exotoxin A (SpeA), SpeB, SpeC, and SpeF. These exotoxins are responsible for most of the symptoms of streptococcal toxic shock syndrome and scarlet fever (Figure 31.9). Streptococcal pyrogenic exotoxins are superantigens that activate and recruit large numbers of T cells to the infected tissues (Sections 25.7 and 28.2). Toxic shock results when the activated T cells secrete cytokines, which in turn activate large numbers of macrophages and neutrophils, causing severe inflammation and tissue destruction.
Figure 31.9 Scarlet fever.
The typical rash of scarlet fever results from the activity of the pyrogenic exotoxins produced by Streptococcus pyogenes.
Scarlet fever, signaled by a severe sore throat, fever, and characteristic rash (Figure 31.9), is readily treatable with antibiotics or may be self-limiting. But treatment is always advisable because several undesirable conditions can emerge from a case of scarlet fever. Occasionally group A streptococcal infections cause fulminant (sudden and severe) invasive systemic infections, such as cellulitis, a skin infection in subcutaneous layers; or necrotizing fasciitis, a rapid and progressive disease resulting in extensive destruction of subcutaneous tissue, muscle, and fat (Figure 31.10). Necrotizing fasciitis is a clinical term for the condition caused by “flesh-eating bacteria.” In these cases, SpeA, SpeB, SpeC, and SpeF exotoxins and the bacterial cell surface M protein function as superantigens; the associated host inflammation results in extensive tissue destruction and can be fatal (Figure 31.10).
Figure 31.10 Necrotizing fasciitis (flesh-eating bacteria).

Soft tissue infection of human hip and thigh by group A Streptococcus pyogenes. The flesh has split open to reveal muscle tissues.
Untreated or insufficiently treated S. pyogenes infections may lead to other severe conditions 1 to 4 weeks after the onset of infection. For example, the immune response to the invading pathogen can produce antibodies that cross-react with host tissue antigens of the heart, joints, and kidneys, resulting in damage to these tissues. The most serious of these syndromes is rheumatic fever caused by rheumatogenic strains of S. pyogenes. These strains contain cell surface antigens that are similar in structure to heart valve and joint proteins. Thus, rheumatic fever is, in effect, an autoimmune complication (Section 28.1) because antibodies directed against streptococcal antigens cross-react with heart valve and joint antigens, causing inflammation and tissue destruction. Damage to host tissues may be permanent and is often exacerbated by subsequent streptococcal infections that lead to recurring bouts of rheumatic fever. Another streptococcal syndrome is acute poststreptococcal glomerulonephritis, a painful kidney disease. This “immune complex” disease develops transiently when streptococcal antigen–antibody complexes in the blood lodge in the glomeruli (filtration membranes of the kidney) and cause inflammation, a serious condition called nephritis.
Streptococcus pneumoniae
A second major human streptococcal pathogen is Streptococcus pneumoniae (Figure 31.11), a species that can cause invasive lung infections, typically as secondary infections to other respiratory disorders. Encapsulated strains of S. pneumoniae (Figure 31.11; Figure 25.4) are particularly virulent because they are especially invasive. Cells invade the lower respiratory tract where the capsule enables the cells to resist phagocytosis yet generate a strong host inflammatory response. Pneumonia results from the accumulation of recruited phagocytic cells and fluid. Cells of S. pneumoniae can then spread from the focus of infection as a bacteremia, sometimes infecting the bones, middle ear, and heart valves (endocarditis). S. pneumoniae infection is often the cause of death in elderly persons whose death is reported to be from “respiratory failure.”
Figure 31.11 *Streptococcus pneumoniae*.

India ink negative stain of cells of Streptococcus pneumoniae. An extensive capsule surrounds the cells, which are 1.0–1.2 μm in diameter.
Unlike the case with S. pyogenes, effective vaccines are available for preventing infection by the most common strains of S. pneumoniae. An older vaccine widely used in adults consisted of a mixture of 23 capsular polysaccharides from the most prevalent pathogenic strains. The vaccine is recommended for those over age 60, healthcare providers, individuals with compromised immunity, and any other high-risk population. A newer conjugate vaccine (Figure 28.9) called PREVNAR 13® is an update of the traditional vaccine. It is effective against the 13 S. pneumoniae strains most commonly seen today and is recommended for adults age 50 or older.
S. pneumoniae infections typically respond quickly to penicillin therapy, but up to 30% of pathogenic isolates now exhibit resistance to this drug. Resistance to the antibiotics erythromycin and cefotaxime is also found in some strains, but thus far, all strains have been found sensitive to vancomycin, an antibiotic held in reserve for treating pneumonia and several other bacterial diseases where antibiotic resistance is widespread (Section 28.7).
Check Your Understanding
How does Streptococcus pyogenes infection cause rheumatic fever, and why is rheumatic fever considered to be an autoimmune complication?
What is the primary virulence factor for Streptococcus pneumoniae?
31.3 Diphtheria and Pertussis
Diphtheria is a severe respiratory disease that typically infects young children. Diphtheria is caused by Corynebacterium diphtheriae, a gram-positive, nonmotile, and aerobic club-shaped bacterium that forms small, smooth colonies on blood agar plates (Figure 31.12). Pertussis (whooping cough), also known as whooping cough, is a serious respiratory disease caused by infection with Bordetella pertussis, a small, gram-negative, aerobic coccobacillus (see Figure 31.14). As with diphtheria, pertussis mostly affects children but can cause serious respiratory disease in adults as well. Both diphtheria and pertussis can be prevented by vaccination and cured with antibiotics.
Figure 31.12 *Corynebacterium diphtheriae*, the causative agent of diphtheria.

(a) Cells of C. diphtheriae showing typical club-shaped appearance. The grampositive cells are 0.5–1 μm in diameter and may be several micrometers in length. (b) Colonies of C. diphtheriae grown on a selective medium of blood agar plus tellurite.
Diphtheria
Cells of C. diphtheriae (Figure 31.12a) enter the host from airborne droplets, infecting the tissues of the throat and tonsils and typically causing swelling of the neck (Figure 31.13a). Throat tissues respond to C. diphtheriae infection by forming a characteristic lesion called a pseudomembrane consisting of damaged host cells and cells of C. diphtheriae (Figure 31.13b). Not all strains of C. diphtheriae cause diphtheria. Pathogenic strains of C. diphtheriae carry a lysogenic bacteriophage whose genome encodes a powerful exotoxin called diphtheria toxin. This toxin inhibits protein synthesis in the host, leading to cell death (Figure 25.13). Death from diphtheria is due to a combination of partial suffocation by the pseudomembrane and tissue destruction by diphtheria exotoxin. C. diphtheriae isolated from the throat is diagnostic for diphtheria. Nasal or throat swabs are used to inoculate blood agar containing tellurite (Figure 31.12b) or Loeffler’s medium, a selective medium that inhibits the growth of most other respiratory pathogens.
Figure 31.13 Diphtheria.

(a) A swollen neck is a common symptom of diphtheria. (b) The pseudomembrane (arrows) in an active case of diphtheria restricts airflow and swallowing and is associated with a severe sore throat.
Prevention of diphtheria is accomplished with a highly effective toxoid vaccine, part of the DTaP (diphtheria toxoid, tetanus toxoid, and acellular pertussis) vaccine (Section 28.3). Diphtheria is all but absent from developed countries where this vaccine is widely used. Penicillin, erythromycin, and gentamicin are generally effective treatments for diphtheria, but in life-threatening cases, diphtheria antitoxin (an antiserum to diphtheria toxoid produced in horses) may be administered in addition to antibiotic therapy.
Pertussis
Pertussis is an acute, highly infectious respiratory disease. Infants less than 6 months old, who are too young to be effectively vaccinated, have the highest incidence of disease and also have the most severe symptoms. Cells of B. pertussis (Figure 31.14) attach to ciliated host cells of the respiratory tract and excrete pertussis exotoxin. This potent toxin induces synthesis of cyclic adenosine monophosphate (cyclic AMP, Figure 7.22), which is at least partially responsible for the events that lead to host tissue damage. B. pertussis also produces an endotoxin (Section 25.8), which may induce some of the symptoms of whooping cough. Clinically, whooping cough is characterized by a recurrent, violent cough that can last up to 6 weeks. The spasmodic coughing gives pertussis its common name; a whooping sound results from the patient inhaling deep breaths to obtain sufficient air.
Figure 31.14 *Bordetella* and pertussis.

Cells of B. pertussis are typically coccobacilli 0.4–0.5 μm in diameter and about 1 μm long. Pertussis incidence has been trending upward for the past two decades. Data are from the CDC. Inset photos: left, scanning electron micrograph of cells of Bordetella; right, Gram-stained cells of B. pertussis.
Worldwide, up to 25 million cases and over 150,000 deaths occur each year from pertussis, mostly in developing countries. B. pertussis is endemic worldwide, and pertussis remains a problem even in developed countries, usually as a result of inadequate immunization. In the United States there has been a gradual upward trend of pertussis since the 1980s, with spikes in reported cases in 2005, 2010, and 2012 (Figure 31.14); many of these have been in young adults under age 20. In 2017 there were nearly 19,000 cases of pertussis in the United States and 13 deaths, all but four in children under age 4. Pertussis is a classic endemic disease (Section 30.1); incidence rises cyclically as populations become susceptible and are exposed to the pathogen. A combination of lax vaccination protocols and the fact that pertussis is a much more common disease than diphtheria have probably fueled the overall higher incidence of pertussis in recent years.
Whooping cough can be treated with ampicillin, tetracycline, or erythromycin, although antibiotics alone do not seem to effect a complete cure, as patients continue to show symptoms and remain infectious for up to 2 weeks after beginning antibiotic therapy. This indicates that the immune response may be as important as antibiotics in ridding the pathogen from the body.
Check Your Understanding
Contrast the disease symptoms of diphtheria and pertussis.
What measures can be taken to decrease the current incidence of pertussis in a population?
31.4 Tuberculosis and Leprosy
The famous pioneering microbiologist Robert Koch, the founder of the field of medical microbiology, isolated and described the causative agent of tuberculosis, Mycobacterium tuberculosis, in 1882 (Section 1.12). A related species, Mycobacterium leprae, causes leprosy (Hansen’s disease). Mycobacteria are gram-positive bacteria and share the property of being acid-fast because of the waxy mycolic acid constituent of their cell walls (Section 16.11). Mycolic acid allows these organisms to retain the red dye carbol-fuchsin after a mycobacterial smear on a slide is washed in 3% hydrochloric acid in alcohol (Figure 31.15). Colonies of M. tuberculosis grow slowly on plates and have a characteristically wrinkled morphology.
Figure 31.15 Mycobacteria.

(a) Acid-fast stained lymph node biopsy from a patient with HIV/AIDS shows cells of Mycobacterium avium, a relative of M. tuberculosis. Multiple bacilli, stained red with carbol-fuchsin and treated with 3% hydrochloric acid, are evident inside each human cell. The individual rods are about 0.4 μm in diameter and up to 4 μm in length. (b) Colonies of M. tuberculosis. The rough, wrinkled surface is typical of mycobacterial colonies.
Tuberculosis
Tuberculosis (TB) is easily transmitted by the respiratory route, and at one time it was the most important infectious disease of humans. TB kills nearly 1.5 million people per year, making it the top infectious disease killer worldwide. About one-third of the world’s population has been infected with M. tuberculosis, though most do not show active disease because cell-mediated immunity (Section 27.8) plays a critical role in the suppression of active disease after infection.
Tuberculosis can take several forms. TB can be a primary infection (initial infection) or postprimary infection (reinfection). Primary infection typically results from inhalation of droplets containing M. tuberculosis, after which the bacteria settle in the lungs and grow. The host mounts an immune response to M. tuberculosis, resulting in the formation of aggregates of activated macrophages, called tubercles. Bacteria are found in the sputum of individuals with active disease, and areas of destroyed tissue can be seen in chest X-rays (Figure 31.16). Mycobacteria survive and grow within macrophages in the tubercles, forming granulomas, and if the disease is not controlled, extensive destruction of lung tissue can occur. If the disease reaches this stage, the pulmonary infection is often fatal.
Figure 31.16 Tuberculosis symptoms.

(a) Sputum sample from a patient with tuberculosis stained by the Smithwick acridine orange method. Cells of Mycobacterium tuberculosis are the yellow-orange rod-shaped structures (arrows). (b) Normal chest X-ray. The faint white lines are arteries and other blood vessels. (c) Chest X-ray showing an advanced case of pulmonary tuberculosis; white patches (arrows) indicate tubercles that are densely populated by viable cells of M. tuberculosis.
In most individuals infected with M. tuberculosis, however, acute disease does not occur; instead, the infection is asymptomatic. Nevertheless, the infection hypersensitizes the individual to M. tuberculosis or its products and typically protects the individual against postprimary infections. A diagnostic skin test, called the tuberculin test, can detect this hypersensitivity (Figure 28.4), and many healthy adults are tuberculin-positive as a result of previous or current inapparent infections. In most cases, the cell-mediated immune response to M. tuberculosis is protective and lifelong. However, some tuberculin-positive patients develop postprimary tuberculosis through reinfection from bacteria that have remained dormant in lung macrophages for years. Because of this, individuals who have a positive tuberculin test are typically treated with anti-tuberculosis drugs for extended periods to ensure that all mycobacteria have been killed.
Antimicrobial therapy of TB has been a major means of controlling the disease. Streptomycin was the first effective anti-tuberculosis antibiotic, but the real revolution in tuberculosis treatment came with the discovery of isonicotinic acid hydrazide, called isoniazid (INH). This drug is highly effective and readily absorbed when given orally. Isoniazid is a growth factor analog (Section 28.5 and Table 28.4) of the structurally related molecule nicotinamide; in mycobacteria the drug inhibits mycolic acid synthesis, and this compromises cell wall integrity. Following treatment with isoniazid, mycobacteria lose their acid-fast properties, in keeping with the role of mycolic acid in this staining property.
Treatment of tuberculin-positive individuals is typically achieved with daily doses of isoniazid and the antibiotic rifampin for 2 months, followed by biweekly doses for a total of 9 months. This treatment eradicates pockets of M. tuberculosis cells and prevents emergence of antibiotic-resistant derivatives. Multiple drug therapy reduces the possibility that strains having resistance to more than one drug will emerge. Resistance of M. tuberculosis to isoniazid and other drugs, however, is increasing, especially in HIV/AIDS patients, in whom TB is a common infection (see Figure 31.46g; see also MicrobiologyNow on the opening page of this chapter). Treatment of these strains, called multidrug-resistant tuberculosis strains, requires the use of second-line tuberculosis drugs that are generally more toxic, less effective, and more costly than rifampin and isoniazid. Multiple drug resistance is a major reason the incidence of TB is slowly increasing in developed countries worldwide.
Leprosy
Mycobacterium leprae, a relative of M. tuberculosis, causes the disease leprosy, more formally known as Hansen’s disease. The most serious form of Hansen’s disease is lepromatous leprosy, characterized by folded, bulblike lesions on the body, especially on cooler parts of the body such as the face and extremities (Figure 31.17a). The lesions are due to the growth of M. leprae cells in skin Schwann cells that insulate the nerves, and the lesions contain large numbers of bacterial cells. Like cells of other mycobacteria (Figure 31.15a), cells of M. leprae from the lesions stain deep red with carbol-fuchsin in the acid-fast staining procedure, providing a definitive demonstration of active infection.
Figure 31.17 Lepromatous leprosy lesions on the skin.

(a) Lepromatous leprosy is caused by infection with Mycobacterium leprae. The lesions can contain up to 109 bacterial cells per gram of tissue, indicating an active uncontrolled infection with a poor prognosis. (b) The palm of the right hand of a leprosy patient showing the claw-like form and digit deformation characteristic of late-stage leprosy.
In severe untreated cases of leprosy, the disfiguring lesions lead to destruction of peripheral nerves; muscles then atrophy, and motor function is impaired. The loss of sensation in the extremities leads to inadvertent injuries, such as burns and cuts. Loss of bone calcium leads to a slow shrinking of the digits and their transition to claw-like forms in late-stage leprosy (Figure 31.17b). Pathogenicity in the disease is due to a combination of delayed-type hypersensitivity (Section 28.1) and the highly invasive activities of M. leprae, which can grow within macrophages and lead to the characteristic lesions (Figure 31.17a). Leprosy is transmitted by direct contact as well as by an airborne route, but it is not as highly contagious as TB. Historically, leprosy has been associated with poverty, malnutrition, and poor sanitation and hygiene. Among other things, these factors undoubtedly affect an individual’s ability to resist infection.
Many Hansen’s disease patients exhibit less-pronounced lesions from which M. leprae cells cannot be obtained; these individuals have the tuberculoid form of the disease. Tuberculoid leprosy is characterized by a vigorous immune response and a good prognosis for spontaneous recovery. Hansen’s disease of either form, and the continuum of intermediate forms, is treated using a multiple drug therapy protocol, which includes some combination of extended therapy of up to 1 year with dapsone (4,4’-sulfonylbisbenzeneamine, an inhibitor of folic acid synthesis); rifampin, a bacterial RNA polymerase inhibitor; and clofazimine, a drug that targets bacterial respiration and ion transport.
Over 210,000 new cases of leprosy were reported in 2017, with most cases occurring in Africa, the Indian subcontinent, and Brazil. In the United States only about 200 cases of leprosy are diagnosed per year, mainly in immigrants from countries with endemic disease. Until recently, a leprosy diagnosis relied on the identification of M. leprae cells from lesions. However, a quick, inexpensive, and specific blood test is now available that greatly assists in diagnosing early-stage leprosy, the most treatable form.
In addition to M. tuberculosis and M. leprae, several other mycobacteria are human pathogens. These include in particular M. bovis, a close relative of M. tuberculosis and a common pathogen of dairy cattle. M. bovis can initiate classic symptoms of TB in humans; however, a combination of the pasteurization of milk and the culling of infected cattle has greatly reduced the incidence of bovine-to-human transmission of this form of TB.
Check Your Understanding
Why is Mycobacterium tuberculosis a widespread respiratory pathogen?
Describe three common characteristics of pathogenic mycobacteria.
31.5 Meningitis and Meningococcemia
Meningitis is an inflammation of the meninges, the membranes that compose the protective covering of the central nervous system, that is, the spinal cord and brain. Several different microorganisms, including certain viruses, bacteria, fungi, and protists, can cause meningitis. Here we focus on the severe bacterial form of the disease called infectious meningitis, caused by the bacterium Neisseria meningitidis.
Pathogen and Disease Syndromes
Neisseria meningitidis, often called the meningococcus, is a gram-negative and obligately aerobic coccus about 0.6–1 μm in diameter (Figure 31.18a); it is a relative of the bacterium that causes gonorrhea, Neisseria gonorrhoeae. The bacterium is transmitted to a new host, usually via the airborne route from an infected individual, and attaches to the cells of the nasopharynx. Once there, the organism quickly gains access to the bloodstream (bacteremia, Section 25.2), where it disseminates throughout the body and causes upper respiratory tract symptoms. Meningitis is characterized by the sudden onset of a headache accompanied by vomiting and a stiff neck, and its seriousness is underscored by the fact that meningitis can progress to coma and death in less than a day. Instead of, or in addition to, full-blown meningitis, N. meningitidis bacteremia sometimes leads to fulminant meningococcemia, a condition characterized by intravascular coagulation and tissue destruction (gangrene, Figure 31.18b), shock, and death in over 10% of cases.
Figure 31.18 *Neisseria meningitidis*.

The organism causes meningitis and meningococcemia. (a) Gram stain of cells of N. meningitidis; cocci are about 0.6–1 μm in diameter. (b) Four-month-old infant with gangrene on legs from meningococcemia.
Meningococcal meningitis often occurs in epidemics, usually in populations living in close proximity, such as in military barracks or college dormitories. Anyone can get meningococcal disease, but the incidence is much higher in infants, school-age children, and young adults. Up to 30% of people carry N. meningitidis in their nasopharynx with no apparent harmful effects, and the trigger for conversion from the asymptomatic carrier state to the disease state is unknown.
Diagnosis, Treatment, and Vaccines
Meningococcal meningitis is definitively diagnosed from cultures of N. meningitidis isolated from nasopharyngeal swabs, blood, or cerebrospinal fluid. Thayer–Martin medium, a selective medium for the growth of pathogenic Neisseria, including both N. meningitidis and N. gonorrhoeae (Figure 29.6), is used to isolate N. meningitidis, and colonies containing gram-negative diplococci (Figure 31.18a) are further tested. However, due to the rapid onset of life-threatening symptoms in infectious meningitis, preliminary diagnosis is often based on clinical symptoms and treatment is started before culture tests confirm infection with N. meningitidis. Treatment is typically with penicillin, and intravenous application is often needed to speed antibiotic infusion.
Naturally occurring antibodies acquired by subclinical infections with N. meningitidis are effective for preventing infectious meningitis in most adults. Vaccines consisting of purified polysaccharides or polysaccharides from the most prevalent pathogenic strains are available to immunize certain susceptible populations, including military recruits and students living in dormitories, especially if an outbreak is in progress. In addition, the antibiotic rifampin is often used to eradicate the carrier state and prevent meningococcal disease in close contacts of infected individuals.
Check Your Understanding
Describe the infection by Neisseria meningitidis and the resulting development of meningococcemia.
II Airborne Viral Diseases
Because viruses are so small, they can linger in the tiniest of vapors emitted from an infected individual. Viral diseases transmitted through the air are some of the most contagious infectious diseases known, ranging from the common cold to serious respiratory infections, such as measles and influenza.
31.6 MMR and Varicella-Zoster Infections
The most prevalent and difficult to treat of all human infectious diseases are those caused by viruses. This is because viruses can often remain infectious for long periods in dried mucus (Figure 31.1) or on fomites, and because viruses require host cells for replication. Hence, infectious material can be virtually anywhere, and destroying the virus often means killing the cell as well.
Most viral diseases are acute, self-limiting infections, but some can be problematic in healthy adults. We begin with measles, rubella, mumps, and chicken pox, all common, endemic viral diseases transmitted in infectious droplets by an airborne route.
Measles and Rubella
Measles (rubeola or 7-day measles) affects susceptible children as an acute, highly infectious (Table 30.3), often epidemic disease. The measles virus (**Figure 31.19*a***) is a paramyxovirus, a single-stranded, minus-sense RNA virus (Section 11.9) that enters the nose and throat by airborne transmission, quickly leading to a systemic viremia. Symptoms start with nasal discharge and redness of the eyes. As the disease progresses, fever and cough appear and rapidly intensify, followed by a characteristic rash (Figure 31.19b, c).
Figure 31.19 Measles in children.

(a) Transmission electron micrograph of a measles virus virion; a virion is about 150 nm in diameter. (b, c) Measles rash. The light pink rash starts on the head and neck, and can spread to the chest, trunk, and limbs. Discrete papules coalesce into blotches as the rash progresses for several days.
Symptoms of measles generally persist for 7–10 days, and no drugs are available that will eliminate symptoms. However, the measles virus generates a strong immune response. Circulating antibodies to measles virus are measurable within 5 days of infection; these serum antibodies along with cytotoxic T lymphocytes combine to eliminate the virus from the host. Possible measles postinfection complications include middle ear infection, pneumonia, and, in rare cases, measles encephalomyelitis.
Although once a common childhood illness, measles in the United States was declared eliminated in 2000 because of widespread immunization programs begun in the 1960s. However, over the past decade, measles has reappeared and in a dramatic way, presumably in populations that were either not immunized or inadequately immunized (vaccination of nearly 95% of the population is required to confer herd immunity to measles, Section 30.2 and Table 30.3). In 2010, 63 cases of measles were reported in the United States, but from January through mid-June 2019—a period of fewer than six months—1044 cases of measles were confirmed, the highest incidence in nearly 30 years.
Worldwide, measles remains endemic, and despite the existence of a highly effective vaccine, the disease still causes about 100,000 annual deaths, mostly in children. Active immunity to measles is conferred with an attenuated virus preparation as part of the MMR (measles, mumps, rubella) vaccine (Section 28.3). Because the disease is highly infectious, all public school systems in the United States require proof of measles immunization before a child can enroll. A childhood case of measles generally confers lifelong immunity.
Rubella (sometimes called German measles or 3-day measles) is caused by a single-stranded, positive-sense RNA virus distinct from that of measles (Section 11.8). Symptoms of rubella resemble those of measles (Figure 31.20) but are often restricted to just the upper torso. Rubella is less contagious than measles, and thus a significant proportion of the population has never been infected. However, during the first three months of pregnancy, rubella virus can infect the fetus by placental transmission and cause serious fetal abnormalities including stillbirth, deafness, heart and eye defects, and brain damage, events called congenital rubella syndrome. Thus, women should not be immunized with the rubella vaccine or contract rubella during pregnancy. Also for this reason, routine childhood immunization against rubella should be practiced. A highly effective attenuated rubella virus is administered as part of the MMR vaccine. As a result of a 15-year-long campaign to eliminate rubella in the Western Hemisphere using this vaccine, the Americas have officially become the first region to be declared rubella-free. Public health officials are in the process of extending the rubella vaccination program worldwide, with the ultimate goal being global eradication of the virus.
Figure 31.20 Rubella.

The rash of rubella (German measles) on the face of a young child.
Mumps
Mumps, like measles, is caused by a paramyxovirus and is also highly infectious by the airborne route. Mumps is spread by airborne droplets, and the disease is characterized by inflammation of the salivary glands, typically the parotid gland, the largest of the salivary glands, leading to swelling of the jaws and neck (Figure 31.21). The virus spreads through the bloodstream and may infect other organs, including the testes and pancreas, and may cause encephalitis in rare cases. As for measles, the immune response rather than drug treatment is what cures a case of mumps. The host immune response produces antibodies to mumps virus surface proteins, and this generally leads to a quick recovery and lifelong immunity to reinfection.
Figure 31.21 Mumps.
Glandular swelling characterizes infection with the mumps virus. Mumps symptoms typically last about one week, and a person is infectious both before and during the symptomatic stages.
An attenuated mumps vaccine (part of the MMR) is highly effective in preventing disease. Hence, the prevalence of mumps in developed countries is low, with disease generally restricted to individuals who did not receive the vaccine. However, outbreaks of mumps in the United States in 2006, 2016, and 2017 each resulted in more than 6000 annual cases. These outbreaks affected mainly young adults (18–34), and as a result, recommendations for immunizations were revised to target school-age children, healthcare workers, and adults who had not previously had mumps.
Chicken Pox and Shingles
Chicken pox (varicella) is a common childhood disease caused by the varicella-zoster virus (VZV), a double-stranded DNA herpesvirus (Section 11.7). VZV is a mild but highly contagious disease and is transmitted by infectious droplets, especially when susceptible individuals are in close contact. In schoolchildren, for example, close confinement during the winter months leads to the spread of VZV through airborne droplets from infected classmates and through direct contact with chicken pox blisters of other children or contaminated fomites. The virus enters the respiratory tract, multiplies, and is quickly disseminated via the bloodstream, resulting in a systemic papular rash (Figure 31.22) that heals quickly without scarring. An attenuated chicken pox virus vaccine (marketed as Varivax®) is used in the United States but not as widely as the MMR vaccine for measles, rubella, and mumps. Consequently, the reported incidence of chicken pox in 2011 was about 15,000 cases, which is about 10% of those reported in 1995, the year the vaccine was first licensed. Deaths from chicken pox are extremely rare, with six deaths reported in 2011.
Figure 31.22 Chicken pox.

Papular rash on the foot of an adult. The papules are due to infection by varicella-zoster virus, the herpesvirus that causes chicken pox.
VZV establishes a lifelong latent (permanent) infection in nerve cells. The virus can remain dormant there indefinitely, but in some individuals the virus migrates from this reservoir to the skin surface, often years or decades later, causing a painful skin eruption called shingles (zoster). Shingles most commonly strikes immunosuppressed individuals or the elderly, causing severe blisters and a rash on the head, neck, or upper torso. A fairly effective shingles vaccine containing concentrated attenuated virus (marketed as Zostavax®) is available for individuals over 50 years of age. The vaccine stimulates antibody- and cell-mediated immunity to VZV, which keeps VZV from migrating out of nerve ganglia to skin cells and triggering shingles symptoms. A recombinant shingles vaccine marketed as Shingrix® is reported to be nearly 90% effective in preventing a case of shingles (if administered in both primary and booster injections) and is the shingles vaccine recommended by the Advisory Committee on Immunization Practices of the United States Centers for Disease Control and Prevention.
Check Your Understanding
How do the genomes of the measles virus (rubeola) and the German measles virus (rubella) differ?
Describe the potential serious outcomes of infection by measles, mumps, rubella, and VZV viruses.
Identify the effects of immunization on the incidence of measles, mumps, rubella, and chicken pox.
31.7 The Common Cold
Colds are the most common of infectious diseases. Colds are typically upper respiratory tract viral infections that are transmitted via droplets spread from coughs, sneezes, and respiratory secretions. Colds are usually of short duration, lasting a week or so, and the symptoms are milder than other respiratory diseases such as influenza. Table 31.1 contrasts the usually distinct symptoms and incidence of colds and influenza.
Table 31.1 Colds and influenza

aCases/100 people per year in the United States for recent years. Incidence of all other infectious diseases totals about 30 cases/100 people per year.
Symptoms and Transmission of the Common Cold
Cold symptoms include rhinitis (inflammation of the nasal region, especially the mucous membranes), nasal obstruction, watery nasal discharges, muscle aches, and a general feeling of malaise, usually without fever. Rhinoviruses are single-stranded plus-sense RNA viruses of the picornavirus group (Section 11.8) and are the most common causes of colds. Over 150 different rhinoviruses have been identified. About one-quarter of all colds are due to infections with other viruses. These include in particular the adenoviruses (Figure 31.23a) and coronaviruses (Figure 31.23b). Coxsackie viruses, respiratory syncytial viruses (RSV), and orthomyxoviruses are collectively responsible for only a small percentage of common colds.
Figure 31.23 Transmission electron micrographs of common cold viruses.

(a) Human adenovirus; a virion is about 90 nm in diameter. (b) Human coronavirus; a virion is about 60 nm in diameter.
Aerosol transmission is a major means of spreading colds, although experiments with volunteers suggest that direct contact and indirect contact involving fomites are also important means of transmission, perhaps even more important than aerosols. Incidence of the common cold rises when people are indoors in the winter months, although it is possible to “catch a cold” at any time of year. Most antiviral drugs are ineffective against common cold viruses, although some have shown promise for preventing the onset of symptoms following rhinovirus exposure. Moreover, new antiviral drugs are being designed based on knowledge of the three-dimensional structure of cold viruses. For example, antirhinovirus drugs that bind to the virus and change its surface properties in such a way as to prevent it from attaching to host cells have been developed. But thus far, most “cold drugs” on the market simply help to reduce the severity of symptoms—primarily the cough, nasal discharges, congestion, and headache.
Treatment
Because colds are generally self-limiting and not serious diseases, treatment is aimed at controlling symptoms, especially nasal discharges, with antihistamine and decongestant drugs. A plethora of such drugs are available without prescription, each touting its superior features. Many of these help control cold symptoms fairly well, but some have unwanted side effects, especially drowsiness. The severity of symptoms of any cold event is a function of the virulence of the cold virus, the overall health and well-being of the person at the time of infection, and the nature of supportive factors during infection. In the long run, immunity is more important in ridding the body of a cold virus than anything drugs can achieve. Cold viruses induce an antibody-mediated immune response that targets the current cold virus. However, the number of immunologically unique strains of each type of cold virus makes long-term immunity to the common cold unobtainable.
On average, a person in the United States contracts about three colds per year compared with less than one case of influenza per person per year (Table 31.1). This is an indication of the ease of transmission of the common cold and the large number of different viruses that cause the same general symptoms. Thus, the common cold is a recurrent event that humans must simply live with. Preventive measures such as avoiding contact with major common cold fomites (door handles and other surfaces touched by others) and with one’s inner nostrils, coupled with frequent hand washing, are best practices for avoiding the common cold.
Check Your Understanding
Discuss the possibilities for effective treatment and prevention of colds.
31.8 Influenza
Influenza is a highly infectious airborne disease of viral origin. Influenza viruses contain a single-stranded, negative-sense, segmented RNA genome surrounded by an envelope composed of protein, a lipid bilayer, and external glycoproteins (Figure 31.24; Section 11.9). There are three classes of influenza viruses: influenza A, B, and C. Here we consider only influenza A because it is the most important human pathogen.
Figure 31.24 Influenza A virus.

The virus contains a single-stranded, negative-sense RNA genome in eight segments; a virion is about 100 nm in diameter. Major factors in the success of influenza virus as a pathogen are antigenic drift and antigenic shift (see Figure 31.26).
Antigenic Drift and Antigenic Shift
Each strain of influenza A virus can be identified by a unique set of surface glycoproteins. These glycoproteins are hemagglutinin (HA or the “H antigen”) and neuraminidase (NA or the “N antigen”). Each virus has one type of HA and one type of NA on its viral capsid and is named for the antigens it contains; for example, “H1N1.” The HA antigen is important in attaching the influenza virus to host cells, while the NA antigen is instrumental in releasing the virus from host cells; each antigen is composed of several individual proteins (Figure 31.25).
Figure 31.25 Influenza virus structure.

Major viral coat proteins are: HA, hemagglutinin (three copies make up the HA coat spike); NA, neuraminidase (four copies make up the NA coat spike); M, coat protein; NP, nucleoprotein; PA, PB1, PB2, and other internal proteins, some of which have enzymatic functions.
Infection or immunization with influenza virus results in the production of antibodies that react with the HA and NA glycoproteins. When these antibodies bind to HA or NA, the virus is blocked from either attaching or releasing and is effectively neutralized, stopping the infection process. However, over time, the viral genes encoding the HA and NA glycoprotein antigens mutate, rendering minor changes to their amino acid sequence and hence antigenic structure. Mutations that alter as few as one amino acid in the glycoprotein can affect how an antibody binds to these antigens. This slight variation in the structure of influenza viral surface antigens is at the heart of a phenomenon in influenza biology called antigenic drift. As a result of these subtle yet important changes, host immunity to a given virus strain diminishes as the strain mutates, and reinfection with the mutated strain can occur. This phenomenon is why last year’s influenza vaccine may work only poorly against this year’s crop of influenza viruses (Figure 31.26a).
Figure 31.26 Antigenic drift and antigenic shift in influenza virus biology.

(a) Antigenic drift. A new vaccine is prepared each year against the major strain of influenza circulating among the population. However, vaccine efficacy wanes with time as immunologically new surface antigens appear from mutations in genes encoding viral surface proteins. (b) Antigenic shift. Influenza strains that originate in birds and humans can also infect certain other animals, such as swine, and may cause a reassortment of viral genetic material. For example, if a pig becomes infected with both bird and human viruses simultaneously, the viral genomes can be mixed, forming reassortant viruses. If such viruses, which now contain several unique antigens, infect humans, influenza pandemics can be triggered because of an ineffective immune response (Section 30.8).
In addition to antigenic drift, there is a second feature of influenza virus biology that aids virulence. The single-stranded RNA genome of influenza viruses is segmented, with genes found on each of eight distinct segments (Figure 11.24b). During virus maturation in the host cell, the viral RNA segments are packaged randomly. To be infective, a virus must be packaged so it contains one copy of each of the eight gene segments. Occasionally, however, more than one strain of influenza virus infects a single animal at one time. In such cases, if the two strains infect the same cell, both viral genomes are replicated; when genome packaging occurs, the segments from the two strains may intermix. The result is a genetically unique virus that is now a new virus strain. This mixing of gene fragments between different strains of influenza virus is called reassortment.
Unique reassortant viruses trigger the phenomenon known as antigenic shift (Figure 31.26b), a major change in a surface antigen resulting from the total replacement of the RNA that encoded it. Antigenic shift can immediately and completely change one or both of the major HA and NA viral glycoproteins in a major way. As a result, reassortant viruses are essentially unrecognized by immune responses to previous influenza infections. Reassortant viruses also frequently display one or more unique virulence properties that help to trigger unusually strong clinical symptoms and are the usual catalysts of influenza pandemics, which we consider shortly.
Mastering Microbiology
Art Activity: Figure 31.26 Antigenic drift and antigenic shift in influenza virus biology
Symptoms and Treatment of Influenza
Human influenza virus is transmitted from person to person through the air, primarily in droplets expelled during coughing and sneezing (Figure 31.1). The virus infects the mucous membranes of the upper respiratory tract and occasionally invades the lungs. Symptoms include a low-grade fever lasting up to a week, chills, fatigue, head and muscle aches, a cough and/or a sore throat, and general malaise (Table 31.1). Most of the serious consequences of seasonal influenza occur not from the disease itself but from bacterial secondary infections, especially in persons whose resistance has been lowered by the influenza infection. For example, in infants and the elderly, influenza can be followed by bacterial pneumonia (Section 31.2), sometimes in fatal form.
Most individuals develop protective immunity to the infecting strain of influenza virus, making it impossible for that strain or a very closely related strain to cause widespread infection (an epidemic) until the virus encounters another susceptible population. Immunity occurs from both antibody- and cell-mediated immune responses directed at HA and NA glycoproteins. Influenza epidemics can be controlled by immunization. Developing an effective vaccine, however, is complicated by the large number of existing influenza viral strains resulting from antigenic drift and antigenic shift (Figure 31.26). Through careful worldwide surveillance, samples of the major emerging strains of influenza virus are obtained each year before the onset of seasonal epidemics and used to prepare that year’s vaccine. In most years, this approach confers adequate protective immunity, but sometimes the vaccine is only marginally effective. For example, those who received the vaccine during the 2017–18 flu season were only 36% less likely to contract influenza than those who received no vaccine. There is evidence, however, that the annual vaccine does lessen the severity of symptoms and shorten the duration of disease in those who do become ill.
Most human influenza viruses respond to antiviral drugs. The adamantanes—amantadine and rimantadine—are synthetic amines that inhibit viral replication, and the neuraminidase inhibitors oseltamivir (Tamiflu®) and zanamivir (Relenza®) (Table 28.5) block release of newly replicated human influenza virions. These drugs are often used early on to shorten the course and severity of infection, especially in the elderly and immunocompromised.
Influenza Pandemics
Influenza pandemics—worldwide epidemics—are much less frequent than outbreaks and epidemics, occurring from 10 to 40 years apart (Section 30.8). Flu pandemics result from antigenic shift, and virtually all have been due to avian and human influenza viruses reassorting in swine (Figure 31.26b) because swine can propagate both avian and human influenza viruses. This results in a highly virulent influenza strain for which there is no preexisting immunity in humans.
The “Spanish flu” pandemic of 1918 was the most catastrophic in recorded history, and the extreme virulence of the 1918 H1N1 virus is thought to have triggered host production and release of unusually large amounts of inflammatory substances, resulting in systemic inflammation and more severe symptoms than those typical of yearly flu epidemics. The 1957 Asian flu was also a significant pandemic (Figure 31.27), beginning in China and spreading to the United States and shortly thereafter to Europe and South America. In this case, the pandemic influenza strain was a highly virulent H2N2 virus, differing antigenically from all previous strains. Pandemic influenza A (H1N1) 2009 virus, nicknamed the “swine flu,” spread much more rapidly in 2009 than even the 1957 Asian flu, starting in Mexico and spreading quickly to the United States, Europe, and Central and South America. H1N1 was a classic case of influenza virus genome reassortment in swine (Figure 31.26b), and from the swine reservoir, a highly virulent virus emerged to infect humans. Influenza A H5N1, nicknamed the “bird flu,” emerged in Hong Kong in 1997, and is the major virus health officials are monitoring closely today. H5N1 has been detected in birds in many countries, and if this virus were to infect swine and form an easily transmissible reassortant virus that subsequently jumps to humans (Figure 31.26b), such a virus could initiate a very deadly influenza pandemic.
Figure 31.27 An influenza pandemic.

Map of the Asian influenza pandemic of 1957. Lax agricultural practices with poultry and swine coupled with human interactions with these animals allowed the reassortment of influenza viral genomes from the three host species, producing a new strain for which there was no immune memory in humans. See Section 30.8 for more coverage of influenza pandemics.
Check Your Understanding
Distinguish between antigenic drift and antigenic shift in influenza.
Discuss the possibilities for effective immunization programs for influenza and compare them to the possibilities for immunization for colds.
III Direct-Contact Bacterial and Viral Diseases
**Several infectious diseases are spread from person to person or from fomites or animals to people through direct nonsexual contact. These diseases range from local infections, such as those caused by Staphylococcus aureus, to serious systemic infections associated with high mortality, such as that caused by Ebola virus.**
Some pathogens are spread primarily by direct contact with an infected person or by direct contact with blood or excretions from an infected person. Many of the respiratory diseases we have just discussed can also be spread by direct contact, but here we consider diseases spread primarily through direct contact with infected individuals rather than by an airborne route. These include staphylococcal infections, gastric ulcers, certain types of hepatitis, and the highly dangerous Ebola hemorrhagic fever.
31.9 *Staphylococcus aureus* Infections
The genus Staphylococcus contains pathogens of humans and other animals. Staphylococci commonly infect skin and wounds and may also cause pneumonia. Most staphylococcal infections result from the transfer of staphylococci in the normal microbiota of an infected, asymptomatic individual to a susceptible individual. Others result from toxemia following the ingestion of contaminated food (“staph food poisoning,” Section 33.8).
Staphylococci are nonsporulating, gram-positive cocci about 0.5–1.5 μm in diameter that divide in multiple planes to form irregular clusters of cells (**Figure 31.28a,*b***). They are resistant to drying and tolerate high concentrations of salt (up to 10% NaCl) when grown on artificial media. Staphylococci are readily dispersed in dust particles through the air and on surfaces. In humans, two species are important: Staphylococcus epidermidis, a nonpigmented species usually found on the skin or mucous membranes, and Staphylococcus aureus, a yellow-pigmented species. Both species are potential pathogens, but S. aureus is more commonly associated with human disease. Both species are frequently present in the normal microbiota of the upper respiratory tract and the skin (Figure 31.2 and see Figure 31.30b), making many people potential carriers (Sections 30.1 and 30.3).
Figure 31.28 *Staphylococcus aureus* and *S. aureus* infections.

Cells divide in several planes, giving the appearance of a cluster of grapes. (a) Gram stain; an individual coccus is about 1 μm in diameter. (b) Scanning electron micrograph of cells. (c) Structure of a boil. Staphylococci initiate a localized skin infection and become walled off by coagulated blood and fibrin through the activity of the enzyme coagulase, a major virulence factor. The ruptured boil releases pus, consisting of dead host cells and bacteria. See also Figure 31.29.
Epidemiology and Pathogenesis
Staphylococcal diseases include acne, boils, pimples, impetigo, pneumonia, osteomyelitis, carditis, meningitis, and arthritis. Many of these diseases are pyogenic (pus-forming; Figure 31.28c and Figure 31.29). Those strains of S. aureus that cause human disease produce a variety of potent virulence factors (Section 25.3). At least four different hemolysins (proteins that lyse red blood cells, see Figure 31.8) have been recognized, and a single strain often produces several. A key virulence factor produced by S. aureus is coagulase, an enzyme that converts the soluble blood glycoprotein fibrinogen to an insoluble protein, fibrin, forming a localized clot (Figure 25.12b). Clotting induced by coagulase results in the accumulation of fibrin around the bacterial cells, making it difficult for host immune cells to contact the bacteria and initiate phagocytosis (Section 26.7). Most S. aureus strains also produce leukocidin, a protein that destroys white blood cells. Production of leukocidin in skin lesions such as boils and pimples results in host cell destruction and is one of the factors responsible for pus accumulation (Figures 31.28 and 31.29). Some strains of S. aureus also produce other virulence proteins, including hyaluronidase, fibrinolysin, lipase, ribonuclease, and deoxyribonuclease.
Figure 31.29 Pus-forming staphylococcal wounds.

(a) A typical pus-forming wound on the hand. Pus lies just under the epidermal layer. (b) Abscess on the hand caused by a methicillin-resistant strain of Staphylococcus aureus (MRSA strain). If no treatment for a pus-forming wound is sought or if penicillin is administered first, MRSA infections can cause extensive tissue destruction, as shown here.
*Staphylococcus aureus* Toxic Shock
S. aureus can also cause toxic shock syndrome (TSS), a serious outcome of certain staphylococcal infections characterized by high fever, rash, vomiting, diarrhea, and in some cases, death. TSS was first recognized in women and was associated with the use of highly absorbent tampons, where conditions in the vagina promoted growth of toxic shock strains of S. aureus. However, today, TSS is seen in both men and women and is typically triggered by staphylococcal infections following surgery.
The symptoms of TSS result from an exotoxin (Section 25.6) called toxic shock syndrome toxin-1. This very potent exotoxin is a superantigen (Sections 25.7 and 28.2) that is released during cell growth and recruits large numbers of T cells to the site of infection. These then cause a major inflammatory response that is fatal in about 70% of cases. TSS can also result from superantigen exotoxins secreted by other pathogens, including Streptococcus pyogenes, the causative agent of several streptococcal syndromes (Section 31.2).
Diagnosis and Treatment and the MRSA Epidemic
To diagnose an S. aureus infection through laboratory culture, a specimen, typically from a pus-forming wound (Figure 31.29a), is cultured on a selective and differential medium containing 7.5% NaCl, mannitol, and phenol red, a pH indicator (mannitol–salt agar, Figure 31.30). The salt inhibits the growth of nonhalotolerant bacteria while allowing the halotolerant (Section 4.15) staphylococci to grow. In addition, because S. aureus ferments mannitol, it generates acidity that changes the medium from red to yellow; other staphylococci, such as S. epidermidis, do not (Figure 31.30).
Figure 31.30 Mannitol–salt agar in the isolation of staphylococci.

(a) Mannitol–salt agar (MSA) is both selective and differential for staphylococci. The presence of 7.5% NaCl makes MSA selective and phenol red makes it differential. Left, Staphylococcus epidermidis; right, Staphylococcus aureus. (b) A nasal swab of the senior author of this text supports the observation that most humans are carriers of S. aureus.
In clinical laboratories, the polymerase chain reaction (PCR, Section 12.1) is used to amplify genes unique to S. aureus from DNA isolated directly from a clinical sample (Section 29.8), and this allows for a quicker diagnosis; results from a laboratory culture take 24 h. For specific identification of methicillin-resistant strains of S. aureus (MRSA), a special selective and differential medium is available (see Explore the Microbial World, “MRSA—A Formidable Clinical Challenge” in Chapter 29), as well as a PCR protocol that identifies mecA (the gene that encodes methicillin resistance in MRSA strains) and a rapid immunological test where cells of S. aureus in suspension are agglutinated by antibodies to specific cell surface proteins (Figure 29.16).
Historically, S. aureus infections have been treated with various penicillin and cephalosporin antibiotics. However, extensive use of these antibiotics for many years has selected for resistant strains that now predominate, especially in the clinical environment. Surgical patients, for example, may acquire staphylococci from healthcare personnel who are asymptomatic carriers of drug-resistant strains. As a result, appropriate antimicrobial drug therapy for S. aureus infections is a major problem in healthcare environments. The antibiotics clindamycin and various tetracycline drugs are currently used to treat MRSA infections.
MRSA infections (Figure 31.29b) are becoming more common. Over 80,000 cases of MRSA are reported each year in the United States, but infections are actually probably closer to ten times this number. Many of these cases are hospital-acquired (nosocomial) MRSA (Section 29.2), but many others are not. Because of the potential severity of MRSA infections, it is important to rapidly identify these strains in clinical specimens so that an effective treatment is begun as soon as possible. Delayed treatment of a MRSA infection, whether due to hesitation to seek treatment or treatment with an ineffective antibiotic, can lead to extensive tissue damage (Figure 31.29b).
Prevention of staphylococcal infections is virtually impossible because many people are asymptomatic carriers of S. aureus, either on their skin or in their upper respiratory tract. However, identification and treatment of MRSA-carrying healthcare providers who serve in surgical or nursery units has helped limit transmission of these very aggressive strains. As is true of many direct-contact diseases, MRSA transmission can also be greatly diminished by practicing good basic hygiene, avoiding contact with the personal items (including clothing and towels) of others, keeping wounds covered, and for those in the healthcare profession, following the established practices of clinical microbiology safety (Section 29.1).
Check Your Understanding
What is the normal habitat of Staphylococcus aureus? How does S. aureus spread from person to person?
31.10 *Helicobacter pylori* and Gastric Diseases
Helicobacter pylori is a gram-negative, highly motile and spiral-shaped bacterium (Figure 31.31) associated with gastritis, ulcers, and gastric cancers. This bacterium colonizes the non-acid-secreting mucosa of the stomach and the upper intestinal tract. It is estimated that half the world’s population is chronically infected with H. pylori. Up to 80% of gastric ulcer patients have concomitant H. pylori infections, and up to 50% of asymptomatic adults in developing countries are chronically infected. Although there is no known nonhuman reservoir of H. pylori, infection occurs at high incidence within families, suggesting person-to-person transmission. H. pylori infections also occasionally occur in clusters, suggesting that transmission from common sources such as food or water is also possible.
Figure 31.31 *Helicobacter pylori*.

Colorized scanning electron micrograph of cells attached to the mucous lining of the stomach. Cells range in length from 3 to 5 μm and are about 0.5 μm in diameter. Note the flagella.
The *Helicobacter* Infection Process
H. pylori is only slightly invasive and colonizes the surfaces of the gastric mucosa, where it is protected from the effects of stomach acids by the gastric mucus layer. Cells of H. pylori reach these relatively protected regions by employing a chemoreceptor (Sections 2.11 and 7.6) that tracks the gradient of urea produced by gut epithelia to direct flagellar rotation up the gradient. The organism is strongly ureolytic and cleaves the urea into ammonia and bicarbonate, which help buffer the region of cell colonization from stomach acids (ammonia is a strong base).
After H. pylori cells colonize the mucosa, a combination of virulence factors and host responses cause inflammation, tissue destruction, and ulceration. Pathogen products such as the cytotoxin VacA (an exotoxin), urease, and an autoimmune response triggered by H. pylori lipopolysaccharide all contribute to localized tissue destruction and ulceration. Individuals who acquire H. pylori tend to have chronic infections unless they are treated with antibiotics. Treatment is both straightforward and important, as chronic inflammation of the gastroduodenum (gastritis) due to untreated H. pylori infection may lead to the development of gastric cancers.
*H. pylori* and Clinical Disease
Clinical signs of H. pylori infection include belching and stomach (epigastric) pain. Definitive diagnosis requires the isolation or observation of H. pylori from a gastric ulcer biopsy. However, a simple diagnostic test for the H. pylori enzyme urease is used for a noninvasive diagnosis. In this test, a small amount of 13C- or 14C-labeled urea (H2N−CO−NH2) is ingested; if H. pylori is present, the bacterium will hydrolyze the urea, forming labeled CO2 and ammonia. Hence, the presence of labeled CO2 in the patient’s breath is highly suggestive of H. pylori infection.
The best evidence for a causal association between H. pylori and gastric ulcers comes from antibiotic treatments for the disease. Long-term treatment with antacids helps alleviate gastric ulcer symptoms temporarily, but most patients relapse within 1 year. However, by treating the cause rather than the effect of the disease, actual cures can be obtained. H. pylori infection is typically treated with a combination of drugs, including the antibacterial compound metronidazole, an antibiotic such as tetracycline or amoxicillin, and a bismuth-containing antacid preparation. The combination treatment, administered for 14 days, abolishes the H. pylori infection and provides a true cure.
Like the link with gastric ulcers, the link between H. pylori infection and certain forms of gastric cancers, in particular, gastric adenocarcinoma (the most prevalent form of gastric cancer), is also strong. Gastric cancers are the second leading cause of cancer deaths worldwide. Although how H. pylori infection actually triggers adenocarcinomas is unclear, it is believed that long-term inflammation caused by infection with this bacterium coupled with host and possibly environmental factors combine to predispose an individual to stomach malignancies. For their contributions to unraveling the connection between H. pylori and peptic and duodenal ulcers, the Australian scientists Robin Warren and Barry Marshall were awarded the 2005 Nobel Prize in Physiology or Medicine.
Check Your Understanding
Describe infection by Helicobacter pylori and the resulting development of a gastric ulcer.
How can gastric ulcers be diagnosed? How can they be cured?
31.11 Hepatitis
Hepatitis is a liver inflammation, commonly caused by an infectious agent. Hepatitis sometimes results in acute illness followed by destruction of functional liver anatomy and cells, a condition known as cirrhosis. Hepatitis due to infection can cause chronic or acute disease, and some forms lead to liver cancer.
Although many viruses and a few bacteria can cause hepatitis, a restricted group of viruses is often associated with liver disease. Hepatitis viruses A, B, C, D, and E are phylogenetically diverse viruses (Table 31.2) but share in common their ability to infect the liver, with hepatitis viruses A, B, and C accounting for the majority of cases worldwide. The incidence of hepatitis A and B has decreased significantly over the past 25 years, primarily because of the availability of effective vaccines and increases in surveillance (Figure 31.32). By comparison, with no vaccine available, hepatitis C infections have gradually risen in recent years, although those infected can be cured of infection with HCV-specific drugs.
Table 31.2 Hepatitis viruses

aExamples and discussion of each of these genomes can be found in Chapter 11 (Figures 11.2 and 11.3).
Figure 31.32 Hepatitis A, B, and C in the United States.

In 2016 there were 2007 reported cases of hepatitis A, 3218 reported cases of hepatitis B, and 2967 reported cases of hepatitis C. The number of actual new cases of hepatitis A, B, or C infection is likely to be much higher than the reported new cases. Data obtained from the CDC, Atlanta, Georgia, USA.
Mastering Microbiology
Art Activity: Figure 31.32 Hepatitis A, B, and C in the United States
Hepatitis A and E viruses, although occasionally transmitted person to person, are more commonly transmitted enterically by contaminated food or water. We cover hepatitis A viral disease in Chapter 33. Here our focus is on hepatitis viruses transmitted by direct contact, with the major focus on hepatitis B, the causative agent of “bloodborne hepatitis.”
Epidemiology
Infection with hepatitis B virus (HBV) is called bloodborne hepatitis (or serum hepatitis) because it is transmitted in blood or in body fluids in contact with blood. HBV is a hepadnavirus, a partially double-stranded DNA virus (Section 11.11). The mature virus particle containing the viral genome is called a Dane particle (Figure 31.33). HBV causes acute, often severe disease that can lead to liver failure and death. Chronic HBV infection can lead to cirrhosis and liver cancer.
Figure 31.33 Hepatitis.

(a) Hepatitis B virus. The arrow indicates a complete HBV virion, which is called a Dane particle. A Dane particle is about 40 nm in diameter. (b) Jaundice, a yellowing of the facial skin and eye conjunctiva, is a common symptom of hepatitis infections and results from the accumulation of bilirubin (a by-product of degraded red blood cells) that results from reduced liver function.
HBV is transmitted by a parenteral route, which means “outside the gut.” The main means of HBV transmission is from blood transfusions, contact with infected blood in a hypodermic needle, and from mother to child during childbirth. HBV may also be transmitted through exchanges of body fluids during sex. The number of new HBV infections has remained low and more or less constant since the year 2000 (Figure 31.32). Nevertheless, over 100,000 people worldwide and nearly 5000 people in the United States die yearly from liver failure or liver cancer caused by chronic HBV infection.
Hepatitis D virus (HDV) is a defective virus (Section 9.7) that lacks genes encoding its own capsid. HDV is also transmitted by parenteral routes, but because it is a defective virus, it cannot replicate and form an intact virion unless the cell is also infected with HBV. The HDV genome replicates independently but relies on HBV to produce capsid proteins (which are the same as those used by HBV) to form infectious virions. Thus, HDV infections are always coinfections with HBV, and therefore the HBV vaccine also indirectly protects against HDV.
Hepatitis C virus (HCV) is also transmitted parenterally, most commonly by sharing of needles and syringes for injection of illicit drugs. HCV generally produces a mild or even asymptomatic disease at first, but later up to 85% of those infected develop chronic hepatitis, with up to 20% proceeding to chronic liver disease and cirrhosis. Chronic infection with HCV leads to hepatocarcinoma (liver cancer) in 3–5% of infected individuals. The latency period for development of cancer can be several decades after the primary infection. Only a fraction of the estimated 25,000 annual new infections with HCV in the United States are recognized and formally reported (Figure 31.32). Large numbers of HCV-related deaths occur annually as a result of chronic HCV infections that develop into liver cancer. HCV-induced liver disease accounts for up to 10,000 of the 25,000 annual deaths due to liver cancer, other chronic liver diseases, and cirrhosis.
Other Aspects of Hepatitis Syndromes
Hepatitis is an acute disease of the liver, a vital organ that plays a role in several key metabolic processes, including carbohydrate, lipid, and protein syntheses, as well as detoxification and many other functions. Symptoms of hepatitis include fever, jaundice (yellowing of the skin and the whites of the eyes, Figure 31.33b), and liver enlargement and cirrhosis. All hepatitis viruses cause similar acute symptoms and cannot be readily distinguished based on clinical findings alone. Chronic hepatitis infections, usually caused by HBV or HCV, are often asymptomatic or produce very mild symptoms, but nonetheless cause serious liver disease, even in the absence of liver cancer.
Diagnosis of hepatitis is based on a combination of clinical symptoms and laboratory tests that assess liver function, especially key liver enzymes. Cirrhosis is diagnosed by visual examination of biopsied liver tissue. Virus-specific molecular assays are typically used to confirm a diagnosis, positively identify the type of hepatitis virus, and determine a course of treatment. Many of the immunological and molecular diagnostic tools discussed in Chapter 29 are used in hepatitis diagnoses. These include enzyme immunoassays that target viral-specific proteins or antiviral antibodies in a blood sample, immunoblots (Western blots), and immunofluorescence (microscopic) methods. Polymerase chain reaction (PCR) tests are also used to detect hepatitis viral genomes in blood or in liver tissue obtained by biopsy.
Infection with HAV or HBV can be prevented with effective vaccines. HBV vaccination is recommended and in most cases is required for school-age children in the United States. No effective vaccines are available for the other hepatitis viruses. For those unvaccinated, the practice of universal precautions will prevent infection. The precautions prescribe a high level of vigilance and aseptic handling and containment procedures to deal with patients, body fluids, and infected waste materials (Section 29.1). Most treatment of hepatitis is supportive, providing rest and time for the immune system to attack the infection and allow liver damage to be repaired. In some cases, in particular for HBV infections, some antiviral drugs are available that offer effective treatment. Those infected with any of the known strains of hepatitis C virus can be treated with a specific antiviral drug that in most cases effects a complete cure.
Check Your Understanding
What host organ do hepatitis viruses attack? How are hepatitis A, B, and C viruses transmitted?
Describe potential prevention and treatment methods for hepatitis A, B, and C viruses.
31.12 Ebola: A Deadly Threat
A recent example of a highly infectious and deadly serious emerging pathogen that spreads by direct contact is Ebola virus, which ravaged parts of West and central Africa in 2014, 2015, and 2019 (Section 30.7 and Figure 30.10). Ebola has infected over 31,000 people and killed over 12,000 of them.
Ebola emerged in 1976 in Zaire, and since then several small outbreaks have occurred in West African countries. But not until the 2014 outbreak in Guinea, Liberia, Nigeria, Senegal, and Sierra Leone did the disease kill such large numbers of people. However, nearly as fast as the disease reemerged, strong efforts to contain the spread of infection were put in place and these, along with unknown natural events that control cycles of this disease, combined to significantly reduce Ebola incidence. By the end of 2015, only a handful of cases were reported. Ebola reemerged in 2019 in the Democratic Republic of Congo with over 2000 deaths reported. Today, significant epidemiological surveillance for Ebola remains in place because of the ease of transmission of the virus and thus the rapidity by which a single infection can trigger an outbreak.
Ebola: The Virus and Its Transmission
Ebola hemorrhagic fever is caused by a filovirus, a filamentous virus that can take on many shapes (Figure 31.34a). The Ebola virus genome contains single-stranded and linear RNA of the negative sense, similar in this respect to influenza and rabies virus genomes. The genome contains only 19 kilobases of RNA, enough to encode just seven proteins; about a third of the genome encodes the RNA-dependent RNA polymerase (RNA replicase) needed to replicate the genome of negative-sense RNA viruses (Section 11.9).
Figure 31.34 Ebola.

(a) Colorized transmission electron micrograph of a negatively stained preparation of Ebola virus virions. A virion is about 80 nm in diameter. (b) Ugandan Red Cross workers donning their personal protective equipment before collecting the body of an Ebola victim.
Ebola virus is transmitted from person to person by direct contact through breaks in the skin or mucous membranes as well as by body fluids (including semen) and fomites (bedding, clothing, utensils) contaminated with the virus. The ease with which Ebola can be transmitted seems remarkable compared with other pathogens that rely on direct-contact transmission. For example, in a few documented instances of Ebola transmission to healthcare workers, significant precautions had been taken to ensure that full-body personal protective equipment (PPE, Section 29.1) was in place to specifically prevent such transmission. Thus, the disease is not only deadly for those infected but can be an extremely dangerous risk for healthy medical providers as well. If PPE is not worn, healthcare workers who either treat patients or dispose of dead Ebola victims run a high risk of becoming infected. Thus, PPE is routinely worn by international health organization workers who might come in contact with an Ebola patient (Figure 31.34b).
The natural reservoir of Ebola virus that triggered the West African outbreak is unknown, although related filoviruses, such as hantavirus (Section 32.2), are known to be spread from arthropods and rodents. Among the suspected reservoirs of Ebola are a variety of animals and possibly insects that inhabit tropical forests. In addition to person-to-person transmission, likely responsible for virtually all of the cases in the recent West Africa epidemic, natural Ebola infection in humans probably originates from an animal bite. In this regard, bats, and in particular fruit bats in which the virus has been documented, may be a major disease reservoir.
Ebola: The Disease and Its Treatment
Ebola virus migrates from the initial site of infection to lymph nodes, from which it travels systemically to infect the liver and spleen. Once the virus has entered the body, several different types of cells can become infected. One to two weeks postinfection, an Ebola patient experiences an abrupt fever and general malaise, conditions that make Ebola difficult to distinguish from many other tropical diseases, including malaria. But then more severe symptoms appear. These typically include severe fever and fatigue, diarrhea, nausea, vomiting and abdominal pain, and major loss of appetite. Bleeding through the skin and blood in vomit and feces can occur, but such bleeding is not a common symptom.
Ebola virus causes major problems in the liver, killing liver cells and disrupting normal blood clotting events. It is thought that the virus triggers host cells to release various cytokines that cause widespread inflammation (Section 26.8) and internal bleeding; these lead to multiple organ failures, shock, and renal failure. The mortality rate in the West African Ebola outbreak averaged 35–70% depending on access to treatment, the initial state of health of those infected, viral load (abundance of the virus in the blood), and age; mortality was as high as 85% among infected people over the age of 45.
There is currently no drug treatment for Ebola, but survival rates among those that receive supportive care to help alleviate symptoms are significantly higher than in those that do not. Therapy includes the maintenance of fluids and electrolytes, oxygen supplements, and transfusions of blood to replace that lost from internal bleeding. Ebola survivors develop an antibody-mediated immune response to the virus, and some treatment success has been achieved by transfusing blood or serum from Ebola survivors into those infected. Vaccines for Ebola are in development, and several promising candidates have emerged. Experimental vaccines have been administered with considerable success to healthcare workers in the Democratic Republic of Congo outbreak, and thus it is likely that putting a person’s immune system to work against Ebola—through vaccination—will be the best preventive measure against the disease. However, it is unlikely that an Ebola vaccine would help an already infected person, considering the rapidity with which the disease progresses and the major organ damage that viral infection triggers.
Much has been learned from recent Ebola outbreaks concerning the logistics of handling large-scale outbreaks of such a deadly disease. The ease by which Ebola is transmitted made a public education campaign about the dangers of Ebola just as important as dealing with the morbidity and mortality of the outbreak. When epidemiologists develop a better understanding of the natural reservoirs of Ebola virus, outbreaks like that in West Africa—which likely began by animal-to-person transmission—may well be preventable by reducing or eliminating the major reservoirs and educating the populace about the dangers of encounters with known reservoirs. Also, rigorous campaigns to educate people such as family members who put themselves at risk by handling an Ebola patient or the corpse of an Ebola victim without PPE in place are also helping to reduce spread of Ebola when a case or case cluster does appear.
Check Your Understanding
What do influenza virus and Ebola virus have in common? In what ways do their modes of transmission differ?
Contrast mortality rates for influenza and Ebola hemorrhagic fever. Which is the more serious disease?
IV Sexually Transmitted Infections
Diseases spread through sexual contact may be caused by bacteria, viruses, protists, or fungi. Sexually transmitted infections are characterized by latency, persistence, and recurrence, and in some cases are inapparent. Although most sexually transmitted diseases are curable, currently only one type of sexually transmitted infection is preventable by immunization.
Sexually transmitted infections (STIs), also called sexually transmitted diseases (STDs), are caused by a wide variety of bacteria, viruses, protists, and even fungi (Table 31.3). Unlike respiratory pathogens that can be shed constantly in large numbers by an infected individual, sexually transmitted pathogens are typically found only in body fluids from the genitourinary tract (and blood, in the case of HIV). Because they require a protected and moist environment, sexually transmitted pathogens preferentially and sometimes exclusively colonize the genitourinary tract.
Table 31.3 Sexually transmitted infections and treatment guidelines

Because the transmission of STIs is limited to sexual activity, their spread can be controlled by sexual abstinence and minimized by the effective use of condoms that stop the exchange of body fluids during sex. With the exception of HIV/AIDS and genital herpes, most STIs are curable, and many can have only minor symptoms. These realities, combined with the fact that those infected are sometimes reluctant to seek treatment, make treatment of STIs an ongoing public health challenge. However, delaying or forgoing treatment of STIs only serves to maintain lines of transmission and can lead to long-term health problems, such as infertility, cancer, heart disease, degenerative nerve disease, birth defects, stillbirth, or destruction of the immune system, any of which can result in death.
31.13 Gonorrhea, Syphilis, and Chlamydia
Gonorrhea, syphilis, and sexually transmitted Chlamydia infections are ancient STIs. Whereas the pathogenesis and symptoms of gonorrhea and chlamydial infections are similar in several ways, these STIs are quite different from syphilis. In the United States, cases of gonorrhea and sexually transmitted Chlamydia peaked following the introduction of birth control pills in the mid-1960s, and these STIs are still quite prevalent today; cases of syphilis, on the other hand, are less prevalent (Figure 31.35). However, the incidence of all of these STIs has risen significantly in recent years. Between 2013 and 2017 in the United States, reported cases of gonorrhea increased 67%, Chlamydia incidence rose by 22%, and diagnoses of syphilis jumped 76% (Figure 31.35).
Figure 31.35 Reported cases of gonorrhea and syphilis in the United States.

Note the downward trend in disease incidence after the introduction of antibiotics and the upward trend in the incidence of gonorrhea after the introduction of birth control pills. In 2017 there were 555,608 new cases of gonorrhea and 30,644 new cases of primary and secondary syphilis in the United States.
Gonorrhea
Neisseria gonorrhoeae, often called the gonococcus, causes gonorrhea, a highly prevalent bacterial STI of more than half a million reported cases in the United States in 2017. N. gonorrhoeae is a gram-negative and obligately aerobic diplococcus related biochemically and phylogenetically to Neisseria meningitidis (Section 31.5). Cells of N. gonorrhoeae are killed rapidly by drying, sunlight, and ultraviolet radiation and thus normally do not survive away from the mucous membranes of the pharynx, conjunctiva, rectum, or genitourinary tract (Figure 31.36). Because of this, gonorrhea can be transmitted only by intimate person-to-person contact. We discussed the clinical microbiology and diagnosis of gonorrhea in Section 29.3.
Figure 31.36 The causative agent of gonorrhea, *Neisseria gonorrhoeae*.

(a) Gram stain of a urethral discharge. (b) Scanning electron micrograph of the microvilli of human fallopian tube mucosa with cells of N. gonorrhoeae attached to the surface of epithelial cells. Cells of N. gonorrhoeae are about 0.8 μm in diameter. Neisseria species are Betaproteobacteria (Section 16.2).
Mastering Microbiology
Art Activity: Figure 31.35 Reported cases of gonorrhea and syphilis in the United States
The symptoms of gonorrhea are quite different in the male and female. In females, gonorrhea may be asymptomatic or cause a mild vaginitis that is difficult to distinguish from vaginal infections caused by other organisms; hence, the infection may easily go unnoticed. Complications from untreated gonorrhea in females, however, can lead to a chronic condition called pelvic inflammatory disease (PID), which can cause severe abdominal pain and sterility. In men, N. gonorrhoeae causes an infection of the urethral canal characterized by painful urination (dysuria) and urethral discharge of pus. Complications from untreated gonorrhea affecting both males and females include damage to heart valves and joint tissues due to inflammatory reactions from immune complexes that deposit in these areas. In addition to disease in adults, N. gonorrhoeae can also cause eye infections in newborns. Infants born of infected mothers may acquire an eye infection called ophthalmia neonatorum from passage through the birth canal. Therefore, prophylactic treatment of the eyes of all newborns with an ointment containing erythromycin is mandatory in much of the United States to prevent gonococcal and other bacterial eye infections in infants.
Treatment of gonorrhea with penicillin was the method of choice until the 1980s when strains of N. gonorrhoeae resistant to penicillin emerged. The quinolones ciprofloxacin, ofloxacin, or levofloxacin were also used, but by 2006, a significant fraction of N. gonorrhoeae strains isolated in the United States had developed resistance to these drugs as well. Strains resistant to penicillin and quinolones respond to alternative antibiotic therapy with a single dose of the β-lactam antibiotics cefixime or ceftriaxone, especially when given in combination with azithromycin (Figure 28.18).
Despite the fact that drugs are still effective in treating gonorrhea, incidence of gonorrhea remains high (Figure 31.35) for at least three reasons. First, although anti-gonococcal antibodies are generated by an infection, they are strain-specific and provide no protection from infection by other strains of N. gonorrhoeae. As a consequence, gonorrhea reinfection is possible and quite common in high-risk populations (primarily sex workers and those with multiple sex partners). In addition, within a single N. gonorrhoeae strain, antigenic switches can thwart the immune response. For example, by mutation N. gonorrhoeae can alter the structure of its pilus proteins, thus creating new serotypes to challenge the immune response. Second, oral contraceptives cause a rise in vaginal pH; when this occurs, lactic acid bacteria normally found in the adult vagina fail to develop, and this reduces competition for colonization by N. gonorrhoeae. Finally, and most importantly, symptoms of gonorrhea in the female are often so mild that the disease may go unrecognized; a promiscuous infected female can then infect many males.
Syphilis and Yaws
Syphilis is caused by the bacterium Treponema pallidum subspecies pallidum, a spirochete having a long, thin, and tightly coiled morphology (Figure 31.37). Like N. gonorrhoeae, this pathogen is sensitive to environmental stress and drying, and thus syphilis is transmitted only through intimate sexual contact or from mother to fetus during pregnancy (the biology of the spirochetes and the genus Treponema is discussed in Section 15.17). A closely related spirochete, Treponema pallidum subspecies pertenue, causes the tropical disease yaws and is more resistant to environmental stressors. Therefore, unlike syphilis, yaws is easily spread by casual (nonsexual) contact through breaks in the skin. Although rarely fatal, about 100,000 new cases of yaws appear every year, mostly in children, producing ulcerous lesions that can be disabling and disfiguring (see Figure 31.39).
Figure 31.37 The syphilis spirochete, *Treponema pallidum*.

(a) Cells from a chancre stained with a fluorescent antibody measure 0.15 μm wide and 10–15 μm long. (b) Silver-stained (Fontana method) preparation of a specimen from a syphilitic chancre. (c) Shadow-cast electron micrograph of a cell of T. pallidum. The endoflagella are typical of spirochetes (Section 15.17).
Syphilis is often transmitted simultaneously with gonorrhea as a coinfection. However, syphilis is potentially the more serious disease. Despite its lower incidence, syphilis kills nearly 100,000 people per year worldwide, whereas gonorrhea kills fewer than 1000 people per year (in some of these cases, the individuals are in poor health to begin with or have coinfections with other pathogens, and so the cause of death may not be due to a single pathogenic agent). Cases of syphilis in the United States have increased dramatically in recent decades, however, with over 30,644 new infections reported in 2017 from a low of around 6000 just ten years earlier. The increase in syphilis incidence may partly be linked to the success of new HIV/AIDS treatments (Section 31.15). Those infected with HIV are often coinfected with T. pallidum, and new anti-retroviral drugs that extend the life span of HIV/AIDS patients allow time for the slowly progressing symptoms of advanced syphilis to appear, thus resulting in diagnosis and case reporting.
Neither subspecies of T. pallidum (Figure 31.37) is able to penetrate intact skin, and therefore initial infection takes place through tiny breaks in the epidermis. Initial syphilitic infection is evident with the appearance of a hard lesion called a chancre, usually on the penis of males or the vagina, cervix, or perineal region of females. In about 10% of cases, infection is extragenital, usually in the oral region (Figure 31.38a). During pregnancy, the pathogen can be transmitted from an infected woman to the fetus; the disease acquired by the infant is called congenital syphilis. For yaws, lesions generally appear on the legs, face, or back where the skin has been broken and direct contact with the spirochete has occurred. The “weeping” lesions of yaws are characterized by a fluid exudate and white, splotchy patches around the perimeter of the ulcer (Figure 31.39).
Figure 31.38 Primary and secondary syphilis.

(a) Chancres on the lip and (b) the penis in cases of primary syphilis. The chancre is the characteristic lesion of primary syphilis at the site of infection by Treponema pallidum. (c) Syphilitic rash on the lower back of a patient showing secondary syphilis.
Figure 31.39 Yaws lesion on the face of a young girl caused by *Treponema pallidum* subspecies *pertenue*.

The tropical disease yaws, caused by a different subspecies of the same bacterium that causes syphilis, produces splotchy, “weeping” lesions, often with white perimeters. Like syphilis, the debilitating disease can be treated successfully by administering penicillin-based antibiotics.
Stages of Syphilis
Syphilis is a more complex disease than yaws because it progresses through a series of increasingly serious stages. Syphilis always begins with a localized infection called primary syphilis, and it is at this stage that T. pallidum multiplies at the site of entry and the characteristic hard chancre appears, usually within 2 weeks to 2 months (Figure 31.38a, b). Microscopy of a syphilitic chancre exudate reveals the actively motile spirochetes (Figure 31.37a, b). In most cases, the chancre heals spontaneously, and T. pallidum disappears from the site. In untreated cases, however, the highly invasive cells spread from the initial site to various parts of the body, such as the mucous membranes, eyes, joints, bones, or central nervous system, where extensive multiplication occurs. A hypersensitivity reaction to the invading bacteria often produces the key symptom of secondary syphilis at this time—the development of a generalized, often coppery looking skin rash over the whole body (Figure 31.38c).
In the absence of treatment, the subsequent course of the disease varies from case to case. About 25% of infected individuals spontaneously recover and are free of any further disease symptoms. Another one-fourth exhibit no further symptoms but maintain a persistent, chronic syphilitic infection. Roughly half of untreated patients develop tertiary syphilis, with symptoms ranging from relatively mild infections of the skin and bone to serious and even fatal infections of the cardiovascular system or central nervous system. This may occur many years after the primary infection. Involvement of the nervous system can cause paralysis or other severe neurological damage (insanity is common in fatal infections). Relatively low numbers of T. pallidum are present in individuals with tertiary syphilis; most of the symptoms probably result from inflammation due to delayed-type hypersensitivity reactions (Section 28.1) to the pathogen. Tertiary syphilis can still be treated, usually with long-term intravenous antibiotic administration, but prior neurological damage from the syphilitic infection is typically irreversible.
Although several laboratory tests can be used to diagnose T. pallidum infections (Chapter 29), the most important physical sign is an ulcerous lesion—either a splotchy, weeping ulcer with yaws or a hard chancre with syphilis. Unlike the case with gonorrhea, penicillin remains highly effective in treating both syphilis and yaws, and both diseases can typically be cured by a single injection of benzathine penicillin G. Oral azithromycin has also been highly effective in treating yaws, often in just a single dose, but some resistance to this antibiotic has emerged among strains of T. pallidum that cause syphilis.
Chlamydial Syndromes
A number of sexually transmitted diseases can be ascribed to infection by the obligately intracellular bacterium Chlamydia trachomatis (Figure 31.40). This organism is one of a small group of parasitic bacteria that form their own phylum (the Chlamydiae) of Bacteria (Section 16.15). Because C. trachomatis must be grown in host cells (tissue culture), its rapid isolation and identification is not as straightforward as for Neisseria gonorrhoeae.
Figure 31.40 Cells of *Chlamydia trachomatis* (arrows) attached to human fallopian tube tissues.

(a) Cells attached to the microvilli of a fallopian tube. (b) A damaged fallopian tube containing a cell of C. trachomatis (arrow) in the lesion.
The total incidence of sexually transmitted C. trachomatis infections significantly outnumbers the incidence of gonorrhea, making chlamydial infections the most prevalent bacterial STIs in the world. In the United States alone, over 1.7 million chlamydial cases were reported in 2017, nearly half of which were among 15- to 24-year-old females. Because of their often inapparent nature, the actual incidence of sexually transmitted chlamydial infections may be closer to 4 million cases every year. C. trachomatis also causes a serious eye infection called trachoma, which is the number one cause of infectious blindness in the world, but the strains of C. trachomatis responsible for STIs are usually distinct from those that cause trachoma. Chlamydial infections may also be transmitted congenitally to the newborn in the birth canal, causing newborn conjunctivitis and pneumonia.
Nongonococcal urethritis (NGU) due to C. trachomatis is one of the most frequently observed sexually transmitted diseases in males and females, but the infections are often inapparent. In a small percentage of cases, chlamydial NGU leads to serious acute complications, including testicular swelling and prostate inflammation in men and cervicitis, pelvic inflammatory disease, and fallopian tube damage in women. These are due to the ability of C. trachomatis to trigger an overblown immune response and inflammation in the host. During NGU, cells of C. trachomatis can attach to microvilli of fallopian tube cells, enter, multiply, and eventually lyse the cells (Figure 31.40b). Untreated NGU in a female can thus lead to infertility, ectopic pregnancy, and chronic pelvic pain. Infections with the protist Trichomonas vaginalis can cause symptoms similar to those of chlamydial NGU, and we consider trichomoniasis along with other parasitic infections in Chapter 34.
Chlamydial NGU is frequently observed as a secondary infection following gonorrhea. Both N. gonorrhoeae and C. trachomatis are often transmitted to a new host simultaneously. However, treatment of gonorrhea does not eliminate chlamydial infection. Although cured of gonorrhea, these patients are still infected with Chlamydia and eventually experience an apparent recurrence of gonorrhea that is instead a case of chlamydial NGU. Thus, patients treated for gonorrhea with drugs such as cefixime or ceftriaxone are also given azithromycin or doxycycline to treat a potential coinfection with C. trachomatis. A variety of clinical techniques including nucleic acid and immunological analyses are available for making a positive diagnosis of C. trachomatis infection, but drug therapy in the absence of a positive diagnosis is often prescribed.
Lymphogranuloma venereum (LGV) is a sexually transmitted disease caused by distinct strains of C. trachomatis (referred to as LGV 1, 2, and 3). The disease occurs most frequently in males and is characterized by infection and swelling of the lymph nodes in and about the groin. From the infected lymph nodes, chlamydial cells may travel to the rectum and cause a painful inflammation of rectal tissues called proctitis. LGV has the potential to cause regional lymph node damage and the complications of proctitis. It is the only chlamydial infection that invades beyond the epithelial cell layer.
We move on to the final two sections of this chapter to look at sexually transmitted diseases of viral origin.
Check Your Understanding
How are gonorrhea, syphilis, and chlamydial infections diagnosed?
Explain at least one potential reason for the higher incidence of gonorrhea as compared with syphilis.
Compare and contrast the symptoms of yaws and syphilis. How are these diseases treated?
31.14 Herpes Simplex Viruses (HSV) and Human Papillomavirus (HPV)
31.14 Herpes Simplex Viruses (HSV) and Human Papillomavirus (HPV)
31.14 Herpes Simplex Viruses (HSV) and Human Papillomavirus (HPV)
STIs caused by herpesviruses and human papillomaviruses are extremely prevalent among sexually active adults and are often more difficult to diagnose and treat than are bacterial STIs.
Herpes
Herpesviruses are a large group of double-stranded DNA viruses (Section 11.7), many of which are human pathogens. The herpes simplex viruses are responsible for both cold sores and genital infections.
Herpes simplex 1 virus (HSV-1) infects the epithelial cells around the mouth and lips, causing cold sores (also called fever blisters) that occasionally spread to other parts of the face in severe infections (Figure 31.41). HSV-1 is spread via direct contact with infectious lesions or through saliva. The incubation period of HSV-1 infections is short (3–5 days), and the lesions heal without treatment in 2–3 weeks. However, latent herpes infections are common, because the virus typically persists in low numbers in nerve ganglia. Recurrent acute herpes infections can then occur when the virus is triggered by coinfections with other pathogens or by bodily stress. Oral herpes caused by HSV-1 is quite common and apparently has no long-term harmful effects on the host, beyond the discomfort of the oral blisters.
Figure 31.41 Herpes simplex 1 virus infections.

(a) A severe case of herpes blisters on the face due to infection with herpes simplex 1 virus. (b) Close-up view of herpes blisters by the eye.
Herpes simplex 2 virus (HSV-2) infections are associated primarily with the anogenital region, where the virus causes painful blisters on the penis of males or on the cervix, vulva, or vagina of females (Figure 31.42). HSV-2 infections are generally transmitted by direct sexual contact, and the disease is most easily transmitted when active blisters are present but may also be transmitted during asymptomatic periods, even when the infection is presumably latent. HSV-2 occasionally infects other sites such as the mucous membranes of the mouth and can also be transmitted to a newborn by contact with herpetic lesions in the birth canal at birth. The disease in the newborn varies from latent infections with no apparent damage to systemic disease resulting in brain damage or even death. To avoid herpes infections in newborns, delivery by cesarean section is advised for pregnant women with genital herpes infections.
Figure 31.42 Herpes simplex 2 virus infections.

Herpes simplex 2 virus blisters on the (a) penis and (b) vulva. As for herpes type 1, acute type 2 herpes infections can seemingly be cured only to reappear later from a persistent virus infection (Section 5.7).
The long-term effects of genital herpes infections are not fully understood. However, studies have indicated a significant correlation between genital herpes infections and cervical cancer in females. Genital herpes infections are presently incurable, although a limited number of drugs have been successful in controlling the infectious blister stages. The guanine analog acyclovir (Figure 31.43), given orally and also applied topically, is particularly effective in limiting the shed of active virus (both HSV-1 and HSV-2) from blisters and promoting the healing of blistering lesions (Figures 31.41 and 31.42). Acyclovir, and the related drugs valacyclovir and vidarabine, are nucleoside analogs that interfere with herpesvirus DNA replication, thus inhibiting viral multiplication.
Figure 31.43 Guanine and the guanine analog acyclovir.

Acyclovir has been used therapeutically to control genital herpes (HSV-2) blisters (Figure 31.42).
Human Papillomavirus
As for herpesviruses, human papillomaviruses (HPV) comprise a family of double-stranded DNA viruses. Of more than 100 different strains, about 30 are transmitted sexually, and several of these cause genital warts and cervical cancer. About 20 million people in the United States are infected, and up to 80% of women over age 50 have had at least one HPV infection. Over 6 million people acquire new HPV infections annually, leading to almost 10,000 cases of cervical cancer and about 3700 deaths.
Most HPV infections are asymptomatic, with some progressing to cause genital warts. Others cause cervical neoplasia (abnormalities in cells of the cervix), and a few progress to cervical cancers. Most HPV infections resolve spontaneously but, as with many viral infections, there is no adequate treatment or cure for active infections. Because human papillomaviruses are potentially oncogenic (cancer-causing), available HPV vaccines, such as the widely used HPV 9-valent vaccine (marketed as Gardasil®), are currently recommended for use in females 11–26 years of age. The HPV vaccine is also recommended for males to prevent anal and penile cancers and also because immunized males do not carry HPV and thus cannot infect females. In addition, the HPV vaccine should reduce incidence of certain neck and throat cancers in both males and females caused by the same sexually transmitted strains of HPV.
Check Your Understanding
Describe pertinent clinical features and treatment protocols for herpes simplex viruses and human papillomaviruses.
Why are these diseases more difficult to diagnose than gonorrhea or syphilis?
31.15 Human Immunodeficiency Virus (HIV) and AIDS
Acquired immunodeficiency syndrome (AIDS) is caused by the human immunodeficiency virus (HIV). Worldwide, nearly 80 million people have been infected with HIV, with an estimated 6000 more added each day, and over 35 million have died. In the United States, from a total of 5 cases diagnosed in 1981, over 1.1 million people are infected with HIV today. We covered some aspects of the epidemiology of HIV/AIDS in Section 30.8 and will pick up on that theme here.
HIV and a Definition of AIDS
HIV is of two types, HIV-1 and HIV-2, but because more than 99% of global AIDS cases are due to HIV-1, we focus on HIV-1 here. HIV-1 is a retrovirus (Sections 5.7 and 11.11) that replicates in macrophages and T cells of the human immune system (Chapters 26 and 27). HIV infection eventually leads to the destruction of key immune system cells, virtually eliminating the host immune response. Death from AIDS is usually the result of a secondary infection, typically one caused by an opportunistic pathogen, pathogens that in a healthy individual would be controlled by the immune system.
Mastering Microbiology
Art Activity: Figure 31.44 Infection of a CD4 target cell with HIV
The current definition of a case of HIV/AIDS is a patient who tests positive for HIV in immunological and/or nucleic acid–based tests and meets at least one of the following two criteria:
A CD4 T cell number of less than 200/μl of whole blood (the normal count is 600–1000/μl) or a CD4 T cell/total lymphocytes percentage of less than 14%.
A CD4 T cell number of more than 200/μl and any of the following diseases: candidiasis, coccidioidomycosis, cryptococcosis, histoplasmosis, cystoisosporiasis, Pneumocystis jirovecii pneumonia, cryptosporidiosis, or toxoplasmosis of the brain (all fungal or protozoal diseases, Chapter 34); pulmonary tuberculosis or other mycobacterial infections, or recurrent Salmonella septicemia (bacterial diseases); cytomegalovirus infection, HIV-related encephalopathy, HIV wasting syndrome, chronic ulcers, or bronchitis due to herpes simplex (viral infections); or certain malignant diseases such as invasive cervical cancer, Kaposi’s sarcoma, Burkitt’s lymphoma, primary lymphoma of the brain, or immunoblastic lymphoma; or recurrent pneumonia due to any agent.
Pathogenesis of HIV/AIDS
HIV infects cells that have the CD4 cell surface protein. The two cell types most commonly infected are macrophages and T-helper (Th) lymphocytes, both of which are important components of the immune system. Infection normally occurs first in macrophages. At the macrophage cell surface, the CD4 molecule binds to the gp120/gp41 capsid protein of HIV as the virus interacts with the macrophage receptor CCR5 (Figure 31.44). CCR5 is a coreceptor for HIV and, together with CD4, forms the docking site where the HIV envelope fuses with the host cytoplasmic membrane; this is required for the viral nucleocapsid to be inserted into the cell (Figure 31.44b). Within the macrophage, HIV replicates and makes an altered form of gp120 that recognizes a different coreceptor, CXCR4, on Th cells. HIV virions are released from macrophages and proceed to infect and replicate in Th lymphocytes. Infected Th cells that produce HIV no longer divide and are eventually diminished by attrition.
Figure 31.44 Infection of a CD4 target cell with HIV.

(a) Recognition and binding of HIV by CCR5 and CD4 receptors. (b) The viral nucleocapsid eventually enters the cell. Details of the replication of the HIV genome were shown in Figure 11.27.
In some HIV/AIDS patients, HIV infection does not progress immediately to killing host immune cells. HIV can exist in a dormant state as a provirus; under these conditions, the reverse-transcribed HIV genome, now in the form of DNA, is integrated into host chromosomal DNA (Figure 11.27). At this point the cell may show no outward sign of infection. Indeed, HIV DNA can remain latent for long periods, replicating only as the host cell DNA replicates. However, sooner or later, HIV begins to replicate, and progeny viruses are produced and released from the cell.
Symptoms of HIV/AIDS
Ongoing HIV infection results in a progressive decline in CD4 cell numbers. In a healthy human, CD4 cells constitute about 70% of the total T cell pool. In those with HIV/AIDS, CD4 numbers steadily decrease, and by the time opportunistic infections begin to appear, CD4 cells are all but absent (Figure 31.45). The progression of untreated HIV infection to AIDS follows a typical pattern. First, there is an intense immune response to HIV, and HIV numbers drop. But eventually, the immune response is overwhelmed, and HIV levels slowly increase while CD4 T cells slowly decrease. When T cell numbers have dropped below about 200/mm3 of blood, infections by opportunistic pathogens can occur (Figure 31.45).
Figure 31.45 Decline of CD4 T lymphocytes and progress of HIV infection.

During the typical progression of untreated AIDS, there is a gradual loss in the number and functional ability of the CD4 T cells, while the viral load, measured as HIV-specific RNA copies per milliliter of blood, gradually increases after an initial decline.
Opportunistic infections caused by normally controllable protists, fungi, bacteria, and viruses occur with high prevalence in those with HIV/AIDS and are typically the actual cause of death (Figure 31.46). The most common opportunistic disease in HIV/AIDS patients is pneumonia caused by the fungus Pneumocystis jirovecii (Figure 31.46d), but infections by various molds, yeasts, protists, and bacteria are also seen (Figure 31.46). Bacterial infections are less common than those of eukaryotic pathogens, but when they occur, they are frequently of strongly antibiotic-resistant bacteria, such as multiple-drug-resistant Mycobacterium tuberculosis.
Figure 31.46 Opportunistic pathogens associated with HIV/AIDS.

(a) Candida albicans, from heart tissue of patient with systemic Candida infection. (b) Cryptococcus neoformans, from lung tissue of an AIDS patient. (c) Histoplasma capsulatum, showing reproductive structures called macroconidia. (d) Pneumocystis jirovecii, from lungs of an immune-compromised patient. (e) Cryptosporidium sp. from small intestine of a patient with cryptosporidiosis. (f) Toxoplasma gondii, from heart tissue of patient with toxoplasmosis. (g) Mycobacterium spp. infection of the small bowel (acid-fast stain). Candida, Cryptococcus, Histoplasma and Pneumocystis are fungi; Cryptosporidium and Toxoplasma are protists; Mycobacterium is a species of Bacteria. Coverage of many of these fungal and parasitic diseases can be found in Chapter 34.
Eukaryotic opportunistic pathogens are difficult to treat in general because many of the drugs used to treat infections from fungi and protists have significant negative side effects on the host, which of course is also a eukaryote. A cancer frequently seen in HIV/AIDS patients is Kaposi’s sarcoma, a cancer of the cells lining the blood vessels and characterized by purple splotches on the skin, especially in the extremities (Figure 31.47). Kaposi’s sarcoma is caused by coinfection of HIV and human herpesvirus 8 (HHV-8) and is rarely seen outside of HIV/AIDS patients.
Figure 31.47 Kaposi’s sarcoma.

Lesions are shown as they appear on (a) the heel and lateral foot, and (b) the distal leg and ankle.
Diagnosing HIV/AIDS
HIV infection is typically diagnosed by identifying antibodies to the pathogen in a patient blood sample. An enzyme immunoassay (EIA, Figure 29.20) is used for HIV screening purposes, typically for screening done on a large scale, such as with donated blood. A positive HIV EIA must be confirmed by an HIV immunoblot (Western blot, Figure 29.22) or by immunofluorescence (Section 29.6) to rule out the possibility of a false-positive screening test. Rapid and inexpensive HIV tests are also available for preliminary screening of blood in clinics. One test requires only a single drop of patient blood and detects the gp41 HIV surface antigen (Figure 31.44) by producing a visible agglutination reaction. A second uses saliva as a source of anti-HIV antibodies and yields a colored product. In general, however, these rapid tests are not as sensitive or specific as the standard HIV EIA and thus positive tests should be confirmed by more sensitive and specific tests. Unfortunately, no matter how sensitive or specific, none of the antibody tests will detect those who have recently acquired the virus and are infectious but have not yet made a detectable antibody response to HIV, which may require a period of 6 weeks or more following infection.
Mastering Microbiology
Art Activity: Figure 31.45 Decline of CD4 T lymphocytes and progress of HIV infection
Diagnostic procedures also are available that directly measure the number of HIV virions in a blood sample. These tests use a virus-specific reverse transcription–polymerase chain reaction assay (RT-PCR, Sections 12.1 and 29.8). RT-PCR estimates the number of HIV virions present in the blood, called the viral load (Figure 31.48). The RT-PCR test for HIV load is not routinely used to screen for HIV because it is costly and technically demanding. However, after an initial diagnosis, the test is often used to monitor progression of an HIV infection (Figure 31.48) and the effectiveness of chemotherapy.
Figure 31.48 Monitoring of HIV load.

(a) Procedure for detecting HIV by reverse transcription–polymerase chain reaction (RT-PCR) techniques. (b) Time course for HIV infection as monitored by HIV load and CD4 T cell counts. In the upper panel, a viral load greater than 104 copies/ml correlates with below normal CD4 cell numbers (normal=600−1000/mm3), indicating a poor prognosis and early death of the patient. In the lower panel, a viral load less than 104 copies/ml correlates with normal CD4 cell numbers, indicating a good prognosis and extended survival of the patient. Data are adapted from the CDC, Atlanta, Georgia, USA.
Treatment of HIV/AIDS
The prognosis for an untreated HIV-infected individual is poor, as opportunistic pathogens or malignancies (Figures 31.46 and 31.47) eventually kill virtually all infected persons. Long-term studies indicate that the average person infected with HIV progresses through several stages of decreasing immune function, with CD4 cells dropping from a normal range of 600−1000/mm3 of blood to near zero over a period of 5–7 years (Figure 31.45). Although the rate of decline varies from one HIV-infected individual to another, it is rare for an HIV-positive individual to live for more than 10 years without anti-HIV drug therapy (see MicrobiologyNow in the Chapter 27 opener for exceptions).
Several drugs have been developed that delay the progression of HIV/AIDS and significantly prolong the life of those infected with HIV. Therapy is aimed at reducing the viral load of HIV-infected individuals to below detectable levels. The strategy to accomplish this is called highly active anti-retroviral therapy (HAART) and is carried out by administering at least three anti-retroviral drugs at once to inhibit the replication of HIV and prevent the development of drug-resistant strains. Multiple drug therapy, however, is not a cure for HIV infection. In individuals who have no detectable viral load after drug treatment, a significant viral load returns if therapy is interrupted or discontinued, or if multiple drug resistance develops.
Effective anti-HIV drugs fall into four categories, including two classes of reverse transcriptase inhibitors, various protease inhibitors, fusion inhibitors, and integrase inhibitors. Reverse transcriptase is the enzyme that converts the single-stranded RNA genome of HIV into cDNA and then double-stranded DNA and is essential for viral replication (Sections 5.7 and 11.11). Cells lack reverse transcriptase, and thus reverse transcriptase inhibitors are virus-specific. Azidothymidine (AZT), also called zidovudine, closely resembles the nucleoside thymidine but lacks the correct attachment site for the next base in a replicating nucleotide chain, resulting in termination of the growing DNA chain. AZT is thus a nucleoside reverse transcriptase inhibitor (Figure 31.49a). Nonnucleoside reverse transcriptase inhibitors, such as nevirapine (Figure 31.49b), inhibit the activity of reverse transcriptase in a different way by interacting with the protein and altering the conformation of the catalytic site.
Figure 31.49 HIV/AIDS chemotherapeutic drugs.

(a) Azidothymidine (AZT), also called zidovudine, a nucleoside reverse transcriptase inhibitor. This nucleoside analog is missing the –OH group on the 3'-carbon, causing nucleotide chain elongation to terminate when the analog is incorporated, inhibiting virus replication. (b) Nevirapine, a nonnucleoside reverse transcriptase inhibitor, binds directly to the catalytic site of HIV reverse transcriptase, also inhibiting elongation of the nucleotide chain.
Other anti-HIV drugs include the protease inhibitors, such as saquinavir (Figure 28.20b). These are peptide analogs that bind to the active site of the processing enzyme, HIV protease, thus inhibiting the processing required to activate retroviral polypeptides; this effectively inhibits viral maturation. Fusion inhibitors include enfuvirtide, a synthetic peptide that functions by binding to the gp41 protein on HIV capsids (Figure 31.44); this stops fusion of the viral envelope and the CD4 cell cytoplasmic membrane. Finally, there are the integrase inhibitors, such as elvitegravir and raltegravir. These drugs target HIV integrase, the protein that integrates the HIV genome into host cell DNA. The interference with integration of viral DNA into the host cell genome interrupts the HIV replication cycle.
All anti-HIV drugs rapidly decrease the viral load when given to HIV-infected individuals, but drug-resistant strains of HIV arise quickly if only a single drug is administered. A typical HAART protocol for treatment of an established HIV infection includes at least one protease or nonnucleoside reverse transcriptase inhibitor plus a combination of two nucleoside reverse transcriptase inhibitors. A resistant virus would, therefore, have to develop resistance to three drugs simultaneously, an unlikely event. A patient receiving this combination therapy is then monitored to track changes in viral load (Figures 31.45 and 31.48). An effective HAART protocol reduces viral load to nondetectable levels within several days. Drug therapy is then continued and the patient monitored for viral load indefinitely. If the viral load again reaches detectable limits, the drug cocktail is changed because an increase in viral load indicates the emergence of drug-resistant HIV.
In addition to drug resistance, some HAART protocols must be modified because of host toxicity. In many cases, nucleoside analogs are not well tolerated by patients, presumably because they interfere with host functions such as cell division. In general, the nonnucleoside reverse transcriptase inhibitors and the protease inhibitors are better tolerated because they target virus-specific functions. However, drug resistance and host toxicity are major problems in all forms of HIV therapy. Thus, new chemotherapeutic agents and drug protocols are constantly being developed and tailored to the needs of individual patients.
HIV/AIDS Prevention
Although a number of experimental vaccines are in development, several of which are currently undergoing clinical trials, no HIV vaccine has been approved for clinical use. Public education about how HIV/AIDS is transmitted, sexual abstinence, and avoidance of high-risk behavior remain the best strategies to prevent HIV/AIDS. HIV spread is linked to promiscuous sexual activities and other activities that involve exchange of body fluids, which include not only men who have sex with men, but also prostitution and intravenous drug use where needles are shared. In some countries, the fastest growing mode of HIV transmission is actually between promiscuous heterosexual partners. Effective prevention of HIV transmission therefore requires avoiding these high-risk behaviors, using condoms whenever the health of a sex partner is in doubt, and, for anyone who has engaged in high-risk behavior, undergoing an HIV blood test.
Check Your Understanding
Review the definition of HIV/AIDS. Which symptoms of HIV/AIDS are shared by all HIV/AIDS patients?
What does the enzyme reverse transcriptase do, and why is it a good target for anti-HIV drugs?
Chapter Review
Go to Mastering Microbiology for videos, animations, practice tests, and more.
I Airborne Bacterial Diseases
31.1 Bacterial and viral respiratory pathogens are transmitted in air. Most respiratory pathogens are transferred from person to person via respiratory aerosols generated by coughing, sneezing, talking, or breathing, or by direct or fomite contact. Respiratory pathogens infect either the upper or lower respiratory tracts and sometimes both.
Q Why do gram-positive bacteria cause respiratory diseases more frequently than gram-negative bacteria?
31.2 Streptococcal diseases include strep throat and pneumococcal pneumonia. Streptococcus pyogenes infections may progress into serious conditions such as scarlet and rheumatic fevers, and pneumococcal pneumonia can have high mortality. Both pathogens can be cultured, and both are treatable with antimicrobial drugs, including penicillin.
Q What are the typical symptoms of a streptococcal respiratory infection? Why should streptococcal infections be treated promptly?
31.3 Diphtheria is an acute respiratory disease caused by Corynebacterium diphtheriae. Early childhood immunization is effective for preventing this very serious respiratory disease. Whooping cough is an endemic disease caused by Bordetella pertussis. Immunization of children, adolescents, and adults can control its propagation and spread.
Q Describe the causal agents and the symptoms of diphtheria and pertussis. Why has diphtheria incidence declined in the United States, while pertussis incidence is higher than a decade ago?
31.4 Tuberculosis is one of the most prevalent and dangerous infectious diseases in the world. Its incidence is increasing in developed countries in part because of the emergence of drug-resistant strains of Mycobacterium tuberculosis. The pathology of tuberculosis and other mycobacterial syndromes such as Hansen’s disease (leprosy) is influenced by the cell-mediated immune response.
**Q Describe the process of infection by Mycobacterium tuberculosis. Does infection always lead to active tuberculosis? Why or why not? How is exposure to M. tuberculosis detected in humans?**
31.5 Neisseria meningitidis is a common cause of meningococcemia and meningitis in young adults and occasionally occurs in epidemics in enclosed populations. Bacterial meningitis and meningococcemia can have high mortality rates, and treatment and prevention strategies including vaccines are available.
Q Describe the symptoms of meningococcemia and meningitis. How are these diseases treated? What is the prognosis for each?
II Airborne Viral Diseases
31.6 Viral respiratory diseases are highly infectious and may cause serious health problems, although most are controllable and not life-threatening. The measles/mumps/rubella (MMR) vaccine is highly effective in controlling these diseases.
Q Compare and contrast measles, mumps, and rubella. Include a description of the pathogen, major symptoms encountered, and any potential consequences of these infections. Why is it important that women be vaccinated against rubella before puberty?
31.7 Colds are the most common infectious viral diseases. Usually caused by a rhinovirus, colds are generally mild and self-limiting diseases; over-the-counter “cold drugs” may help to moderate symptoms but are not a cure. Each infection induces specific, protective immunity, but the large number of cold viruses precludes complete protective immunity or vaccines.
Q Why are colds such common respiratory diseases, and why are vaccines not used to prevent colds?
31.8 Influenza is caused by an RNA virus that contains a segmented genome and is easily transmitted by the airborne route. Influenza outbreaks occur annually as a result of the plasticity of the influenza genome. Antigenic drift varies the nature of the viral envelope of influenza viruses in minor ways, causing influenza seasonal epidemics, while antigenic shift varies the virus in major ways and can trigger periodic influenza pandemics. Surveillance and immunization are used to control influenza.
Q Why is influenza such a common respiratory disease? How are annual influenza vaccines developed?
III Direct-Contact Bacterial and Viral Diseases
31.9 Staphylococci are usually benign inhabitants of the upper respiratory tract and skin, but several serious diseases can result from pyogenic infection or from the activity of staphylococcal superantigen exotoxins. Antibiotic resistance is common, even in community-acquired infections. MRSA strains of Staphylococcus aureus can be very difficult to treat and cause significant tissue damage.
Q Distinguish between pathogenic staphylococci and those that are part of the normal microbiota.
31.10 Helicobacter pylori infection is the common cause of gastric ulcers. As an infectious disease, gastric ulcers are best treated with antibiotics to promote a permanent cure.
**Q Describe the evidence linking Helicobacter pylori to gastric ulcers. How can these ulcers be cured?**
31.11 Viral hepatitis can result in acute liver disease, which may be followed by chronic liver disease (cirrhosis). Hepatitis B and C viruses in particular are transmitted by direct contact and can cause chronic infections leading to liver cancer. Vaccines are available for hepatitis viruses A and B. Viral hepatitis is still a major public health problem because of the high infectivity of the viruses and the lack of effective treatments.
Q Describe the major hepatitis viruses. How are they related to one another? How is each spread?
31.12 Ebola hemorrhagic fever is a deadly viral disease spread by direct contact through the skin or from contaminated body fluids. Mortality rates from Ebola are near the highest of all diseases. Treatment is primarily supportive of symptoms, but vaccine trials have shown that effective vaccination protocols are possible.
Q The Ebola virus cannot depend on the host to synthesize its genome; why not?
IV Sexually Transmitted Infections
31.13 Gonorrhea, syphilis, and chlamydial infections caused by Neisseria gonorrhoeae, Treponema pallidum, and Chlamydia trachomatis, respectively, are sexually transmitted infections (STIs) with potential serious consequences if infections are not treated. In the United States, the incidence of all three of these STIs has increased in recent years, with chlamydial infections being the most prevalent of bacterial STIs. The tropical disease yaws is not an STI but is caused by a subspecies of Treponema pallidum closely related to the syphilitic spirochete.
Q Why did the incidence of gonorrhea rise dramatically in the mid-1960s, while the incidence of syphilis actually decreased at the same time?
31.14 Herpes simplex viruses cause incurable infections transmitted by oral or genital contact with herpes simplex 1 or herpes simplex 2, respectively. Human papillomaviruses cause widespread STIs that may lead to cervical and other cancers, but effective HPV vaccines are available.
Q Describe the viruses that cause genital herpes and genital warts. In each case, is a preventive vaccine available? Is treatment of these STIs possible, and if so, is it an effective cure? Why or why not?
31.15 HIV is a retrovirus that destroys the immune system, leading to AIDS, and opportunistic pathogens eventually kill the host. There is no effective cure or vaccine for HIV infection, although antiviral drugs may slow or stop the progress of AIDS. Preventing HIV infection requires education and avoidance of high-risk behaviors involving exchange of body fluids.
Q Describe how human immunodeficiency virus (HIV) effectively shuts down both antibody-mediated and cell-mediated immunity. What is HAART therapy?
Application Questions
Why is it that you get a cold or two each year but if you have had a case of measles, it was a one-time occurrence?
Your college roommate goes home for the weekend, becomes extremely ill, and is diagnosed with bacterial meningitis at a local hospital. Because he was away, university officials are not aware of his illness. What should you do to protect yourself against meningitis? Should you notify university health officials?
Contrast an HIV infection with an infection by any other viral pathogen considered in this chapter, regardless of mode of transmission. Why do untreated cases of HIV infection almost always lead to death whereas untreated cases of chicken pox, influenza, or even hepatitis typically do not?
Discuss the molecular biology of antigenic shift in influenza viruses and comment on the immunological consequences for the host. Why has antigenic shift prevented the production of a single universally effective vaccine for influenza control? Next, compare antigenic shift to antigenic drift. Which causes the greatest antigenic change? Which creates the biggest problems for vaccine developers? Which can lead to pandemic influenza, and why?
Chapter Glossary
a minor change in influenza virus antigens due to gene mutation Antigenic shift
a major change in influenza virus antigen due to gene reassortment between different strains Cirrhosis
breakdown of normal liver architecture, resulting in fibrosis and compromised liver function Congenital syphilis
syphilis contracted by an infant from its mother during pregnancy Fusion inhibitor
a synthetic polypeptide that binds to viral glycoproteins, inhibiting fusion of viral and host cell membranes Hepatitis
liver inflammation, commonly caused by an infectious agent Human papillomavirus (HPV)
a sexually transmitted virus that causes genital warts, cervical neoplasia, and cancer Integrase inhibitor
a drug that interrupts the HIV replication cycle by interfering with integrase, the HIV protein that catalyzes the integration of viral dsDNA into host cell DNA Meningitis
inflammation of the meninges (brain tissue), sometimes caused by Neisseria meningitidis and characterized by sudden onset of headache, vomiting, and stiff neck, often progressing to coma within hours Meningococcemia
a rapidly progressing severe disease caused by Neisseria meningitidis and characterized by septicemia, intravascular coagulation, and shock Nonnucleoside reverse transcriptase inhibitor
a nonnucleoside compound that inhibits the action of retroviral reverse transcriptase by binding directly to the catalytic site Nucleoside reverse transcriptase inhibitor
a nucleoside analog compound that inhibits the action of retroviral reverse transcriptase by competing with nucleosides Opportunistic pathogen
an organism that causes disease only in the absence of normal host resistance Pertussis (whooping cough)
a disease caused by a respiratory tract infection with Bordetella pertussis, characterized by a deep, persistent cough Protease inhibitor
a compound that inhibits the action of viral protease by binding directly to the catalytic site, preventing viral protein processing Rheumatic fever
an inflammatory autoimmune disease triggered by an immune response to infection by Streptococcus pyogenes Scarlet fever
the characteristic reddish rash with fever and sore throat resulting from an exotoxin produced by Streptococcus pyogenes Sexually transmitted infection (STI)
an infection that is usually transmitted by sexual contact Toxic shock syndrome (TSS)
the acute systemic shock resulting from a host response to an exotoxin produced by Staphylococcus aureus Tuberculin test
a skin test for previous infection with Mycobacterium tuberculosis Viral load
a quantitative assessment of the amount of virus in a host organism, usually in the blood
32 Vectorborne and Soilborne Bacterial and Viral Diseases
32 Vectorborne and Soilborne Bacterial and Viral Diseases
## Chapter 32 Vectorborne and Soilborne Bacterial and Viral Diseases
II Arthropod-Transmitted Bacterial and Viral Diseases
The Historical Emergence of an Ancient and Deadly Pathogen
Although a handful of other diseases throughout history have claimed more human lives—namely smallpox, measles, and perhaps influenza—no other infectious disease has elicited more fear and dread than plague.
Causing an estimated 75 million deaths, the “Black Death,” as it came to be called during devastating European outbreaks in the 14th century, is indeed a prolific killer. As described in this chapter, plague is accompanied by a particularly grim suite of symptoms caused by the gram-negative bacterium Yersinia pestis (photo, cells of Y. pestis [yellow] embedded in a stringy matrix on spines [purple] that line the digestive tract of the rat flea, the vector for this pathogen). As the name Y. pestis implies, plague is a classic example of a pestilence that can quickly attain epidemic proportions, and often has. But what triggers the emergence of deadly pathogens like Y. pestis?
Recent evidence suggests that, under certain conditions, highly virulent pathogens can emerge over a relatively short period of time. In the case of plague, this emergence was closely linked to the appearance of large Eurasian farming settlements of up to 20,000 inhabitants about 6000 years ago. By combining archaeological evidence with molecular analyses of DNA extracted from ancient human remains, researchers investigating the decline of Neolithic European populations discovered that multiple lineages of Y. pestis—some now extinct—may have been largely responsible, triggering epidemics more ancient than any previously known. Newly established trade routes (made possible by large-animal domestication, metallurgy, and wheeled transport) connecting densely populated, unsanitary habitations likely created favorable conditions for the transmission of Y. pestis, resulting in the sudden collapse of many of the earliest agricultural settlements in Europe.
Studies of this nature reveal just how quickly pathogens can emerge and shape human activities, as observed in recent years with the Ebola and Zika viruses.
Source: Rascovan, N., et al. 2018. Emergence and spread of basal lineages of Yersinia pestis during the Neolithic decline. Cell 176: 1. doi:10.1016/j.cell.2018.11.005.
In this chapter we focus on pathogenic bacteria and viruses transmitted to humans by animals, arthropods, or soil. Animal-transmitted pathogens have their origins in nonhuman vertebrates, and these infected animal populations can transmit infections to humans. Some arthropods are disease vectors, spreading pathogens to new hosts from a bite. Soilborne pathogens are transmitted to humans through either direct contact with soil or contact with contaminated animal fur or hides. A few of the diseases we will explore in this chapter produce only mild symptoms and are typically self-limiting, but most are highly dangerous with life-threatening symptoms and high mortality rates. These include such dreaded diseases as rabies, hantavirus syndromes, yellow fever, and plague.
Table 32.1 summarizes several of the vectorborne and soilborne diseases we will encounter in this chapter and includes the pathogen responsible for each and its mode of transmission.
Table 32.1 Viral and bacterial pathogens of selected vector- and soilborne diseases

aTransmission of these species is typically via endospores found in soil or on soil-contaminated surfaces; in the case of anthrax, inhalation of airborne endospores may occur, leading to pulmonary disease (Section 30.9).
Mastering Microbiology
Art Activity: Figure 32.1 Rabies cases in wild and domestic animals in the United States
I Animal-Transmitted Viral Diseases
Although not as prevalent as arthropod-borne viruses, animal-transmitted viruses, including rabies virus and hantavirus, are some of the most lethal pathogens known. Despite vaccines of high efficacy for use in both animals and humans, rabies alone kills tens of thousands of people every year worldwide.
Some diseases are transmitted from animals to humans. A zoonosis is an animal disease transmissible to humans, generally by direct contact, aerosols, or bites (Table 32.1). Immunization and veterinary care can control many infectious diseases in domesticated animals, reducing the transfer of zoonotic pathogens to humans. However, wild animals neither receive veterinary care nor are they immunized, making them a source of potential zoonoses. Diseases in animals may be enzootic, present endemically in certain populations, or epizootic, with incidence reaching epidemic proportions. In the first part of the chapter we focus on two typically enzootic viral diseases, rabies and hantavirus syndromes, both of which can be transmitted to humans.
32.1 Rabies Virus and Rabies
Rabies occurs in wild animals, and the major enzootic reservoirs of rabies virus in the United States are raccoons, skunks, coyotes, foxes, and bats. A small number of rabies cases also occur annually in domestic animals (Figure 32.1).
Figure 32.1 Rabies cases in wild and domestic animals in the United States.

(a) Incidence of rabies by year. Human cases are fewer than five per year. (b) Major vectors of rabies virus. In some areas, for example, southwest Texas, both skunks and foxes are the major vectors (shown by hatched lines). Over 90% of all reported rabies cases occur in wild animals. However, actual numbers are probably significantly higher than shown in part a because of undiagnosed cases and undiscovered rabid animal carcasses. Bats (not shown) are reservoirs of rabies virus throughout the continental United States and in Alaska. Data are from the Centers for Disease Control and Prevention, Atlanta, Georgia, USA.
Symptoms and Pathology of Rabies
Rabies is caused by a rhabdovirus, a single-stranded minus-sense RNA virus (Section 11.9) that infects cells of the central nervous system in most endothermic (warm-blooded) animals, almost invariably leading to death once symptoms have developed. The virus (Figure 32.2a) enters the body from virus-contaminated saliva through a wound from a bite or through contamination of mucous membranes. Rabies virus multiplies at the site of inoculation and travels to the central nervous system. The incubation period before the onset of symptoms is highly variable and depends on the host; the size, location, and depth of the inoculating wound; and the titer of rabies virions transmitted in the bite. In dogs, the incubation period for rabies is less than 2 weeks. By contrast, in humans, 9 months or more may pass before rabies symptoms become apparent in an infected individual.
Figure 32.2 Rabies virus.

(a) The bullet-shaped rabies virions (arrows) shown in this transmission electron micrograph of a tissue section from a rabid animal are about 75×180 nm. (b) Pathology of rabies in humans. In brain tissue, rabies virus causes characteristic cytoplasmic inclusions called Negri bodies (arrows in photomicrograph), which contain rabies virus antigens. Negri bodies are about 2–10 μm in diameter.
Rabies virus proliferates in the brain, especially in the thalamus and hypothalamus. Infection leads to fever, excitation, dilation of the pupils, excessive salivation, and anxiety. In advanced rabies, swallowing triggers uncontrollable spasms of the throat muscles when victims try to drink, ultimately leading to a fear of even the sight of water, a condition called hydrophobia (an early name for rabies). Death of rabies victims eventually results from respiratory paralysis. In humans, an untreated rabies infection in which symptoms have begun is almost always fatal. Fortunately for both domestic animals and humans, an effective rabies vaccine exists, and this keeps the incidence of rabies low in domestic animals (Figure 32.1a) and a rarity in humans in developed countries.
Diagnosis, Treatment, and Prevention of Rabies
Rabies is diagnosed in the laboratory by examining tissue samples for the virus. Fluorescent antibodies that bind to rabies virus in brain tissues are used to confirm a case of rabies in a postmortem examination. Infected nerve cells stained for light microscopy also show viral inclusions called Negri bodies in their cytoplasm, and these characteristic structures confirm rabies virus infection as well (Figure 32.2b).
Because rabies is such a serious disease, firm guidelines for treating possible human exposure to rabies have been established, and the details can be found in the rabies section of the World Health Organization website (http://www.WHO.int). In summary, the guidelines state that if a wild or stray animal is suspected of being rabid, it should be immediately examined for evidence of the rabies virus. If a domestic animal, generally a dog, cat, or ferret, bites a human, especially if the bite is unprovoked, the animal should be held in quarantine for 10 days to check for signs of rabies. If the animal exhibits rabies symptoms, or if a definitive diagnosis of its illness cannot be made after 10 days (or if the animal could not be retained for examination), the human should be passively immunized with rabies immune globulin (purified human antibodies to rabies virus) injected at both the site of the bite and intramuscularly. The patient should also be actively immunized with a rabies virus vaccine. Because of the very slow progression of rabies in humans, this combination of passive and active immune therapy (Section 27.2) is nearly 100% effective, stopping the onset of the disease.
Rabies is prevented largely through immunization. An inactivated rabies vaccine is used in the United States for both humans and domestic animals. Prophylactic rabies immunization is practiced for individuals at high risk, such as veterinarians, animal control personnel, animal researchers, and individuals who work in rabies research or rabies vaccine production laboratories. The rabies problem is primarily with wild animals (Figure 32.1), where traditional means of vaccination are impossible. However, experimental trials with an oral rabies vaccine administered in food “baits” have reduced the incidence and spread of rabies in limited geographic areas. If herd immunity (Section 30.2) could be established in some of the key carriers of rabies (Figure 32.1b), it might be possible to reduce incidence of the disease dramatically. Some regions, such as Hawaii and Great Britain, are rabies-free, and any animal imported into these areas is subject to temporary quarantine to ensure the animal is healthy.
Although rabies is vaccine-preventable, nearly 60,000 people per year die from rabies worldwide, primarily in developing countries in Africa and Asia where rabies is enzootic in domestic animals because of inadequate vaccination practices. Worldwide, nearly 14 million people receive prophylactic treatment for rabies after exposure annually, and in the United States, over 20,000 individuals receive such treatment. Fewer than five cases of human rabies are reported in the United States each year, nearly always the result of bites from wild animals, most frequently from bats. Because domestic animals often have exposure to wild animals, dogs and cats are routinely vaccinated against rabies beginning at 3 months of age. Large farm animals, especially horses, are often immunized against rabies as well. One other rare but possible mode of rabies transmission is from organ and tissue transplants. In 2013, a rabies death in the U.S. was linked to a transplanted kidney received from a donor who died from rabies that was misdiagnosed as severe gastroenteritis. Past cases of rabies transmission in a cornea and other transplants have also been documented where the donor had yet to show signs of clinical rabies.
Check Your Understanding
What is the procedure for treating a human bitten by an animal if the animal cannot be found?
What major advantage does an oral vaccine have over a parenteral (injected) vaccine for rabies control in wild animals?
32.2 Hantavirus and Hantavirus Syndromes
Hantaviruses cause two severe, emerging diseases, hantavirus pulmonary syndrome (HPS), an acute respiratory and cardiac disease, and hemorrhagic fever with renal syndrome (HFRS), an acute disease characterized by shock and kidney failure. Both diseases are caused by hantaviruses transmitted from infected rodents. Hantavirus is named for Hantaan, Korea, the site of a hemorrhagic fever outbreak where the virus was first recognized as a human pathogen.
Symptoms and Pathology of Hantavirus Syndromes
Similar to influenza viruses, hantaviruses are enveloped viruses (Figure 32.3a) having single-stranded minus-sense RNA genomes arranged in segments (Section 11.9). However, hantaviruses are genetically and functionally more closely related to other hemorrhagic fever viruses, such as Lassa fever virus and Oropouche fever virus (Table 32.1). Hantaviruses asymptomatically infect an estimated 10–15% of rodents, including mice, rats, lemmings, and voles. The virus is transmitted from these reservoirs to humans by inhalation of virus-contaminated rodent excreta. Humans are accidental hosts and are infected only when they come into contact with rodents, their waste, or their saliva.
Figure 32.3 Hantavirus.

(a) A transmission electron micrograph of the Sin Nombre hantavirus. The arrow indicates one of several virions that are about 100 nm in diameter. (b) Immunofluorescent staining of Andes hantavirus antigens in alveolar macrophages. Each granular dark blue–stained area indicates cellular infection of an individual macrophage that contains many hantavirus virions (each cell is about 15 μm in diameter).
HPS is characterized by a sudden onset of fever, nausea, muscle pain, a reduction in the number of blood platelets along with an increase in the number of circulating leukocytes, and hemorrhaging. Death (if it occurs) takes several days, and it is usually a result of systemic shock and cardiac complications precipitated by leakage of fluid into the lungs, causing suffocation and heart failure. These symptoms are typical of hantaviruses, but other symptoms such as kidney failure are common, depending on the strain of virus causing the disease. HFRS is characterized by intense headache, back and abdominal pain, renal dysfunction, and various hemorrhagic complications. HFRS strains are most prevalent in hantavirus outbreaks in Eurasia, whereas HPS strains are more prevalent in the Americas. At nearly 40%, the mortality rate for HPS strains is significantly higher than for HFRS strains (1–15%).
Hantaviruses can be cultured in the laboratory, but because of the danger involved, they must be handled with precautions for biosafety level 4 (BSL-4; Section 29.1). In the world of infectious diseases, hantavirus, Ebola, and other BSL-4 viral pathogens are considered “the worst of the worst” and are thus handled in the United States by the Viral Special Pathogens Branch of the Centers for Disease Control and Prevention in Atlanta (Georgia, USA).
Epidemiology, Diagnosis, and Prevention of Hantavirus Syndromes
A significant HPS outbreak in the United States occurred near the Four Corners region of Arizona, Colorado, New Mexico, and Utah in 1993. The outbreak resulted from an enlarged population of deer mice in the spring of 1993. The previous winter was mild and was followed by abundant spring rains, triggering unusually high food levels for the mice. The HPS outbreak caused 27 deaths among 48 infected people (56% mortality), illustrating the potential danger of outbreaks due to pathogens that can be directly transmitted from animal reservoirs. In total from 1993 to January 2017, there were 728 cases of HPS in the United States, with 262 deaths (36% mortality), mostly in western states. On a global basis, it is estimated that 200,000 infections occur annually, chiefly in China, Korea, and Russia, but mortality rates are typically low.
Hantavirus syndromes can be diagnosed using immunological techniques that identify anti-hantavirus antibodies in a blood sample. These include immunoassays (Figure 32.3b and Section 29.5) that detect both exposure to the virus and the strength of the immune response. The presence of the viral RNA genome from circulating virions can also be detected using RT-PCR (Sections 12.1 and 29.8) on patient tissue or blood samples.
There is no virus-specific treatment or vaccine for hantavirus diseases. Treatment amounts to isolation, rest, rehydration, and alleviation of other symptoms. Hantavirus infection can be prevented by avoiding rodent contact and rodent habitat. Destruction of mouse habitat, restricting food supplies (for example, keeping human food in sealed containers), and aggressive rodent extermination measures are the only effective controls; animal surveys have shown that areas that have experienced a hantavirus outbreak have a high proportion of mice that carry the virus.
Check Your Understanding
Why might hantaviruses be considered a serious public health threat in the United States?
Describe the spread of hantaviruses to humans. What are some effective measures for preventing infection by hantaviruses?
II: Arthropod-Transmitted Bacterial and Viral Diseases
II: Arthropod-Transmitted Bacterial and Viral Diseases
II Arthropod-Transmitted Bacterial and Viral Diseases
Arthropods such as mosquitoes and ticks are reservoirs for a diversity of pathogenic bacteria and viruses that infect humans, and these microbes are responsible for considerable human morbidity and mortality anywhere these animal vectors exist.
Pathogens can be spread to new hosts from the bite of an infected arthropod. In the bacterial and viral diseases we consider here—the rickettsial illnesses; yellow and dengue fevers; Lyme, Chikungunya, and Zika virus diseases; and plague—humans are only accidental hosts for the pathogen. The reservoir of the pathogen is the arthropod vector (Table 32.1). Nevertheless, the diseases can be devastating and often fatal.
32.3 Rickettsial Diseases
The rickettsias are small Bacteria that live an obligate intracellular existence and are associated with bloodsucking arthropods such as fleas, lice, or ticks. We discussed the biology of rickettsias in Section 16.1. Of the diseases that rickettsias can cause in humans and other vertebrates, the most important are typhus fever, spotted fever rickettsiosis (Rocky Mountain spotted fever), and ehrlichiosis. Rickettsias have not been cultured in artificial culture media but can be grown in laboratory animals, ticks and lice, mammalian tissue culture cells, and the yolk sac of chick embryos (see Figure 32.6b). In animals, growth takes place primarily in phagocytes, such as macrophages.
Rickettsias are divided into three groups based on the clinical diseases they cause: (1) the typhus group, such as Rickettsia prowazekii; (2) the spotted fever group, such as Rickettsia rickettsii; and (3) the ehrlichiosis group, characterized by Ehrlichia chaffeensis, and we examine the pathobiological features of each of these now.
The Typhus Group: *Rickettsia prowazekii*
Typhus is transmitted from person to person by the common body or head louse (Figure 32.4a), and humans are the only known mammalian host. During World War I, a typhus epidemic spread throughout Eastern Europe and caused almost 3 million deaths. Typhus has historically been a problem among troops in wartime. Because of the unsanitary, cramped conditions characteristic of wartime military operations, infected lice can spread easily among soldiers with devastating results. Up until World War II, typhus caused more military deaths than did combat.
Figure 32.4 Arthropod vectors of rickettsial diseases.

(a) The female body louse, about 3 mm long, can carry Rickettsia prowazekii, the agent that causes typhus. In addition, the body louse can carry Borrelia recurrentis, the agent of relapsing fever, and Bartonella quintana, the agent of trench fever. (b) The American dog tick that carries Rickettsia rickettsii, the causative agent of spotted fever rickettsiosis, is about 5 mm long, but can expand to three times this size when engorged with blood.
Cells of R. prowazekii are introduced through the skin when a puncture caused by a louse bite becomes contaminated with louse feces that contain the rickettsial cells. During an incubation period of 1–3 weeks, the organism multiplies inside cells lining the small blood vessels. Symptoms of typhus, such as fever, headache, and general body weakness, then begin to appear. Several days later, a characteristic rash is observed in the armpits and generally spreads over the body, except for the face, palms of the hands, and soles of the feet. Complications from untreated typhus include damage to the central nervous system, lungs, kidneys, and heart. Epidemic typhus has a mortality rate of as much as 30%. Tetracycline and chloramphenicol are most commonly used to control infections caused by R. prowazekii. Rickettsia typhi, the organism that causes murine (mouse) typhus, is another important pathogen in the typhus group and can also infect humans. A typhus vaccine is available but is typically only administered to those traveling to typhus endemic areas, such as certain parts of Africa and South America.
Mastering Microbiology
Art Activity: Figure 32.5 Spotted fever rickettsiosis (Rocky Mountain spotted fever) in the United States, 2010
The Spotted Fever Group: *Rickettsia rickettsii*
Spotted fever rickettsiosis (SFR), also called Rocky Mountain spotted fever, was first recognized in the western United States about 1900, but it is more prevalent today in the eastern and mid-South region (Figure 32.5). SFR is caused by R. rickettsii and is transmitted to humans by various ticks, most commonly the dog tick (Figure 32.4b) and wood ticks. The incidence of SFR has been increasing steadily for two decades, with reported cases in the United States increasing from just 500 in the year 2000 to over 6000 in 2017. The emergence of SFR is attributed to increased outdoor recreational activities, such as hiking and camping, in tick-infested areas. Fatalities in treated patients occur in less than 1% of those infected. Humans acquire the pathogen from the bite of an infected tick; rickettsial cells are present in the salivary glands of the tick and in the ovaries of female ticks.
Figure 32.5 Spotted fever rickettsiosis (Rocky Mountain spotted fever) in the United States, 2017.

Despite the name, cases of Rocky Mountain spotted fever are currently concentrated in the eastern and mid-South states from Oklahoma to North Carolina.
Cells of R. rickettsii, unlike other rickettsias, grow within the nucleus of the host cell as well as in host cell cytoplasm (**Figure 32.6a,*c***). Following an incubation period of 3–12 days, characteristic symptoms, including fever and a severe headache, occur. A few days later, a systemic rash breaks out (Figure 32.6d) that is distinguished from typhus and viral rashes because it extends over the whole body, even the palms of the hands and soles of the feet. The rash is often accompanied by gastrointestinal complications, such as diarrhea and vomiting. The clinical symptoms of SFR persist for over 2 weeks if the disease is untreated. Tetracycline or chloramphenicol generally promotes a prompt recovery from SFR if administered early in the course of the infection. Mortality in untreated cases of SFR resembles that of typhus, up to 30%. No effective vaccine against SFR is currently available.
Figure 32.6 *Rickettsia rickettsii* and spotted fever rickettsiosis.

(a) Cells of R. rickettsii, growing in the cytoplasm and nucleus of tick hemocytes and (b) in chicken egg yolk sacs; cells are about 0.4 μm in diameter. (c) Transmission electron micrograph of R. rickettsii (arrows) in a granular hemocyte of an infected wood tick. (d) Rash of spotted fever rickettsiosis on the feet. The whole-body rash is indicative of spotted fever rickettsiosis and helps distinguish it from typhus, in which the rash does not cover the whole body.
Ehrlichiosis and Tickborne Anaplasmosis
Ehrlichia and related genera (Section 16.1) are responsible for two emerging tickborne diseases in the United States, human monocytic ehrlichiosis (HME) and human granulocytic anaplasmosis (HGA). The pathogens that cause HME are Ehrlichia chaffeensis and Rickettsia sennetsu, and those that cause HGA are Ehrlichia ewingii and Anaplasma phagocytophilum.
The onset of these clinically indistinguishable rickettsial diseases is characterized by flulike symptoms that can include fever, headache, malaise, changes in liver function, and a reduction in white blood cell numbers. Peripheral blood leukocytes such as monocytes have visible inclusions of rickettsial cells, a diagnostic indicator for the diseases (Figure 32.7a). The symptoms, except for the inclusions, are similar to other rickettsial infections and can range from subclinical to fatal. Long-term complications for progressive untreated cases may include respiratory and renal insufficiency and serious neurological involvement.
Figure 32.7 *Ehrlichia* and *Coxiella*.

(a) Ehrlichia chaffeensis, the causative agent of human monocytic ehrlichiosis (HME). The electron micrograph shows inclusions in a human monocyte that contains large numbers of E. chaffeensis cells. The blue arrows indicate bacteria in each inclusion. The E. chaffeensis cells are about 0.3–0.9 μm in diameter. Mitochondria are indicated by red arrows. (b) Colorized scanning electron micrograph of cells of Coxiella burnetii, the causative agent of Q fever. The Coxiella cells were grown in animal cell culture and are shown inside a lysed host cell. A single C. burnetii cell is about 0.4 μm in diameter.
HGA and HME are spread by ticks of various species, and mammalian reservoirs of the pathogens include deer, some rodents, and humans. In the United States, HGA occurs primarily in the upper Midwest and coastal New England, while HME is concentrated in the lower Midwest and the East Coast. Similar to SFR, the incidence of HME and HGA have steadily risen over the past 20 years, and together, about 6000 cases are reported each year, with cases of HGA predominating. Diagnosis of rickettsial syndromes is not straightforward because the rash observed can be mistaken for other diseases, such as scarlet fever, or even measles or syphilis. Confirmation of a rickettsial disease requires immunological tests, including fluorescent antibodies or immunoassays, or PCR-based analyses that detect pathogen DNA.
Prevention of HGA and HME is best achieved either by avoiding tick habitat or by wearing tick-proof clothing and applying insect repellents containing diethyl-m-toluamide (DEET). It is also good practice to examine yourself carefully for ticks after hiking in tick habitat and to remove any ticks immediately, taking care to remove all tick mouthparts if the tick has already attached. Doxycycline, a tetracycline antibiotic, is the drug of choice for the treatment of HGA and HME. Vaccines are currently unavailable for the prevention of HGA and HME.
Q Fever
Q fever (the Q stands for “query”) is a pneumonia-like infection caused by the intracellular parasite Coxiella burnetii (Figure 32.7b), a bacterium related to the rickettsias (Section 16.1). Although not transmitted to humans by an insect bite, C. burnetii cells are transmitted to animals such as sheep, cattle, and goats by insect bites, and from these reservoirs are transmitted to humans. Domestic animals generally have asymptomatic infections but may shed large quantities of C. burnetii cells in their urine, feces, milk, and other body fluids. Infected animals or contaminated animal products such as wool, meat, and milk are potential sources for human infection. The resulting influenza-like illness can progress to include prolonged fever, headache, chills, chest pains, pneumonia, and endocarditis (inflammation of the inner lining of the heart). In the United States, Q fever is most prevalent in rural states with large farm or ranch animal populations, and about 150 cases have been reported annually in recent years.
As for rickettsial infections, laboratory diagnosis of C. burnetii infection is typically made by immunological tests designed to measure host antibodies to the pathogen. Q fever responds well to tetracycline, and therapy should be started quickly in any suspected case to prevent endocarditis and heart valve damage. C. burnetii is also a potential biological warfare agent (Section 30.9).
Unlike its relatives in the Rickettsia group, the Q fever pathogen C. burnetii can now be grown in pure culture outside a host. This was accomplished by considering both the resources and conditions likely to exist in the intracellular host environment along with a careful analysis of the C. burnetii genome sequence to reveal the metabolic capacities and limitations of this pathogen. One major discovery gleaned from genomic analysis of the C. burnetii complement of cytochromes was the fact that the organism was likely to be microaerophilic (Section 4.16). Indeed, one of the keys to its axenic (pure) culture was to incubate cultures under low oxygen tensions, which is somewhat surprising considering that host cells should be fully oxic.
Check Your Understanding
What are the arthropod vectors and animal hosts for typhus, spotted fever rickettsiosis, ehrlichiosis, and anaplasmosis?
What precautions can be taken to prevent rickettsial infections?
32.4 Lyme Disease and *Borrelia*
Lyme disease is a tickborne disease that affects humans and other animals. Lyme disease was named for Old Lyme, Connecticut, where cases were first recognized, and is currently the most prevalent arthropod-borne disease in the United States. Lyme disease is caused by infection with a spirochete, Borrelia burgdorferi (Figure 32.8; Section 15.17), transmitted by a tick bite. The ticks that carry B. burgdorferi feed on the blood of birds, domesticated animals, various wild animals, and humans. B. burgdorferi is of interest in a nonmedical way, as well, because it is one of only a handful of Bacteria that contain a linear (as opposed to a circular) chromosome (Section 6.2).
Figure 32.8 The Lyme disease spirochete, *Borrelia burgdorferi*.

(a) Fluorescent antibody staining (Section 29.6) of cells of B. burgdorferi from a Lyme disease rash. Two different fluorescent antibodies were used, each specific for a different B. burgdorferi antigen and linked to either an orange or a green fluorescent tag. If both antibodies bind, cells appear yellow. (b) Colorized scanning electron micrograph of cells of B. burgdorferi. A single cell is approximately 0.4 μm in diameter and 5–20 μm long.
Pathology, Diagnosis, and Treatment of Lyme Disease
Cells of B. burgdorferi are transmitted to humans while the tick is obtaining a blood meal (Figure 32.9a). A systemic infection develops, leading to the acute symptoms of Lyme disease: headache, backache, chills, and fatigue. In about 75% of Lyme cases, a concentric circular or “bull’s-eye” rash forms within a week at the site of the tick bite (Figure 32.9b). During this acute stage, Lyme disease is readily treatable with tetracycline or penicillin.
Figure 32.9 Lyme disease infection.

(a) A deer tick (here, blood-engorged) obtaining a blood meal from a human is the route of disease transmission (see Figure 32.10 for photos of deer ticks). The tick is about the size of the head of a pin (about 1 mm in diameter). (b) Characteristic “bull’s-eye” rash of Lyme disease. The rash starts at the site of a tick bite and grows in a concentric circular fashion over a period of several days. A typical rash is 5–8 cm in diameter.
Untreated cases of Lyme disease may progress to a chronic stage weeks to months after the initial tick bite, causing arthritis in about half of those infected. Neurological problems such as palsy, weakness in the limbs, and heart damage can also occur. In untreated cases, cells of B. burgdorferi infecting the central nervous system may lie dormant for long periods before causing additional chronic symptoms, including problems with vision and facial muscle movements, or seizures. Interestingly, the neurological symptoms of chronic Lyme disease mimic those of chronic syphilis, which is caused by a different spirochete, Treponema pallidum (Sections 15.17 and 31.13). Unlike syphilis, however, Lyme disease is not spread person to person.
No toxins or other major virulence factors have been identified in Lyme disease pathogenesis, but the pathogen triggers a strong immune response. Antibodies to B. burgdorferi appear 4–6 weeks after infection and can be detected by various immunological assays. However, because antibodies to B. burgdorferi antigens persist for years after infection, the presence of these antibodies does not necessarily indicate a recent infection. A PCR assay (Sections 12.1 and 29.8) is also in use to detect B. burgdorferi DNA in body fluids and tissues. In practice, however, Lyme disease is typically diagnosed from clinical symptoms and only confirmed later by laboratory assays. If a patient has had recent tick exposure and presents Lyme disease signs and symptoms, such as facial tics, arthritis, or the characteristic Lyme rash (Figure 32.9b), a presumptive diagnosis of Lyme disease is made and antibiotic treatment is initiated.
Treatment of early-stage Lyme disease is usually with doxycycline or amoxicillin for 20 to 30 days. For patients having neurological or cardiac symptoms, the antibiotic ceftriaxone is administered intravenously because this drug crosses the blood–brain barrier and thus can kill spirochetes in the central nervous system.
Epidemiology and Prevention of Lyme Disease
White-footed field mice and other small rodents are the major mammalian reservoir of B. burgdorferi in the northeastern United States, a hotbed of Lyme infection (see Figure 32.11). These animals become infected from bites by the deer tick, Ixodes scapularis (Figure 32.10), although some other ticks can transmit the Lyme spirochete as well. Deer themselves are not B. burgdorferi reservoirs but are major reproductive hosts for the tick. Lyme disease has also been identified in Europe and Asia. In these countries, both the tick vector and the species of Borrelia differ from those in the United States, which shows that Lyme disease has a broad geographic distribution. In all cases, however, Lyme disease is caused by related species of pathogenic Borrelia transmitted to humans by tick vectors.
Figure 32.10 Deer ticks, the major vector of Lyme disease.

Left to right, male and female adult ticks, nymph, and larva forms. The length of an adult female is about 3 mm. Although all forms feed on humans, the female nymphal and adult ticks are principally responsible for transmitting Borrelia burgdorferi.
Deer ticks are typically smaller than many other ticks (Figure 32.9a), making them easy to overlook. Moreover, unlike the case with ticks that carry other tickborne diseases (Figure 32.4b), a high percentage of deer ticks carry B. burgdorferi. Both of these factors—small vector size and high occurrence of the pathogen—undoubtedly contribute to the fact that Lyme is the most commonly reported vectorborne disease in the United States (Figure 32.11). Most cases of Lyme disease in the United States have been reported from the Northeast and upper Midwest—areas of the country where deer and wooded areas are abundant—but cases have been observed throughout North America (Figure 32.11). The incidence of Lyme disease in the United States is significant, with 42,743 confirmed and probable cases reported in 2017.
Figure 32.11 Lyme disease in the United States, 2017.

Each dot represents a confirmed case. Confirmed and probable cases in 2017 totaled nearly 43,000, with about 95% of these localized to 13 states in the upper regions of the Midwest and East Coast. Lyme disease is reported through the National Notifiable Diseases Surveillance System of the Centers for Disease Control and Prevention, Atlanta, Georgia, USA.
As for any tickborne infection, prevention of Lyme disease begins by avoiding contact with the vector. Insect repellents containing DEET or the wearing of snug-fitting clothing is helpful, as is a thorough body exam following walks in tick-infested environments. Lyme disease vaccines are available for domestic animals, but no human Lyme disease vaccine is currently in use.
Check Your Understanding
In the United States, where is Lyme disease most prevalent?
Outline methods for prevention of Borrelia burgdorferi infection.
32.5 Yellow Fever, Dengue Fever, Chikungunya, and Zika
32.5 Yellow Fever, Dengue Fever, Chikungunya, and Zika
32.5 Yellow Fever, Dengue Fever, Chikungunya, and Zika
Several arthropod-transmitted diseases are caused by flaviviruses. These are single-stranded plus-sense RNA viruses (Section 11.8) transmitted by the bite of an infected arthropod. Because of this characteristic mode of transmission, these viruses are also called arboviruses (arthropod-borne viruses).
Many serious human diseases are caused by arboviruses including various types of encephalitis and hemorrhagic fevers. Here we consider two potentially fatal flavivirus diseases common in some tropical and subtropical regions: yellow fever and dengue fever. Some of the symptoms of these diseases are similar, and both viruses are transmitted by the same vector, female mosquitoes of the genus Aedes (Figure 32.12). This insect vector infects nearly half a billion people each year with dangerous viral pathogens, which, in addition to yellow fever and dengue viruses, include Zika and Chikungunya viruses.
Figure 32.12 Yellow fever and dengue fever.

(a) Yellow and dengue fever viruses are both transmitted by the bite of an infected Aedes aegypti mosquito. Transmission electron micrographs of (b) yellow fever virus and (c) dengue fever virus (arrows, in a tissue specimen). Both yellow and dengue fever viruses are about 50 nm in diameter and are plus-sense RNA viruses that replicate by way of polyprotein formation, as in poliovirus (Figure 11.21).
Yellow Fever
Yellow fever is an endemic disease of tropical and subtropical climates, especially in Latin America and Africa. Brazil, Colombia, Venezuela, and parts of Bolivia and Peru, along with most countries in sub-Saharan central Africa, experience the greatest incidence. Yellow fever is absent from the United States except in unvaccinated individuals who contract the disease through travel to an endemic area. Yellow fever virus is related to dengue virus (see later), West Nile virus (Section 32.6), and certain encephalitis viruses. Yellow fever is one of only a handful of infectious diseases for which isolation and quarantine are practiced (Section 30.5). In the case of yellow fever, although the disease is not transmitted person to person, isolation of active cases prevents local mosquitoes from taking a blood meal from the infected individual and transmitting the disease to others.
Following a bite from an infected mosquito, the yellow fever virus replicates in lymph nodes and certain immune system cells and eventually travels to the liver. Once a person is infected, symptoms range anywhere from none to major organ failure and death. Most infected individuals display a mild fever with accompanying chills, a headache and back pains, nausea, and other symptoms that are not diagnostically useful. Presumably these are cases in which the immune system has the infection under control. However, in about one in five yellow fever cases, the disease enters its toxic phase, characterized by jaundice (thus the name yellow fever) and by hemorrhaging from the mouth, eyes, and gastrointestinal tract. This triggers the onset of bouts of bloody vomit, and if bleeding continues, it leads to toxic shock and multiple organ failure. About 20% of cases that reach this stage are fatal. Humans and nonhuman primates are the main reservoirs for the yellow fever virus.
Yellow fever is fully preventable by an effective vaccine. An attenuated yellow fever vaccine was developed in the 1930s (Figure 25.10) and widely used by military and support personnel in tropical battlefields. Historically, the disease has been controlled by a combination of vaccination and elimination of both the vector (mosquito) population by chemical agents and vector breeding grounds by draining swamps and low-lying wetlands in endemic areas.
The yellow fever vaccine is highly recommended for those traveling to endemic areas, and many countries require proof of vaccination for anyone entering their country from a foreign country where yellow fever is endemic. In addition, the World Health Organization (WHO) has initiated a mass vaccination program in Africa. Despite the availability of a vaccine, the WHO estimates that each year nearly 200,000 cases of yellow fever occur, mostly unreported, and that about 30% of all cases are fatal. Other than palliative care, no treatment for yellow fever is available. Once the disease is diagnosed, typically by detecting anti–yellow fever virus antibodies in a blood sample, the patient is isolated and prescribed rest and drugs to control symptoms. Recovery without entering the toxemia stage is due to the immune response.
Dengue Fever
Like yellow fever, dengue (pronounced deng-gay) fever is transmitted by mosquitoes of the genus Aedes (Figure 32.12) and is a disease of tropical and subtropical regions. It is estimated that as much as one-half of the world’s population lives in areas where dengue is endemic, and therefore it is no surprise that it is the most common vectorborne disease in humans. About 100 million cases of dengue fever occur worldwide per year, with concentrations in Mexico, Central and South America, India, Indonesia, and Africa (Figure 30.11).
Dengue begins with a high fever and headache or joint pains and in some patients, severe eye pain and a systemic rash. Most infected individuals show self-improvement within a week and no further symptoms, presumably because of an immune response to the dengue virus. But, as for yellow fever, a dengue infection can take a more severe course of events and proceed to dengue hemorrhagic fever. This condition is characterized by severe symptoms that can include bleeding from the nose and gums, bloody vomit and/or feces, intense abdominal pain, respiratory distress, and a general feeling of malaise. The blood pressure of a dengue patient can drop dramatically during the hemorrhagic fever stage, and a small percentage of these cases are fatal. Treatment for dengue is primarily to relieve symptoms, particularly dehydration from fever and loss of blood and other fluids.
A live recombinant vaccine (Sections 12.8 and 28.3) marketed as Dengvaxia® is available for dengue in high-risk regions. However, because the vaccine has been shown to increase the risk of severe infection in those never before exposed to the virus, its use is restricted only to those that have already had a confirmed case of dengue fever (the same individual can be infected more than once with dengue virus). Because there is currently no point-of-care rapid diagnostic test to confirm prior exposure, use of the vaccine is significantly limited.
Dengue can be controlled by eliminating either the vector or contact with the vector. Extensive chemical spraying for mosquito eradication was widely practiced in urban centers of the southern United States and kept dengue in check in the twentieth century. Now, however, spraying programs are less common and global climate change is moving tropical temperature patterns northward. In response, the Aedes mosquito has become entrenched in southern and central regions of the United States. Besides Aedes aegypti (Figure 32.12a), the Asian tiger mosquito (Aedes albopictus), which is spreading quickly in the United States, also carries the dengue virus. Drainage of small sources of stagnant water, such as those in discarded tires or clogged gutters, removes mosquito breeding grounds and greatly reduces the opportunities for a dengue outbreak. Personal protection from mosquito bites by using effective insect repellents and clothing is also a proven means of preventing infection.
A recent strategy to control mosquito populations (and thus mosquito-borne disease transmission) is to employ the endosymbiotic bacterium Wolbachia (a close relative of Rickettsia and Ehrlichia) to control the reproductive success of the mosquito vector (Section 23.7). Male mosquitoes infected with Wolbachia bacteria produce sperm that express proteins that render uninfected females infertile upon mating. Although not fully understood, the Wolbachia-derived proteins in the sperm activate a molecular switch that prevents mosquito reproduction by inhibiting embryo development. When Wolbachia-infected male mosquitoes are purposely released in areas where dengue is endemic, the incidence of dengue has decreased significantly, presumably because of reductions in the size of the local mosquito population.
The WHO estimates that nearly a half million cases of dengue hemorrhagic fever occur yearly with over 20,000 being fatal. Cases of dengue in the United States are rare, and many of them are imported from endemic areas. Dengue is a prime example of an emerging disease (Section 30.7), as cases were geographically restricted until the mid-twentieth century when global commerce is thought to have transmitted species of the Aedes mosquito beyond their original range.
Zika and Chikungunya Disease
Zika and Chikungunya are both typically mild viral diseases transmitted by the same mosquito vector (Table 32.1). Zika virus disease is characterized by headache, fever, joint pain, and general malaise, and a rash is occasionally seen. The disease is caused by the Zika virus (Figure 32.13a), a relative of the dengue virus. Zika first emerged over 65 years ago in the Zika forest (Uganda), and occasional small outbreaks occurred periodically in west central Africa and Indonesia. Zika appeared in Brazil in 2015, and by 2016, outbreaks of Zika virus disease were reported in the United States, primarily in individuals who had traveled to areas with endemic disease. However, a major outbreak in the U.S. territory of Puerto Rico has been linked to local mosquito-borne transmission, and the disease may spread northward within the range of the Aedes mosquito. Zika infections have been reported in Florida in recent years and may eventually spread to other regions of the southern United States.
Figure 32.13 Zika and Chikungunya viruses.

Both viruses contain single-stranded plus-sense RNA genomes and are surrounded by an envelope (Sections 5.1, 5.2, and 11.8). (a) Colorized transmission electron micrograph of virions of the Zika virus embedded in a tissue sample. A single virion (shown in blue, arrow) is about 40 nm in diameter. (b) Colorized transmission electron micrograph of virions of Chikungunya virus (arrow). A virion is about 50 nm in diameter.
Besides vectorborne transmission, Zika can be transmitted through sexual contact and by contaminated blood and, of most concern, from mother to fetus. The incidence of brain abnormalities, especially microcephaly, and other birth defects have been linked to infants born to Zika-infected mothers, and so Zika in some way affects development of the fetus. It is known that the Zika virus readily infects a type of neural cell that eventually forms the cerebral cortex, a major part of the brain that governs intellectual capacity, and this likely leads to the brain defects observed in Zika-infected newborns. This danger has led to advisories for pregnant women to take great precautions to avoid contact with mosquitoes during the entire pregnancy period. Other than in pregnant women, Zika virus disease seems to be a rather mild, self-limiting infection. However, in rare instances, Zika infection may trigger Guillain–Barré syndrome, an autoimmune disease (Section 28.1) caused by an infection with any of several different viruses and bacteria that results in the immune system attacking the peripheral nervous system.
Too little is known about the Zika virus and the various conditions it can or might cause to draw firm conclusions about the seriousness of this threat to public health, but it is clear that the virus is capable of causing explosive epidemics under certain conditions. Deaths directly attributable to a Zika infection have been rare, and thus the pathogen seems to be of only passing concern to the general public, even in the typical high-risk groups for infectious diseases, such as the very young or very old. However, the birth defect connection is extremely serious. Currently, it seems that pregnant women (or those trying to get pregnant, as Zika can also be transmitted by sexual intercourse) are the only group known to be at serious risk from Zika infection. No Zika vaccine is currently available, but several candidate vaccines are in development.
Like Zika, Chikungunya disease is caused by a single-stranded plus-sense RNA virus (Figure 32.13b), but the virus, of the family Togaviridae, is not closely related to the Zika, dengue, and yellow fever viruses (Table 32.1). Chikungunya virus is transmitted by species of Aedes mosquitoes and is currently endemic in South and Central America, Southeast Asia, central Africa, and Indonesia. Thus far, cases of Chikungunya in the United States have been limited to travelers returning from endemic areas, and in 2017, a total of 156 confirmed cases were reported. As for Zika, mortality in Chikungunya disease is rare, about 0.1% of all cases. The symptoms of Chikungunya are mild and self-limiting and the immune response to the virus is strong, conferring active immunity against reinfection. Unlike with Zika, no direct connection between Chikungunya viral infection and birth defects has been observed because Chikungunya virus is not transmitted from mother to fetus.
Check Your Understanding
Identify the vector and reservoir for yellow fever and dengue viruses.
Contrast the procedures for preventing infection in yellow and dengue fevers.
Why is Zika virus disease considered dangerous even though it rarely kills?
32.6 West Nile Fever
West Nile virus (WNV) causes West Nile fever, a seasonal, human viral disease that is transmitted through a variety of mosquito vectors (Figure 32.14a). Like the yellow fever, dengue, and Zika viruses, WNV is a flavivirus (Table 32.1) having an enveloped capsid (Figure 32.14b) and containing a plus-sense single-stranded RNA genome (Section 11.8). The virus can invade the nervous system of its endothermic (warm-blooded) hosts, which include certain species of birds and mammals.
Figure 32.14 West Nile virus.

(a) The mosquito Culex quinquefasciatus, shown here engorged with human blood, is a West Nile virus vector. (b) An electron micrograph of the West Nile virus. The icosahedral virion is about 40–60 nm in diameter.
WNV Transmission and Pathology
WNV causes active disease in over 100 species of birds and is transmitted to different hosts by over 40 species of mosquito, including Culex quinquefasciatus (Figure 32.14a), which is common in central and eastern portions of the United States and in urban centers throughout the country. Infected birds develop a systemic viral infection (viremia) that is often fatal. Mosquitoes feeding on viremic birds are infected and can then infect other susceptible birds, renewing the cycle. In contrast to birds, humans and other animals are dead-end hosts for the virus because they do not develop the viremia necessary to infect mosquitoes.
Mortality rates for WNV infection are species-specific. For example, the human mortality rate from WNV is about 4%, whereas that for horses is significantly higher at nearly 40%. Most human infections are asymptomatic or mild and are not reported. After an incubation period of 3–14 days, about 20% of infected individuals develop West Nile fever, a mild illness lasting 3–6 days. The fever may be accompanied by headache, nausea, muscle pain, rash, lymphadenopathy (swelling of lymph nodes), and malaise. Less than 1% of infected individuals develop serious neurological diseases such as West Nile encephalitis or West Nile meningitis from viral replication in neural tissues (Figure 32.15). These are more common in adults over age 50, and the neural effects may be permanent. About 5% of West Nile cases that progress to these forms are fatal. Diagnosis of WNV disease includes assessment of clinical symptoms followed by confirmation by immunological tests that detect WNV antibodies in blood.
Figure 32.15 West Nile encephalitis.

Brain section from a West Nile encephalitis victim. Red areas in the tissue are neurons containing West Nile virus as detected using an immunofluorescent staining technique (Section 29.6).
Control and Epidemiology of WNV
Human WNV disease was first identified in the West Nile region of Africa in 1937 and spread from there to Egypt and Israel. In the 1990s there were WNV outbreaks in horses, birds, and humans in African and European countries. The first North American cases of WNV were reported in the northeast United States in 1999, and in the years since, the disease has spread to every state in the continental U.S. (Figure 32.16). In the 1999–2017 period, the number of reported WNV cases per year has fluctuated wildly, from as few as about 20 to as many as 9800. The major U.S. foci of infection appear to be in the south-central states and the Great Plains from the Southwest to the Canadian border (Figure 32.16). West Nile disease is now enzootic in the bird population in the United States and in only low incidence in the human population, its accidental host.
Figure 32.16 Average annual incidence of West Nile disease in the United States, 1999–2017.

In 2017, 2097 cases of human West Nile disease were reported, resulting in 146 deaths (7% mortality). West Nile virus is now endemic in mosquitoes and birds throughout the United States. Data are from the Centers for Disease Control and Prevention, Atlanta, Georgia, USA.
Control of WNV illness is much the same as for other vectorborne diseases: Limit exposure to mosquitoes by using insect repellents or wearing tight-fitting, lighter-colored clothing. Spraying for mosquitoes has limited effectiveness, but removal of mosquito breeding grounds, particularly sources of standing water, helps control mosquito populations. A veterinary WNV vaccine is widely used in horses where the mortality risk demands it, but no human WNV vaccine is currently available.
Check Your Understanding
Identify the vector and reservoir for West Nile virus.
Trace the progress of West Nile virus in the United States since 1999.
32.7 Plague
Plague has caused more human deaths than any other bacterial disease in recorded history; only smallpox and measles have killed more among all infectious diseases. Plague is primarily a zoonosis of wild rodents, but humans can become accidental hosts when rodent populations experience a die-off and the disease vector, the rat flea, seeks alternative sources of a blood meal. Plague is caused by Yersinia pestis, a gram-negative, facultatively aerobic, rod-shaped, and encapsulated enteric bacterium (Gammaproteobacteria, Section 16.3) that is easily grown in laboratory culture (Figure 32.17).
Figure 32.17 *Yersinia pestis*.

(a) Gram stain of cells of Yersinia pestis. The cells are about 0.8 μm in diameter. (b) Colonies of Y. pestis grown on blood agar.
Pathology and Treatment of Plague
The pathogenesis of plague is not clearly understood, but cells of Y. pestis produce several virulence factors that contribute to the disease process. The V and W antigens in Y. pestis cell walls are protein–lipoprotein complexes that inhibit immune cell phagocytosis. Murine toxin, an exotoxin (Section 25.6) that is lethal for mice, is produced by virulent strains of Y. pestis. Murine toxin is a respiratory inhibitor that causes systemic shock, liver damage, and respiratory distress in mice. The toxin likely plays a role in human plague as well, because these symptoms are common in plague patients. Y. pestis also produces a highly immunogenic endotoxin (Section 25.8) that may play a role in the disease process.
Plague can occur in several forms (see Figures 32.19 and 32.20). Sylvatic plague is enzootic among wild rodents. Plague is transmitted by several species of fleas, a main one being the rat flea Xenopsylla cheopis (Figure 32.18a). Fleas ingest Y. pestis cells in a blood meal, and the bacterium (Figure 32.18b) multiplies in the flea’s intestine. From there, the infected flea transmits the disease to rodents or humans in the next bite. The most common form of plague in humans is bubonic plague. In this case, cells of Y. pestis travel to the lymph nodes, where they replicate and cause swelling. The regional and pronounced swollen lymph nodes are called buboes, and the disease gets its name from these structures (Figure 32.19a). The buboes become filled with Y. pestis cells, and the bacterium’s capsule prevents phagocytosis and destruction by cells of the immune system. Secondary buboes form in peripheral lymph nodes, and cells eventually enter the bloodstream, causing septicemia. Multiple local hemorrhages produce dark splotches on the skin and eventual tissue necrosis, giving plague its historical name, the “Black Death” (Figure 32.19b). If the infection is not treated quickly, the symptoms of plague (lymph node swelling and pain, prostration, shock, gangrene, and delirium) usually progress quickly, causing death within 3–5 days.
Figure 32.18 The rat flea, a major vector of plague.

(a) The rat flea Xenopsylla cheopis carries cells of Yersinia pestis. The bacterium replicates in the flea gut and (b) cells of Y. pestis are transmitted to a host in a flea bite. The rat flea was the major vector for the pandemics of plague that ravaged medieval Europe in the fourteenth century. Cells in part b were stained with a fluorescent antibody prepared against Y. pestis cell surface antigens.
Figure 32.19 Plague in humans.

(a) A bubo (arrow) formed in the groin. (b) Gangrene in the hand of a plague victim.
Pneumonic plague occurs when cells of Y. pestis are either inhaled directly or reach the lungs via the blood or lymphatic circulation. Significant symptoms are usually absent until the last day or two of the disease when large amounts of bloody sputum are produced. Greater than 90% of untreated cases of pneumonic plague result in death within 48 h. Moreover, pneumonic plague is highly contagious and can spread rapidly from person to person if those infected are not immediately isolated. Septicemic plague is the rapid spread of Y. pestis throughout the body via the bloodstream without the formation of buboes and is so severe that it usually causes death before a diagnosis can be made.
Bubonic plague can be successfully treated with streptomycin or gentamicin, administered by injection. Alternatively, doxycycline, ciprofloxacin, or chloramphenicol may be given intravenously. If treatment is started promptly, mortality from bubonic plague can be reduced to less than 5%. Pneumonic and septicemic plague can also be treated, but these forms progress so rapidly that antibiotic therapy, even if begun when symptoms first appear, is usually too late.
Plague Epidemiology and Control
Sylvatic plague is enzootic in a variety of rodents, including ground squirrels, prairie dogs, chipmunks, and mice; rats are the primary hosts in urban communities and were typically the hosts in episodes of sylvatic plague that triggered human pandemics during the Middle Ages. Fleas are intermediate hosts and vectors for plague, spreading the disease between rodent hosts and humans (Figure 32.20). Most infected rats or other rodents die soon after symptoms appear, but a small proportion of survivors develop a chronic infection, providing a persistent reservoir of Y. pestis cells to fuel new outbreaks.
Figure 32.20 Plague epidemiology.

In some wild rodents, sylvatic plague causes only a mild infection, but diseased animals remain a reservoir of Yersinia pestis. In rodents such as rats that act as disseminating hosts, as well as in humans, plague is often fatal. When the domestic rodent reservoir dies off in an epidemic, infected fleas seek alternate hosts in humans.
Plague is endemic in developing countries in Africa, Asia, the Americas, and in south-central Eurasia; most cases occur in sub-Saharan Africa. Pandemic plague was historically associated with unsanitary surroundings, a major factor supporting large rat populations. In sparsely populated rural areas, this is not so great a problem as the disease runs its course when the rodent population dies off, leaving a shortage of hosts. But in urban centers where alternative hosts (humans) are plentiful, an outbreak of sylvatic plague can set the stage for a human plague epidemic. In the United States only a handful of cases of plague are diagnosed annually, mostly in southwestern states (New Mexico, Colorado, and Arizona in particular) where sylvatic plague is enzootic among wild rodents (Figure 32.20). In 2017, only five cases of human plague were reported, with no deaths. From 2000 through 2016 exactly 100 cases were reported, including 12 fatalities.
Plague control is accomplished through good sanitation practices, surveillance and control of rodent reservoirs and vectors (fleas), isolation of active cases, and imposing quarantine on those who have had contact with diseased individuals. Improved public health practices and the control of rodent populations are the major reasons that outbreaks of plague are extremely rare in developed countries.
Check Your Understanding
Distinguish among sylvatic, bubonic, septicemic, and pneumonic plague.
Describe the insect vector, the natural host reservoir, and the treatment for plague.
III Soilborne Bacterial Diseases
Soil is a reservoir for several formidable bacterial pathogens of humans, including certain species of the generaBacillusandClostridium. Although humans are only accidental hosts, these bacteria produce potent exotoxins that cause life-threatening illnesses.
32.8 Anthrax
Some human diseases are caused by microorganisms whose major habitat is soil (Table 32.1), and anthrax is an excellent example. We covered some aspects of the disease anthrax in Section 30.9 in the context of its use as a potential bioterrorism or biological warfare agent. Here we focus more on the biology of the organism and the disease process.
Discovery and Properties of Anthrax
The famous pioneering medical microbiologist Robert Koch (Section 1.12) first isolated the causative agent of the disease anthrax, the endospore-forming bacterium Bacillus anthracis (Figure 32.21). Using mice caught in the wild as experimental animals, Koch used the disease anthrax to develop his principles for linking cause and effect in infectious disease—Koch’s postulates (Figure 1.33). Anthrax is quickly fatal in mice, but in humans, anthrax can take on several different forms, from mild to severe skin infections to respiratory failure and death.
Figure 32.21 *Bacillus anthracis*.

The anthrax pathogen produces endospores. (a) Light micrograph of a malachite green–stained smear of B. anthracis cells showing greenish-blue endospores. (b) Colorized scanning electron micrograph of B. anthracis endospores. Cells of B. anthracis are about 1.2 μm in diameter.
Anthrax is an enzootic disease (an endemic disease of animals) of worldwide occurrence. B. anthracis lives a saprophytic existence in soils, growing as an aerobic chemoorganotroph and forming endospores (Section 2.8, Figure 32.21) when conditions warrant. From soil, cells or endospores of B. anthracis can become embedded in animal hair, hides, or other animal materials, or can be ingested, and from here the disease can develop, allowing B. anthracis to be transmitted to humans. Anthrax is primarily seen in farm animals, particularly in cattle, sheep, and goats, and is transmitted from them to humans.
Forms of Human Anthrax
The disease anthrax can manifest itself in one of three forms: cutaneous (on the skin), intestinal, and respiratory (inhalation anthrax). In all forms, disease symptoms are due to two major toxins called lethal toxin and edema toxin. The different forms of anthrax show increasing severity, which is primarily a function of where in the body these toxins are excreted. Growth and toxin production by B. anthracis in the lymph nodes and lymphatic tissues leads to progressively worsening symptoms, beginning with a sore throat, muscle aches, and fever, and escalating to respiratory distress and systemic shock. In addition to anthrax toxins, the unusual protein capsule that surrounds cells of B. anthracis (Figure 32.22a) is also an important virulence factor of this pathogen, as it prevents destruction of the bacterium following phagocytosis by immune cells such as macrophages. Instead, cells of B. anthracis grow within the macrophage, eventually killing it and giving the bacterium access to the bloodstream.
Figure 32.22 Anthrax pathology.

(a) The protein capsule of Bacillus anthracis cells is a major virulence factor because it prevents killing by macrophages. (b) Cutaneous anthrax, with its characteristic black scabby appearance on the neck of a patient. (c, d) Inhalation anthrax. (c) The lung fills with bacterial cells (arrows) and fluids (cleared zones). (d) From the systemic infection, B. anthracis cells can be found almost anywhere, including the lining of the central nervous system (arrows point to B. anthracis cells).
Virtually all cases of human anthrax are cutaneous anthrax, where endospores of B. anthracis have entered through a break in the skin, germinate, and form a painless, black, and swollen pustule of necrotic tissue called an eschar (Figure 32.22b); the eschar is highly characteristic of the disease and allows for a firm diagnosis even though human anthrax is rarely seen in clinical medicine. In cutaneous anthrax the bacterium usually remains localized and the disease is readily treatable. Although cutaneous anthrax is fatal for about 20% of those untreated, most cases are treated because of the obvious symptoms, and thus fatalities are rare. Intestinal anthrax is very uncommon and is triggered by the ingestion of endospores of B. anthracis (Figure 32.21b) in undercooked meat from diseased animals. Symptoms of intestinal anthrax include abdominal pain, bloody diarrhea, and ulcer-like lesions throughout the intestinal tract. The disease is still treatable at this stage, but because of its rarity, diagnoses are easily missed. As a result, about half of all cases of intestinal anthrax are fatal.
Inhalation anthrax is the most severe form of the disease and is fatal in almost every case (Figure 32.22c, d). Inhalation anthrax occurs from the inhalation of endospores of B. anthracis and, along with cutaneous anthrax, is an occupational hazard for farm workers that process wool and hides (inhalation anthrax is also known as “woolsorter’s disease”). In inhalation anthrax, the organism enters the bloodstream from inhaled dust or animal dander and multiplies to become systemic. The mounting toxemia from this runaway growth of B. anthracis triggers septic shock and fluid accumulation in the lungs (Figure 32.22c) that can kill a patient in less than a day.
Prevention and Vaccines
Complete prevention of anthrax is impossible because the reservoir of the organism is soil. However, anthrax is avoidable by limiting close exposure to farm animals and is easily treatable with antibiotics. For the cutaneous form this is a routine treatment, but antibiotic therapy is less effective in intestinal anthrax and especially in inhalation anthrax. By the time the latter is diagnosed, the disease has progressed to the point where it is usually too late to save the patient. An anthrax vaccine is available but because the disease is so rare, it is recommended only for high-risk individuals, such as scientists working with the organism, slaughterhouse or livestock workers, and military personnel (for biowarfare reasons). An effective and inexpensive anthrax vaccine is available for vaccinating livestock and is commonly used in cattle, sheep, goats, and horses.
Check Your Understanding
What are the major virulence factors of Bacillus anthracis?
What are the three forms of anthrax, and which is most dangerous?
32.9 Tetanus and Gas Gangrene
Tetanus is a serious, life-threatening disease. Although tetanus is completely preventable through immunization, it still causes over 150,000 deaths per year, mostly in countries in Africa and Southeast Asia. Gas gangrene is caused by the growth in dead tissues of bacteria related to the tetanus pathogen, leading to a gassy putrefaction and loss of an infected limb or death from systemic shock. Both diseases are caused by clostridia.
Biology and Epidemiology of Tetanus
Tetanus is caused by an exotoxin produced by Clostridium tetani, an obligately anaerobic, endospore-forming rod (Figure 32.23a; Section 16.8). The natural reservoir of C. tetani is soil, where it is a ubiquitous resident, although it is occasionally found in the gut of healthy humans, as are other Clostridium species.
Figure 32.23 Tetanus.

(a) Clostridium tetani showing the “drumstick” appearance of sporulating cells with their terminal endospores. Cells of C. tetani are about 0.8 mm in diameter. (b) A tetanus patient showing the rigid paralysis characteristic of tetanus. Tetanus paralysis typically begins with the facial muscles (“lockjaw”) and descends to lower body regions.
Cells of C. tetani normally gain access to the body through a soil-contaminated wound, typically a deep puncture. In the wound, anoxic conditions develop around the dead tissue and allow germination of endospores, growth of the organism, and production of a potent exotoxin, the tetanus toxin (also called tetanospasmin). C. tetani is essentially noninvasive; its sole ability to cause disease is through toxemia, and thus tetanus is observed only as the result of untreated deep tissue injuries. The onset of tetanus symptoms may take from 4 days to several weeks, depending on the number of endospores inoculated at the time of the injury.
Pathogenesis of Tetanus
We have already examined the activity of tetanus toxin at the cellular and molecular level (Section 25.6). The toxin directly affects the release of inhibitory signaling molecules in the nervous system. These inhibitory signals control the “relaxation” phase of muscle contraction. The absence of inhibitory signaling molecules results in rigid paralysis of the voluntary muscles, often called lockjaw because it is usually observed first in the muscles of the jaw and face. Preceding actual lockjaw, tetanus symptoms typically include mild spasms of facial muscles and muscles of the neck and upper back. Later, the paralysis extends to the torso and lower body (Figure 32.23b). When tetanus is fatal, death is usually due to respiratory failure. Mortality is relatively high, occurring in about 10% of all reported cases, and up to 50% of cases in which treatment is delayed until generalized full body tetanus has set in.
Diagnosis, Control, Prevention, and Treatment of Tetanus
Diagnosis of tetanus is based on exposure, clinical symptoms (Figure 32.23b), and, rarely, identification of the toxin in the blood or tissues of the patient. The natural reservoir of C. tetani is soil and thus control measures must focus on disease prevention rather than pathogen removal. The widely used tetanus toxoid vaccine is highly effective, and thus virtually all tetanus cases occur in individuals who either were never immunized or were vaccinated more than 10 years prior to exposure to the pathogen.
A second line of tetanus protection is to administer appropriate medical care to serious cuts, lacerations, and punctures. Even though vaccination against tetanus is widely practiced, any serious wound should be thoroughly cleaned and the damaged tissue removed. If the vaccination status of the individual is unclear or the last tetanus booster was more than 10 years ago, revaccination is highly recommended. If a deep wound is severe or heavily contaminated by soil, treatment might also include administration of a tetanus antitoxin preparation, especially if the patient’s immunization status is unknown or is out of date.
Acute symptomatic tetanus (Figure 32.23b) is treated with antibiotics, usually penicillin, to stop growth and toxin production by C. tetani, and antitoxin is injected intramuscularly (or into the sheath surrounding the spinal cord if necessary) to prevent binding of newly released toxin to cells. Supportive therapy such as sedation, administration of muscle relaxants, and mechanical respiration may be necessary to control the effects of paralysis. Treatment cannot provide a quick reversal of symptoms because toxin that is already bound to tissues cannot be neutralized. Even with antitoxin, antibiotic administration, and supportive therapy, tetanus patients show significant morbidity and mortality. A complete recovery from tetanus often takes many months.
Gas Gangrene
Tissue destruction due to the growth of proteolytic and gas-producing clostridia is called gas gangrene. In this life-threatening condition, amino acids obtained from the breakdown of muscle proteins are fermented to the gases H2 and CO2 plus a variety of foul-smelling organic compounds, including short-chain fatty acids and other putrid molecules; ammonia released during amino acid fermentation (Section 14.19) adds to the stench. In addition, a variety of bacterial toxins are produced that accelerate tissue destruction.
Although C. tetani is a proteolytic Clostridium species, it does not cause gangrene but can be associated with cases of gangrene triggered by a deep tissue wound. The most common causes of gangrene are Clostridium perfringens (Figure 32.24a), which is also a common cause of foodborne illness unrelated to gangrene; C. novyi; and C. septicum. These organisms reside in soil and are also part of the normal human intestinal microbiota. When these species reach deep into tissues, typically from traumatic tissue invasion such as a war wound or other puncture wound, or occasionally from gastrointestinal tract surgery, endospores and vegetative cells of proteolytic clostridia are inserted into what are now dead tissues. As the bacteria grow, they release enzymes that destroy collagen and tissue proteins and also excrete a series of toxins. C. perfringens (Figure 32.24a) α-toxin, which is distinct from the toxins the bacterium produces in perfringens food poisoning (Section 33.9), is a major virulence factor in gangrene, as is the general ability of the pathogens to grow rapidly in the warm, moist, and protein-rich environment created by an invasive injury. C. perfringens α-toxin is a phospholipase that hydrolyzes the membrane phospholipids of host cells, leading to cell lysis and the typical accumulation of gas and fluids that accompanies gas gangrene (Figure 32.24c).
Figure 32.24 Gas gangrene.

(a) Gram stain of cells of Clostridium perfringens, the most common cause of gangrene. (b) Flagellum stain showing a cell of Clostridium novyi, also an agent of gangrene. Cells of both C. perfringens and C. novyi are about 1.2 μm in diameter. (c) A case of gas gangrene on the foot.
In severe cases of gas gangrene, the toxemia can become systemic and cause death. Antibiotic treatment is taken as a preventive measure in cases of gangrene in addition to the typical though dramatic treatment: amputation of the infected limb. Gangrenous tissues are dead and will not regenerate, and amputation prevents the infection from reaching healthy tissues.
Hyperbaric oxygen treatment of the infected limb is attempted in some cases to try to save it, with the high levels of O2 inhibiting growth of the obligately anaerobic clostridia. In hyperbaric treatment, the patient sits in an enclosed chamber containing 100% O2 at about twice atmospheric pressure. This enriches the blood in O2 and helps still-living blood vessels seed the formation of new tissue. Several hyperbaric treatments are administered and may be accompanied by surgical removal of some of the dead tissue. If an adequate blood supply can be established in damaged tissues, a skin graft may also be done to help connect regenerating tissues with damaged ones.
Check Your Understanding
Describe infection by Clostridium tetani and the effects of tetanus toxin. How does the mode of action of tetanus toxin differ from that of α-toxin produced by Clostridium perfringens?
Describe the steps necessary to prevent tetanus in an individual who has sustained a puncture wound.
How does the physiology of C. perfringens make it suitable for growing in puncture wounds?
Chapter Review
Go to Mastering Microbiology for videos, animations, practice tests, and more.
I Animal-Transmitted Viral Diseases
32.1 Rabies occurs primarily in wild animals but can be transmitted to humans and domestic animals. In the United States, rabies is transmitted primarily from the wild animal reservoir to domestic animals or, very rarely, to humans. Vaccination of domestic animals is key to the control of rabies. Most human deaths from rabies occur in developing countries.
Q Identify the animals most likely to carry rabies in the United States. Why is rabies so rare in humans and domesticated animals in developed countries?
32.2 Hantaviruses are present worldwide in rodent populations and cause zoonotic diseases such as hantavirus pulmonary syndrome and hemorrhagic fever with renal syndrome in humans. Hantavirus is a highly dangerous hemorrhagic fever virus related to Lassa fever virus. In the Americas, hantavirus infections have mortality rates of over 30%.
Q Describe the conditions that may cause emergence of hantavirus pulmonary syndrome (HPS). How can HPS be prevented?
II Arthropod-Transmitted Bacterial and Viral Diseases
32.3 Rickettsias are obligate intracellular parasitic bacteria transmitted to hosts by arthropod vectors. The incidence of spotted fever rickettsiosis and other rickettsial syndromes is increasing as a result of several factors. Most rickettsial infections can be controlled by antibiotic therapy, but prompt recognition and diagnosis of these diseases remains difficult.
Q Identify the three major categories of organisms that cause rickettsial diseases. For typhus, spotted fever rickettsiosis, and ehrlichiosis, identify the most common reservoir and vector.
32.4 Lyme disease is caused by the spirochete Borrelia burgdorferi and is the most prevalent arthropod-borne disease in the United States today. The pathogen is transmitted from several mammalian host reservoirs to humans by tick vectors. Prevention and treatment of Lyme disease are straightforward, but accurate and timely diagnosis of infection is essential.
Q Identify the most common reservoir and vector for Lyme disease in the United States. How can the spread of Lyme disease be controlled? How can Lyme disease be treated?
32.5 Yellow, dengue, and Zika fevers are caused by related flaviviruses transmitted to humans by mosquito bites; Chikungunya fever shows similar disease symptoms but is caused by a togavirus. These diseases are widespread in tropical and subtropical countries and can show mild to severe symptoms, including hemorrhagic fevers. An effective vaccine for yellow fever is in use. A vaccine for dengue is in restricted use. No vaccine is currently available to prevent Zika or Chikungunya infections, but vaccines against both viruses are in development.
Q Of Zika, dengue, and yellow fevers, which is usually the least serious disease?
32.6 West Nile fever is a mosquito-borne viral disease. In the natural cycle of the pathogen, birds are infected with West Nile virus by the bite of infected mosquitoes. Humans and other vertebrates are occasional terminal hosts. Most human infections are asymptomatic and undiagnosed, but complications of some infections cause about 5% mortality.
Q Describe the spread of West Nile virus infections in the United States. Which animals are the primary hosts? Are humans productive alternate hosts?
32.7 Plague can be transmitted to individuals who have had contact with rodent populations and their parasitic fleas, the enzootic reservoirs for the plague bacterium, Yersinia pestis. A systemic infection or a pneumonic infection usually leads to rapid death, but the bubonic form is treatable with antibiotics.
Q For a potentially serious disease like bubonic plague, vaccines are not routinely recommended for the general population; why not? Identify the public health measures used to control plague.
III Soilborne Bacterial Diseases
32.8 Anthrax is caused by the endospore-forming bacterium Bacillus anthracis and can take on three different forms: cutaneous, intestinal, or inhalation. Cutaneous anthrax is most common and along with inhalation anthrax is an occupational hazard for livestock workers, where B. anthracis endospores can be transmitted from animal hides to humans.
Q Which key feature of the bacteriumBacillus anthracisallows this organism to persist for extended periods on animal hides or other environments where growth may not occur? Which form of anthrax is the most serious?
32.9 Clostridium tetani is a soil bacterium that causes tetanus, a potentially fatal disease characterized by a toxemia and rigid paralysis. Treatment for acute tetanus includes antibiotics and active and passive immunization, and the disease is preventable by toxoid immunization. Gas gangrene occurs from the growth of various proteolytic clostridia in traumatic wounds, leading to gas and toxin formation.
Q Discuss the major mechanism of pathogenesis for tetanus and define measures for prevention and treatment. Why is it possible that a traumatic puncture wound could end up causing both tetanus and gas gangrene?
Application Questions
Describe the sequence of steps you would take if your child received a bite (provoked or unprovoked) from a stray dog with no collar and record of rabies immunization. Present one scenario in which you were able to capture and detain the dog and another for a dog that escaped. How would these procedures differ from a situation in which the child was bitten by a dog that had a collar and rabies tag with documented, up-to-date rabies immunizations?
Contrast the modes of transmission of the following diseases: rabies, Lyme disease, yellow fever, West Nile disease, anthrax, and plague. Which of these diseases could be virtually eliminated in humans by control of the disease vector and which could not, and why?
Devise a plan to prevent the spread of West Nile virus to humans in your community. Identify the relative costs involved in such a plan, both at the individual level and at the community level. Find out if a mosquito abatement program is active in your community. What methods, if any, are used in your area for the reduction of mosquito populations? What is a simple way to limit mosquito numbers around your residence?
Chapter Glossary
an endemic disease present in an animal population Epizootic
an epidemic disease present in an animal population Gas gangrene
tissue destruction due to the growth of proteolytic and gas-producing clostridia Hantavirus pulmonary syndrome (HPS)
an emerging, acute disease characterized by pneumonia and caused by rodent hantavirus Hemorrhagic fever with renal syndrome (HFRS)
an emerging, acute disease characterized by shock and kidney failure and caused by rodent hantavirus Lyme disease
a tick-transmitted disease caused by the spirochete Borrelia burgdorferi Plague
an enzootic disease in rodents that is caused by Yersinia pestis and can be transferred to humans through the bite of a flea Rabies
a usually fatal (if untreated) neurological disease caused by the rabies virus, which is typically transmitted by the bite or saliva of an infected animal Rickettsias
obligate intracellular bacteria of the genus Rickettsia and related genera responsible for diseases including typhus, spotted fever rickettsiosis, and ehrlichiosis Spotted fever rickettsiosis (SFR)
a tick-transmitted disease caused by Rickettsia rickettsii, characterized by fever, headache, rash, and gastrointestinal symptoms; also called Rocky Mountain spotted fever Tetanus
a disease characterized by rigid paralysis of the voluntary muscles, caused by an exotoxin produced by Clostridium tetani Typhus
a louse-transmitted disease caused by Rickettsia prowazekii, characterized by fever, headache, weakness, rash, and damage to the central nervous system and internal organs West Nile fever
a neurological disease caused by West Nile virus, a virus transmitted by mosquitoes from birds to humans Zoonosis
any disease that occurs primarily in animals but can be transmitted to humans
33 Waterborne and Foodborne Bacterial and Viral Diseases
33 Waterborne and Foodborne Bacterial and Viral Diseases
## Chapter 33 Waterborne and Foodborne Bacterial and Viral Diseases
Reverse Zoonosis in the Southern Ocean
A zoonosis is an animal disease that is transmissible to humans, usually by direct contact (including bites) or airborne particles. Rabies, for example, is a classic zoonotic disease. But does the opposite ever happen? That is, do humans ever transmit pathogens to animal populations?
The answer is yes, “reverse zoonotic” transmission occurs regularly when humans and animals are in close proximity, but, with the exception of a few key pathogens (for example, influenza A), this transmission generally poses no significant threat to animal populations as a whole. But is this also true for animal species that have historically been isolated from contact with humans? Not having coevolved with humans, are these animals more at risk from novel exposures to anthropogenic opportunistic pathogens?
This question has come to the forefront in Antarctica, where vibrant multinational research programs and a burgeoning tourism industry have led to more traffic—tens of thousands of visitors every year—on and around the Southern Ocean than ever before.
Ever since centuries-old murmurings of an unseen, mythical land to the far south of the globe were confirmed in the 1820s, research scientists and adventurous travelers have found the allure of the frozen continent compelling. However, the steadily increasing presence of humans—and in particular, their gut microbiota—may negatively impact Antarctic and subantarctic animal populations.
A recent study identified human-derived enteric pathogens, including antibiotic-resistant strains of Salmonella and Campylobacter spp., in fecal samples from Antarctic marine birds such as various penguins (photo, an Adélie penguin rookery in Cape Bird, Ross Island, Antarctica), brown skuas, and gulls. Although the long-term ramifications of reverse zoonosis in Antarctica are unclear, the study shows that stricter biosecurity regulations to limit the potential for widespread reverse zoonotic outbreaks among sensitive animal populations may be a prudent and perhaps overdue course of action.
Source: Cerdà-Cuéllar, M., et al. 2019. Do humans spread zoonotic enteric bacteria in Antarctica? Sci. Total Environ. 654: 190. doi: 10.1016/j.scitotenv.2018.10.272.
In this chapter we consider microbial pathogens whose mode of transmission is either water or food. The diseases caused by these pathogens are called “common-source” diseases because they occur only in those who have consumed the same contaminated water or eaten the same contaminated food (Section 30.4). Waterborne and foodborne illnesses are common infectious diseases worldwide. While foodborne illnesses are most commonly of bacterial or viral origin, waterborne illnesses can have bacterial, viral, or parasitic causes. Waterborne diseases caused by eukaryotic pathogens will be considered in Chapter 34.
I Water as a Disease Vehicle
Whether potable or recreational, water is a potential source of a variety of pathogenic microorganisms that can cause serious disease. Because of this, rapid and accurate methods to test water quality are essential to maintain public health standards.
Water is used in enormous quantities, and its microbiological safety rests in the hands of wastewater and drinking water engineers and microbiologists. Indeed, water quality is the single most important factor for ensuring public health. In Chapter 22 we examined the microbiology of wastewater and examined how highly polluted water can be cleaned by microbial activities and reused for many purposes, including for drinking. Here we see what can happen when water intended for human use becomes a vehicle for disease.
Waterborne diseases begin as infections (or occasionally as toxemias), and contaminated water may cause an infection even if only small numbers of the particular pathogen are present. Whether exposure causes disease or not is a function of the virulence of the pathogen and the ability of the host to resist infection.
33.1 Agents and Sources of Waterborne Diseases
Many different microorganisms can cause waterborne infectious diseases, and some of the major ones are summarized in Table 33.1. Many different microbes can be waterborne pathogens, but here we will consider bacterial pathogens with a major focus on cholera, a waterborne disease of pandemic proportions (Section 30.8). We consider a few viral pathogens that can be either foodborne or waterborne later in this chapter.
Table 33.1 Major waterborne pathogens

aExcept for S. enterica (typhi), these bacteria have been associated with major outbreaks of waterborne illness in the United States in recent years, as have the bacteria Shigella sonnei and Leptospira sp.
bSee Chapter 34. C. parvum and G. intestinalis are unicellular microbial parasites; Schistosoma is a microscopic worm 10–20 mm long (see MicrobiologyNow in the Chapter 28 opener).
Mastering Microbiology
Art Activity: Table 33.1 Major waterborne pathogens
We begin by considering the disease vehicle itself—water. Waterborne illnesses can be transmitted through untreated or improperly treated water used for drinking or food preparation or from water used for swimming and bathing (recreational water sources). The major waterborne illnesses traced to drinking water and recreational waters are typically quite different, and these different disease patterns are shown in Table 33.2.
Table 33.2 Sources of outbreaks of acute gastrointestinal illness in drinking and recreational waters, 2013–2014a

aNumbers are rounded to the nearest percent and were obtained from the Centers for Disease Control and Prevention Waterborne Disease and Outbreak Surveillance System.
cSuspected to be caused by one or more microbes or chemicals but not confirmed.
Potable Water
Water supplies in developed countries typically meet rigid quality standards, greatly reducing the spread of waterborne diseases. Drinking water in particular undergoes extensive treatment that includes both filtration and chlorination. Although filtration removes turbidity and many microorganisms, it is chlorination that makes drinking water safe. Chlorine gas (Cl2) is a strong oxidant and oxidizes both organic matter dissolved in the water and microbial cells themselves. Drinking water chlorination facilities add sufficient chlorine to allow a residual level to remain in the water all the way to the consumer. Water suitable for human consumption is called potable water (Sections 22.7, 22.8, 22.9 and 22.10).
Despite filtration and chlorination, waterborne disease outbreaks from potable water occasionally occur. In the United States an average of 40 outbreaks of disease associated with drinking water are recorded in a year (a waterborne outbreak is defined as two or more human illnesses specifically linked to the consumption of the same water at the same time). About 60% of drinking water disease outbreaks are due to bacterial pathogens, most notably Legionella, the causative agent of legionellosis (Table 33.2 and Section 33.4).
Recreational Waters
Recreational waters include freshwater aquatic systems such as ponds, streams, and lakes, as well as public swimming and wading pools. Recreational waters can be sources of waterborne disease, and on average they cause more disease outbreaks than those due to drinking water (Table 33.2). Moreover, in contrast to drinking water, where bacterial pathogens are most common, disease outbreaks from recreational waters are more frequently linked to parasitic (eukaryotic) pathogens. In addition, recreational waters transmit a significant number of gastrointestinal illnesses that are of unknown origin (Table 33.2).
In the United States, the operation of public swimming pools is regulated by state and local health departments. The United States Environmental Protection Agency (EPA) establishes limits for bacterial numbers in both potable and public recreational water sources, but local and state governments can set standards above or below these guidelines for nonpotable sources. By contrast, the water quality of private recreational waters, such as swimming pools, spas, and hot tubs, is totally unregulated, and these are therefore prime vehicles for waterborne disease transmission.
Check Your Understanding
Contrast the major pathogens responsible for disease outbreaks in drinking water versus recreational waters.
33.2 Public Health and Water Quality
Water that looks perfectly transparent may still be contaminated with pathogenic microorganisms and thus pose a risk of disease. It is impractical to screen water for every pathogen that may be present (Table 33.1), and so both potable and recreational waters are routinely tested for specific indicator organisms, the presence of which signals the potential for waterborne disease.
Coliforms and Water Quality
A widely used indicator for microbial water contamination is the coliform group of bacteria. Many coliforms inhabit the intestinal tract of humans and other animals, and therefore their presence in water indicates likely fecal contamination. Coliforms are defined as facultatively aerobic, gram-negative, rod-shaped, nonsporulating bacteria that ferment lactose with the production of gas within 48 h at 35 °C. However, this definition includes several bacteria that are not necessarily restricted to the intestine; for this reason, it is fecal coliforms that are important in water safety assessments. Escherichia coli, a coliform whose only habitat is the intestine and that survives only a relatively short time outside the intestine, is the key fecal coliform of interest. The presence of cells of E. coli in a water sample is taken as evidence of fecal contamination and means that the water is unsafe for human consumption. Conversely, however, the absence of E. coli does not ensure that a water source is potable, because other pathogenic bacteria or pathogenic viruses or protists may still be present.
Testing for Fecal Coliforms and the Importance of *Escherichia coli*
Well-developed and standardized methods are in routine use for detecting coliforms and fecal coliforms in water samples. A common method is the membrane filter (MF) procedure where at least 100 ml of freshly collected water is passed through a sterile membrane filter, trapping any bacteria on the filter surface. The filter is placed on a plate of eosin–methylene blue (EMB) medium, which is selective for gram-negative, lactose-utilizing bacteria. EMB medium is also differential, allowing strongly fermentative species such as E. coli (**Figure 33.1*a***) to be distinguished from weakly fermentative species such as Proteus.
Figure 33.1 Fecal coliforms and their detection in water samples.

(a) Colonies growing on a membrane filter. A drinking water sample was passed through the filter and the filter placed on an eosin–methylene blue (EMB) agar plate (EMB is both selective and differential for coliforms; more strongly fermentative species [such as Escherichia coli] form colonies with darker centers). (b) Total coliforms and E. coli. A filter exposed to a drinking water sample was incubated at 35 °C for 24 hours on a medium containing special compounds that fluoresce when metabolized. The filter was then examined under ultraviolet light. The single E. coli colony in the sample fluoresces dark blue (arrow). Coliforms that do not metabolize the compound form colonies that fluoresce white to light blue. (c) The IDEXX Colilert® water quality test system. When specific reagents are added to water samples and incubated for 24 h, they develop a yellow color if they contain coliforms (right). Samples containing Escherichia coli develop a yellow color but also fluoresce blue (left). Samples negative for coliforms re-main clear (center).
Selective media are also available that not only detect total coliforms but also specifically identify E. coli simultaneously. These defined substrate tests are typically faster and more accurate than EMB-based assays. One popular plate-based test is based on the ability of E. coli but not other enteric bacteria to metabolize a combination of two specific chemicals to form a fluorescent blue compound (Figure 33.1b). A commonly used liquid method reveals whether coliforms are present and also specifically detects E. coli in the water sample (Figure 33.1c). In addition to these colorimetric tests, dipstick assays have been developed that detect adenosine triphosphate (ATP) in a water sample. There is a strong correlation between the total number of bacteria in a sample and its ATP content, and the latter can be measured using the luciferase enzyme system in which a flash of light is emitted when ATP is hydrolyzed (Figure 10.4b). Using this system, the total microbial load in a water sample can be quickly assessed, and portable kits are available commercially to carry out these analyses in water purification facilities as well as remote field sites.
Reporting Water Purity Data
In properly regulated drinking water supply systems, total coliform and E. coli fecal coliform tests should be negative. A positive test indicates that a breakdown has occurred in either the purification or distribution system (or both). In the United States, microbiological standards for drinking water are specified in the Safe Drinking Water Act and are administered by the Environmental Protection Agency (EPA). Water utilities must report coliform test results to the EPA monthly, and if they do not meet the prescribed standards, the utilities must notify the public and take steps to correct the problem.
Major improvements in public health in the United States beginning in the early twentieth century were largely due to the adoption of water filtration and chlorination procedures in large-scale wastewater and drinking water treatment plants (Sections 22.8 and 22.9). Where drinking water standards have not reached this level, especially in developing countries, a variety of waterborne diseases are common. We turn our attention to these diseases now, beginning with cholera, the most widespread and devastating of all waterborne diseases.
Check Your Understanding
Why is Escherichia coli used as an indicator organism in microbial analyses of water?
What procedures are used to ensure the safety of potable water supplies?
II Waterborne Diseases
Waterborne diseases can result from ingestion of contaminated water, causing serious gastrointestinal distress, or inhalation of contaminated aerosols, causing respiratory illness and pneumonia-like symptoms. Cholera is a prime example of a dangerous waterborne disease.
Waterborne infectious diseases are a constant threat to humanity, especially in areas where proper sanitation and supplies of potable drinking water are either unavailable or subject to intermittent disruption. Cholera leads the list here for its potential to initiate large-scale and rapidly developing disease outbreaks.
33.3 *Vibrio cholerae* and Cholera
Cholera is a severe gastrointestinal diarrheal disease that is now largely restricted to countries in the developing world. Cholera is caused by ingestion of contaminated water containing cells of Vibrio cholerae, a gram-negative and motile curved species of Proteobacteria (Figure 33.2). Cholera can also be contracted from contaminated food, especially improperly cooked shellfish.
Figure 33.2 Infection cycle, symptoms, and diagnosis of cholera.

Highly motile cells of Vibrio cholerae, the causative agent of cholera (upper left, scanning electron micrograph, note flagella), may associate with algae in freshwaters (lower left) in cholera endemic areas and be inadvertently ingested by a human host. Subsequent colonization of the small intestine and enterotoxin secretion by V. cholerae (Figure 25.16) causes severe diarrhea in the form of “rice water” stools, so called because they are extremely watery and contain flecks of whitish-colored mucus. While being treated for cholera, patients lie prostrate on “cholera cots” and void feces directly into a bucket below (top right). Any contamination of natural waters by patient stools (for example, by emptying or rinsing cholera buckets in local streams) magnifies and prolongs the cholera outbreak. Patient diagnosis is confirmed by recovering cells of V. cholerae from a stool sample using selective culture media, such as medium TCBS (middle right), which contains bile salts and citrate to inhibit enterobacteria and gram-positive bacteria, as well as thiosulfate and sucrose, which cells of V. cholerae (bottom right) use as a sulfur and carbon/energy source, respectively.
The ingestion of a large number (> 108) of V. cholerae cells is required to cause disease. The ingested cells attach to epithelial cells in the small intestine where they grow and release cholera toxin, a potent enterotoxin (Figure 25.16). Studies with human volunteers have shown that normal stomach acidity (about pH 2) is why the large inoculum of V. cholerae cells is needed to initiate disease. In these studies, those given bicarbonate to neutralize gastric acidity develop cholera when given as few as 104 cells. Even lower cell numbers can initiate infection if V. cholerae is ingested with food, presumably because the food protects the vibrios from destruction by stomach acidity.
Cholera enterotoxin causes severe diarrhea that can rapidly result in dehydration and death unless the patient is given fluid and electrolyte therapy. The enterotoxin causes fluid losses of up to 20 liters (20 kg or 44 lb) per person per day, causing severe dehydration. The mortality rate from untreated cholera is 25–50% and can be even higher under conditions of severe crowding and malnutrition as often occurs in refugee camps or in areas that have experienced natural disasters, such as floods and earthquakes. In these situations, there is often a near-complete breakdown in sanitation, leading to the contamination of drinking water with feces and the rapid transmission of cholera.
Diagnosis, Treatment, and Prevention of Cholera
At treatment facilities in large outbreaks of cholera, each cholera patient is placed on a “cholera cot,” which is a conventional folding cot containing an opening into which feces can be voided (Figure 33.2). The feces of a cholera patient are more liquid than solid, and confirmation of the disease is straightforward because the pathogen is easily cultured on selective agar media (Figure 33.2). Cholera treatment is simple and effective. An oral (or in severe cases, intravenous) liquid and electrolyte replacement therapy is the most effective means of treatment. Oral treatment is preferred because no special equipment or sterile precautions are necessary. The rehydration solution is a mixture of glucose, salt (NaCl), sodium bicarbonate (NaHCO3), and potassium chloride (KCl). If the solution is administered quickly during an outbreak, cholera mortality can be greatly reduced, as rehydration allows patients the time necessary to mount an immune response.
Antibiotics may shorten the course of cholera infection and the shedding of viable cells, but antibiotics are of little health benefit to the patient without simultaneous fluid and electrolyte replacement. Public health measures such as adequate sewage treatment and a reliable source of safe drinking water are the keys to preventing cholera. V. cholerae is eliminated from wastewater during proper sewage treatment and drinking water purification procedures (Chapter 22). For individuals traveling in cholera-endemic areas, attention to personal hygiene and avoidance of untreated water or ice, raw food, and raw or undercooked fish or shellfish that can feed on phytoplankton contaminated with V. cholerae (Figure 33.2) can prevent cholera.
Since 1817, cholera has swept the world in seven major pandemics with an eighth pandemic likely already started (Section 30.8 and Figure 30.15). The World Health Organization estimates that only 5–10% of cholera cases are reported, so the total worldwide incidence of cholera probably exceeds 1 million cases per year. Only a handful of cases of cholera are reported each year in the United States, typically from imported shellfish that are eaten raw or after only minimal cooking.
Check Your Understanding
What organism causes cholera, and what are the symptoms of the disease?
Why does transmission of cholera usually require a large inoculum? Under what conditions can cholera be transmitted by fewer cells?
Describe how cholera can be prevented and how it is treated.
33.4 Legionellosis
Legionella pneumophila, the bacterium that causes legionellosis, is an important waterborne pathogen whose transmission was originally linked to aerosols from evaporative cooling devices. However, L. pneumophila (Figure 33.3) is now known to be a major pathogen in residential water systems as well, where the organism persists in biofilms that form on interior surfaces of water distribution pipes and also within the cells of certain microbial parasites. In these sites, L. pneumophila is protected from the chlorine present in potable waters, and thus biofilms and infected parasites are reservoirs for transmitting legionellosis by a waterborne route (Section 22.10 and Figure 22.25).
Figure 33.3 *Legionella pneumophila*.

(a) Gram-stained cells of L. pneumophila from lung tissue of a legionellosis victim. (b) Cells of L. pneumophila can be positively identified using fluorescent anti–L. pneumophila antibodies (Section 29.6). (c) Colorized scanning electron micrograph of L. pneumophila cells. Cells are about 0.5×2 μm. (d) Colonies of L. pneumophila grown on a complex enrichment medium showing their typical textured surface.
Pathogenesis, Diagnosis, and Treatment
Cells of L. pneumophila invade the lungs and grow within macrophages and monocytes. Infections are often asymptomatic or produce only a mild cough, sore throat, mild headache, and fever; these self-limiting cases typically resolve themselves in 2–5 days. However, the elderly, whose resistance may be naturally reduced, and those with compromised immune systems often acquire more serious Legionella infections resulting in pneumonia. Prior to the onset of pneumonia, intestinal disorders, followed by high fever, chills, and muscle aches, are common. These symptoms precede the dry cough and chest and abdominal pains typical of legionellosis. Up to 10% of cases that reach this stage are fatal, usually as a result of respiratory failure.
Clinical detection of L. pneumophila infection is usually done by culture of the organism from bronchial washings, pleural fluid, or other body fluids or tissues (Figure 33.3d). Various serological tests can detect anti-Legionella antibodies or Legionella cells in these samples and also from patient urine, and this is used to confirm a diagnosis (Figure 33.3b). Legionellosis can be treated with antibiotics, in particular rifampin and erythromycin, and intravenous administration of erythromycin is the treatment of choice for life-threatening cases.
Epidemiology
L. pneumophila is a gram-negative, obligately aerobic rod-shaped species of the Gammaproteobacteria (Figure 33.3) and shows complex nutritional requirements, including an unusually high requirement for iron. The organism can be isolated from terrestrial and aquatic habitats as well as from legionellosis patients. Legionella pneumophila was first recognized as the pathogen that caused an outbreak of fatal pneumonia at an American Legion convention (thus the name legionellosis) in Philadelphia (USA) in 1976. Besides legionellosis, the same bacterium can also cause a milder syndrome called Pontiac fever.
L. pneumophila is present in freshwaters and in soil. It is relatively resistant to heating and chlorination, so it can spread through drinking water distribution systems (Section 22.10). The pathogen is often found in large numbers in improperly sanitized cooling towers and evaporative condensers of large air conditioning systems. The pathogen grows in the water and is disseminated in humidified aerosols. Human infection is by way of airborne droplets, but the infection does not spread from person to person.
Besides its presence in evaporative coolers and domestic water systems, L. pneumophila has also been detected in hot water tanks and spas; in the latter, it can reach high cell numbers in warm (35–45 °C), stagnant water, especially if chlorine (or other sanitizer) levels are not maintained. Many outbreaks of legionellosis have been linked to swimming pools. L. pneumophila can be eliminated from water supplies by hyperchlorination or by heating water to greater than 63 °C. Although incidence peaks in the summer months, epidemiological studies indicate that L. pneumophila infections can occur at any time of year, primarily as a result of aerosols generated from heating and cooling systems and contaminated premise water (Section 22.10) used for showering or bathing. In the United States, a few thousand cases of legionellosis are typically reported each year.
Check Your Understanding
Identify specific measures for control of Legionella pneumophila.
33.5 Typhoid Fever and Norovirus Illness
Although cholera and legionellosis are among the more lethal waterborne diseases, other waterborne pathogens also cause serious disease. We focus on two major ones here, the causative agents of typhoid (a bacterium) and norovirus gastrointestinal illness (an RNA virus).
Typhoid Fever
On a global scale, probably the most important waterborne bacterial pathogens are Vibrio cholerae (Section 33.3) and Salmonella enterica (typhi), the organism that causes typhoid fever. S. enterica (typhi) is a gram-negative, peritrichously flagellated bacterium related to Escherichia coli and other enteric bacteria (Figure 33.4a). The organism is transmitted in feces-contaminated water, and thus typhoid fever, like cholera, is primarily restricted to areas where sewage treatment and general sanitation are either absent or poorly maintained. Typhoid today is a well-entrenched endemic disease in sub-Saharan Africa, the Indian subcontinent, and Indonesia, but appears only sporadically in North America, Europe, northern Asia, and Australia.
Figure 33.4 Bacterial and viral agents of severe gastrointestinal water borne diseases.

(a) Flagella-stained cells of Salmonella enterica (typhi) showing peritrichous flagellation (Section 2.9). A single cell measures about 1×2 μm. (b) Transmission electron micrograph of virions of norovirus. A single virion is about 30 nm in diameter.
Typhoid fever progresses in several stages. Cells of the pathogen (Figure 33.4a) ingested in contaminated water (or occasionally food) reach the small intestine where they grow and enter the lymphatic system and the bloodstream; from here, the pathogen can travel to many different organs. One to two weeks later, the first symptoms of typhoid appear and include a mild fever, headache, and general malaise. During this period, the liver and spleen of the typhoid patient become heavily infected. About a week later, the fever becomes more intense (up to 40 °C), and the patient typically becomes delirious; diarrhea can occur in this stage and abdominal pain can be severe. Complications can follow, including intestinal bleeding and perforation of the small intestine. The latter releases large numbers of bacterial cells into the abdomen, leading to a condition called sepsis (systemic infection and inflammation) and possibly also to septic shock. Both of these conditions are potentially fatal, and up to 40% of sepsis cases are fatal. After about a week in this crisis stage, the symptoms of typhoid begin to diminish, and recovery occurs.
Treatment for typhoid consists of antibiotic therapy and fluid replacement to ward off dehydration. In some cases, surgery may be necessary to repair perforated intestines. Although a variety of antibiotics can kill S. enterica (typhi), resistance to many of these has developed. Isolation of the causative strain and assessment of its antibiotic sensitivity (Section 29.4) is often necessary to ensure that antibiotics will cure the infection.
In the United States, fewer than 400 cases of typhoid occur per year, but typhoid fever used to be a major public health threat before drinking water was routinely filtered and chlorinated (Figure 30.7). However, breakdown of water treatment methods, contamination of water during floods, earthquakes, and other disasters, or contamination of water supply pipes with leakage from sewer lines can propagate epidemics of typhoid fever, even in developed countries.
In some typhoid patients, the gallbladder becomes infected with the pathogen. If these individuals also have gallstones, these can become colonized with S. enterica (typhi) cells and serve as a long-term reservoir of the pathogen from which it is continuously shed into feces and urine. Such individuals are otherwise healthy “carriers” of typhoid and can transmit the disease over long periods. The notorious “Typhoid Mary,” who as a cook for hire spread typhoid throughout the New York City area for nearly 15 years beginning in the early twentieth century, was the classic example of a typhoid carrier.
Norovirus Illness
Viruses can be transmitted in water and cause human disease. Norovirus (Figure 33.4b) is one example and a common cause of gastrointestinal illness due to contaminated water (or food, Section 33.14). Norovirus is a single-stranded plus-sense RNA virus (Section 11.8) and is the leading cause of gastrointestinal illnesses worldwide (see Table 33.5). The virus specifically attacks tuft cells found in the intestinal epithelium. Normally quite rare, tuft cells proliferate during parasitic worm infections, and this likely explains why parasite-infected mice, having more tuft cells, experience more severe symptoms from exposure to norovirus than mice that do not have a worm infection. Presumably, humans would show similar responses to these infections.
Norovirus infection causes symptoms of vomiting, diarrhea, and malaise of relatively short duration. The disease is rarely fatal, although in compromised individuals (very young, elderly, or immune deficient), the significant dehydration that accompanies repeated bouts of norovirus-triggered vomiting and diarrhea can be life-threatening. A clinical diagnosis of norovirus gastrointestinal illness is made by a combination of observing symptoms and the direct detection of either viral RNA by RT-PCR (Sections 12.1 and 29.8) or viral antigens by enzyme immunoassay (Section 29.7) in samples of feces or vomit.
Norovirus disease is easily transmitted person to person or to food by the fecal–oral route. The infectious dose is very small, as exposure to as few as 10–20 norovirus virions (Figure 33.4b) is sufficient to initiate disease. The most common sources of waterborne norovirus outbreaks are well water or recreational waters that have been contaminated with sewage. Norovirus is also often the culprit when mass common-source gastrointestinal illnesses strike people on cruise ships or in long-term care facilities or other group settings. In these situations, the virus can be transmitted person to person, by contaminated food or water (usually food, such as shellfish, deli meats, and fruits and vegetables), or by any combination of these.
Check Your Understanding
Contrast the causative agents of typhoid and norovirus gastrointestinal disease.
What public health conditions allow for outbreaks of typhoid fever?
III Food as a Disease Vehicle
By their very nature, foods are nutritious substances. Proper food storage and preservation practices are thus necessary to prevent food contamination and common-source foodborne outbreaks.
Mastering Microbiology
Art Activity: Table 33.3 Microbial spoilage of fresh food
The foods we eat, whether they are fresh, prepared, or preserved, are rarely sterile. Instead, they are almost always contaminated with spoilage microorganisms of various kinds and occasionally with pathogens. Microbial activities are key to the production of some foods, such as fermented foods, but most of the microorganisms in or on food are unwelcome and diminish either food quality or safety (or both). In the next two sections, we explore the contrasting processes of food spoilage and food preservation, how food safety is assessed, and the transmission of pathogens in food. In the remainder of the chapter we focus on major foodborne diseases.
33.6 Food Spoilage and Food Preservation
Many foods provide an excellent medium for the growth of bacteria and fungi. Properly stored food can still undergo food spoilage but is usually not a vehicle for disease, assuming that it was free of pathogens to begin with. This is because with rare exception, organisms responsible for food spoilage are not the same as those that cause foodborne illnesses.
Food Spoilage
Food spoilage is any change in the appearance, smell, or taste of a food product that makes it unacceptable to the consumer, regardless of whether the change is due to microbial growth. Foods are rich in organic matter, and the physical and chemical characteristics of a food determine its susceptibility to microbial activity. With respect to spoilage, a food or food product falls into one of three categories: (1) Perishable foods include many fresh food items such as meats and many fruits and vegetables; (2) semiperishable foods include foods such as potatoes, some apples, and nuts; and (3) nonperishable foods include items such as sugar and flour. The foods in these categories differ primarily with regard to their moisture content, as measured by their water activity (aw, Section 4.15). Nonperishable foods have low moisture levels and can generally be stored for long periods without spoilage. Perishable and semiperishable foods, by contrast, typically have higher moisture levels and hence these foods must be stored under conditions that inhibit microbial growth.
Fresh foods are typically spoiled by a wide variety of bacteria and fungi (Table 33.3). The chemical properties of foods vary widely, and each food is characterized by its moisture level and the nutrients it contains as well as other factors, such as its acidity or alkalinity. As a result, each susceptible food is typically spoiled by a specific group of microorganisms. The time required for a microbial population to reach a significant level in a given food product depends on both the size of the initial inoculum and the rate of growth during the exponential phase. Microbial numbers in a food product may initially be so low that no measurable effect can be observed, with only the last few cell doublings leading to observable spoilage. Hence, an unconsumed portion of a food product that is palatable and eaten one day can be badly spoiled the next.
Table 33.3 Microbial spoilage of fresh fooda

aThe organisms listed are the most commonly observed spoilage agents of fresh, perishable foods. Many of these genera include species that are human pathogens (Chapters 31, 32, 33 and 34).
The type of food spoilage and the microbial composition of the spoilage community (Table 33.3) are functions of both the food product and the storage temperature. Food spoilage microorganisms are often psychrotolerant, meaning that although they grow best at temperatures above 20 °C, they can also grow at refrigeration temperatures (3–5 °C) (Section 4.12). However, at any given storage temperature, some species grow faster than others, and thus the composition of the microbial spoilage community of the same food product stored at different temperatures can vary significantly.
Food Preservation and Fermentation
Food storage and preservation methods are designed to slow or stop the growth of microorganisms that spoil food or that can cause foodborne disease. The major methods of food preservation include altering the temperature, acidity, or moisture level of the food, or treating it with radiation or chemicals that prevent microbial growth.
Refrigeration slows microbial growth, but a remarkable number of microorganisms, particularly bacteria, can grow at refrigeration temperatures. Storage of foods in a freezer reduces growth considerably, but slow growth still occurs in pockets of liquid water trapped within the frozen food. In general, a lower storage temperature results in less microbial growth and slower spoilage, but storage at temperatures below −20 °C is too expensive for routine use and also can negatively affect food appearance, consistency, and taste.
Heat reduces the bacterial load and can even sterilize a food product, and it is especially useful for the preservation of liquids or high-moisture foods. The limited heat treatment of pasteurization (Section 4.17) does not sterilize liquids but reduces microbial numbers and eliminates pathogens. Canning, by contrast, typically sterilizes the food but requires careful processing in a sealed container at the correct temperature for the correct length of time. If viable microorganisms remain in a can or glass jar, their growth can produce gas, causing the vessel to bulge or even explode (Figure 33.5). The environment inside a can or sealed jar is anoxic, and an important genus of anaerobic bacteria that can grow in canned foods is the endospore-forming Clostridium, one species of which causes botulism (Section 33.9 and Section 25.6).
Figure 33.5 Changes in sealed cans as a result of microbial spoilage.

(a) A normal can. The top of the can is pulled in a bit because of the normal slight vacuum inside. (b) Swelling due to gas production. (c) The can shown in b was dropped, and the gas pressure resulted in a violent explosion, tearing the lid apart.
Foods can be made drier by either physically removing the water or by adding solutes, such as salt or sugar. Extremely dry or solute-loaded foods help prevent bacterial growth, but spoilage can still occur and when it does, it is typically from fungi. Many foods are preserved by the addition of small amounts of antimicrobial chemicals. These chemicals, which include nitrites, sulfites, propionate, and benzoate along with a few others, find wide application in the food industry for enhancing or preserving food texture, color, freshness, or flavor. However, one of these flavor-enhancing additives, the sugar trehalose, stimulates the growth of Clostridioides difficile, a dangerous emerging pathogen (Section 30.7). Therefore, the benefit of any chemical food additive must be weighed against its potential to cause more harm than good by inadvertently promoting the growth of unwanted microorganisms.
Perhaps the fastest growing form of food preservation is irradiation with ionizing radiation, especially that generated by electron beam (eBeam) technology. The application of eBeam irradiation to foods causes the oxidation—and therefore deactivation—of key macromolecules in microbial cells. Such treatment has been shown to be an effective means for reducing microbial contamination of foods without adding anything to the product itself and potentially changing its form or flavor.
Many common foods and beverages are preserved through the metabolic activities of microorganisms; these are fermented foods (Figure 33.6, Table 33.4, and Figure 1.16). The fermentation process (Chapters 3 and 14) yields large amounts of natural preservative chemicals. The major bacteria important in the fermented foods industry produce organic acids or fatty acids; prime examples are the lactic acid bacteria (in fermented milk products), the acetic acid bacteria (in pickling), and the propionic acid bacteria (in certain cheeses) (Table 33.4). The yeast Saccharomyces cerevisiae produces alcohol as the preservative in the production of alcoholic beverages.
Table 33.4 Fermented foods and fermentation microorganisms

aUnless otherwise noted, these are all species of Firmicutes except for Micrococcus, which is in the Actinobacteria, and Zymomonas and Acetobacter, which are in the Alphaproteobacteria. For some of these fermented food products, see Figure 1.16 and Figure 33.6.
bYeast. Various Saccharomyces species are used in alcohol fermentations. S. cerevisiae is the common baker’s yeast. To make sourdough bread, species of Lactobacillus are used.
cNonfermented pickles are cucumbers marinated in vinegar (5–8% acetic acid).
Figure 33.6 Examples of fermented foods.

Bread, sausage meats, cheeses and many other dairy products, and fermented and pickled vegetables are food products that are produced or enhanced by fermentation reactions catalyzed by microorganisms (see also Table 33.4).
Mastering Microbiology
Art Activity: Table 33.4 Fermented foods and fermentation microorganisms
The high level of organic acids or alcohol generated from these fermentations prevents the growth of both spoilage organisms and pathogens in the fermented food product. But the fermentation process yields more than just preservatives. Depending on the product and the microbes that carry out the fermentation, many other chemicals are released that add to the overall nutritional value, taste, and aroma of a given fermented food.
Check Your Understanding
List the major food groups as categorized by their susceptibility to spoilage.
Identify physical and chemical methods used for food preservation. How does each method limit growth of microorganisms?
List some dairy, meat, beverage, and vegetable foods produced by microbial fermentation. What is the preservative in each case?
33.7 Foodborne Diseases and Food Epidemiology
Foodborne illnesses resemble waterborne illnesses in being common-source diseases (Section 30.4). Most foodborne disease outbreaks are due to improper food handling and preparation by domestic consumers; these typically affect only a few people and are rarely reported. However, occasional disease outbreaks due to breakdowns in safe food handling and preparation at restaurants or food-processing and distribution plants can affect large numbers of people in geographically widespread regions.
Foodborne Diseases and Microbial Sampling
Foodborne diseases are of two types: food infections and food poisonings; some foodborne diseases fall into both categories. Food poisoning, also called food intoxication, results from ingestion of foods containing preformed microbial toxins. The microorganisms that produced the toxins do not have to grow in the host and may not even be alive at the time the contaminated food is consumed; ingestion and activity of the toxin is what causes the illness. We previously discussed some of these toxins, notably the exotoxin of Clostridium botulinum and the superantigen toxins of Staphylococcus and Streptococcus (Sections 25.6 and 28.2). In contrast to food poisoning, food infection occurs from the ingestion of food containing sufficient numbers of viable pathogens to cause colonization and growth of the pathogen in the host, ultimately resulting in disease.
Food infections are the most common foodborne illnesses in the United States and account for four of the top five leading foodborne illnesses. Table 33.5 lists the major microorganisms that cause food infections and food poisonings in the United States.
Table 33.5 Major foodborne pathogensa

aData from the Centers for Disease Control and Prevention, Atlanta, Georgia, USA.
cThe number in parentheses is the rank of the top five foodborne pathogens in the United States.
dAll of these protists are discussed in Chapter 34.
Eight microorganisms account for the great majority of foodborne illness, hospitalizations, and deaths in the United States: Salmonella species, Clostridium perfringens, Campylobacter jejuni, Staphylococcus aureus, Listeria monocytogenes, and Escherichia coli (all bacteria); norovirus; and Toxoplasma (a protist) (Table 33.5). Four of these—norovirus, Salmonella, C. perfringens, and Campylobacter—account for nearly 90% of all foodborne illness, with norovirus (Sections 33.5 and 33.14) being the most common culprit (60%).
Rapid diagnostic methods that do not require culturing an organism have been developed to detect important food pathogens, and many of these were described in Chapter 29. Isolation of pathogens from foods usually requires preliminary treatment of the food to suspend microorganisms embedded or entrapped within. A standard method for this purpose employs a blender called a paddle blender, or Stomacher® (Figure 33.7), a device to process food samples sealed in sterile bags. Paddles in the Stomacher crush, blend, and homogenize the samples in a fashion resembling the peristaltic action of the stomach but under conditions that prevent contamination. The homogenized samples are then analyzed for specific pathogens or their products.
Figure 33.7 A paddle blender (Stomacher®).

Paddles in this specialized blender homogenize the food sample contained in a sealed and sterile bag (arrow) to mimic the peristaltic action of the human stomach. The sample is first suspended in a sterile solution to form a uniform mixture.
In addition to identifying pathogens in the food itself, disease investigators must also recover the foodborne pathogen from the diseased patient in order to establish a cause-and-effect relationship between the pathogen and the illness. In fact, identification of the same strain (not just the same species) of a particular pathogen in patients and the suspected contaminated food is the “gold standard” for linking cause and effect in a foodborne disease outbreak, and a variety of microbiological, immunological, and molecular techniques are available for these purposes (Chapter 29).
Foodborne Disease Epidemiology
An outbreak of foodborne disease can occur in a home, a school cafeteria, a college dining hall, a restaurant, a military mess hall, or anywhere a contaminated food is consumed by many individuals. In addition, central food-processing plants and distribution centers provide opportunities for contaminated foods to cause disease outbreaks far from where the food was originally processed. It is the job of the food epidemiologist to track disease outbreaks and determine their source, often down to the precise location in which the food was contaminated.
A good example of effective foodborne disease tracking is the outbreak caused by Escherichia coli O157:H7 (see Section 33.11 and Figure 33.12b) in the United States in 2006. Through culturing and molecular studies, this outbreak was linked to the consumption of contaminated packaged spinach and was quickly traced to a food-processing facility in California. The contaminated spinach was distributed nationwide from the California plant, but most disease cases were in the Midwest. In the summer of 2013, another “packaged” outbreak occurred in the Midwest but in this case was linked to lettuce instead of spinach and to the parasite Cyclospora cayetanensis (Section 34.4) instead of to the bacterium E. coli.
To be effective, foodborne disease trackers must work quickly. For example, when the first case in the E. coli spinach outbreak appeared in late August, a link to the specific spinach product was made less than a month later. Because E. coli O157:H7 has been well studied, public health officials were able to quickly identify the strain contaminating the bagged spinach. Authorities then traced this strain back to the processing plant and eventually identified a specific agricultural field near the processing plant as the source of the pathogen. Although it remains unclear how the spinach was contaminated, domestic animal manure was the likely source. During the outbreak, two foodborne disease surveillance networks, FoodNet (Centers for Disease Control and Prevention) and PulseNet (an international molecular typing network for foodborne diseases), played important roles in exposing and ending the outbreak.
The spinach E. coli epidemic, although serious and even deadly for some, was discovered, contained, and stopped very quickly. However, this incident shows how centralized food-processing facilities can quickly spread disease to distant populations. Because of this, food hygiene standards and surveillance must be maintained at the highest possible level at all times in restaurants and central food-processing and distribution facilities.
Check Your Understanding
Distinguish between food infection and food poisoning.
Describe microbial sampling procedures for solid foods such as meat.
Describe how a foodborne disease outbreak is tracked.
IV Food Poisoning
Food poisoning occurs from the ingestion of food contaminated by bacterial or fungal toxins and does not require the producing organism to grow in the host. Food poisoning symptoms range from short-duration, mild or severe afflictions to life-threatening conditions that can be fatal.
Food poisoning can be caused by various bacteria and a few fungi. Here we consider the gram-positive bacteria Staphylococcus aureus, Clostridium botulinum, and Clostridium perfringens, the most common causes of bacterial food poisoning. Two of these microbes—S. aureus and C. perfringens—are among the “top five” causes of foodborne illness (Table 33.5).
33.8 Staphylococcal Food Poisoning
A powerful form of food poisoning is caused by enterotoxins (Section 25.6) produced by the gram-positive bacterium Staphylococcus aureus (Figure 33.8; Section 16.7). This organism is commonly associated with the skin and upper respiratory tract and is a frequent cause of pus-forming wounds (Section 31.9 and Figure 31.29). S. aureus can grow aerobically or anaerobically in many common foods and produces a suite of enterotoxins. When consumed, the toxins cause gastrointestinal symptoms characterized by one or more of nausea, vomiting, diarrhea, and dehydration. The onset of symptoms is rapid, within 1–6 h of ingestion depending on the amount of enterotoxin consumed, but the symptoms usually pass within 48 h.
Figure 33.8 *Staphylococcus aureus*.

(a) Gram-stained light micrograph showing the typical “cluster of grapes” morphology of staphylococci. (b) Colorized scanning electron micrograph of cells of S. aureus. A single cell is about 0.8 μm in diameter.
Staphylococcal Enterotoxins
Many S. aureus enterotoxins are heat-stable and all are stable to stomach acidity. Most strains of S. aureus produce only one or two of these toxins, and some strains are nonproducers. However, any one of the staphylococcal (“staph”) enterotoxins can cause food poisoning. The toxins pass through the stomach to the small intestine and trigger disease symptoms from there. Besides their normal gastrointestinal activities, staph enterotoxins are also superantigens and can lead to potentially lethal toxic shock syndrome (Sections 25.7 and 28.2).
S. aureus enterotoxins are given acronyms beginning with “SE” (for “staphylococcus enterotoxin”): SEA, SEB, SEC, and SED, which are encoded by the genes sea, seb, sec, and sed. Not all of these genes are on the S. aureus chromosome, but their sequences show them to be highly related. The genes seb and sec are encoded on the bacterial chromosome, sea on a lysogenic bacteriophage (Section 5.6), and sed on a plasmid. The phage- and plasmid-encoded genes can transfer the ability to make toxin to nontoxigenic strains of Staphylococcus by horizontal gene transfer (Chapter 9). SEA is the most common cause of staph food poisoning worldwide.
Disease Properties, Treatment, and Prevention
Foods may contain cells of S. aureus for several reasons. The organism may have been present on the food source itself, for example, on a meat product. More commonly, however, cells of S. aureus are introduced to the food by contamination from the food preparer or by contamination of the food product with raw meat or a contaminated sauce or dressing. A common scenario for a staph food poisoning incident is when a food preparer introduces S. aureus from nasal secretions or from an uncovered skin wound or leaking bandage into the food during its preparation. If the contaminated food is then stored at room temperature or above, the stage is set for the rapid growth of S. aureus and the production of staph enterotoxins.
Each year there are an estimated nearly quarter million cases of staphylococcal food poisoning in the United States. The foods most commonly implicated are custard- and cream-filled baked goods, poultry, eggs, raw and processed meat, puddings, and creamy salad dressings. Salads prepared with mayonnaise-based dressings or those that contain shellfish, chicken, pasta, tuna, potato, egg, or meat, are also common vehicles. Salted foods such as ham can be vehicles because of the ability of S. aureus to grow quickly in salty environments (Section 31.9). If any of these foods are contaminated with S. aureus but are refrigerated immediately after preparation, they usually remain safe because the organism grows poorly at low temperatures. But if enterotoxin has already been produced, mild heating may not make the food safe, as staph enterotoxins are stable to 60 °C.
Treatment of staph food poisoning with antibiotics is not useful because any ingested cells of S. aureus have already been killed by the acidity in the stomach and antibiotics have no effect on the enterotoxins. Rest, drinking plenty of fluids, and using anti-nausea drugs are the best prescription for a rapid recovery. As for any foodborne illness, staphylococcal food poisoning can be prevented by proper sanitation and hygiene in food production, preparation, and storage. In this regard, food preparers should practice thorough and frequent hand washing, prevent foods from coming into contact with nasal tissues and secretions, and routinely wear and frequently change disposable gloves when handling food products, especially if they have a bandaged hand wound.
In addition, thorough cleaning of plastic (polyethylene) cutting boards is essential but notoriously difficult, as the scratches and cuts that accumulate on these items tend to harbor significant numbers of microbes. Unlike wooden cutting boards, whose fibers tend to self-seal, and glass and granite boards that are not scored by cutting utensils, plastic cutting boards that retain deep cuts and scratches may be nearly impossible to clean satisfactorily. Despite this, these items are still used routinely in the food industry, even though the United States Food and Drug Agency Food Code dictates that food preparation surfaces must be smooth to ensure that sanitation protocols are effective.
Check Your Understanding
Identify the symptoms and mechanism of staphylococcal food poisoning.
Why does antibiotic treatment not affect the outcome or the severity of disease with staph food poisoning?
33.9 Clostridial Food Poisoning
The endospore-forming anaerobic bacteria Clostridium perfringens and Clostridium botulinum (Section 16.8) cause serious food poisoning. Canning and cooking procedures kill vegetative cells of these species but may not kill all endospores. If this occurs, viable endospores in the food can germinate, and the resulting cells produce toxins.
There is a clear distinction in the disease process between perfringens food poisoning and botulism. In the case of botulism, the toxin is a neurotoxin and only the toxin is required for disease. Botulism does not require the growth of C. botulinum in the human body, but growth may nevertheless occur, particularly in cases of infant botulism. By contrast, with perfringens food poisoning, a large number of cells must be ingested in order for the toxin—in this case, an enterotoxin—to be produced.
*Clostridium perfringens* Food Poisoning
Clostridium perfringens (Figure 33.9a) is commonly found in soil but can also be found in sewage, primarily because it lives in small numbers in the intestinal tract of humans and other animals. C. perfringens is the fourth most often reported cause of foodborne disease in the United States behind norovirus illnesses (Sections 33.5 and 33.14), Campylobacter infections (Section 33.12), and Salmonella infections (Section 33.10 and Table 33.5). About 1 million cases of perfringens food poisoning occur in the United States every year.
Figure 33.9 Food poisoning clostridia.

(a) Gram stain of a growing culture of Clostridium perfringens, the bacterium that causes perfringens food poisoning. A cell measures about 1×3 μm. (b) Gram stain of a sporulating culture of Clostridium botulinum, the agent of botulism. A cell measures about 1×5 μm and endospores (arrows) appear red.
C. perfringens is a proteolytic bacterium; proteins are catabolized by fermentation (Section 14.19). Perfringens food poisoning requires the ingestion of a large dose (>108) of C. perfringens cells in contaminated cooked or uncooked foods, especially high-protein foods such as meat, poultry, and fish. C. perfringens can grow in meat dishes cooked in bulk where heat penetration is often insufficient. C. perfringens grows quickly in the food, especially if left to cool at room temperature. It is when endosporulation (Section 2.8 and Figures 2.26–2.29) begins that the perfringens enterotoxin is produced. The toxin alters the permeability of the intestinal epithelium, leading to nausea, diarrhea, and intestinal cramps. The onset of perfringens food poisoning typically begins 6–24 h after consumption of the contaminated food and usually resolves within 24 h; for this reason, the disease is sometimes written off as a “stomach flu” or “24-hour flu.” Fatalities from perfringens food poisoning are rare, and no specific treatment is necessary other than replacing fluids lost from diarrhea or vomiting (if it occurs).
A diagnosis of perfringens food poisoning is made from isolation of C. perfringens from the feces or, more reliably, by an immunoassay that can detect C. perfringens enterotoxin in feces. Prevention of perfringens food poisoning requires that cooked foods not be contaminated with raw foods and that all foods be properly heated during cooking and home canning. The perfringens enterotoxin is heatlabile and thus any toxin that may have formed in a food product is destroyed by proper heating (75 °C). Cooked foods not eaten immediately should be refrigerated as soon as possible to rapidly lower temperatures and inhibit the growth of any C. perfringens that may have been present.
Botulism
Botulism is a severe and potentially fatal food poisoning caused by the consumption of food containing the exotoxin produced by C. botulinum (Figure 33.9b). This bacterium normally inhabits soil or water, but its cells or endospores may contaminate raw and processed foods. If viable endospores of C. botulinum remain in the food, they may germinate and produce botulinum toxin; ingesting even a small amount of this highly poisonous substance can cause severe illness or death.
Botulinum toxin is a neurotoxin that affects autonomic nerves that control key body functions such as respiration and heartbeat; the typical result is a flaccid paralysis (Section 25.6 and Figure 25.14). At least seven distinct botulinum toxins are known. Because the toxins are destroyed by heat (80 °C for 10 minutes), thoroughly cooked food, even if contaminated with toxin, is harmless. Much foodborne botulism is from improperly processed homecanned foods, especially nonacidic foods such as corn, potatoes, and beans. Any viable C. botulinum endospores that remain in the sealed (and now anoxic) jar may germinate during storage and produce toxin. Many of these foods are used without cooking when making cold salads, and hence any botulinum toxin present is not destroyed. Prevention of foodborne botulism thus requires careful attention to canning and related food preservation practices.
Although infants can be poisoned by toxin-contaminated food, the majority of infant botulism cases occur from toxin produced following actual infection of the infant with C. botulinum. This occurs most commonly in newborns up to about 2 months of age because they lack a well-developed intestinal microbiota that can outcompete C. botulinum. Ingested C. botulinum endospores germinate in the infant’s intestine, triggering growth and toxin production. Wound botulism can also occur from infection, presumably from endospores in contaminating material introduced via a parenteral route. Wound botulism is most commonly associated with illicit injectable drug use.
In 2017, 182 cases of botulism were confirmed in the United States, most of which (141 cases; 77%) were infant botulism; cases of foodborne and wound botulism occurred less often and with equal frequency. Although rare, botulism is always serious because of the high mortality associated with untreated disease. However, because most cases are diagnosed and treated, less than 5% of all botulism cases result in death.
Botulism is diagnosed when either botulinum toxin or C. botulinum cells are detected in the patient (or in the contaminated food) coupled with clinical observations of localized paralysis (for example, impaired vision and speech) beginning 18–36 h after ingestion of the contaminated food. Treatment for botulism is by administration of botulinum antitoxin if the diagnosis is early, and mechanical ventilation if signs of respiratory paralysis have already appeared. If the dose of toxin is not too high, infant botulism is usually self-limiting, and most infants recover with only supportive therapy, such as assisted ventilation.
Mastering Microbiology
Art Activity: Figure 33.12 Some sources of Salmonella
We move on now to consider food infections—afflictions distinct from food poisonings—with the “salmonella problem” taking stage front and center.
Check Your Understanding
Compare and contrast toxin production and toxemia in botulism and perfringens food poisoning.
Describe differences in the transmission of botulism in adults versus infants.
V Food Infection
**Food infections result from the ingestion of pathogens that colonize and multiply in the host and trigger symptoms that usually require medical intervention. Salmonella is one of the most notorious bacterial culprits in food infections, but viruses and parasites can also cause these maladies.**
Recall that food infection is not the same thing as food poisoning (Section 33.7). Food infection results from ingestion of food containing sufficient numbers of viable pathogens to allow growth of the pathogen and disease in the host. Food infections are common, and in the United States, the sum total of food infections outnumbers cases of food poisoning by nearly 10-fold. Sections 25.1 and 25.2 reviewed the infection process, summarizing the steps by which microorganisms—friend and foe alike—attach and become established in host tissues.
33.10 Salmonellosis
Salmonellosis is a gastrointestinal disease typically caused by ingesting food contaminated with Salmonella or by handling Salmonella-contaminated animals or animal products (Figure 33.10). Only Campylobacter (Section 33.12) produces more bacterial food infections than Salmonella (Table 33.5). Symptoms of salmonellosis begin after the pathogen—a gram-negative, facultatively aerobic rod related to Escherichia coli (Section 16.3 and see Figure 33.11)—colonizes the intestinal epithelium. Salmonella species normally inhabit the gastrointestinal tract of endothermic (warm-blooded) and many ectothermic (cold-blooded) animals (Figure 33.10) and are common in sewage. Thus, some cases of salmonellosis are waterborne rather than foodborne infections, and this is especially the case for typhoid fever (Section 33.5).
Figure 33.10 Some sources of *Salmonella*.

(a) Poultry contain Salmonella in their intestines and droppings. Salmonella can also be transferred to humans from both (b) reptiles and (c) amphibians. (d) Fresh chicken breasts and eggs.
The accepted species epithet for pathogenic Salmonella is enterica, and there are seven subspecies of S. enterica. Most human-associated salmonellas fall into the S. enterica subspecies enterica group. Each subspecies is also divided into serovars (serological variants). Thus, there are Salmonella enterica serovar Typhi, or Salmonella enterica (typhi) for short, and Salmonella enterica serovar Typhimurium, and so on. S. enterica serovars Typhimurium and Enteritidis are most frequently associated with foodborne salmonellosis.
Pathogenesis and Epidemiology
The most common form of salmonellosis is enterocolitis. Ingestion of food containing viable cells of Salmonella results in colonization of both the small and large intestines. From here, cells of Salmonella invade phagocytic cells and grow intracellularly, spreading to adjacent cells as host cells die. After invasion, pathogenic Salmonella deploy several virulence factors, including endotoxins, enterotoxins, and cytotoxins that damage and kill host cells (Chapter 25). Symptoms of enterocolitis typically appear 12–72 h after ingestion and include a headache, chills, nausea, vomiting, and diarrhea, followed by a fever that can last for several days. The disease normally resolves without intervention in 2–5 days. After recovery, however, patients may shed Salmonella in their feces for several weeks and some become healthy carriers. A few serovars of S. enterica may also cause septicemia (a blood infection) and enteric or typhoid fever, a potentially fatal disease characterized by systemic infection and high fever lasting several weeks (Section 33.5).
The incidence of salmonellosis in the United States has been steady over the last decade, with about 1.2 million estimated cases each year. There are several routes by which Salmonella may enter the food supply. The bacteria may reach food through fecal contamination from food handlers. Food production animals such as chickens, pigs, and cattle harbor Salmonella serovars that are pathogenic to humans, and these may be carried through to fresh foods such as eggs, meat, and dairy products (Figure 33.10d). Salmonella food infections are often traced to products such as custards, cream cakes, meringues, pies, and eggnog made with uncooked eggs. Other foods commonly implicated in salmonellosis outbreaks are meats and meat products, especially poultry, cured but uncooked sausages and other meats, milk, and milk products. The simple handling of Salmonella-contaminated animals, especially reptiles (Figure 33.10b), can also lead to salmonellosis.
Diagnosis, Treatment, and Prevention
Foodborne salmonellosis is diagnosed from a combination of clinical symptoms, a history of recent consumption of high-risk foods, and culturing of the organism from feces. Selective, differential media are used to isolate Salmonella and discriminate it from other gram-negative enteric bacteria (Figure 33.11). Tests for the presence of Salmonella are commonly carried out on foods of animal origin, such as raw meat, poultry, eggs, and powdered milk. Tests include several rapid tests (Chapter 29), but even rapid tests usually rely on enrichment procedures to increase cell numbers of Salmonella to testable levels.
Figure 33.11 Isolation of *Salmonella*.

(a) Colonies of S. enterica (typhimurium) on Hektoen agar, which contains inhibitors of gram-positive bacteria and both lactose and peptone as carbon sources. Thiosulfate in the medium is reduced to H2S by Salmonella and complexes with iron to form black FeS. Salmonella thus forms white colonies with black FeS centers, a pattern unique among enteric bacteria. The blue color results from the medium turning alkaline because Salmonella species do not ferment lactose and instead consume the amino acids in peptone. (b) Gram stain of cells of Salmonella; an average cell is about 1×3 μm.
Treatment of enterocolitis is usually unnecessary, and antibiotic treatment does not typically shorten the course of the disease or eliminate the carrier state. Foods containing Salmonella but heated to at least 70 °C are generally safe if consumed immediately, held at 50 °C or above, or quickly refrigerated. Any foods that become contaminated by an infected food handler can support the growth of Salmonella if the food is held for a long enough period, especially if it is not kept very warm or refrigerated. A recently developed anti-Salmonella bacteriophage preparation, which is sprayed directly onto foods susceptible to Salmonella contamination, may help minimize the risk of salmonellosis, especially if refrigeration is unavailable.
Check Your Understanding
Describe salmonellosis food infection. What foods and disease symptoms are typically associated with salmonellosis?
How might Salmonella contamination of food production animals be contained?
33.11 Pathogenic *Escherichia coli*
Most strains of Escherichia coli are common microbiota in the human colon and are not pathogenic. However, a few strains are potential foodborne (and occasionally waterborne) pathogens (Figure 33.12) and produce potent enterotoxins (Section 25.6). These pathogenic strains are grouped on the basis of the type of toxin they produce and their specific disease syndromes. We focus here on Shiga toxin–producing E. coli and briefly consider some other toxigenic E. coli strains.
Figure 33.12 Pathogenic *Escherichia coli*.

(a) Gram-stained cells showing the typical gram-negative, rod-shaped morphology of E. coli. (b) Colorized scanning electron micrograph of cells of E. coli O157:H7. Cells measure about 1×3 μm. (c) E. coli can be easily isolated on various selective and differential culture media such as Hektoen agar, where colonies of E. coli turn yellow because this bacterium ferments lactose and acidifies the medium (compare these with colonies of Salmonella on Hektoen agar in Figure 33.11a). (d) Enteropathogenic strains of E. coli can be detected, as in this fecal smear, using a specific fluorescent antibody (Section 29.6).
Although not in the “top five” in terms of foodborne infection pathogens (Table 33.5), pathogenic E. coli strains cause disease symptoms so severe that they often require hospitalization. Indeed, infections with pathogenic E. coli may cause life-threatening diarrheal disease and urinary tract distress.
Shiga Toxin–Producing *Escherichia coli* (STEC)
Shiga toxin–producing Escherichia coli (STEC) strains produce verotoxin, an enterotoxin similar to the Shiga toxin produced by Shigella dysenteriae, a close relative of E. coli. This toxin inhibits protein synthesis and induces a bloody diarrhea (dysentery) and kidney failure. STEC strains of E. coli are also called enterohemorrhagic E. coli (EHEC). The most widely distributed STEC is E. coli O157:H7 (Figure 33.12b). Following ingestion of food or water containing STEC (as few as 10 cells can trigger the disease), the bacteria infect the small intestine where they grow and produce verotoxin, which both causes a bloody diarrhea and initiates signs of kidney failure.
Nearly half of STEC infections are caused by the consumption of contaminated uncooked or undercooked meat, particularly mass-processed ground beef. E. coli O157:H7 is normally present in the intestines of healthy cattle and enters the human food chain if meat is contaminated with the animal’s intestinal contents during slaughter and processing. STEC strains have also been implicated in food infection outbreaks caused by dairy products (especially raw milk products), fresh fruit, and raw vegetables. Contamination of the fresh foods by fecal material, typically from cattle carrying STEC strains, has been implicated in several of these cases (Section 33.7).
Other Pathogenic *Escherichia coli*
Children in developing countries often contract diarrheal disease caused by E. coli, and E. coli can also be the cause of “traveler’s diarrhea,” a common infection causing watery diarrhea (as opposed to the bloody diarrhea of STEC strains) in travelers to developing countries. The primary causal agents here are enterotoxigenic E. coli (ETEC, Figure 33.12d). These strains infect the small intestine and produce one of two heat-labile, diarrhea-producing enterotoxins.
In studies of United States citizens traveling in Mexico, the infection rate with ETEC is often greater than 50%. The major vehicles are perishable foods, such as fresh vegetables (for example, lettuce in salads), and public water supplies. The local population is typically resistant to the ETEC strains because of long-term contact with the organism. Other pathogenic E. coli strains include enteropathogenic E. coli (EPEC) strains that cause diarrheal diseases in infants and small children but do not cause invasive disease or produce toxins, and enteroinvasive E. coli (EIEC) strains, which invade the colon and cause watery and sometimes bloody diarrhea.
Diagnosis, Treatment, and Prevention
The general pattern established for the diagnosis, treatment, and prevention of STEC infection reflects current procedures used for all pathogenic E. coli strains. Laboratory diagnosis can be accomplished by culturing the pathogen from a fecal sample (Figure 33.12c) and identifying the O (lipopolysaccharide) and H (flagellar) antigens and toxins by immunological methods (Figure 33.12d). Identification and typing can also be done using various molecular analyses, and rapid tests to detect Shiga toxin are also now available (Section 29.7).
Treatment of STEC infections includes supportive care for dehydration and monitoring of renal function, blood hemoglobin, and platelets. Bactericidal antibiotics may actually be harmful because they may trigger the release of large amounts of verotoxin from dying E. coli cells that would otherwise be voided intact in feces. For other pathogenic E. coli infections, treatment includes supportive therapy and, for severe cases and invasive disease, antimicrobial drugs to shorten and eliminate infection.
The most effective way to prevent infection with pathogenic E. coli of any type is to wash raw foods vigorously and make sure that meat, especially ground beef, is cooked thoroughly, which means that it should appear gray or brown with clear juices and have attained a temperature of greater than 70 °C. In general, proper food handling, water purification, and appropriate hygiene also prevent the spread of pathogenic E. coli. Travelers can avoid diarrhea from pathogenic E. coli by drinking only properly sealed bottled water and avoiding any uncooked foods.
Check Your Understanding
How do STEC strains of Escherichia coli differ from other pathogenic E. coli?
Why are meats prime vehicles for pathogenic E. coli? How can contaminated meat be rendered safe to eat?
33.12 Campylobacter
Causing an estimated 1.3 million cases every year, Campylobacter infection has usurped salmonellosis (Section 33.10) as the most prevalent bacterial foodborne disease in the United States in recent years (Table 33.5). Cells of Campylobacter are gram-negative and motile spiral-shaped Epsilonproteobacteria (Section 16.5) that grow best at reduced oxygen tension (microaerophilic). Several species of Campylobacter are recognized, but C. jejuni and C. fetus (Figure 33.13) are the most commonly linked to human foodborne illnesses.
Figure 33.13 *Campylobacter*.

(a) Colonies of C. jejuni grown on Campylobacter agar, a selective medium. The medium contains several antibiotics to which Campylobacter species are naturally resistant. (b) Gram stain and (c) scanning electron micrograph of cells of a Campylobacter species. Single cells average 0.4×2 μm in size.
Epidemiology and Pathology
Campylobacter is transmitted to humans via contaminated food, most commonly in undercooked poultry or pork, raw shellfish, or occasionally in feces-contaminated water from surface sources. C. jejuni is a normal resident of the intestinal tract of poultry, and according to the United States Department of Agriculture, up to 90% of turkey and chicken carcasses are contaminated with Campylobacter. Pork can also carry Campylobacter, while beef is rarely a vehicle. Campylobacter species also infect domestic animals such as dogs, causing a milder form of diarrhea in the animal than that observed in humans. Campylobacter infections in infants in particular are often traced to infected domestic animals, especially puppies and kittens, from which the bacteria are transmitted to children through the fecal–oral route.
After cells of Campylobacter are ingested, the organism multiplies in the small intestine, invades the epithelium, and causes inflammation. Because C. jejuni is sensitive to gastric acid, cell numbers as high as 104 may be required to initiate infection. However, this number may be reduced to fewer than 500 cells if the pathogen is ingested in food or if the person is taking medication to reduce stomach acid production. Campylobacter infection causes a high fever (usually greater than 40 °C), headache, malaise, nausea, abdominal cramps, and diarrhea with watery, frequently bloody emissions; symptoms subside in about a week.
Diagnosis, Treatment, and Prevention
Diagnosis of Campylobacter food infection requires isolation of the organism from feces and identification by growth-dependent tests, immunological assays, or genomic analyses. Culture media containing multiple antibiotics to which campylobacters are naturally resistant have been developed for selective isolation of this organism (Figure 33.13a). Various immunological methods are also available for diagnosing a campylobacter infection.
Antibiotic treatment with the drug azithromycin is widely practiced if a confirmed diagnosis is made from culture or culture-independent evidence. In addition, severe cases of dehydration from a Campylobacter infection may require intravenous perfusion and hospitalization. Rigorous personal hygiene, especially by those in food preparation facilities, proper washing of uncooked poultry (and any kitchenware coming in contact with uncooked poultry, such as cutting boards), and thorough cooking of meat are the major means of preventing Campylobacter infections.
Check Your Understanding
Describe the pathology of Campylobacter food infection. What are the major vehicles for this pathogen?
How might Campylobacter contamination of food production animals be controlled?
33.13 Listeriosis
Listeria monocytogenes causes listeriosis, a gastrointestinal food infection that may lead to bacteremia (bacteria in the blood) and meningitis. L. monocytogenes is a gram-positive, nonsporulating coccobacillus (phylum Firmicutes) that is acid-, salt-, and cold-tolerant and facultatively aerobic (Figure 33.14; Section 16.7). Although Listeria is a minor foodborne pathogen in terms of the number of cases observed per year, infections can be severe and cause up to 25% of all deaths from foodborne illness in the United States. Listeriosis is primarily seen in the elderly, pregnant women, newborns, and adults with weakened immune systems. Every year, L. monocytogenes is estimated to cause 1600 cases of invasive listeriosis (infection beyond the gastrointestinal tract), leading to about 260 deaths (16% mortality).
Figure 33.14 *Listeria monocytogenes*.

(a) Gram stain and (b) transmission electron micrograph of cells of L. monocytogenes, the cause of listeriosis. Cells measure about 0.5×1 μm. The Listeria cell in b is within host tissues (see Figure 33.15).
Epidemiology
L. monocytogenes is present in soil and water and although it is not common in foods, virtually no food source is safe from possible L. monocytogenes contamination. Food can become contaminated at any stage during production or processing. Ready-to-eat meats, fresh soft cheeses, unpasteurized dairy products, and inadequately pasteurized milk are the major food vehicles for Listeria, even when these foods are properly stored at refrigerator temperature (4 °C). Food preservation by refrigeration, which ordinarily prevents the growth of other foodborne pathogens, is ineffective in the case of Listeria because the organism is psychrotolerant. Cells of L. monocytogenes produce a series of branched-chained fatty acids that keep the cytoplasmic membrane functional at cold temperatures (Section 4.12).
Pathology
Immunity to L. monocytogenes is normally conferred by cell-mediated Th1 inflammatory cells (Section 27.8). However, if cells of Listeria evade these immune cells, as they can in hosts with compromised immune systems, the organism is taken up by intestinal phagocytic cells. Although one might think that this is good from the standpoint of host defense, it is actually not, because phagocytic uptake initiates the Listeria infection cycle.
Listeria cells are taken up by host phagocytic cells into a vacuole called the phagosome. This triggers production of a major Listeria virulence factor, the exotoxin listeriolysin O, and this protein lyses the phagosome and releases L. monocytogenes into the cytoplasm (Figure 33.15a; see also MicrobiologyNow in Chapter 1). Here the bacterium multiplies and produces a second major virulence factor, ActA, a protein that induces host cell actin polymerization; the actin coats the bacterial cell and assists in moving the pathogen to the host cell cytoplasmic membrane (Figure 33.15b). Once there, the bacterium–actin complex pushes out, forming protrusions called filopods, which are then taken up by surrounding phagocytic cells (Figure 33.15a). Filopod formation allows cells of L. monocytogenes to move about host tissues without exposure to the major weapons of the immune system: antibodies, complement, and neutrophils (Chapters 26 and 27).
Figure 33.15 Transmission of *Listeria* during listeriosis.

(a) Cells of Listeria are taken up in phagosomes of phagocytic cells. These are eventually lysed by the virulence factor listeriolysin O to release Listeria cells into the cytoplasm. The bacterial cells then become covered with host cell actin that assists in their movement to the cell periphery. Filopods facilitate transfer of Listeria cells to neighboring host cells, where the cycle repeats. (b) Fluorescently stained cells of Listeria monocytogenes (red) showing actin-assisted motility inside a eukaryotic cell (actin stains green, and the host cell nucleus is blue). The dashed white line labels the boundary between the two eukaryotic cells.
Mastering Microbiology
Art Activity: Figure 33.15 Transmission of Listeria during listeriosis
Cells of Listeria in the intestine cross the intestinal barrier and are carried by the lymph and blood to other organs, in particular the liver, and multiply there as they do in intestinal phagocytes. From here cells of L. monocytogenes can infect the central nervous system, where they grow in neurons and lead to inflammation of the meninges (the tissues covering the brain and spinal cord), causing meningitis. In addition to listeriolysin O, which also allows Listeria to establish chronic infections in many host tissues, other major virulence factors include phospholipases that can destroy host cell membranes, antioxidants that counter phagocytic cell oxidants, and an array of “stress proteins” common in many bacteria (Section 7.9).
Diagnosis, Treatment, and Prevention
Listeriosis is diagnosed by culturing L. monocytogenes (Figure 33.14) from the blood or cerebrospinal fluid. L. monocytogenes can be identified in foods by direct culture or by several molecular methods. The latter methods are also used to subtype clinical isolates in order to track the source(s) of infection. Intravenous antibiotic treatment with penicillin, ampicillin, or trimethoprim plus sulfamethoxazole (Bactrim®) is used to treat invasive listeriosis.
Prevention measures include recalling contaminated food and taking steps to limit L. monocytogenes contamination at the food-processing site. Because L. monocytogenes is susceptible to heat and radiation, raw food and food-handling equipment can be readily decontaminated. However, unless the finished food product is pasteurized (Section 4.17) or cooked, the risk of contamination cannot be eliminated because of the widespread distribution of the pathogen.
Check Your Understanding
What is the likely outcome of Listeria monocytogenes exposure in normal healthy individuals?
Which populations are most susceptible to serious disease from L. monocytogenes infection?
33.14 Other Foodborne Infectious Diseases
Over 200 microorganisms, viruses, and other infectious agents can cause foodborne diseases, and we have thus far summarized the major ones. Here we consider a few other bacterial pathogens that are rather uncommon compared with the “top five” (Table 33.5), and we take a second look at norovirus (previously considered as a waterborne pathogen, Section 33.5) in its more frequent context as a foodborne pathogen and overall number one cause of gastrointestinal illness in the United States.
Bacteria
Besides the major bacterial foodborne pathogens we have already considered, several other bacteria cause human gastrointestinal illnesses. Yersinia enterocolitica is an enteric bacterium commonly found in the intestines of domestic animals and causes foodborne infections from contaminated meat and dairy products. The most serious consequence of Y. enterocolitica infection is enteric fever, a severe, life-threatening infection. Y. enterocolitica can be isolated on the same selective, differential medium used to isolate Salmonella (**Figure 33.16a,*b***) but is easily distinguished from this organism on plates (compare Figures 33.11a and 33.16b).
Figure 33.16 Less common foodborne bacterial pathogens: ***Yersinia enterocolitica*** and ***Bacillus cereus***.

(a) Gram-stained cells of Y. enterocolitica. (b) Colonies of Y. enterocolitica on Hektoen agar, a selective and differential medium. Y. enterocolitica forms white colonies because this bacterium does not ferment lactose and does not produce sulfide (compare with colonies of Salmonella on Hektoen agar in Figure 33.11a and colonies of Escherichia coli on Hektoen agar in Figure 33.12c). (c) Gram-stained cells of a sporulating culture of B. cereus. (d) Large crystalline-like colonies of B. cereus formed on blood agar. Foodborne illness due to Y. enterocolitica or B. cereus is much less common than illness due to Salmonella, Campylobacter, or Clostridium perfringens.
Bacillus cereus is responsible for a relatively small number of food poisoning cases. This endospore-producing bacterium (Sections 2.8 and 16.8) produces two enterotoxins that cause different symptoms. In the emetic form, symptoms are primarily nausea and vomiting. In the diarrheal form, diarrhea and gastrointestinal distress are observed. B. cereus grows in foods such as rice, pasta, meats, or sauces that are cooked and left at room temperature to cool slowly. When endospores of this bacterium germinate, toxin is produced. Reheating may kill the B. cereus cells, but the toxin is heat-stable and may remain active. B. cereus is readily culturable and can be tentatively identified by a combination of microscopy and its typically large, grainy, and spreading colonies (Figure 33.16c, d).
The enteric bacterium Shigella causes the food infection shigellosis, and species of Vibrio can also cause food poisoning, primarily from consumption of contaminated shellfish. Most Shigella infections are the result of fecal to oral contamination, but food and water are occasional vehicles. We discussed the Shiga-like toxin produced by some pathogenic strains of Escherichia coli in Section 33.11.
Viruses
About 70% of annual foodborne infections in the United States are caused by norovirus (Figure 33.17a; Section 33.5). The virus is also known as Norwalk virus and is a single-stranded plus-sense RNA virus related to poliovirus (Section 11.8). In general, noroviral foodborne illnesses are characterized by diarrhea, often accompanied by nausea and recurrent vomiting. Recovery from norovirus infections is typically spontaneous and rapid, usually within 24–48 h (thus the disease is often nicknamed “the 24-hour bug”).
Figure 33.17 Viruses transmitted in contaminated foods.

(a) Transmission electron micrograph of norovirus; an individual virion is about 30 nm in diameter. (b) Transmission electron micrograph of hepatitis A virus; a virion is 27 nm in diameter.
Rotavirus, astrovirus, and hepatitis A make up the bulk of the remaining foodborne viral infections. These viruses inhabit the gut and are often transmitted in food or water contaminated with feces. Hepatitis A virus (HAV, Figure 33.17b) is an RNA virus that, like norovirus, is related to poliovirus, but HAV replicates in liver cells. We considered hepatitis viruses transmitted primarily by blood in Section 31.11, but HAV is mainly a foodborne virus. HAV usually triggers mild, and in many cases subclinical, symptoms, but rare cases of severe liver disease from HAV can occur. The most significant food vehicles for HAV are shellfish, usually oysters or clams harvested from water polluted by human feces and then eaten raw. In recent years, HAV has also been seen in fresh produce served without cooking.
Despite a slight uptick in incidence in recent years, the general trend for both foodborne and bloodborne hepatitis has moved steadily downward and is now at low levels, partly due to the availability of effective vaccines against both hepatitis A and hepatitis B (HBV) viruses (Figure 31.32), but also because of heightened awareness of the potential danger of eating raw shellfish. Nevertheless, widespread and likely mild HAV infections continue to occur because surveys have shown that over 30% of individuals in the United States have circulating antibodies to HAV, indicating past subclinical infections. In 2016, 2007 cases of hepatitis A were reported in the United States.
Protists and Other Agents
Important foodborne protist diseases are listed in Table 33.5. The major pathogens here include Giardia intestinalis, Cryptosporidium parvum, Cyclospora cayetanensis, and Toxoplasma gondii. G. intestinalis and C. parvum are spread in foods when contaminated water is used to wash, irrigate, or spray crops. Fresh foods such as fruits are often implicated as vehicles for these protists. Toxoplasma gondii is a protist spread primarily through cat feces, but it can also be found in raw or undercooked meat, especially pork. The incidence of foodborne transmission of C. cayetanensis has remained low (fewer than 20 cases per year) in recent years, and fresh cilantro and related produce have been the major vehicles of this pathogen in the majority of outbreaks. We discuss the diseases giardiasis, cryptosporidiosis, cyclosporiasis, and toxoplasmosis in Section 34.4.
At least one type of foodborne disease agent is neither cellular nor viral; these are the prions. Prions are proteins that adopt novel conformations, inhibiting normal protein function and causing degeneration of host neural tissues (Section 11.13). Human prion diseases are characterized by neurological symptoms including depression, loss of motor coordination, and eventual dementia. A foodborne human prion disease called variant Creutzfeldt–Jakob disease (vCJD) has been linked to consumption of meat products from cattle suffering from bovine spongiform encephalopathy (BSE), a disease caused by a prion. Although several thousand cases of vCJD were diagnosed in Great Britain in the mid-1990s, bans on cattle feeds containing rendered cattle and sheep parts and bone meal have greatly diminished the incidence of BSE in Europe and have kept the incidence of this disease extremely low in the United States.
Check Your Understanding
In what two forms can Bacillus cereus food poisoning manifest itself?
Compared with all other foodborne or waterborne pathogens, what is unique about prions?
Chapter Review
Go to Mastering Microbiology for videos, animations, practice tests, and more.
I Water as a Disease Vehicle
33.1 Contaminated drinking and recreational waters are sources of waterborne pathogens. In the United States, the number of disease outbreaks due to these sources is relatively small in relation to the large exposure the population has to water. Worldwide, lack of adequate water treatment facilities and access to clean water contribute significantly to the spread of infectious diseases.
Q What are the two main classes of water? How is water from a surface source, for example, from a lake, made safe to drink?
33.2 Drinking water quality is determined by counting coliform and fecal coliform bacteria using standardized techniques. Filtration and chlorination of water significantly decreases microbial numbers. Water purification methods in developed countries have been a major factor in improving public health, although in developing countries, waterborne illness is still a significant source of infectious disease.
Q Define the term fecal coliform and explain the coliform test. Why is the coliform test used to assess the purity of drinking water?
II Waterborne Diseases
33.3 The bacterium Vibrio cholerae causes cholera, an acute diarrheal disease associated with severe dehydration. Cholera occurs in epidemics, primarily in developing countries where sewage treatment and sanitation is lacking. Oral re-hydration and electrolyte replacement can effectively treat cholera and greatly reduce disease mortality.
Q Why are antibiotics ineffective for the treatment of cholera? What methods are useful for treating cholera victims?
33.4 Legionella pneumophila is a respiratory pathogen that causes Pontiac fever and legionellosis, a more serious infection that may result in pneumonia. L. pneumophila grows to high numbers in warm waters and is spread via cooling tower aerosols and in domestic water distribution systems where the bacterium develops in biofilms.
Q What are the major reservoirs for the pathogen that causes legionellosis? What aspects of pathogenesis distinguish this disease from other waterborne diseases?
33.5 Typhoid fever, caused by a Salmonella species, and norovirus illness are important waterborne diseases. Typhoid is common in developing countries, while norovirus illness is seen worldwide. Both of these diseases can be controlled by good sanitation practices and effective water treatment.
Q Contrast the diseases typhoid and salmonellosis (Section 33.10). How are they similar, and how do they differ? Which is the more serious disease?
III Food as a Disease Vehicle
33.6 The potential for microbial food spoilage depends on the nutrients and moisture levels of the food. Growth of microorganisms in perishable foods can be controlled by refrigeration, freezing, canning, pickling, dehydration, chemicals, and irradiation. Microbial fermentations can be used to naturally preserve many foods, including dairy products, meats, fruits and vegetables, and alcoholic beverages.
Q Identify and define the three major categories of food perishability. Why is milk more perishable than sugar even though both are rich in organic matter? Identify the major methods used to preserve food and the major categories of fermented foods.
33.7 Food poisoning results from the activities of microbial toxins, whereas food infections are due to the growth of the pathogen within the body. Identification of shared characteristics of foodborne pathogens from seemingly isolated foodborne outbreaks can pinpoint the origin of foodborne contamination and track the spread of the disease. The top five most prevalent foodborne pathogens in the United States are (1) norovirus, (2) Campylobacter jejuni, (3) Salmonella spp., (4) Clostridium perfringens, and (5) Staphylococcus aureus.
Q Distinguish between food infection and food poisoning, and give two examples of each.
IV Food Poisoning
33.8 Staphylococcal food poisoning results from the ingestion of a preformed staphylococcal enterotoxin, a superantigen produced by cells of Staphylococcus aureus as they grow in food. Proper food preparation, handling, and storage can prevent staphylococcal food poisoning.
Q What causes the symptoms of staphylococcal food poisoning? Why are cases of staph food poisoning often linked to a food preparer?
33.9 Clostridium food poisoning results from ingestion of toxins produced by microbial growth in foods or from microbial growth followed by toxin production in the body. Perfringens food poisoning is quite common and is usually a self-limiting gastrointestinal disease. Botulism is a rare but serious disease having significant mortality.
Q Identify the two major types of clostridial food poisoning. Which is most prevalent? Which is most dangerous and why?
V Food Infection
33.10 About 1.2 million cases of salmonellosis occur every year in the United States. Infection results from ingestion of cells of Salmonella introduced into food primarily from animal-derived food products or food handlers.
Q What are the possible sources ofSalmonellaspp. that cause food infections?
33.11 Toxigenic Escherichia coli strains cause many food infections, and of these, STEC strains are the most severe. Contamination of foods from animal feces spreads these pathogenic strains of E. coli, but good hygiene practices and specific antibacterial measures, such as irradiation or thorough cooking of ground beef, a major vehicle, can control disease outbreaks.
Q How doesEscherichia coliO157:H7 end up in ground beef? To what class of pathogenicE. colidoes this strain belong? How does this class differ from other classes?
33.12 With an incidence of 1.3 million cases per year, Campylobacter infection is the most prevalent foodborne bacterial disease in the United States. Poultry is a major vehicle for Campylobacter illness, whereas beef and pork are not. Proper poultry preparation and cooking can prevent Campylobacter illness.
Q Name a food product that could transmit bothSalmonellaandCampylobactersimultaneously. How could this food product be rendered safe to eat?
33.13 Listeria monocytogenes is a ubiquitous bacterium, and in healthy individuals, it seldom causes infection. However, in immunocompromised individuals, Listeria can cause serious disease as it grows as an intracellular pathogen and invades the central nervous system. Listeriosis is uncommon but shows high mortality.
Q Identify the food sources ofListeria monocytogenesinfections. How doesListeriaevade the immune system?
33.14 Viruses, especially norovirus, cause the highest incidence of foodborne illness, whereas the bacteria Bacillus cereus, Shigella spp., and Yersinia enterocolitica are only occasionally linked to foodborne disease outbreaks. Hepatitis A virus is also a serious foodborne pathogen. Some protists and prions also cause foodborne illness but are far less common foodborne pathogens than are bacteria and viruses.
Q What agent is the number one cause of gastrointestinal illness? What is the causative agent of vCJD? How does the structure of this agent differ from that of norovirus?
Application Questions
As a visitor to a country in which cholera is an endemic disease, what specific steps would you take to reduce your risk of cholera exposure? Will these precautions also prevent you from contracting other waterborne diseases? If so, which ones? Identify waterborne diseases for which your precautions may not prevent infection.
Argue a case for why perfringens foodborne illness can be considered both a food poisoning and a food infection.
Improperly prepared or handled potato salads are often the source of both staphylococcal food poisoning and salmonellosis. List some reasons why this might be the case. How do these differ from foodborne disease caused by Clostridium botulinum?
Both enterotoxigenic Escherichia coli and Clostridium botulinum cause foodborne illnesses. However, cells of one of these pathogens are rarely detected in the feces of a patient suffering from the disease, whereas cells of the other can be readily detected. Explain.
Chapter Glossary
food poisoning due to ingestion of food containing botulinum toxin produced by Clostridium botulinum Coliforms
gram-negative, nonsporulating, facultatively aerobic rods that ferment lactose with gas formation within 48 hours at 35 °C Food infection
a microbial infection resulting from the ingestion of pathogen-contaminated food followed by growth of the pathogen in the host Food poisoning (food intoxication)
a disease caused by the ingestion of food that contains preformed microbial toxins Food spoilage
a change in the appearance, smell, or taste of a food that makes it unacceptable to the consumer Listeriosis
a gastrointestinal food infection caused by Listeria monocytogenes that may lead to bacteremia and meningitis Nonperishable foods
foods of low water activity that have an extended shelf life and are resistant to spoilage by microorganisms Pasteurization
the use of controlled heat to reduce the microbial load, including both pathogens and spoilage organisms, in heat-sensitive liquids Perishable foods
fresh foods generally of high water activity that have a very short shelf life because of spoilage by microbial growth Potable
in water purification, drinkable; safe for human consumption Salmonellosis
enterocolitis or other gastrointestinal disease caused by any of several subspecies of the bacterium Salmonella Semiperishable foods
foods of intermediate water activity that have a limited shelf life because of their potential for spoilage by growth of microorganisms
34 Eukaryotic Pathogens: Fungi, Protozoa, and Helminths
34 Eukaryotic Pathogens: Fungi, Protozoa, and Helminths
## Chapter 34 Eukaryotic Pathogens: Fungi, Protozoa, and Helminths
A Silver Bullet to Kill Brain-Eating Amoebae?
One of the most difficult-to-treat infectious diseases is primary amebic meningoencephalitis (PAM), caused by the “brain-eating” parasitic amoeba Naegleria fowleri. Although fewer than five cases are reported annually in the United States, N. fowleri infections are nearly always fatal and are linked to swimming in warm, stagnant, natural waters. If such waters are accidentally inhaled, the highly invasive amoebae (yellow cells in the photomicrograph) can attach to nasal epithelial cells and burrow to the central nervous system (CNS); there they begin to ingest brain cells (red in photo) and multiply quickly. The disease progresses rapidly, and death usually occurs within a few days.
PAM is difficult to treat for two key reasons. First, because it is so rare, diagnosis is often delayed, with the unfortunate result being cerebral hemorrhaging and rapid loss of brain cells to the voracious amoebae. Second, the pathogen in this case is a eukaryote. Thus, significant similarities between cells of the amoeba and those of the host often produce unwanted side effects when antiparasitic drugs are administered, especially at the high concentrations required to treat CNS infections.
A current trend in modern clinical medicine is to accelerate drug development for serious diseases by repurposing pharmaceuticals already approved by the U.S. Food and Drug Administration. In this connection, one research group recently tested three anti-seizure drugs (diazepam, marketed as Valium®; phenobarbital, marketed as Luminal®; and phenytoin, marketed as Dilantin®), which readily cross the blood–brain barrier, for cytotoxic effects against N. fowleri. Although the drugs alone could kill cells of N. fowleri, cytotoxicity was greatly amplified when the drugs were attached to silver nanoparticles, which are known to have antimicrobial activity.
As demonstrated by this study, the modification and repurposing of existing drugs may prove to be a key strategy for the rapid development and implementation of new disease therapies moving forward.
Source: Anwar, A., et al. 2019. Clinically approved drugs against CNS diseases as potential therapeutic agents to target braineating amoebae. ACS Chem. Neurosci. 10: 658. doi: 10.1021 /acschemneuro.8b00484.
In this chapter we focus on eukaryotic pathogenic microorganisms. These include fungi—both molds and yeasts—and various parasitic protists. Some small helminths (worms) also cause infectious diseases, and we consider the most significant of these in the final section.
A common problem in treating human diseases caused by eukaryotic pathogens is the fact that humans are also eukaryotes. This thwarts many therapeutic strategies and often results in these diseases being highly refractory and chronic infections. This is especially true of systemic fungal pathogens, a group we consider first in our coverage of eukaryotic pathogenic microbes.
I Fungal Infections
Pathogenic fungi cause a variety of diseases ranging from superficial and subcutaneous skin infections that are relatively easy to treat to serious systemic mycoses. The latter are deep-seated, potentially life-threatening infections that are much more difficult to treat.
Fungi cause a variety of human diseases. Some are mild and self-limiting, whereas others can be firmly entrenched systemic diseases. We begin by considering some of the major fungal pathogens followed by a description of some major fungal diseases, the mycoses.
34.1 Pathogenic Fungi and Classes of Infection
The fungi include the yeasts, which normally grow as single cells, and molds, which form branching filaments called hyphae with or without septa (cross-walls); hyphae eventually intertwine to form visible masses called mycelia. The diversity of the molds and yeasts was discussed in Chapter 18.
Common Fungal Pathogens
Fortunately, most fungi are harmless to humans. Most fungi grow in nature as saprophytes on dead organic material, and in so doing, fungi are important catalysts in the carbon cycle, especially in oxic environments in soil. Fungi are also important in medicine both as agents of disease and in chemotherapy (as producers of antibiotics). Only about 50 species of fungi cause human diseases, and in healthy individuals, the incidence of serious fungal infections is low, although certain superficial fungal infections (for example, athlete’s foot) are common. In those with compromised immune systems, however, fungal infections can be systemic, reaching even the deepest of internal tissues. Such infections can cause serious health problems and be life-threatening.
Common fungal pathogens include both yeasts and molds (Figure 34.1). However, many pathogenic fungi are dimorphic, meaning that they can exist as either a yeast or in filamentous form, a feature typically dictated by environmental factors, such as temperature and moisture levels. In Histoplasma, for example, cells in laboratory culture form hyphae and mycelia and thus exist in the mold form (Figure 34.1e). By contrast, when Histoplasma causes histoplasmosis, cells grow in the host in the yeast form (see Figure 34.5a). In the mold form, spores are produced, either asexual spores—conidia—or sexual spores (Section 18.10). When filamentous fungi are cultured from an infection, the morphology of these spore-bearing structures is observed and is often a major clue in reaching a diagnosis. In addition to microscopy, a variety of clinically useful molecular and immunological tools (including fluorescent antibodies, Figure 34.1c) are also available to diagnose fungal infections. Table 34.1 lists some major fungal pathogens and the types of infections they cause.
Figure 34.1 Pathogenic fungi.

These organisms range from about 4 to 20 μm in diameter. (a) Cryptococcus neoformans yeast cells stained to reveal the capsule. (b) Trichophyton mariatii mycelia and hyphae. (c) Candida albicans yeast form stained with a fluorescent antibody. (d) Sporothrix schenckii mycelia and conidia. (e) Histoplasma capsulatum mycelia and large conidia. (f) Coccidioides immitis conidia. See fungal disease symptoms in Figure 34.5.
Table 34.1 Major pathogenic fungal diseasesa

aSymptoms of many of these diseases are shown in Figures 34.3–34.5.
bAspergillus can also cause allergies, toxemia, and limited infections.
cAn opportunistic pathogen frequently infecting individuals with HIV/AIDS.
Fungal Disease Classes and Treatment
Fungi cause disease through three major mechanisms: inappropriate immune responses, toxin production, and mycosis. Some fungi trigger immune responses that result in allergic (hypersensitivity) reactions following exposure to specific fungal antigens. Reexposure to the same fungi, whether growing on the host or in the environment, may cause allergic symptoms. For example, Aspergillus spp. (Figure 34.2a), common saprophytes often found in nature as a leaf mold, produce potent allergens, triggering asthma attacks or other hypersensitivity reactions in susceptible individuals.
Figure 34.2 *Aspergillus* and aflatoxin.

(a) Mycelia and conidia of an Aspergillus species. (b) Structure of aflatoxin B1. This toxin is one of a group of related compounds produced by Aspergillus flavus.
Mastering Microbiology
Art Activity: Table 34.1 Major pathogenic fungal diseases
Fungal disease may occur from the production of mycotoxins, a large and diverse group of fungal exotoxins (Section 25.6). The best-known examples of mycotoxins are the aflatoxins (Figure 34.2b) produced by Aspergillus flavus, a species that commonly grows on improperly stored dry foods, such as grain. Aflatoxins are highly toxic and are also carcinogenic, inducing tumors in some animals, especially in birds that feed on contaminated grain. Although aflatoxins are known to cause human liver damage including cirrhosis and even liver cancer, adults are not seriously affected by low-level aflatoxin exposure. However, chronic exposure in children can cause serious liver disease and stunt normal growth and development.
The final fungal disease-producing mechanism is through actual host infection. The growth of a fungus on or in the body is called a mycosis (plural, mycoses). Mycoses are fungal infections that range in severity from superficial to life-threatening. Mycoses fall into three classes (Table 34.1). Superficial mycoses are those in which the fungus infects only the surface layers of skin, hair, or nails (see Figure 34.3). Subcutaneous mycoses are infections of deeper layers of skin (see Figure 34.4) and are typically caused by different fungi than superficial infections (Table 34.1). The systemic mycoses are the most serious category of fungal infections. These are characterized by fungal growth in internal organs of the body (see Figure 34.5) and can be either primary or secondary infections. A primary infection occurs when an otherwise normal, healthy individual is infected with the fungal pathogen; these are rather uncommon. By contrast, a secondary infection occurs in a host that harbors a predisposing condition, such as antibiotic therapy or immunosuppression, that makes the individual more susceptible to infection.
Superficial and subcutaneous mycoses are for the most part easily treatable with topical drugs, including tolnaftate (applied topically), various azole drugs (applied either topically or orally), and griseofulvin, a relatively nontoxic drug that can be taken orally but passes through the bloodstream to the skin where it inhibits fungal growth. Chemotherapy against systemic fungal infections is more difficult because of issues with host toxicity (Section 28.6). For example, one of the most effective antifungal agents, amphotericin B, is widely used to treat systemic fungal infections but can also reduce kidney function and have other unwanted side effects. Hence, effective treatment of the most serious of the mycoses is sometimes quite difficult.
Check Your Understanding
Differentiate between superficial, subcutaneous, and systemic mycoses.
Distinguish between a primary and a secondary fungal disease. Why do those suffering from HIV/AIDS often show secondary fungal infections of major internal organs?
34.2 Fungal Diseases: Mycoses
The two extremes of fungal infection are the superficial mycoses and the systemic mycoses. Superficial mycoses are quite common, and most individuals experience at least one in their lifetime. By contrast, systemic mycoses are far less common and primarily affect the elderly or otherwise immune compromised. As people age, cell-mediated immunity slowly declines as a result of surgeries, transplantations, immunosuppressive drug treatments for rheumatism and autoimmune diseases, and the onset of other conditions, such as pulmonary decline, diabetes, and cancer. Any of these can predispose the elderly to disease. Systemic mycoses also target those of any age whose immune systems have been impaired or destroyed, for example, by HIV/AIDS (Figure 31.46). Systemic mycoses are thus diseases of opportunistic pathogens, microbes that cause disease only in those whose immune defenses can no longer fight them off (Sections 25.4 and 31.15).
Mastering Microbiology
Table 34.1 listed some of the fungi that cause superficial mycoses; collectively, these pathogens are called dermatophytes. In general, superficial mycoses can be bothersome and often recurrent infections, but they are not serious health concerns. Fungi such as Trichophyton (Figure 34.1b) cause infections of the feet (athlete’s foot) and other moist skin surfaces and are quite common (Figure 34.3a). These infections cause flaking and itchy skin and are easily transmitted by cells or spores of the pathogen present in contaminated shower stalls, gymnasium and locker room floors, contaminated shared articles such as towels or bed linens, or from close person-to-person contact. Superficial mycoses can be treated with topical antifungal creams or liquid aerosols, although prophylactic application on a long-term basis may be necessary if constant exposure to the pathogen (for example, to Trichophyton on a locker room floor) is unavoidable.
Figure 34.3 Superficial mycoses caused by *Trichophyton* spp.

(a) Athlete’s foot. (b) Ringworm on a child’s face and (c) on an adult index finger. “Jock itch” (ringworm of the groin) is another common Trichophyton infection and can occur in females as well as males. Trichophyton is a filamentous fungus (see Figure 34.1b).
Related surface mycoses include “jock itch,” an itchy infection of the groin, skin folds, or anus, and ringworm (Table 34.1). Despite the name, ringworm is a fungal infection, typically localized to the scalp or the extremities; the infection causes hair loss and inflammatory reactions (Figure 34.3b, c). These more severe superficial mycoses are usually treated topically with either miconazole nitrate or griseofulvin.
Subcutaneous Mycoses
Subcutaneous mycoses are fungal infections of deeper layers of skin than those of the superficial mycoses (Table 34.1). One disease in this class is sporotrichosis (Figure 34.4a), an occupational hazard of agricultural workers, miners, gardeners, and others who come into close and continual contact with the soil. The causative agent, Sporothrix schenckii (Figure 34.1d), is a ubiquitous soil saprophyte whose spores can enter through a cut or abrasion and infect subcutaneous tissues (Figure 34.4a). Chromoblastomycosis is due to pathogenic fungal growth in both surface (cutaneous) and subcutaneous skin layers, forming crusty, wartlike lesions on the hand (Figure 34.4b) or leg. The disease is primarily one of tropical and subtropical countries and occurs when the fungus becomes implanted under the skin from a puncture wound. Both sporotrichosis and chromoblastomycosis can be treated with oral administration of azoles.
Figure 34.4 Subcutaneous mycoses.

(a) Sporotrichosis, a subcutaneous infection caused by Sporothrix schenckii. (b) Chromoblastomycosis on the hand caused by the fungus Phialophora verrucosa. Chromoblastomycosis can also be caused by species of the fungal genera Fonsecaea and Cladosporium.
Systemic Mycoses
Systemic fungal pathogens normally live in soil, and humans become infected by inhaling airborne spores that later germinate and grow in the lungs. From there the organism migrates throughout the body, causing deep-seated infections in the lungs and other organs and in the skin. In the United States, the three major systemic mycoses are, in order of decreasing incidence: histoplasmosis, coccidioidomycosis, and blastomycosis. Mortality from these is high, about 10%.
Histoplasmosis (Figure 34.5a) is caused by Histoplasma capsulatum (Figure 34.1e), and coccidioidomycosis (San Joaquin Valley fever, Figure 34.5d) is caused by Coccidioides immitis (Figure 34.1f). Histoplasmosis is primarily a disease of rural areas in midwestern states of the United States, especially in the Ohio and Mississippi River valleys, whereas coccidioidomycosis is generally restricted to the desert regions of the southwestern United States. In more tropical climates blastomycosis, caused by Blastomyces dermatitidis, is prevalent (Figure 34.5b). Paracoccidioidomycosis, caused by the fungus Paracoccidioides brasiliensis, is primarily a subtropical disease with lesions forming on the face (Figure 34.5e) or other extremities.
Figure 34.5 Systemic mycoses.

(a) Histoplasmosis; yeast-form cells of Histoplasma (arrows) in spleen tissue. (b) Cutaneous blastomycosis on the arm. (c) Cryptococcosis; yeast-form cells (stained red) in lung tissue. (d) Coccidioidomycosis; yeast-form cells (stained blue-black) in lung tissue. (e) Paracoccidioidomycosis lesions on the face. (f) Oral thrush. Masses of Candida albicans cells (yellow) line the back of the throat. See photomicrographs of cultures of the pathogens causing most of these mycoses in Figure 34.1.
Cryptococcosis (Figure 34.5c), caused by the dimorphic yeast Cryptococcus neoformans (Figure 34.1a), can occur in virtually any organ of the body and is the major mycosis seen in HIV/AIDS patients. The dimorphic yeast Candida albicans (Figure 34.1c) is often present as a minor component of the human microbiota. However, this fungus can cause a variety of diseases, including mild vaginal infections, more serious oral infections such as thrush (Figure 34.5f), and systemic infection of virtually any organ in those with HIV/AIDS. Like Histoplasma and Coccidioides, Candida and Cryptococcus are primarily opportunistic pathogens and rarely cause life-threatening infections except in immunocompromised individuals. An exception to this is Candida auris, a close relative of Candida albicans that has recently emerged as a deadly, multidrug-resistant threat in healthcare settings (see MicrobiologyNow in the Chapter 30 opener).
Our discussion transitions now from fungi to pathogenic parasites. Like fungi, parasites are eukaryotic microorganisms, but the pathogenic parasites typically attack quite different body tissues and organs than do the pathogenic fungi.
Check Your Understanding
Give an example of a superficial, a subcutaneous, and a systemic mycosis.
Why are systemic fungal pathogens called opportunistic?
II Visceral Parasitic Infections
Visceral parasites include several pathogenic protozoa that cause diseases with symptoms ranging from mild gastroenteritis to lethal meningoencephalitis. These vicious pathogens are transmitted by various routes including contaminated food or water, environmental sources, or person-to-person contact.
Parasitism is a symbiotic relationship between two organisms, the parasite and the host (Chapters 23 and 24). The parasite derives essential nutrients from the host and may have little or no harmful effect on the host. However, in most cases, the parasite causes disease in the host. Many different phylogenetic groups of protists (Chapter 18) cause parasitic human diseases, and we examine some of the key ones here.
Parasitic infections can be either visceral—inducing vomiting, diarrhea, and other intestinal symptoms—or infections of blood and internal tissues. Some of the major diseases of human history, malaria for example, are parasitic diseases. We begin here with the visceral parasites and then consider blood and tissue parasites. Table 34.2 summarizes some major parasitic human diseases.
Table 34.2 Major parasitic human diseases

aAll are protists (Chapter 18) except for Schistosoma, a helminth.
Mastering Microbiology
Art Activity: Table 34.2 Major parasitic human diseases
34.3 Amoebae and Ciliates: Entamoeba, Naegleria, and Balantidium
34.3 Amoebae and Ciliates: Entamoeba, Naegleria, and Balantidium
34.3 Amoebae and Ciliates: *Entamoeba, Naegleria*, and *Balantidium*
The genera Entamoeba and Naegleria belong to a large group of protists, the Amoebozoa, that move by extending lobe-shaped pseudopodia (Section 18.8). Both parasites can cause serious—even fatal—infections, although Naegleria infections are very rare. Balantidium is a ciliated species of the alveolate group (Section 18.4) and is mainly a disease of tropical countries.
Amebic Dysentery
Entamoeba histolytica (Figure 34.6) is transmitted by contaminated water or occasionally through contaminated food. E. histolytica is an anaerobe, and the organism’s trophozoites (the active, motile, feeding stage of the parasite) lack mitochondria. Like another common waterborne pathogen, Giardia (Section 34.4), the trophozoites of E. histolytica produce cysts, which are the means of transmission. Ingested cysts germinate to form amoebae that grow both on and in intestinal mucosa and can consume other available human cells (Figure 34.6b). This leads to breakdown of the intestinal epithelium, tissue invasion, and ulceration that triggers diarrhea and severe intestinal cramps.
Figure 34.6 *Entamoeba histolytica*, the causative agent of amebic dysentery.

(a) Fluorescent photomicrograph of trophozoites of E. histolytica (blue) feeding on mouse intestinal cells (green); the trophozoites can be up to 60 μm in length. (b) Fluorescence photomicrograph of trophozoites of E. histolytica (green) ingesting human T cells (pink).
With further growth, the amoebae can invade the intestinal wall—a condition called dysentery, characterized by intestinal inflammation, fever, and the passage of intestinal blood and mucus, which often leads to anemia. If the infection is not treated, E. histolytica can invade the liver, the lungs, and even the brain. Growth in these tissues causes abscesses that can be fatal. Nearly 100,000 people, primarily from developing countries where untreated sewage is allowed to enter surface waters, die each year from invasive amebic dysentery. Although no vaccine is available, E. histolytica amebiasis can be treated with a variety of drugs, and the host immune system plays a significant role in recovery, as well. However, the immune response to a primary E. histolytica infection does not confer immune memory (Section 27.1), and reinfection is common.
*Naegleria* and *Balantidium* Infections
Naegleria fowleri can cause amebiasis, but in a much different form from that of E. histolytica. N. fowleri is a free-living amoeba present in soil and in runoff waters (Figure 34.7a). N. fowleri infections result from swimming or bathing in warm, soil-contaminated waters, such as warm springs or lakes and streams in summertime. N. fowleri enters the body through the nose and burrows directly into the brain. There the organism propagates, causing extensive hemorrhage and brain damage (Figure 34.7a), a condition called primary amebic meningoencephalitis. Diagnosis of an N. fowleri infection requires observation of the amoebae in cerebrospinal fluid. If a definitive diagnosis is made quickly, which is often not the case because the incidence of Naegleria meningoencephalitis is so low and the symptoms resemble those of meningitis, the drug amphotericin B can save the patient; untreated infections are almost always fatal (see also MicrobiologyNow on page 1023). Thus, although incidence of Naegleria meningoencephalitis is very low, mortality of untreated cases is near 100%, which makes this parasitic infection extremely dangerous. In the United States only 36 cases of Naegleria meningoencephalitis were reported in the 10-year period between 2008 and 2018, and virtually all were from recreational waters.
Figure 34.7 *Naegleria fowleri* and *Balantidium coli*.

(a) Trophozoites (arrows) of N. fowleri in sectioned and stained brain tissue; the parasites are 10–25 μm in length. (b) B. coli cyst (about 50 μm wide) present in a fecal sample.
Balantidium coli is a ciliated intestinal human and swine parasite that alternates between the trophozoite and cyst (Figure 34.7b) stages; only the cysts are infective. B. coli is the only known ciliated parasite of humans. Cysts, typically transmitted in feces-contaminated water, germinate in the colon and infect mucosal tissues, leading to symptoms that resemble those of amebiasis, for which the disease is sometimes mistaken. An infected patient usually experiences a spontaneous recovery or may become an asymptomatic carrier, continuously shedding B. coli cysts in the feces. Compared with amebiasis, B. coli infections are uncommon, and cases are rarely fatal.
Check Your Understanding
Contrast an Entamoeba and a Naegleria infection in terms of tissues infected and symptoms.
Describe a scenario for contracting a Naegleria infection.
34.4 Other Visceral Parasites: Giardia, Trichomonas, Cryptosporidium, Toxoplasma, and Cyclospora
34.4 Other Visceral Parasites: Giardia, Trichomonas, Cryptosporidium, Toxoplasma, and Cyclospora
34.4 Other Visceral Parasites: *Giardia, Trichomonas, Cryptosporidium, Toxoplasma*, and *Cyclospora*
The protists Giardia intestinalis and Trichomonas vaginalis are flagellated anaerobic parasites that contain either mitosomes or hydrogenosomes in place of mitochondria (Sections 18.1, 18.3); the parasites cause intestinal and sexually transmitted infections, respectively. The protist Cryptosporidium is transmitted primarily by contaminated water. Cryptosporidium is related to Toxoplasma, but Toxoplasma infection is primarily foodborne, as is infection by the pathogenic protist Cyclospora. We consider all five of these major human parasites here.
Giardiasis
Giardia intestinalis (also called Giardia lamblia) is typically transmitted to humans in fecally contaminated water and causes an acute gastroenteritis called giardiasis. The trophozoites of Giardia (**Figure 34.8a,*c***) produce highly resistant cysts (Figure 34.8b) that function in transmission. Ingested cysts germinate in the small intestine to form trophozoites, and these travel to the large intestine where they attach to the intestinal wall and cause the symptoms of giardiasis: an explosive, foul-smelling, watery diarrhea; intestinal cramps; flatulence; nausea; weight loss; and malaise. The distinct odor and absence of fecal blood distinguish giardiasis from diarrheas due to bacterial or viral intestinal pathogens.
Figure 34.8 *Giardia*.

(a) Fluorescently stained cells of Giardia intestinalis. (b, c) Scanning electron micrographs of (b) a giardial cyst and (c) a motile G. intestinalis trophozoite. The trophozoite is 15 μm long and the cyst about 11 μm wide.
G. intestinalis causes a significant number of infectious disease outbreaks linked to contaminated drinking water in the United States (Section 33.1). The thick-walled cysts are resistant to chlorine, and most outbreaks have been associated with water systems that used only chlorination as a means of water purification. Water subjected to proper clarification and filtration followed by chlorination or other disinfection (Section 22.9) should be free of Giardia cysts. Most surface water sources (lakes, ponds, and streams) contain Giardia cysts, as beavers and muskrats are carriers of this pathogen. This is why untreated surface waters should never be directly ingested but instead should be filtered and disinfected with iodine or chlorine or, alternatively, filtered and boiled. The drugs quinacrine, furazolidone, and metronidazole are useful for treating acute giardiasis.
Trichomoniasis
Trichomonas vaginalis (Figure 34.9) causes a sexually transmitted infection, trichomoniasis. T. vaginalis does not produce resting cells or cysts, and as a result, Trichomonas transmission is typically from person to person through sexual intercourse. However, unlike most sexually transmitted bacterial pathogens, cells of T. vaginalis can survive for several hours on moist surfaces and up to a day in urine or semen. Hence, in addition to disease transmission by intimate contact, trichomoniasis can be transmitted by contaminated fomites, such as toilet seats, sauna benches, and towels.
Figure 34.9 *Trichomonas vaginalis*.

(a) Light micrograph of stained cells; cells vary from 10 to 20 μm in diameter. (b) Light micrograph of vaginal discharge from a female with trichomoniasis. T. vaginalis cells (arrows) are present along with vaginal secretions and epithelial cells.
T. vaginalis infects the vagina in women, the prostate and seminal vesicles of men, and the urethra of both males and females. Trichomoniasis is often asymptomatic in males. By contrast, trichomoniasis in females is characterized by a yellowish vaginal discharge that causes a persistent vaginal itching and burning. The infection is more common in females; surveys have shown that up to 25% of sexually active women are infected with T. vaginalis, whereas only about 5% of sexually active males are infected (conditions in the male are less conducive to colonization by the protist). Trichomoniasis is diagnosed by observation of the motile protists in a wet mount of fluid discharged from the patient (Figure 34.9b). The antiprotozoal drug metronidazole is effective for treating trichomoniasis.
Cryptosporidiosis, Toxoplasmosis, and Cyclosporiasis
Cryptosporidium, Toxoplasma, and Cyclospora are genera of parasitic coccidia, which group among the alveolates (Section 18.4). These parasites are transmitted to humans in feces-contaminated food or water and can trigger serious bouts of diarrhea, or in the case of Toxoplasma, serious internal organ damage.
Cryptosporidium parvum infects many warm-blooded animals, in particular cattle. The organism forms small, coccoid cells that invade and grow intracellularly in mucosal epithelial cells of the stomach and intestine (Figure 34.10a), resulting in the gastrointestinal illness cryptosporidiosis. C. parvum produces thick-walled, highly resistant cysts called oocysts (Figure 34.10b), which enter water from the feces of infected animals. The infection is then transmitted to other animals and humans when they consume the feces-contaminated water.
Figure 34.10 *Cryptosporidium parvum*.

(a) Light micrograph of intracellular trophozoites of C. parvum (arrows) embedded in human gastrointestinal epithelium. The trophozoites are about 5 μm in diameter. (b) Thick-walled C. parvum oocysts are about 3 μm in diameter in this fecal sample.
Cryptosporidium oocysts are highly resistant to chlorine, and because of this, sedimentation followed by filtration is the only reliable way to remove them from water supplies. In an average year, Cryptosporidium is responsible for the majority of recreational waterborne disease outbreaks in the United States (Chapter 33) but is only occasionally associated with drinking water outbreaks. Nevertheless, C. parvum was responsible for the largest single outbreak of disease associated with drinking water ever recorded in the United States. In the spring of 1993, one-quarter of the population of Milwaukee, Wisconsin (USA), developed cryptosporidiosis from consuming water from the municipal water supply. Heavy spring rains and runoff from cattle manure on farmlands had drained into Lake Michigan, the water supply for the city, and overburdened the water purification system, leading to contamination by C. parvum.
In otherwise healthy individuals, cryptosporidiosis typically causes only a mild, self-limiting diarrhea, making treatment unnecessary. However, individuals with impaired immunity, such as that caused by HIV/AIDS, or the very young or old can develop serious complications from a C. parvum infection. For example, cryptosporidiosis is the leading cause of pediatric diarrhea worldwide, and it is responsible for nearly 9% of fatalities due to infectious disease in children. The primary laboratory diagnostic method for cryptosporidiosis is the demonstration of oocysts in feces (Figure 34.10b). Immunological and molecular tools are also available for more precise identification of strains of the pathogen when such tracking is necessary.
Like C. parvum, the parasite Cyclospora cayetanensis forms oocysts and causes a mild to occasionally severe gastroenteritis called cyclosporiasis. However, unlike C. parvum, C. cayetanensis is primarily transmitted by feces-contaminated, fresh foods rather than by contaminated water. Most cases of cyclosporiasis have been linked to contaminated fruits or vegetables. A major outbreak in the United States in the summer of 2013 was linked to packaged lettuce (Section 33.7). Another major C. cayetanensis outbreak in the United States occurred from May to August 2018, but in this incident, the outbreak was linked to multiple food items. Prepackaged vegetable trays containing broccoli, cauliflower, and carrots sold at a chain of convenience stores, and salads containing carrots, romaine lettuce, spinach, and kale sold at a fast food chain, were among the products that resulted in 2299 cases of cyclosporiasis.
Toxoplasmosis is caused by Toxoplasma gondii (Figure 34.11). This parasite infects many warm-blooded animals, and roughly half of all adults in the United States are infected but asymptomatic because their immune system keeps the organism in check. T. gondii is typically transmitted to humans in the form of cysts present in undercooked beef, pork, or lamb; by direct infection from cats, which are major carriers of T. gondii; and occasionally from contaminated water. A key step in the T. gondii life cycle is completed in felines, and thus they are obligate hosts; humans and other animals are only accidental hosts. Most transmission to humans is thus probably from cats.
Figure 34.11 *Toxoplasma*.

Tachyzoites (rapidly growing cells) of Toxoplasma gondii, an intracellular parasite. In this transmission electron micrograph, the tachyzoites (arrows) form a cystlike structure in a host cardiac cell. The Toxoplasma tachyzoites are 4–7 μm long. For a photo of T. gondii sporozoites (the infective phase of the parasite’s life cycle), see Figure 18.11b.
Toxoplasmosis can be associated with mild to severe symptoms. When cysts of T. gondii are ingested, they germinate in and penetrate the wall of the small intestine. From this initial infection, symptoms can be inapparent or apparent but indistinguishable from those of a mild case of influenza (headache, muscle ache, general malaise). However, in some infected persons, T. gondii cysts migrate from the small intestine and circulate throughout the body. Subsequently, the parasite can penetrate nerve cells and infect tissues of the brain and eyes, a pathology that has been linked to altered behaviors, such as increased risk taking, obsessive–compulsive disorder, and schizophrenia. Although disease symptoms in healthy adults are uncommon, in immunocompromised individuals, damage to the eyes, brain, and other internal organ systems occurs with higher frequency. In addition, a first-time infection with T. gondii in expectant mothers can lead to congenital infection and birth defects in newborns. Thus, pregnant women who have not been in contact with cats should avoid cats until after giving birth.
Check Your Understanding
What symptoms of giardiasis would suggest that your gastroenteritis was not due to a bacterial pathogen?
How does one contract a case of trichomoniasis? A case of toxoplasmosis?
What is unusual about the oocysts of Cryptosporidium that facilitates its transmission by a water route?
III Blood and Tissue Parasitic Infections
Parasitic protozoa and helminths that infect the blood and other tissues cause some of the most prevalent and devastating diseases in the world, many of which are endemic in tropical and subtropical regions. Malaria is the most prevalent parasitic disease worldwide.
Several human parasites infect organs and tissues other than the gastrointestinal tract and are typically transmitted by insect vectors. We begin our consideration of these with malaria, the most devastating and widespread of parasitic diseases and one that remains a major global health problem today.
34.5 *Plasmodium* and Malaria
Malaria is caused by protists of the alveolate group (Section 18.4). Several species of the protozoal genus Plasmodium cause malarial diseases in warm-blooded hosts; up to 250 million people worldwide contract malaria annually and about 600,000 die from the disease. Malaria is thus one of the most common causes of death worldwide from infectious disease and certainly the most prevalent of protozoal diseases.
In malaria, the complex parasite life cycle requires a mosquito vector. Four species of Plasmodium—P. vivax, P. falciparum, P. ovale, and P. malariae—cause most human malaria. The most widespread disease is caused by P. vivax, whereas the most serious disease is caused by P. falciparum. Humans are the only reservoirs for these four species. The protists carry out part of their life cycle in the human and part in the female Anopheles mosquito, the only vector that transmits Plasmodium spp. The vector spreads the protist from person to person.
Mastering Microbiology
Art Activity: Figure 34.12 The life cycle of Plasmodium
Malarial Life Cycle
The life cycle of Plasmodium is complex and involves a number of stages (Figure 34.12). First, the human host is infected by plasmodial sporozoites, small, elongated cells produced in the mosquito that localize in the salivary gland of the insect. The mosquito (Figure 34.12 inset) injects saliva containing the sporozoites into the human when obtaining a blood meal. The sporozoites travel to the liver where they infect liver cells. Here, some Plasmodium species, including P. vivax, may assume a dormant hypnozoite form for weeks to years, but eventually all species of the parasite replicate and become enlarged in a stage called the schizont (see Figure 34.13b). The schizonts then segment into a number of small cells called merozoites, which exit the liver into the bloodstream. Some of the merozoites then infect erythrocytes (red blood cells).
Figure 34.12 The life cycle of *Plasmodium*.
The life cycle of Plasmodium requires both an endothermic (warm-blooded) host—in this case, a human—and the mosquito vector. Transmission of the protist to and from the human host is done by the bite of an Anopheles gambiae mosquito (inset) or certain other Anopheles species. Mosquito photo courtesy of CDC/PHIL, J. Gathany.
The plasmodial life cycle in erythrocytes proceeds with repeated division, growth, and release of merozoites (Figure 34.13), resulting in destruction of the host red blood cells. Plasmodial growth in erythrocytes typically repeats at synchronized intervals of 48 h. During this period, the host experiences the defining clinical symptoms of malaria: chills followed by fever of up to 40 °C (104°F). The chill–fever pattern coincides with the release of merozoites from the erythrocytes during the synchronized reproduction cycle. Vomiting and severe headache may accompany the chill–fever cycles, and over the longer term, characteristic symptomatic malaria can alternate with asymptomatic periods. Because of the destruction of red blood cells and consumption of hemoglobin by the parasite, malaria typically causes anemia, enlargement of the spleen, and fatigue.
Figure 34.13 *Plasmodium* and malaria.

(a) Merozoites of Plasmodium falciparum (arrows) growing within human red blood cells. (b) A schizont of P. vivax (arrow) along with red blood cells. When released from the schizont, the merozoites infect erythrocytes (Figure 34.12). Red blood cells about 8 μm in diameter; merozoites are 2–3 μm in diameter.
Mastering Microbiology
Art Activity: Figure 34.13 Plasmodium and malaria
Plasmodial merozoites eventually develop into gametocytes, cells that infect only mosquitoes. The gametocytes are ingested when an Anopheles mosquito takes a blood meal from an infected person, and they mature within the mosquito into gametes. Two gametes fuse to form a zygote, and the zygote migrates by amoeboid movement (Section 18.8) to the outer wall of the insect’s intestine where it enlarges and forms several sporozoites. These are released and reach the salivary gland of the mosquito, from where they can be introduced into another person during a subsequent bite, and the cycle begins anew (Figure 34.12).
Epidemiology, Diagnosis, Treatment, and Control
Anopheles mosquitoes (Figure 34.12 inset) live predominantly in the tropics and subtropics and are the vector for malaria. Diagnosis of malaria requires the identification of Plasmodium-infected erythrocytes in blood smears (Figure 34.13a). Fluorescent nucleic acid stains, nucleic acid probes, PCR assays, and various antigen-detection methods (Chapter 29) are also used to verify Plasmodium infections or to differentiate between infections with various Plasmodium species.
Treatment of malaria is traditionally accomplished with quinine-based therapeutics, such as chloroquine. Chloroquine kills merozoites within red blood cells but does not kill sporozoites. The related drug primaquine eliminates sporozoites of P. vivax and P. ovale that may remain in liver cells. Thus treatment with both chloroquine and primaquine effectively cures malaria in some cases. More recently, the antimalarial drug artemisinin, derived from the wormwood plant originally but now made by genetically engineered yeast strains (Section 12.11 and Figure 12.37), has provided more reliable elimination of the parasite, and its use has become widespread. However, in some individuals, malaria recurs years after the primary infection when a few sporozoites not eliminated from the liver release a new generation of merozoites. Quinine- and artemisinin-resistant strains of Plasmodium are now widespread, especially in Southeast Asia where the prevalence of malaria is extremely high. As a result, combination therapy, in which the malaria patient is treated with several antimalarial drugs at once, is now a common form of treatment.
Malaria can be controlled by either draining swamps and other mosquito breeding areas or by eliminating the vector with insecticides. Together, these measures have all but eliminated malaria in the United States, with most cases being imported. Several malaria vaccines are also in development, including synthetic peptide vaccines, recombinant particle vaccines, and DNA vaccines (Sections 12.8 and 28.3), but thus far no highly effective and reliable malaria vaccine has emerged for use in mass vaccination programs.
Check Your Understanding
Which stages of the Plasmodium life cycle occur in humans, and which in the mosquito?
What are the natural reservoirs and vectors for Plasmodium species? How can malaria be prevented or eradicated?
34.6 Leishmaniasis, Trypanosomiasis, and Chagas Disease
34.6 Leishmaniasis, Trypanosomiasis, and Chagas Disease
34.6 Leishmaniasis, Trypanosomiasis, and Chagas Disease
Parasites of the genera Leishmania and Trypanosoma are transmitted by bloodsucking insect vectors. These parasites are hemoflagellates, organisms that reside in blood or related tissues such as the liver and spleen, and they cause major human diseases, primarily in tropical and subtropical countries.
Leishmaniasis
Leishmaniasis is a parasitic disease of various forms caused by species of the genus Leishmania, a flagellated protozoan related to Trypanosoma. The disease is transmitted to humans by a bite from the sand fly (Figure 34.14a). Cutaneous leishmaniasis, caused by either L. tropica or L. mexicana, is the most common form of leishmaniasis. Following transmission of the parasite in a blood meal (Figure 34.14a, b), the parasite infects and grows within human macrophage cells (Section 26.4), leading eventually (weeks or months later) to the formation of a small nodule on the skin. The nodule then enlarges to form an ulcerous skin lesion (Figure 34.14c) that contains active parasites. In the absence of secondary bacterial infections, which are common if the ulcerated tissue is left open, the lesions heal spontaneously over a period of several months but can leave a permanent scar.
Figure 34.14 Leishmaniasis.

(a) The sand fly (genus Phlebotomus) transmits leishmaniasis in a blood meal. (b) Leishmania spp. are flagellated protozoans and the cause of leishmaniasis. (c) Cutaneous leishmaniasis showing an open ulcer on the hand.
Leishmaniasis has historically been treated with injections of pentavalent antimony (Sb5+) compounds. Although the mode of action of these compounds is unknown, it is thought that Sb5+ in some way stimulates or activates the immune response to better attack the Leishmania parasites. At present, however, many Leishmania species are resistant to antimony compounds, but a variety of other drugs are available for treating resistant cutaneous forms of the disease. Cutaneous leishmaniasis exists in over 88 tropical and subtropical countries, with an estimated prevalence of about 1 million cases worldwide. Occasional reports of the disease are documented in the United States, most often in the state of Texas.
Visceral leishmaniasis is caused by Leishmania donovani and is the most severe form of the disease. In visceral leishmaniasis, the parasite travels from the site of infection to internal organs, in particular the liver, spleen, and bone marrow. If left untreated, the visceral disease is almost always fatal. Common symptoms of visceral leishmaniasis include a cycling of fever and chills, a slow reduction in both red and white blood cell numbers, and significant enlargement of the spleen and liver that can lead to pronounced distention of the abdomen. Treatment includes injections of antimony (as for the cutaneous disease), long periods of bed rest, and blood transfusions in acute cases if blood cell counts become dangerously low. Estimates of visceral leishmaniasis prevalence worldwide are about 300,000, causing about 20,000 deaths annually. In addition, because the range of the sand fly is already broad and is increasing with climate change and tropical and subtropical deforestation, it is estimated that worldwide nearly 400 million people (over 5% of the world’s humans) could be at risk of some form of leishmaniasis.
Trypanosomiasis and Chagas Disease
Flagellated protozoans of the genus Trypanosoma (Section 18.3) cause two related forms of trypanosomiasis. Two subspecies of Trypanosoma brucei native to Africa, T. brucei gambiense and T. brucei rhodesiense, cause African trypanosomiasis, better known as African sleeping sickness. The species T. cruzi causes Chagas disease, also known as American trypanosomiasis. As discussed below, both forms of trypanosomiasis are transmitted by the bite of specific insect vectors.
Sleeping sickness is transmitted by the tsetse fly (genus Glossina; Figure 34.15a), an insect similar in dimensions to a housefly and native only to tropical regions of Africa; sleeping sickness is therefore endemic only in countries of sub-Saharan Africa. The disease begins with intermittent fever, headache, and malaise. The trypanosome parasite multiplies in the blood (Figure 34.15b) and later infects the central nervous system and grows in cerebrospinal fluid. Neurological symptoms soon begin, with the primary symptom being disrupted sleep patterns marked by random periods of extreme lethargy and drowsiness. This is due to the parasite producing the aromatic alcohol tryptophol, a derivative of the amino acid tryptophan, which triggers a sleep response. Without treatment, the infection gradually progresses to a coma, multiple organ failure, and eventually death after months or years. A variety of anti-trypanosomal drugs are available for treating sleeping sickness; some are used primarily for treating the blood infection while others are used if the disease has progressed to the neurological stage. About 10,000 new cases of sleeping sickness are reported annually, but most cases are thought to go unreported.
Figure 34.15 African trypanosomiasis and Chagas disease.

(a) The tsetse fly (genus Glossina), the vector of African trypanosomiasis. The insect is about 1 cm in length. (b) Two cells of Trypanosoma brucei (arrow), the causative agent of African sleeping sickness (African trypanosomiasis), in a blood smear. (c) The reduviid (“kissing”) bug (Triatoma infestans), the vector for Chagas disease (American trypanosomiasis). The insect is about 2 cm in length. (d) A cell of Trypanosoma cruzi (arrow), the causative agent of Chagas disease, in a blood smear.
Chagas disease, named for its discoverer, is caused by T. cruzi, a close relative of T. brucei, and is transmitted by the bite of the reduviid bug, or “kissing bug” (Figure 34.15c, d). Chagas disease mainly occurs in Latin American countries. The parasite affects several organs including the heart, gastrointestinal tract, and central nervous system, causing inflammatory reactions and tissue destruction. The acute illness is usually self-limiting, but if chronic illness develops, heart damage is significant and is the eventual cause of premature death. About 20,000 deaths due to Chagas disease occur annually in endemic Latin American countries. The disease is treated with anti-trypanosomal drugs, such as benznidazole, but currently no vaccines are available for prevention of African or American trypanosomiases.
Check Your Understanding
How are trypanosome diseases similar to malaria and how do they differ?
How do the symptoms of cutaneous and visceral leishmaniasis differ?
How are sleep patterns altered in cases of African trypanosomiasis?
34.7 Parasitic Helminths: Schistosomiasis and Filariases
34.7 Parasitic Helminths: Schistosomiasis and Filariases
34.7 Parasitic Helminths: Schistosomiasis and Filariases
Some parasitic diseases are caused by helminths, tiny worms that burrow into the human host and cause debilitating diseases and death. We consider the most widespread of these, schistosomiasis, along with brief coverage of other, less common helminth infections.
Schistosomiasis
Schistosomiasis, also called snail fever, is a chronic parasitic disease caused by species of trematodes (flatworms) of the genus Schistosoma; the major species is S. mansoni and adult worms can be up to a centimeter in length (Figure 34.16a). The life cycle of the parasite requires both snails and humans (or other mammals) as hosts. Schistosome eggs (Figure 34.16b) released into a freshwater aquatic environment hatch to generate miracidia, the form of the worm that infects snails. In the snail, miracidia are transformed into cercariae (Figure 34.16c), the motile stage of the parasite that is released and infects humans.
Figure 34.16 Schistosomiasis.

(a) Adult worm of Schistosoma mansoni; the worm is about 1 cm in length. (b) An S. mansoni egg, about 0.15 mm long. The lateral spur (bottom right) is characteristic of the eggs of this species. (c) Fluorescently stained cercaria, the infective form of S. mansoni. From the head (top) to the bifurcated tail is about 1 mm. (d) Cercarial infection of the forearm. Five infection sites (arrows) are apparent.
A cercaria burrows into the skin, leaving a small surface lesion (Figure 34.16d), and then migrates to the lungs and liver; in the process, the worm establishes a long-term infection in the blood vessels. From the liver, the parasite infects the bladder, kidneys, and urethra, and the female worm produces large numbers of eggs. The eggs are shed in the urine and also pass through the intestinal wall and are shed in the feces. Large egg masses also become trapped along with fluids in the bladder, liver, and other organs, triggering an inflammatory response and severe distention of the abdomen, a condition commonly seen in infected children (Figure 34.17a). Other symptoms include bloody urine, diarrhea, and abdominal pain. Eggs as well as adult worms can live in the body for years, causing chronic symptoms that can last from youth into adulthood.
Figure 34.17 Symptoms of parasitic helminth infections.

(a) Schistosomiasis in a small child. The swollen abdomen from the accumulation of fluids and worm eggs is characteristic of the infection. (b) Bancroft’s filariasis (elephantiasis). The swollen legs are the result of edema from infection of lymph tissues by the roundworm Wuchereria bancrofti.
Schistosomiasis is a disease of tropical countries, primarily those in Africa, but some cases also occur in subtropical countries, including those of Latin America and the Caribbean region. Poverty, poor sanitation, and land use changes are typically associated with widespread infection. Although there is no vaccine, schistosomiasis is treated with the drug praziquantel, and the diagnosis is made relatively easily by assessing symptoms and observing parasite eggs in the urine and feces. Mortality from schistosomiasis is low, about 0.1%, but schistosomiasis is second only to malaria in terms of total parasitic infections worldwide. In 2017, over 220 million cases of the disease were treated, and many others probably went untreated.
Filariases
Several other parasitic helminth infections are known, and chief among these are the filariases, infections by parasitic nematodes (roundworms). Unlike the schistosomiasis parasite, these worms are clearly macroscopic in the adult stage (several centimeters in length, depending on the filariasis).
Bancroft’s filariasis (also called elephantiasis) is a chronic infection of the lymphatic system by the roundworm Wuchereria bancrofti. The worm is transmitted to humans as tiny microfilariae in a mosquito bite. Once in the host, microfilariae develop into adult worms and these interrupt lymph flow, leading to massive accumulation of fluids (edema), especially in the lower extremities. Fluid accumulation in lower regions of the body can cause severe edema of the legs (Figure 34.17b). Over 120 million people in the tropics suffer from W. bancrofti infection, but the microfilarial stage of the disease is readily treatable with antihelminthic drugs (Section 28.6) or the drug diethylcarbamazine, which kills both microfilariae and adult worms. Even simpler treatment may be available by administering antibacterial antibiotics. Although the worm itself is not sensitive to these drugs, the worm harbors an endosymbiotic bacterium, Wolbachia (Alphaproteobacteria, Sections 16.1, 32.5), which is killed by various antibiotics. If Wolbachia is eliminated by antibiotic treatment, the worms die, and so antihelminthic treatments often include antibiotics such as doxycycline (Section 28.5) to accelerate the removal of worms from the patient.
Onchocerciasis (also called river blindness) is due to a chronic infection by the large parasitic roundworm Onchocerca volvulus (Figure 34.18a). Humans are the only known host for this parasite, but biting flies are vectors when they become infected with microfilariae in a blood meal and transmit them to uninfected humans. Blackflies of the genus Simulium are the major means of transmission. The microfilariae invade the cornea, and from there the iris and retina, triggering an inflammatory response that causes scarring and partial to total loss of vision. O. volvulus infection is second only to trachoma (Section 31.13) as a cause of infectious blindness. It is estimated that about 20 million people are infected with this parasite, primarily in equatorial Africa.
Figure 34.18 The roundworms of river blindness and trichinosis.

(a) A worm larva of Onchocerca volvulus, the causative agent of river blindness. The microfilarial worm is about 0.3 mm long, but adult worms can be several centimeters in length. (b) Cysts of Trichinella spiralis containing worm larvae in muscle tissue. Unlike the much larger O. volvulus, adult worms of T. spiralis are just a few millimeters long.
The disease trichinosis (also called trichinellosis) is caused by species of the parasitic roundworm Trichinella (Figure 34.18b). This worm commonly infects the muscle tissues of wild mammals and can occasionally infect domestic animals, especially swine; about 20 cases of human trichinosis are reported in the United States each year, usually from the consumption of undercooked wild game or undercooked pork. Human infection with Trichinella begins when worm larvae enter intestinal mucosal cells, leading to either an asymptomatic condition or mild gastroenteritis. As the larvae mature and reproduce, new larvae circulate throughout the body and lead to systemic inflammatory reactions such as malaise, facial swelling, and fever. Untreated cases of trichinosis can progress to more severe organ-specific symptoms including heart damage, encephalitis, and even death. However, if properly diagnosed (usually by immunological assays on biopsied muscle tissue), trichinosis is treatable with a variety of drugs, in particular the benzimidazole class of antihelminthics.
Check Your Understanding
How does the pathogen that causes schistosomiasis differ from all other pathogens considered in this chapter?
From what source are most cases of human trichinosis contracted?
Chapter Review
Go to Mastering Microbiology for videos, animations, practice tests, and more.
I Fungal Infections
34.1 Fungi include the molds and yeasts, and some fungi are dimorphic, meaning that both mycelial and yeast phases can occur. Superficial, subcutaneous, and systemic mycoses refer to fungal infections of the skin surface, skin subsurface, and internal organs, respectively. Fungal infections can be mild or serious, depending on the health and immune status of those infected.
Q Which are more common, superficial or systemic mycoses? Have you had a case of either one?
34.2 Superficial mycoses such as athlete’s foot or jock itch are mild and easily treatable, whereas subcutaneous mycoses, such as sporotrichosis, or especially systemic mycoses, such as histoplasmosis, are more difficult to treat effectively. The ability of fungi that cause systemic mycoses to infect internal organs makes these pathogens particularly dangerous to the elderly or those otherwise immune compromised.
Q What are the most common systemic mycoses in the United States, and which populations are most susceptible to such infections?
II Visceral Parasitic Infections
34.3 The genera Entamoeba and Naegleria are amoebic human parasites that cause gastrointestinal and brain infections, respectively. Entamoeba is transmitted in feces-contaminated waters, whereas Naegleria inhabits warm, soil-contaminated waters. Balantidium is a ciliated intestinal parasite transmitted by feces-contaminated water.
Q If you were to contract one or the other, which would you rather have, anEntamoebainfection or aNaegleriainfection, and why?
34.4 The protists Giardia intestinalis and Cryptosporidium parvum are major waterborne pathogenic parasites, whereas Toxoplasma gondii is primarily a foodborne or cat-transmitted parasite, and Trichomonas vaginalis is a sexually transmitted parasite. The pathogenic parasite Cyclospora is primarily transmitted by fresh vegetables such as lettuce and spinach contaminated with animal feces. None of these parasites causes life-threatening diseases in otherwise healthy individuals, although T. gondii can trigger severe and even fatal infections in immunocompromised hosts and can cross the placenta to cause serious congenital infections.
Q In contrast to disease caused byTrichomonas, what do giardiasis and cryptosporidiosis have in common?
III Blood and Tissue Parasitic Infections
34.5 Infections with Plasmodium spp. cause malaria, a widespread, mosquito-transmitted disease of the blood that causes significant morbidity and mortality in tropical and subtropical regions of the world. Malaria is treatable with quinine-based drugs and artemisinin but is not yet preventable by vaccination.
Q Malaria symptoms include chills followed by fever. These symptoms are related to activities of the pathogen. Describe the growth stages ofPlasmodiumspp. in the human host and relate them to the chill–fever pattern.
34.6 Leishmaniasis is a parasitic disease caused by Leishmania species; the cutaneous form of the disease is most common. Trypanosoma brucei causes African trypanosomiasis (African sleeping sickness), while the related species Trypanosoma cruzi causes Chagas disease (American trypanosomiasis). All of these diseases are transmitted by the bite of specific insect vectors.
Q Contrast leishmaniasis with the two types of trypanosomiasis in terms of causative agents, symptoms, and transmission vectors.
34.7 Schistosomiasis is a prevalent parasitic disease caused by a microscopic worm, Schistosoma mansoni. The life cycle of the parasite requires both snails and mammals. The worm infects the liver and kidneys and produces large egg masses that accumulate in the body, leading to systemic inflammation and abdominal distention. Other parasitic worm diseases, such as elephantiasis and river blindness, also leave readily visible signs of infection. Trichinosis is caused by a roundworm that infects the intestine and muscle tissues and is a threat from the consumption of undercooked pork or wild game.
Q In what unusual way does the parasiteSchistosoma mansonienter the body to cause infection? Are there any physical signs of infection when it occurs?
Application Questions
Malaria eradication has been a goal of public health programs for at least 100 years. What factors preclude our ability to eradicate malaria? If an effective vaccine was developed, could malaria be eradicated?
In terms of public health, what is a common problem that unites many of the visceral parasitic infections covered in this chapter? How could this problem be attacked? Why are these diseases rare in developed countries?
Explain why the diseases malaria, leishmaniasis, and trypanosomiasis are primarily diseases of tropical regions. How could humans be affecting the future geographical ranges of these diseases?
Explain why systemic fungal infections are typically seen only in certain individuals even though many people have contact with the pathogen, whereas an outbreak of giardiasis affects virtually everyone that has come in contact with the pathogen.
Chapter Glossary
a disease characterized by intestinal ulceration and inflammation, fever, and the passage of diarrhea containing intestinal blood and mucus Leishmaniasis
a disease of the skin or viscera caused by infection with species of a parasitic flagellated protozoan, Leishmania Malaria
a disease characterized by recurrent episodes of fever and anemia; caused by species of the protist Plasmodium, usually transmitted between mammals through the bite of the Anopheles mosquito Mycosis (plural, mycoses)
any infection caused by a fungus Primary amebic meningoencephalitis
the invasion, inflammation, and destruction of brain tissue by the amoeba Naegleria fowleri or a variety of other amoebic parasites Schistosomiasis
a chronic disease caused by a parasitic worm that leads to internal organ damage and accumulation of fluids and worm egg masses Subcutaneous mycoses
fungal infections of deeper layers of skin Superficial mycoses
fungal infections of the surface layers of skin, hair, or nails Systemic mycoses
fungal growth in internal organs of the body Trypanosomiasis
any parasitic disease of the blood and internal tissues caused by species of the flagellated protozoan Trypanosoma; African sleeping sickness and Chagas disease are two major trypanosomiases
Photo Credits
Front Matter VWT: Norbert Pfennig, University of Konstanz, Germany; Ercole Canale-Parola, University of Massachusetts; Thomas D. Brock; Jörg Overmann; AP Photo/Richard Drew; NOAA; Jeremy J. Barr, Designs Stock/Shutterstock; Leah-Anne Thompson/Shutterstock; Derek J. Fisher; Michael Wagner and Marc Mussman.
Chapter 1 Chapter Opener: Courtesy of Dr. Pascale Cossart, Institut Pasteur, Paris; 1.1a: Douglas E. Caldwell, University of Saskatchewan; 1.1b: Jiri Snaidr; 1.1c: Steve Gschmeissner/Science Source; 1.2 clockwise from top left: Michael T. Madigan, PeopleImages/Getty Images, NASA/NOAA/GSFC/Suomi NPP/VIIRS/Norman Kuring, Wladimir Bulgar/Science Photo Library/Getty Images, Vladimir Nenezic/Shutterstock, Ilya Glovastskiy/123RF, Ian Lishman/Juice Images/Alamy Stock Photo, rng/Shutterstock, Jacek Chabraszewski/123RF, Scott Sinklier/Alamy Stock Photo; 1.3: Paul V. Dunlap; 1.4a top: Michael T. Madigan/John Bozzola, bottom: Reinhard Rachel and Karl O. Stetter/Verlag GmbH & Co. KG, Springer; 1.4b: John M. Martinko; 1.6a: Esther R. Angert, Cornell University; 1.6b: Heide Schulz-Vogt/Leibniz Institute for Baltic Sea Research Warnemünde (IOW); 1.8 top, bottom center: Norbert Pfennig, University of Konstanz, Germany, bottom left: Ercole Canale-Parola, University of Massachusetts, bottom right: Thomas D. Brock; Explore the Microbial World Figure 1: Kenneth H. Williams, Figure 2: Birgit Luef and Jill Banfield; 1.10a: Image produced by M. Jentoft-Nilsen, F. Hasler, D. Chesters (NASA/Goddard) and T. Nielsen (Univ. of Hawaii)/NASA Headquarters; 1.11a-c, f: Daniel H. Buckley; 1.11d, e: Norbert Pfennig, University of Konstanz, Germany; 1.14 left: Joe Burton, center: xpixel/Shutterstock; 1.15b: Scimat/Science Source; 1.16 cheese: Mylisa/Fotolia, sake: Arco Images GmbH/Alamy Stock Photo, brandy: Barton W. Spear/Pearson Education, Inc., beer: Anne-Marie Palmer/Alamy Stock Photo, sausage: Nadia Yong, yogurt: Michael T. Madigan, sauerkraut: Tatiana Volgutova/Getty Images, pickles: Vankad/Shutterstock, vinegar: focal point/Shutterstock, kombucha: FotoHelin/Shutterstock; 1.17 wastewater treatment: David Wall/Alamy Stock Photo, bioremediation: Garber/Wanderlustimages/NHPA/Photoshot/Newscom, biotechnology: Ievgen Chabanov/Alamy Stock Photo, fermentation: Konstantin Pelikh/Alamy Stock Photo, biofuels: U.S. Department of Energy; 1.18: Library of Congress; 1.19a: Thomas D. Brock; 1.19b: Library of Congress; 1.19c: Brian J. Ford; 1.20a top: Michael T. Madigan, bottom: ZEISS; 1.21a: Norbert Pfennig, University of Konstanz, Germany; 1.21b: Thomas D. Brock; 1.22 bottom right: ZEISS, inset: Michael T. Madigan; 1.23b: Leon J. Le Beau, University of Illinois at Chicago; 1.23c: ThermoFisher Scientific; 1.24: Michael T. Madigan; 1.25a, b: Richard W. Castenholz, University of Oregon; 1.25c, d: Daniel H. Buckley; 1.25e: Nancy J. Trun, National Cancer Institute; 1.26: Linda Barnett and James Barnett, University of East Anglia, UK; 1.27a: Subramanian Karthikeyan, University of Saskatchewan; 1.27b: Gernot Arp, University of Gottingen, Gottingen, Germany, and Christian Boker, Carl Zeiss Jena, Germany; 1.28: inga spence/Alamy Stock Photo; 1.29a: Stanley C. Holt, University of Texas Health Science Center; 1.29b: J. Robin Harris, Institute of Zoology, University of Mainz; 1.29c: F. Rudolf Turner, Indiana University; 1.30: CDC/PHIL; 1.32b: Michael T. Madigan; 1.34: Walter Hesse/NASA; 1.35: Robert Koch/NASA; 1.36: From Sergei Winogradsky, Microbiologie du Sol, portion of Plate IV. Paris, France: Masson et Cie Editeurs, 1949. Reproduced by permission of Dunod Editeur, Paris, France; 1.37: Paintings by Henriette Wilhelmina Beijerinck, photographed by Lesley A. Robertson for the Kluyver Laboratory Museum, Delft University of Technology, Delft, The Netherlands; 1.42a: Heidi Polumbo/US Department of Energy.
Chapter 2 Chapter Opener: X. Zhao and D. Nicastro (UTSW); 2.1a top: Stanley C. Holt, University of Texas Health Science Center, bottom: Gerhard Wanner, University of Munich, Germany; 2.7c: J.L. Pate; 2.7d: Thomas D. Brock; 2.7e, f: Akiko Umeda and K. Amako; 2.9: Leon J. Le Beau, University of Illinois at Chicago; 2.12b: Terry J. Beveridge, University of Guelph, Guelph, Ontario; 2.12c: Georg E. Schulz; 2.14a: Tanmay A.M. Bharat; 2.14b: Susan F. Koval, University of Western Ontario; 2.15a: Y. W. Yang, G. Jensen lab; 2.15b: Q. Yao, G. Jensen lab; 2.15c: R. Ramdasi, G. Jensen lab; 2.15d: J. Shi, G. Jensen lab; 2.16a: Thomas D. Brock; 2.16b: Elliot Juni, University of Michigan; 2.16c: Michael T. Madigan; 2.16d: Frank B. Dazzo and Richard Heinzen; 2.17: J. P. Duguid and J.F. Wilkinson; 2.18: Charles C. Brinton, Jr. and Judith Carnahan; 2.19a, c: Gerhard Wanner and Christine Moissl-Eichinger; 2.19b: Christine Moissl-Eichinger; 2.20b top: Michael T. Madigan, bottom: Daniel H. Buckley; 2.21a: Michael T. Madigan; 2.21b: Norbert Pfennig, University of Konstanz, Germany; 2.22: CNRS © Karim Benzerara & Stephan Borensztajn; 2.23a: Stefan Spring, Technical University of Munich, Germany; 2.23b: Richard Blakemore and W. O’Brien; 2.23c: Dennis A. Bazylinski, Iowa State University; 2.24a: Thomas D. Brock; 2.24b: A. E. Walsby, University of Bristol, Bristol, England; 2.24c: S. Pellegrini and Maria Grilli Caiola; 2.25: Hans Hippe, Deutsche Sammlung von Mikroorganismen und Zellkulturen GmbH, Braunschweig, Germany; 2.26: Hans Hippe, Deutsche Sammlung von Mikroorganismen und Zellkulturen GmbH, Braunschweig, Germany; 2.27: Judith F.M. Hoeniger and C.L. Headley; 2.28a: H. S. Pankratz, T.C. Beaman, and Philipp Gerhardt; 2.28b: Kirsten Price, Harvard University; 2.30: Einar Leifson; 2.31: Carl E. Bauer, Indiana University; 2.32a: Robert Jarosch; 2.32b: Norbert Pfennig, University of Konstanz, Germany; 2.34a left: J. Thomas Beatty; 2.34a right: David DeRosier; 2.36b: S. I. Aizawa and K. F. Jarrell; 2.36c: Electron Microscope Lab, UC Berkeley; 2.37a, b: Richard W. Castenholz, University of Oregon; 2.37c, d: Mark J. McBride, University of Wisconsin, Milwaukee; 2.40f: Nicholas Blackburn, Marine Biological Laboratory, University of Copenhagen, Denmark; 2.41a: Norbert Pfennig, University of Konstanz, Germany; 2.41b: Carl E. Bauer, Indiana University; 2.43b: Samuel F. Conti/Thomas D. Brock; 2.44: Elisabeth Pierson/Pearson Education; 2.45b, c: Don W. Fawcett/Science Source; 2.46a: Thomas D. Brock; 2.46b: blickwinkel/Alamy Stock Photo; 2.46c: T. Slankis and S. Gibbs, McGill University; 2.47a: Rupal Thazhath and Jacek Gaertig, University of Georgia; 2.47b: MolecularExpressions.com at Florida State University; 2.47c: Ohad Medalia & Wolfgang Baumeister; 2.48b: Michael T. Madigan.
Chapter 3 Chapter Opener: NASA/JPL/Space Science Institute; 3.10: Richard J. Feldmann, National Institutes of Health; 3.16b: Richard J. Feldmann, National Institutes of Health; 3.20b: Siegfried Engelbrecht Vandré; 3.24b: Frank Mayer, University of Gottingen, Germany; 3.25b: Daniel H. Buckley; 3.29a, b: Sabra et al. 2000, Appl Environ Microbiol 66(9): 4037-4044; 3.29c: Alicia M. Muro-Pastor.
Chapter 4 Chapter Opener: Dr. Susan Schlimpert; Table 4.2: Cheryl L. Broadie and John Vercillo, Southern Illinois University at Carbondale; 4.2: James A. Shapiro, University of Chicago; 4.2e: Paul V. Dunlap; 4.3b: James A. Shapiro, University of Chicago; 4.5: Deborah O. Jung and Michael T. Madigan; 4.6: Tim Tolker-Nielsen and Wen-Chi Chiang; 4.7b: Deborah Jung; 4.9: Patricia Dominguez Cuevas; 4.13b: Hubert Bahl, University of Rostock; 4.16: Tim Tolker-Nielsen and Wen-Chi Chiang; 4.17a: Michael T. Madigan; 4.17b: Janice Carr/CDC; 4.19: Science Photo Library/Alamy Stock Photo; 4.22a-c: John Gosink and James T. Staley, University of Washington; 4.22d, e: Michael T. Madigan; 4.23: John M. Martinko, inset: Thomas D. Brock; 4.24: Thomas D. Brock; 4.25a: Nancy L. Spear; 4.29a: Michael T. Madigan; 4.29b: Coy Laboratory Products; 4.32: Thomas D. Brock; 4.34c: John M. Martinko; 4.35: John M. Martinko; 4.37: Thomas D. Brock; 4.38: John M. Martinko; 4.40: Thomas D. Brock.
Chapter 5 Chapter Opener: AP Photo/Richard Drew; 5.1a: Generated by Lei Sun with support from Devika Sirohi, Zhenguo Chen, Thomas Klose, Theodore C. Pierson, Michael G. Rossmann and Richard J. Kuhn at Purdue University; 5.1b: Mikel Valle; 5.1c, d: EM DataBank; 5.1e: Dr. Christian Cambillau; 5.3: Aguilar E., Cutrona, C., Del Toro, F. J., Vallarino, J. G., Osorio, S., Perez-Bueno, M. L., Baron, M., Chung, B. M., Canto, T., Tenllado, F. 2017. Virulence determines beneficial trade-offs in the response of virus-infected plants to drought via induction of salicylic acid. Plant, Cell and Environment 40, 2909–2930; 5.4a: Jônatas Santos Abrahão; 5.4b: Chantal Abergel, IGS, UMR7256 CNRS-AMU; 5.5a: John T. Finch, Medical Research Council/Laboratory of Molecular Biology, Cambridge, UK; 5.6c: W. F. Noyes; 5.6d: Timothy S. Baker and Norman H. Olson, Purdue University; 5.7: M. Wurtz/Biozentrum, University of Basel/Science Source; 5.8a, b: Timothy Booth; 5.8c: P. W. Choppin and W. Stoeckenius; 5.8d: CDC/PHIL; 5.9a: Campos, R. K. et al. 2014. Samba virus: a novel mimivirus from a giant rain forest, the Brazilian Amazon. Virology Journal 11:95; 5.9b: Jônatas Santos Abrahão; 5.10b: Jack Parker; 5.11 left: De Agostini/P. Castano/Getty Images, right: Thomas D. Brock; 5.15: Bo Hun, Jun Liu, and Ian Molineux, Univ. Texas Science Center, Houston; 5.17b: Lei Sun and Michael G. Rossmann; 5.19a: Campos, R. K. et al. 2014. Samba virus: a novel mimivirus from a giant rain forest, the Brazilian Amazon. Virology Journal 11:95; 5.19b: Jônatas Santos Abrahão; 5.20: Stephen C. Harrison; 5.21: CDC/PHIL 17778/National Institutes of Allergy and Infectious Disease.
Chapter 6 Chapter Opener: Park, D. et al. 2018. Visualization of the type III secretion mediated Salmonella-host cell interface using cryo-electron tomography. eLife 7:e39514.; 6.3a: Stephen P. Edmondson and Elizabeth Parker; 6.3b: A. Pyne, B. Thompson, C. Lueng, D. Roy, B. W. Hoogenboom. 2014 Small 10: 3257-3621; 6.4c: S. Yoshimura, Kyoto University; 6.4d: Steven B. Zimmerman, Journal of Structural Biology; 6.6a: Somenath Bakshi and James Weisshaar; 6.8: Huntington Potter and David Dressler; 6.12b: Ernesto Arias-Palomo and James Berger, Johns Hopkins School of Medicine; 6.17b: EM DataBank; 6.18b: Sarah French; 6.19: Katsuhiko Murakami; 6.20a: EM DataBank; 6.24b: Katsuhiko Murakami; 6.32: Modified from G. Caetano-Anolles and A. Nasir. 2012. Frontiers in Genetics 3:00172; 6.35: Jenner, L. B., Yusupova, G., and Yusupov, M. RCSB Protein Databank: 4V6F; 6.40a: Chaudhry, C., Farr, G. W., Todd, M. J., Rye, H. S., Brunger, A. T., Adams, P. D., Horwich, A. L., and Sigler, P. B. RCSB Protein Databank: 1PCQ; 6.41: Zenke, R., von Gronau, S., Bolhuis, H., Gruska, M., Pfeiffer, F., and Oesterhelt, D. 2015. Front. Microbiol. 6: 249; 6.44a: Thomas C. Marlovits and Lisa Konigsmaier; 6.44b: Misha Kudryashev, Henning Stahlberg, and Marek Basler.
Chapter 7 Chapter Opener: Justin Silpe and Bonnie Bassler; 7.3b: Stephen P. Edmondson, Southern Illinois University at Carbondale, inset: Fenfei Leng; 7.8: Reprinted with permission from S. Schultz et al., Crystal structure of a CAP-DNA complex: The DNA is bent by 90 degrees. Science 253:1001-1007 (1991). © 1991 by the American Association for the Advancement of Science. Photo by Thomas A. Steitz and Steve C. Schultz; 7.15: Schwarzer, C., Fischer, H., and Machen, T. E. 2016. Chemotaxis and binding of Pseudomonas aeruginosa to scratch-wounded human cystic fibrosis airway epithelial cells. PLoS ONE 11(3): e0150109; 7.16: Dr. Ariane Briegel; 7.19: Timothy C. Johnston, Murray State University; 7.29: Jingyi Fei.
Chapter 8 Chapter Opener: Zarnowski, R. et al. 2018. Candida albicans biofilm-induced vesicles confer drug resistance through matrix biogenesis. PLoS Biol. 16(10): e2006872; 8.1a: T. Doan, R. Losick, and D. Rudner; 8.1b: Conrad L. Woldringh; 8.1c: Fabai Wu and Cees Dekker Lab; 8.1d: Pereira, A. R., Hsin, J., Krol, E., Tavares, A. C., Flores, P., Hoiczyk, E., Ng, N., Dajkovic, A., Brun, Y. V., VanNieuwenhze, M. S., Roemer, T., Carballido-Lopez, R., Scheffers, D. J., Huang, K. C., and Pinho, M. G. 2016. MBio: e00908-16; 8.2a: S. Uphoff and A. Badrinarayanan; 8.2b: Alexander von Diezmann, Andreas Gahlmann, and W.E. Moerner, Stanford University; 8.7: R. Reyes-Lamothe; 8.8b: T. den Blaauwen and Nanne Nanninga, University of Amsterdam, The Netherlands; 8.10b: Alex Formstone; 8.10c: Dr. Christine Jacobs-Wagner; 8.12: Wanda Figueroa-Cuilan and Pamela Brown; 8.13b: Akiko Umeda and K. Amako; 8.14: Pereira, A. R., Hsin, J., Krol, E., Tavares, A. C., Flores, P., Hoiczyk, E., Ng, N., Dajkovic, A., Brun, Y. V., VanNieuwenhze, M. S., Roemer, T., Carballido-Lopez, R., Scheffers, D. J., Huang, K. C., and Pinho, M.G. 2016. MBio: e00908-16; 8.17: Wang, C., Stanciu, C., Ehrhardt, C. J., Yadavalli, V. K. 2015. Journal of Microscopy 258: 49-58; 8.19: Mutlu, A. et. al. 2018. Nature Communications 9 (1): 69; 8.20: C. Fernandez-Fernandez and Justine Collier; 8.21a: Alicia M. Muro-Pastor; 8.22b: Rodney M. Donlan & Emerging Infectious Diseases; 8.24: Turnbull, L. et al. 2016. Explosive cell lysis as a mechanism for the biogenesis of bacterial membrane vesicles and biofilms. Nature Communications 7: 11220; 8.25a: Veysel Berk; 8.26a: Koerdt, A., Godeke, J. Berger. K., Thormann, K.M. and Albers, S-V. 2010. Crenarchaeal biofilm formation under extreme conditions. PLoS ONE: e14104; 8.28: Wang, Z., Fan, G., Hryc, C.F., Blaza, J.N., Serysheva, I.I., Schmid, M.F., Chiu, W., Luisi, B.F., and Du, D. RCSB Protein Databank: 5O66; 8.30: Mutlu, A. et. al. 2018. Nature Communications 9 (1): 69.
Chapter 9 Chapter Opener top: Dalia Lab, Indiana University, bottom: Nolivos, S., J. Cayron, A. Dedieu, A. Page, F. Delolme, C. Lesterlin. 2019. Role of AcrAB-TolC multidrug efflux pump in drug-resistance acquisition by plasmid transfer. Science 364: 778–782; 9.2b: Howard Shuman and Thomas Silhavy; 9.3a: Thomas D. Brock; 9.3b: Steven R. Spilatro, Department of Biology and Environmental Science, Marietta College, OH; 9.3c: Priya DasSarma and Shiladitya DasSarma; 9.4: Derek J. Fisher; 9.10: Patricia L. Foster and Sarita Mallik; 9.14: Melanie Blokesch (Swiss Federal Institute of Technology Lausanne, EPFL, Switzerland); 9.15a: Dalia Lab, Indiana University; 9.17: Melanie Blokesch; 9.19: Takehiko Kenzaka, Osaka Ohtani University; 9.21: A.B. Westbye, P.C. Fogg, J. T. Beatty; 9.22: Andrzej Stasiak. Modified fom G. Witz and A. Stasiask. 2010. Nucleic Acids Research 38:2119-2133; 9.23a: Charles C. Brinton, Jr. and Judith Carnahan; 9.23b: Peter Graumann and Thomas Rosch; 9.23c: Elisabeth Carniel; 9.24c left: Alan D.Grossman, right: A. Babic, M. Berkmen, C. Lee, and A. D. Grossman; 9.29: Masaki Shioda and S. Takayanago; 9.30: Photo credit Susanne Erdmann (UNSW). Plasmid containing membrane vesicles appearing as VLPs were discovered in Antarctic Halorubrum lacusprofundi (Erdmann et al, 2017); 9.31: Evelyne Marguet and Patrick Forterre; 9.35: George O’Toole, Geisel School of Medicine at Dartmouth.
Chapter 10 Chapter Opener: Dong, Y.,et al. 2019. Physiology, metabolism, and fossilization of hot-springs filamentous microbial mats. Astrobiology DOI:10.1089/ast.2018.1965.; 10.1: Steve Gschmeissner/Science Source; 10.3a: Centers for Disease Control and Prevention; 10.3b: Jose de la Torre and David Stahl, inset: Larry Staufer/CDC; Explore the Microbial World Figure 2: EMLab/Tommy Trenchard 2016; 10.11: Yuuji Tsukii, Protist Information Server, (protist.i.hosei.ac.jp); 10.12a: Don W. Fawcett/Science Source; 10.14a: Dave Bunnell/Under Earth Images, inset: L. Ejim, C. Groves, G. Wright; 10.15b: Gal Ofir, Sorek Lab, Weizmann Institute of Science; 10.16a: Christen B. and Christen M.; 10.20: ThermoFisher Scientific; 10.21: Flaherty, B. L., Van Nieuwerburgh, F., Head, S. R., and Golden, J. W. 2011. BMC Genomics 12:332; 10.27: Gary Siuzdak, Scripps Center for Metabolomics; 10.28: Pieter Dorrestein; 10.29b: Norbert Pfennig, University of Konstanz, Germany; 10.29c: Courtesy of Jörg Overmann and Petra Henke; 10.32b: CDC/PHIL; 10.34a: Jennifer Li-Pook-Than and Michael P. Snyder, Stanford University.
Chapter 11 Chapter Opener top: Chaikeeratisak V. et al. 2017. Assembly of a nucleus-like structure during viral replication in bacteria. Science 335:194-197.), bottom: Chaikeeratisak V. et al. 2019. Viral capsid trafficking along treadmilling tubulin filaments in bacteria. Cell 177:1771-1780); 11.1: Chantal Abergel, IGS, UMR7256 CNRS-AMU; 11.5a: Dr. D. Raoult, CNRS, Marseille, France; 11.11a: A. Dale Kaiser, Stanford University; 11.12: Courtesy of Lanying Zeng; 11.13a, b: Mark Young; 11.13c: Claire Geslin; 11.13d: David Prangishvili, Institut Pasteur; 11.13e: Courtesy of David Prangishvili and Tomohiro Mochizuki; 11.14a, b: Courtesy of Bertram Daum (University of Exeter, UK) and Werner Kühlbrandt (Max Planck Institute of Biophysics, Frankfurt, Germany); 11.14c: Image courtesy of Tessa E. F. Quax and David Prangishvili; 11.15: Mark Young; 11.16: Dr. Fred Murphy, Sylvia Whitfield/CDC; 11.17a: Dr. G. William Gary, Jr./CDC; 11.18a: Alexander Eb and Jerome Vinograd; 11.19: Dr. Fred Murphy, Sylvia Whitfield/CDC; 11.20a: R. C. Valentine; 11.21a: Dr. Joseph J. Esposito; F. A. Murphy/CDC; 11.21b: Sarah Poser/CDC; 11.22a: CDC/PHIL; 11.23a: Erskine Palmer/CDC; 11.24a: C. S. Goldsmith, and T. Tumpey/CDC; 11.25: Timothy S. Baker and Norman H. Olson, Purdue University; 11.27: Marina Lusic, University Hospital Heidelberg, Germany; 11.28a: CDC/PHIL; 11.29: Biao Ding & Yijun Qi; 11.32a: Teresa Hammett/CDC.
Chapter 12 Chapter Opener: Phillip Nadeau/MIT; 12.1 top: Norbert Pfennig, University of Konstanz, Germany, bottom: Heidi Polumbo/U.S. Department of Energy; 12.4a: Elizabeth Parker; 12.4b: Jack Parker; 12.5a: Dr. Laurie Ann Achenbach, Southern Illinois University at Carbondale; 12.5b: Megan Kempher; 12.6: Michael T. Madigan; 12.10: Daniel L. Nickrent; 12.12 left: Norbert Pfennig, University of Konstanz, Germany, center: Hans Hippe, Deutsche Sammlung von Mikroorganismen und Zellkulturen GmbH, Braunschweig, Germany, right: Michael T. Madigan; 12.17a: Martin Shields/Science Source; 12.17b: Jason A. Kahana and Pamela A. Silver, Harvard Medical School; 12.22: Stephen R. Padgette; 12.23: Kevin McBride, Calgene; 12.24: Aqua Bounty Technologies; 12.27: Hwang, I. Y., Koh, E., Wong, A., March, J. C., Bentley, W. E., Lee, Y. S., and Chang, M. W. 2017. Nature Communications 8, 15028; 12.28: Dinesh Chandra and Claudia Gravekamp; 12.30 top: Klagyi/Shutterstock, center: Puchan/Shutterstock, bottom: Karen Lau/Shutterstock; 12.31: Cinder Biological Inc.; 12.33a: Chris Standlee and DOE/NREL; 12.33b: Heidi Polumbo/U.S. Department of Energy; 12.33c: Sara E. Blumer-Schuette, Jeffrey V. Zurawski, Jonathan M. Conway, and Robert M. Kelly; 12.34 top: Todd Ciche, bottom: Marek Mis/Science Source; 12.35: Rasala, B. A., Chao, S. S., Pier, M., Barrera, D. J., and Mayfield, S. P. 2014. PLoS ONE 9(4): e94028; 12.38c: Aaron Chevalier and Matt Levy; 12.39b: Images from M. Omar Din and Jeff Hasty; 12.41: Image courtesy Clyde Hutchison and J. Craig Venter, JCVI and Thomas Deerinck and Mark Ellisman, NCMIR; 12.42c: Hiroshi Nishimasu, Osama Nureki, and Feng Zhang; 12.43 left: Joyce Van Eck and Zachary Lippman, right: Biao Ding & Yijun Qi; 12.44: Guo, R., Wang, H., Cui, J., Wang, G., Li, W., and Hu, J. F. 2015. PLoS ONE 10(10): e0141335; 12.45a: James Laboratory (UC Irvine) mosquitoes modified by Thai Binh Pham and image by Kiona M. Parker.
Chapter 13 Chapter Opener: Dr. Donald Hilvert, Dr. Angela Steinauer; 13.2: Frances Westall, Lunar and Planetary Institute; 13.3: Michael T. Madigan; 13.6a, b, e: Malcolm R. Walter, Macquarie University, New South Wales, Australia; 13.6c: Daniel H. Buckley; 13.6d: Thomas D. Brock; 13.7: J. William Schopf, University of California at Los Angeles; 13.8: John M. Hayes; 13.11: Rolf B. Pedersen; 13.14: Daniel H. Buckley; 13.25 top: Norbert Pfennig, University of Konstanz, Germany, bottom: Michael T. Madigan; Table 13.1: Norbert Pfennig, University of Konstanz, Germany.
Chapter 14 Chapter Opener: Dr. Clara S. Chan; 14.3: Jessup M. Shively, Clemson University; 14.5a: Norbert Pfennig, University of Konstanz, Germany, 14.5b: Thomas D. Brock; 14.8b: Simon Scheuring; 14.9 inset: Yuuji Tsukii, Protist Information Server, (protist.i.hosei.ac.jp); 14.10: Michael T. Madigan; 14.11a: Niels-Ulrik Frigaard; 14.14a: Susan Barns and Norman R. Pace, University of Colorado; 14.14c: Kaori Ohki, Tokai University, Shimizu, Japan; 14.15a: George Feher, University of California at San Diego; 14.15b: The model is based on PDB ID: 3I4D (Fujii et al. (2010) Photosynthetic reaction center from rhodobacter sphaeroides 2.4.1) and was visualized in the RCSB PDB (Berman et al. (2000) Nucleic Acids Research, 28: 235-242) using the NGL Viewer (Rose et al. (2018) Bioinformatics 34: 3755–3758); 14.18: Yehuda Cohen and Moshe Shilo; 14.19: Thomas D. Brock; 14.21a: William Strode; 14.21b: Thomas D. Brock; 14.23: Reproduced from Armin Ehrenreich and Friedrich Widdel, Applied and Environmental Microbiology 60:4517-4526 (1994), with permission of the American Society for Microbiology; 14.26a: Marc Strous, University of Nijmegen, The Netherlands; 14.26b: John A. Fuerst, University of Queensland, Australia; 14.32: Dianne K. Newman and Stephen Tay, previously published in Applied and Environmental Microbiology 63:2022-2028 (1997); 14.37: Thomas D. Brock; 14.41a: Antje Boetius and Armin Gieseke, Max Planck Institute for Marine Microbiology, Bremen, Germany; 14.41c: Viola Krukenberg, Katrin Knittel, and Gunter Wegener; 14.42: Laura van Niftrik and Mingliang Wu; 14.52: H. J. M. Harmsen.
Chapter 15 Chapter Opener: NASA Earth Observatory, Image by Joshua Stevens; 15.2a: Susan Barns and Norman R. Pace, University of Colorado; 15.2b-e: Daniel H. Buckley; 15.4: M. R. Edwards; 15.5: Daniel H. Buckley; 15.6: Thomas D. Brock; 15.7a: Rachel Foster; 15.7b, c: Angel White; 15.8: Daniel H. Buckley; 15.9a: Thomas D. Brock; 15.9b, c: Jörg Overmann, University of Munich, Germany; 15.10a-c: Norbert Pfennig, University of Konstanz, Germany; 15.10d: Johannes F. Imhoff, University of Kiel, Germany; 15.11a: Charles C. Remsen, University of Wisconsin at Milwaukee; 15.11b: Jeffrey C. Burnham and Samuel F. Conti; 15.12: Norbert Pfennig, University of Konstanz, Germany; 15.13a-e: Norbert Pfennig, University of Konstanz, Germany; 15.13f: Peter Hirsch, University of Kiel, Germany; 15.14a, b: Norbert Pfennig, University of Konstanz, Germany; 15.14c, d: Courtesy of Alice C. Dohnalkova; 15.15: Daniel H. Buckley; 15.16: Daniel H. Buckley; 15.17a, d: Douglas E. Caldwell, University of Saskatchewan; 15.17b, c: Jörg Overmann, University of Munich, Germany; 15.18a: Daniel H. Buckley; 15.18b: Vladimir M. Gorlenko, Institute of Microbiology, Russian Academy of Sciences; 15.18c: Charles A. Abella, University of Girona, Girona, Spain; 15.18d: Deborah Jung; 15.20a: F. Rudy Turner and Howard Gest, Indiana University; 15.20b, c: Daniel H. Buckley; 15.21a: Don Bryant; 15.21b: Amaya Garcia Costas and Donald A. Bryant; 15.23: J. H. Becking, Wageningen Agricultural University, Wageningen, Netherlands; 15.24: Harold L. Sadoff, Michigan State University; 15.25: Stanley W. Watson; 15.26a: Holger Daims, Frank Maixner, Michael Wagner; 15.26b: Holger Daims; 15.28a, b, f: Norbert Pfennig, University of Konstanz, Germany; 15.28c-e: Friedrich Widdel, Max Planck Institute for Marine Microbiology, Bremen, Germany; 15.28g: Daniel H. Buckley; 15.29a: Michael F. McGlannan, Florida International University; 15.29b: Andreas Teske; 15.30a: Jessup M. Shively, Clemson University; 15.30b: Hans-Dietrich Babenzien, Institute of Freshwater Ecology and Inland Fisheries, Neuglobsow, Germany; 15.31a: Verena Salman; 15.31b: Michael F. McGlannan, Florida International University; 15.32a: Michael Richard, Colorado State University; 15.32b: Markus Huettel, Max Planck Institute for Marine Microbiology, Bremen, Germany; 15.33: Verena Salman; 15.34a: Daniel H. Buckley; 15.34b, d: Tom Fenchel; 15.35: Derek R. Lovley; 15.36: William C. Ghiorse; 15.37: D. W. Ribbons; 15.38: Charles R. Fisher; 15.39: Susan Koval and Ryan Chanyi; 15.40a: Susan F. Koval, University of Western Ontario; 15.41: Hans Reichenbach; 15.42: Hans Reichenbach; 15.43: Patricia L. Grillione; 15.44: David White, inset: Hans Reichenbach; 15.45: E. Canale-Parola; 15.46a: E. Canale-Parola; 15.47a: Noel Krieg; 15.47b: Stanley L. Erlandsen; 15.47c: Harkisan D. Raj; 15.48: Antionette Ryter; 15.49a: B. J. Paster and E. Canale-Parola; 15.49b: Susan Koval and George Chaconas; 15.51a: Peter Hirsch; 15.51b: S. F. Conti and P. Hirsch; 15.52a: Einar Leifson; 15.52b, c: Germaine Cohen-Bazire; 15.53a: J. L. Pate; 15.53b: James T. Staley; 15.53c: Heinz Schlesner; 15.55: William C. Ghiorse; 15.56a: Thomas D. Brock; 15.56b, c: J. F. M. Hoeniger; 15.57: Richard Blakemore.
Chapter 16 Chapter Opener: J. Waters and R. Ley; 16.4: Odile Berge; 16.5a: Willy Burgdorfer; 16.5b: G. Devauchelle; 16.6: Michael T. Madigan; 16.8: James A. Shapiro, University of Chicago; 16.9a: CDC/PHIL; 16.9b: Thomas D. Brock; 16.11: Arthur Kelman, University of Wisconsin-Madison; 16.12: Cheryl L. Broadie and John Vercillo; 16.13a: Daniel E. Snyder; 16.13b: James A. Shapiro, University of Chicago; 16.14: Cheryl L. Broadie and John Vercillo, Southern Illinois University at Carbondale; 16.15: Arthur Kelman, University of Wisconsin-Madison; 16.18a, b: Otto Kandler; 16.18c: V. Bottazi; 16.19a: Bryan Larsen; 16.19b, c: Thomas D. Brock; 16.20a: Akiko Umeda, Kyushu University School of Medicine, Fukuoka, Japan; 16.20b: Susan F. Koval, University of Western Ontario; 16.21: Terry J. Beveridge, University of Guelph, Guelph, Ontario; 16.22: Hans Hippe, Deutsche Sammlung von Mikroorganismen und Zellkulturen GmbH, Braunschweig, Germany; 16.23: James R. Norris; 16.24: Dieter Claus, University of Gottingen, Germany; 16.25: Alan Rodwell; 16.26: Thomas D. Brock; 16.27: David L. Williamson; 16.28: Terry A. Krulwich, Mount Sinai School of Medicine; 16.29: Terry A. Krulwich, Mount Sinai School of Medicine; 16.30: Hans Veldkamp; 16.31: CDC/PHIL; 16.32a: N. Rist; 16.32b: Victor Lorian; 16.32c: CDC/PHIL; 16.33: CDC/PHIL; 16.34: Hubert and Mary P. Lechevalier; 16.35a: Peter Hirsch, University of Kiel, Germany; 16.35b: Hubert and Mary P. Lechevalier; 16.38a: Michael T. Madigan; 16.38b: David A. Hopwood, John Innes Centre, UK; 16.39a: © Eli Lilly and Company. Used with permission; 16.39b: David A. Hopwood, John Innes Centre, UK; 16.42: Hans Reichenbach, Gesellschaft fur Biotechnologische Forschung mbH, Braunschweig, Germany; 16.44b: Morris D. Cooper, Southern Illinois University School of Medicine; 16.45: Robert R. Friis, Tiefenau Laboratory, Bern, Switzerland; 16.46: John A. Fuerst, University of Queensland, Australia; 16.47: Margarete Schüler and Harald Engelhardt; 16.48: John Bauld, Australian Geological Survey Organisation; 16.49: Heinz Schlesner, University of Kiel, Germany; 16.50: Reinhard Rachel and Karl O. Stetter, University of Regensburg, Regensburg, Germany; 16.51a: Friedrich Widdel, Max Planck Institute for Marine Microbiology, Bremen, Germany; 16.52a: David M. Ward; 16.52b: Daniel H. Buckley; 16.52c: Reinhard Rachel and Karl O. Stetter, University of Regensburg, Regensburg, Germany; 16.53a, b: Diane Moyles and R.G.E. Murray, University of Western Ontario; 16.53c: Daniel H. Buckley; 16.54: Courtesy of Svetlana N. Dedysh; 16.55: Jessica Mark Welch and Gary Borisy.
Chapter 17 Chapter Opener: Marie Bulínová; 17.1: Thomas D. Brock; 17.2a: Thomas D. Brock; 17.2b: NASA; 17.2c: Daniel H. Buckley; 17.2d: Francisco Rodriguez-Valera, Universidad Miguel Hernandez, San Juan de Alicante, Spain; 17.3: Mary C. Reedy, Duke University Medical Center; 17.5: Alexander Zehnder, Swiss Federal Institute for Environmental Science and Technology, Dubendorf, Switzerland; 17.6: J. Gregory Zeikus and V.G. Bowen; 17.7a, c: Helmut Konig and Karl O. Stetter, University of Regensburg, Germany; 17.7b: Reinhard Rachel and Karl O. Stetter, University of Regensburg, Regensburg, Germany; 17.7d: Stephen H. Zinder, Cornell University; 17.8a: Karl O. Stetter, University of Regensburg, Regensburg, Germany; 17.9a: Thomas D. Brock; 17.9b: A. Segerer and Karl O. Stetter, University of Regensburg, Regensburg, Germany; 17.10: Thomas D. Brock; 17.12a: Helmut Konig and Karl O. Stetter, University of Regensburg, Germany; 17.12b: G. Fiala and Karl O. Stetter, University of Regensburg, Germany; 17.13a: Reinhard Rachel and Karl O. Stetter, University of Regensburg, Germany; 17.13b: Karl O. Stetter and Reinhard Rachel, University of Regensburg, Germany; 17.14: Martin Könneke; 17.15: Christa Schleper; 17.16: Edward DeLong, Monterey Bay Aquarium Research Institute; 17.17: Reinhard Rachel; 17.18: Karl O. Stetter, University of Regensburg, Regensburg, Germany; 17.19a: R. B. Pedersen, K. G. Jebsen Centre for Deep Sea Research, University of Bergen; 17.19b, c: J. Beam and W. Inskeep; 17.20: Thomas D. Brock; 17.21a: Thomas D. Brock; 17.21b: Helmut Konig and Karl O. Stetter, University of Regensburg, Germany; 17.22a: Helmut Konig, University of Regensburg, Germany; 17.22b: Helmut Konig and Karl O. Stetter, University of Regensburg, Germany; 17.22c: Reinhard Rachel and Karl O. Stetter, University of Regensburg, Regensburg, Germany; 17.23a, b: Helmut Konig and Karl O. Stetter, University of Regensburg, Germany; 17.23c: Karl O. Stetter and Reinhard Rachel, University of Regensburg, Germany; 17.23d: Kazem Kashefi; 17.24a: Helmut Konig and Karl O. Stetter, University of Regensburg, Germany; 17.24b: Reinhard Rachel and Karl O. Stetter, University of Regensburg, Germany; 17.25: Helmut Konig and Karl O. Stetter, University of Regensburg, Regensburg, Germany; 17.26: Anna-Louise Reysenbach and Woods Hole Oceanographic Institution; 17.28: Gertraud Rieger, R. Hermann, Reinhard Rachel, and Karl O. Stetter, University of Regensburg, Germany; 17.29: Suzette L. Pereira, Ohio State University.
Chapter 18 Chapter Opener: NASA’s Earth Observatory, inset: Dr. Jeremy R. Young; 18.1: Jian-ming Li, Nancy Martin/University of Louisville School of Medicine; 18.4a: Michael Abbey/Science Source; 18.4b: Steve J. Upton/Kansas State University; 18.5: Blaine Mathison/CDC; 18.6a: M. I. Walker/Science Source; 18.6b: Biophoto Associates/Science Source; 18.7a: Michael T. Madigan; 18.7b: Sydney Tamm; 18.8: Steve J. Upton/Kansas State University; 18.9: Courtesy of Digital Microscopy Facility, Mount Allison University; 18.10a: M.Arai/Getty Images; 18.10b: Biophoto Associates/Science Source; 18.10c, d: Joseph E. Kleinman/North Carolina State University Center for Applied Ecology; 18.11a: Mae Melvin/CDC; 18.11b: Silvia Botero Kleiven/The Swedish Institute for Infectious Disease Control; 18.12a: Jörg Piper; 18.12b-d: Courtesy of Digital Microscopy Facility, Mount Allison University; 18.13a: Frank Mayer, University of Gottingen, Gottingen, Germany; 18.13b: EpicStockMedia/Fotolia; 18.13c: Michael Plewka; 18.14a: Andrew Syred/Science Source; 18.14b: Eye of Science/Science Source; 18.15: Dr. Jeremy R. Young; 18.16: M. Haberey; 18.17: Stephen Sharnoff; 18.18: Kenneth B. Raper; 18.20a: Nano Creative/Science Source; 18.21a: Cheryl L. Broadie/Southern Illinois University at Carbondale; 18.21b: Michael T. Madigan; 18.22: Michael T. Madigan; 18.23: J. Forsdyke/SPL/Science Source; 18.25a: London School of Hygiene & Tropical Medicine/Science Source; 18.25b: Forrest Brem; 18.26a: Premierlight Images/Alamy Stock Photo; 18.26b: Alena Kubátová/Charles University in Prague; 18.27: Thomas D. Brock; 18.29: Samuel F. Conti and Thomas D. Brock; 18.31a: Damian Palus/Shutterstock; 18.31b: U.S. Department of Agriculture; 18.31c: Ed Reschke/Photolibrary/Getty Images; 18.32: Patrick J. Lynch/Science Source; 18.33a: Christine Oesterhelt and Gerald Schonknecht; 18.33b: Richard W. Castenholz/University of Oregon; 18.34a: Arthur M. Nonomura; 18.34b: Bob Gibbons/Alamy Stock Photo; 18.34c: Thomas D. Brock; 18.34d: Ralf Wagner; 18.34e: Blickwinkel/NaturimBild/Alamy Stock Photo; 18.34f: Dr. Aurora M. Nedelcu; 18.34g: Arthur M. Nonomura; 18.35a: Guillaume Dargaud; 18.35b: Yuuji Tsukii/Hosei University, Japan.
Chapter 19 Chapter Opener: Steven Wilbert, Jessica Mark Welch, and Gary Borisy; 19.2b: Norbert Pfennig, University of Konstanz, Germany; 19.3a: James A. Shapiro, University of Chicago; 19.3b: Marie Asao, Deborhah O. Jung, and Michael T. Madigan; 19.6a: Adam Deutschbauer and Hans Carlson; 19.6b top: Excellent backgrounds/Shutterstock, bottom: Steve Giovannoni; 19.7: Rustem Ismagilov and Liang Ma; 19.8a, b: Marc Mussman and Michael Wagner; 19.8c: Willm Martens-Habbena; 19.9: ThermoFisher Scientific; 19.10b, c: Daniel Gage; 19.11: Alex Toftgaard Nielsen; 19.12: Norman R. Pace; 19.13a: Michael Wagner and David A. Stahl; 19.13b: Michael Wagner and Jiri Snaidr; 19.14: Michael Wagner and Marc Mussman; 19.15c: Rachel Spietz, George Schaible, Roland Hatzenpichler; 19.17ab: Jennifer A. Fagg and Michael J. Ferris, Montana State University; 19.17c: Gerard Muyzer and Abdelaziz Belila; 19.20a: Jizhong (Joe) Zhou, Zhili He, and Joy Van Nostrand; 19.22: Vaughn Iverson and Ginger Armbrust; 19.27: Trent R. Northen, Mia Jones; 19.33: Niels Peter Revsbech; 19.34a, b: The figure data and components were generated by Dr. Klaus Koren (Department of Bioscience, University of Aarhus) and Dr. Michael Kühl (Department of Biology, University of Copenhagen) with technical assistance of Sofie Lindegaard Jakobsen (Department of Biology, University of Copenhagen); 19.34c: Philippe Laissue; 19.38: Colin Murrell; 19.39b, d: Jennifer Pett-Ridge, Peter K. Weber; 19.39c: Peter K. Weber; 19.40: Eva Heinz and Matthias Horn; 19.41a: Michael Wagner, Kilian Stöcker, and Holger Daims; 19.41b, c: Michael Wagner, Per Nielsen, and Natuscka Lee.
Chapter 20 Chapter Opener: Belinda Ferrari; 20.1: Hans Paerl, University of North Carolina at Chapel Hill; 20.4a: Frank Dazzo; 20.4b: Thomas D. Brock; 20.4c: Cindy E. Morris, INRA, Centre de Recherche d’Avignon, France. Previously published in Applied and Environmental Microbiology 63:1570-1576; 20.4d: C. T. Huang, Karen Xu, Gordon McFeters, and Philip S. Stewart; 20.5: Courtesy of Marilyn B. Vogel and David J. Des Marais; 20.6: Anna Depetris and Tom Ian Battin; 20.7: The SEM picture was taken by Maria Arias-Andres andReingard Rossberg in the frame of the Leibniz SAW-project ‘MikrOMIK’ (SAW-2014-IOW-2); 20.8a: Jesse Dillon and David A. Stahl; 20.8b: David M. Ward; 20.9a: J. M. Sanchez, J. Lidel Lope and Ricardo Amils; 20.9b: W. Inskeep; 20.10: Andreas Teske and Markus Huettel; 20.11b: Michael T. Madigan; 20.13: Jayne Belnap; 20.14: Winai Tepsuttinun/Fotolia; 20.15a: Terry C. Hazen; 20.15b: Esta van Heerden; 20.17: Luis R. Comolli; 20.19b: Thomas D. Brock; 20.20: Yuriy Brykaylo/Alamy Stock Photo; 20.21: Otis Brown and Robert Evans, NASA; 20.23a: US Coast Guard Photo/Alamy Stock Photo; 20.23b: NASA; 20.24: David L. Valentine; 20.25: Sallie Chisholm, inset: Alexandra Z. Worden and Mya E. Breitbart, Scripps Institution of Oceanography, University of California at San Diego; 20.27a: Hans W. Paerl, University of North Carolina at Chapel Hill; 20.27b: Alexandra Z. Worden and Brian P. Palenik, Scripps Institution of Oceanography, University of California at San Diego; 20.28: Vladimir Yurkov; 20.30: Daniela Nicastro; 20.32: Jed Fuhrman/Matt Sullivan, inset: Jennifer R. Brum/Matt Sullivan; 20.34: Kathryn Kauffman, Nicki Watson, Martin Polz; 20.35: Photographer: Nick Verola; 20.38: Hideto Takami, Japan Marine Science and Technology Center, Kanagawa, Japan; 20.39a: Doug Bartlett; 20.40a: Andreas Teske; 20.42: Sea Research Foundation (SRF) and the Ocean Exploration Trust (OET)/NOAA; 20.44: Robert D. Ballard/Woods Hole Oceanographic Institution; 20.45: Deborah Kelley, University of Washington; 20.46: Christian Jeanthon; 20.47: Carl Wirsen/Woods Hole Oceanographic Institution.
Chapter 21 Chapter Opener: Rebecca Albright; 21.3: Evan Solomon; 21.5: David L. Valentine; 21.8a: John A. Breznak; 21.8b, c: Monica Lee and Stephen H. Zinder; 21.13a: Eye of Science/Science Source; 21.13b: Lars Peter Nielsen; 21.17: J. M. Sanchez, J. Lidel Lope and Ricardo Amils; 21.18a-g: David Emerson; 21.19a: Clara Chan and Deborah Powell, UD Biolmaging Center; 21.19b: Shingo Kato, Clara Chan, and Deborah Powell, UD Biolmaging Center; 21.20a: Jörg Bollmann; 21.20b: M. L. Cros Miguel and J. M. Fortuño Alós; 21.21a: Jörg Piper; Explore the Microbial World Figure 1c: David A. Stahl.
Chapter 22 Chapter Opener: Jason Flowers; 22.1: Thomas D. Brock; 22.3: Kodzo Gbewonyo; 22.4a: Ravin Donald; 22.4b: Thomas D. Brock; 22.5: Thomas D. Brock; 22.6: Kenneth Hurst Williams & Derek R. Lovley; 22.7a, b: U.S. Environmental Protection Agency Headquarters; 22.7c: Bassam Lahoud/Lebanese American University; 22.8: Thomas D. Brock; 22.9: Designelements/Fotolia; 22.14a: Dr. Helmut Brandl/University of Zurich, Switzerland; 22.14d: Shutterstock/Mariyana Misaleva; 22.15a: John M. Martinko; 22.15c: Michael T. Madigan; 22.16: Michael T. Madigan; 22.18: Richard F. Unz/Penn State University Archives; 22.21b: Royal Haskoning DHV, http://www.Nereda.net; 22.21c: Mari Winkler; 22.22a: Thomas D. Brock; 22.23a: Louisville Water Company; 22.25: Don Howard/Centers for Disease Control and Prevention; 22.26: Norman R. Pace; 22.27c: Shawna Johnston and Gerrit Voordouw.
Chapter 23 Chapter Opener: Shunichi Takahashi; 23.1a: Pierre Philippe Laissue; 23.1b: Thomas D. Brock; 23.1c: Michael T. Madigan; 23.2a: Pierre Philippe Laissue; 23.2b: Thomas D. Brock; 23.4: Michael T. Madigan; 23.5: Michael T. Madigan; 23.6: Viola Krukenberg, Katrin Knittel, and Gunter Wegener; 23.8: Joe Burton; 23.9: Ben B. Bohlool; 23.10: Joe Burton; 23.12a: M. D. Shakhawat Hossain; 23.12b, c: Howard Berg, Donald Danforth Plant Science Center; 23.17: B. Dreyfus; 23.18: J. H. Becking/Wageningen Agricultural University, Wageningen, Netherlands; 23.20a: Félix Fracchia; 23.20b-d: Heike Bucking; 23.21: Sergey Ivanov and Maria Harrison; 23.23: S. A. Wilde, inset: D. J. Read/University of Sheffield, England; 23.24: Jo Handelsman/University of Wisconsin at Madison; 23.27: Amparo Latorre; Explore the Microbial World Figure 1a, b: Shee-Mei Lok and Guntur Fibriansah, Figure 1c: James Gathany/CDC; 23.28a: blickwinkel/Teigler/Alamy Stock Photo; 23.29: Michael Poulsen and Cameron Currie; 23.30: Nancy Moran; 23.31c: Michael Pettigrew/Shutterstock; 23.32: Michael Pettigrew/Shutterstock; 23.33: Kenneth H. Nealson, University of Wisconsin; 23.34: Margaret McFall-Ngai; 23.35a, b, d: Margaret McFall-Ngai; 23.36a: Dudley Foster/Woods Hole Oceanographic Institution; 23.36b: Carl Wirsen/Woods Hole Oceanographic Institution; 23.37: Colleen M. Cavanaugh, Harvard University; 23.38a, b: Heidi Goodrich-Blair, Mengyi Cao, Matthew Stilwell, and Elle Kielar Grevstad at the Biochemistry Optical Core, Biochemistry Dept. UW-Madison; 23.38c: Sam Kyu-Kim and S. Patricia Stock; 23.39: Kazuhiko Koike; 23.40: Pierre Philippe Laissue; 23.41: Michael T. Madigan; 23.44 sheep: Gallas/Fotolia, bird: Bernard Swain, horse: Nancy L. Spear, rabbit: D Photo Sudbury/Shutterstock; 23.45b: Sharisa D. Beck; 23.47: Eric Isselee/Shutterstock.
Chapter 24 Chapter Opener: Dr. Andrey Shkoporov; 24.4a: Dwayne C. Savage and R. V. H. Blumershine; 24.4b: Dwayne C. Savage; 24.8: Ryan Hunter, Batbileg Bor, Xuesong He and Jeffrey McLean; 24.10: Jessica Mark Welch and Gary Borisy; 24.13b: John Durham/Science Source; 24.17: Amina Bouslimani & Pieter Dorrestein; 24.18c: Jeremy J. Barr; 24.26: Tryggve Lie, School of Dentistry, University of Bergen; 24.29: Deborah O. Jung and John Martinko.
Chapter 25 Chapter Opener: Joshua Jenkins; 25.2a: USDA Agricultural Research Service; 25.3a: Larry Stauffer/Oregon State Public Health Laboratory/CDC; 25.3b: CDC/PHIL; 25.3c: J. William Costerton/Montana State University; 25.4a: M. Miller/CDC; 25.4b: CDC/PHIL; 25.4c: Richard Facklam/CDC; 25.5: CDC/PHIL; 25.7a, b: C. Lai, Max A. Listgarten, and B. Rosan; 25.7c: Richard Facklam/CDC; 25.7d: Isaac L. Schechmeister and John J. Bozzola/Southern Illinois University at Carbondale; 25.8: Jessica Mark Welch and Gary Borisy; 25.9: Janice Haney Carr/CDC; 25.13: CDC/PHIL; 25.16: Zang, R. G., Scott, D. L., Westbrok, M.L., Nance, S., Spangler, B.D., Shipley, G.G., Westbrook, E.M. Journal: (1995) J.Mol. Biol. 251: 563-573; 25.17a: Thomas D. Brock; 25.17b: Leon J. Le Beau/University of Illinois at Chicago; 25.18 left: 2-methyl-2, 4-pentanediol induces spontaneous assembly of staphylococcal alpha-hemolysin into heptameric pore structure. Tanaka, Y. Hirano, N., Kaneko, J., Kamio, Y., Yao, M., Tanaka, I. (2011) Protein Sci. 20: 448-456, right: Janice Haney Carr/CDC; 25.19: Janice Haney Carr/CDC; 25.20: Arthur O. Tzianabos and R.D. Millham.
Chapter 26 Chapter Opener: Florian Ermini/Cortexyme; 26.3: Dr. Deepak Kumar, Vijaya Kumar, and Dr. Robert Moir; Table 26.2a: John M. Martinko and Michael T. Madigan; 26.7b: NIAID (CDC/PHIL); Explore the Microbial World Figure 1: U.S. National Oceanic and Atmospheric Administration; 26.10: J. G. Hirsch; 26.12a: Centers for Disease Control and Prevention; 26.12b: James V. Little; 26.15b: Michelle Dunstone and Bradley Spicer, Centre of Excellence for Advanced Moleular Imaging.
Chapter 27 Chapter Opener: NIAID/NIH; 27.5 left to right: CDC/PHIL, US WPA/Library of Congress, D. Jordan, M. A./CDC, Edward J. Wozniak, D.V.M, PH.D/CDC; 27.8b: Richard J. Feldmann, National Institutes of Health; 27.13d: Don C. Wiley, Howard Hughes Medical Institute; 27.13e: Aideen C. M. Young, Albert Einstein College of Medicine, Bronx, New York; 27.13f: Jerry H. Brown; 27.16: Boensch, B./Arco Images GmbH/Alamy Stock Photo; 27.22b: Alex Ritter, Jennifer Lippincott Schwartz, and Gillian Griffiths, National Institutes of Health; 27.23b: Lennart Nilsson, Albert Bonniers Forlag AB.
Chapter 28 Chapter Opener: Oliver Meckes/Science Source; 28.2: Edward J. Wozniak/D.V.M/PH.D/CDC; 28.3: CDC/PHIL; 28.4: CDC/PHIL; 28.5: CDC/PHIL; 28.7: NIAID (CDC/PHIL); 28.8: Amanda Mills/CDC; 28.15: Biophoto Associates/Science Source; 28.16: Dr. P. Marazzi/Science Source.
Chapter 29 Chapter Opener: National Institute of Allergy and Infectious Diseases (NIAID); 29.1: CDC/PHIL; 29.2: USAMRIID; Table 29.3: Janice Haney Carr/CDC, Peta Wardell/CDC, Erskine Palmer/CDC, A. Harrison/CDC, Frederick Murphy/CDC, Charles D. Humphrey/CDC; Explore the Microbial World Figure 1a: Alberto Lerner/CHROMagar, Figure 1b: NIAID (CDC/PHIL); 29.6a: Norman Jacobs/CDC; 29.6b: CDC/PHIL; 29.7a, b: Dr. Todd Parker/CDC; 29.7c: John M. Martinko and Cheryl L. Broadie; 29.8: Matthew Sattley; 29.9: Matthew Sattley; 29.10: Leon J. Le Beau; 29.11a: Leon J. Le Beau; 29.11b, c: Matthew Sattley; 29.11g: Richard Facklam/CDC; 29.14: C. Weibull, W. D. Bickel, W. T. Hashius, K. C. Milner, and E. Ribi; 29.15a: Norman L. Morris; 29.16: Matthew Sattley; 29.18a: Wellcome Research Laboratories; 29.18b: William B. Cherry/CDC; 29.19a: P. M. Feorino/CDC; 29.19b: William Kaplan/CDC; 29.19c: Govinda S. Visvesvara/CDC; 29.21a: Matthew Sattley; 29.22b: Victor Tsang/CDC; 29.24b: Matthew Sattley.
Chapter 30 Chapter Opener: Jeniel E. Nett; 30.5 left: James Gathany/CDC, right: CDC/PHIL; 30.6 left: Janice Haney Carr/CDC, right: NIAID (CDC/PHIL); 30.8 left: CDC/PHIL, right: Jim Goodson/CDC; 30.12a: James Gathany and CDC/Melissa Dankel; 30.12b: Gilda Jones/CDC; 30.17: CDC/PHIL; 30.18a, d: CDC/PHIL; 30.18b: Larry Stauffer, Oregon State Public Health Laboratory, and CDC/PHIL; 30.18c: Archil Navdarashvili, Georgia (Republic)/CDC.
Chapter 31 Chapter Opener: Brinkmann, Max Planck Institute for Infection Biology; 31.1: Thomas D. Brock; 31.3a: Eye of Science/Science Source; 31.3b: CDC/PHIL; 31.4: Michael T. Madigan; 31.5: CDC/PHIL; 31.6: Franklin H. Top; 31.7: Dr. Thomas F. Sellers/CDC; 31.8: Michael T. Madigan; 31.9: Franklin H. Top; 31.10: Dr. M.A. Ansary/Science Source; 31.11: Isaac L. Schechmeister; 31.12: CDC/PHIL; 31.13a: CDC/PHIL; 31.13b: Franklin H. Top; 31.14: J. H. Carr/CDC; 31.15a: Dr. Edwin P. Ewing Jr./CDC; 31.15b: CDC/PHIL; 31.16a: R. W. Smithwick/CDC; 31.16b, c: Aaron Friedman; 31.17a: Jorge Adorno/Reuters; 31.17b: CDC/PHIL; 31.18: CDC/PHIL; 31.19a: C. Goldsmith/CDC; 31.19b: Centers for Disease Control and Prevention; 31.19c: CDC/PHIL; 31.20: CDC/PHIL; 31.21: Centers for Disease Control and Prevention; 31.22: A. D. Langmuir/CDC; 31.23a: Biophoto Associates/Science Source; 31.23b: David A. J. Tyrrell; 31.24: E. L. Palmer, M. L. Martin, and F. Murphy/CDC; 31.25: Irene T. Schulze; 31.28: CDC/PHIL, M. J. Arduino and J. H. Carr/CDC; 31.29: Gregory Moran/CDC; 31.30: Michael T. Madigan; 31.31: Juergen Berger/Science Source; 31.33a: Eye of Science/Science Source; 31.33b: CDC/PHIL; 31.34a: Cynthia Goldsmith/CDC; 31.34b: CDC/PHIL; 31.36a: Joe Miller/CDC; 31.36b: Morris D. Cooper; 31.37a: H. Russell/CDC; 31.37b, c: CDC/PHIL; 31.38a: Centers for Disease Control and Prevention; 31.38b: Sidney Olansky; 31.38c: Robert Sumpter/CDC; 31.39: Dr. Peter Perine/CDC; 31.40: Morris D. Cooper; 31.41a: Gordon A. Tuffli, MD; 31.41b: K. L. Hermann/CDC; 31.42a: N. J. Flumara and G. Hart/CDC; 31.42b: Susan Lindsley/CDC; 31.46: CDC/PHIL; 31.47a: CDC/PHIL; 31.47b: S. Krans/CDC 31.48a: M. Metcalfe and T. Hodge/CDC.
Chapter 32 Chapter Opener: National Institute of Allergy and Infectious Diseases (NIAID); 32.2a: Dr. Fred Murphy/CDC; 32.2b: Mekonnen Fekadu/CDC; 32.3a: Cynthia Goldsmith and Luanne Elliot/CDC; 32.3b: Natalie Dolan/CDC; 32.4a: James Gathany/CDC; 32.4b: CDC/PHIL; 32.6a: Willy Burgdorfer, M.D; 32.6b: CDC/PHIL; 32.6c: Willy Burgdorfer, MD; 32.6d: Kenneth E. Greer/University of Virginia School of Medicine; 32.7a: D. H. Walker/CDC; 32.7b: National Institute of Allergy and Infectious Diseases (NIAID); 32.8a: National Institute of Allergy and Infectious Diseases (NIAID); 32.8b: Janice Haney Carr/CDC; 32.9a: Pfizer Central Research; 32.9b: James Gathany/CDC; 32.10: Pfizer Central Research; 32.12a: James Gathany/CDC; 32.12b: CDC/PHIL; 32.12c: Frederick Murphy/CDC; 32.13: Cynthia Goldsmith/CDC; 32.14a: W. Brogdon, J. Gathany/CDC; 32.14b: Cynthia Goldsmith/CDC; 32.15: CDC/PHIL; 32.17a: Larry Stauffer/CDC; 32.17b: T. Parker/CDC; 32.18a: CDC/WHO; 32.18b: Larry Staufer/CDC; 32.19a: CDC/PHIL; 32.19b: Christina Nelson, MD, MPH/CDC; 32.21a: Larry Stauffer/CDC; 32.21b: Janice Haney Carr/CDC; 32.22a: Larry Stauffer/CDC; 32.22b-d: CDC/PHIL; 32.23: CDC/PHIL; 32.24: CDC/PHIL; 32.24c: Biophoto Associates/Science Source.
Chapter 33 Chapter Opener: Michael T. Madigan; 33.1a: Thomas D. Brock; 33.1b: U.S. Environmental Protection Agency Headquarters; 33.1c: Jade ThaiCatwalk/Shutterstock; 33.2 clockwise from top: Kimberley Seed, Tufts University School of Medicine, Centers for Disease Control and Prevention, James Cavallini/Science Source, Centers for Disease Control and Prevention, Mark L. Tamplin, Juergen Berger/Science Source; 33.3a, b: CDC/PHIL; 33.3c: Janice Haney Carr/CDC; 33.3d: Jim Feeley/CDC; 33.4: CDC/PHIL; 33.5: Thomas D. Brock; 33.6: John M. Martinko and Cheryl Broadie; 33.7: Seward Laboratory Systems Inc.; 33.8a: CDC/PHIL; 33.8b: Janice Haney Carr/CDC; 33.9: CDC/PHIL; 33.10a: Eric Grafman/CDC; 33.10b, c: James Gathany/CDC; 33.10d: Michael T. Madigan; 33.11: CDC/PHIL; 33.12a: CDC/PHIL; 33.12b: Janice Haney Carr/CDC; 33.12c, d: CDC/PHIL; 33.13a, b: CDC/PHIL; 33.13c: Mediscan/Alamy Stock Photo; 33.14a: Michael T. Madigan; 33.14b: Elizabeth White/CDC; 33.15b: Dr. Pascale Cossart, Institut Pasteur, Paris; 33.16: CDC/PHIL; 33.17: CDC/PHIL.
Chapter 34 Chapter Opener: Dr. Visvesvara/CDC; 34.1a: L. Haley/CDC; 34.1b: A. A. Padhye/CDC; 34.1c: M. Jalbert/L. Kaufman/CDC; 34.1d, e: L. Ajello/CDC; 34.1f: L. K. Georg/CDC; 34.2a: CDC/PHIL; 34.3a: Gordon C. Sauer, MD; 34.3b, c: CDC/PHIL; 34.4a: Gordon C. Sauer, MD; 34.4b: L. K. Georg/CDC; 34.5a: M. Hicklin/CDC; 34.5b: L. K. Georg/CDC; 34.5c: E. P. Ewing, Jr./CDC; 34.5d: M. Hicklin/CDC; 34.5e: M. Castro/L.K. Georg/CDC; 34.5f: CDC/PHIL; 34.6: Katherine Ralston and David Zemo; 34.7a: M. Melvin/CDC; 34.7b: L. L. A. Moore, Jr./CDC; 34.8a: G.S. Visvesvara/CDC; 34.8b: Stanley L. Erlandsen; 34.8c: Dennis E. Feely; 34.9a: Steve J. Upton; 34.9b: CDC/PHIL; 34.10: CDC/PHIL; 34.11: Edwin P. Ewing/CDC; 34.12: Jim Gathany/CDC; 34.13a: Steven Glenn/CDC; 34.13b: M. Melvin/CDC; 34.14a: F. Collins/J. Gathany/CDC; 34.14b: M. Melvin/CDC; 34.14c: D. S. Martin/CDC; 34.15a: Scott Camazine/Alamy Stock Photo; 34.15b: Myron G. Schultz/CDC; 34.15c: WHO (CDC/PHIL); 34.15d: M. Melvin/CDC; 34.16a: S. Maddison/CDC; 34.16b: CDC/PHIL; 34.16c: A. J. Sulzer/CDC; 34.16d: CDC/PHIL; 34.17: CDC/PHIL; 34.18: CDC/PHIL.
Glossary Terms
Note: Page numbers indicate where the term is defined in a Chapter Glossary. A few entries with more than one page number are used in more than one sense. Comprehensive glossary available at Mastering Microbiology®.
(Ch 26) Antibody-dependent cell-mediated cytotoxicity (ADCC)
(Ch 1) Centers for Disease Control and Prevention (CDC)
(Ch 4), (Ch 17) Complementarity-determining region (CDR)
(Ch 6) Denaturing gradient gel electrophoresis (DGGE)
(Ch 26) Hemorrhagic fever with renal syndrome (HFRS)
(Ch 20) Nicotinamide adenine dinucleotide (NAD+/NADH)
(Ch 7) Nonnucleoside reverse transcriptase inhibitor
(Ch 6) Nucleoside reverse transcriptase inhibitor (NRTI)
(Ch 1), (Ch 25) Pathogen-associated molecular pattern (PAMP)
(Ch 26), (Ch 27), (Ch 29) Spirilla (singular, spirillum)
Index
Comprehensive glossary available at MasteringMicrobiology®.
A
Actinobacteria . See also High GC gram-positive bacteria
African sleeping sickness (African trypanosomiasis) ********
Agar dilution tube method, isolation of pure culture
Anaerobic methane (ANME)-oxidizing Euryarchaeota
Antibacterial drugs . See also Antibiotic; Antimicrobial agent
Antibiotic ****************. See also specific compounds
combined with compounds inhibiting antibiotic resistance
Antibiotic resistance ****. See also R plasmid; specific bacteria
Antibodies (immunoglobulins) ********. See also Immunoglobulin (Ig)
Antibody-dependent cell-mediated cytotoxicity (ADCC) ****
Antigen-specific immunity. See Adaptive immunity
Antimicrobial drug resistance ****. See also Antibiotic resistance
Arthropod-transmitted bacterial and viral diseases
ATP ********production, use. See also Mitochondria
Automated ribosomal intergenic spacer analysis (ARISA)
B
Bacteriophage ****. See also Lambda bacteriophage; T4 bacteriophage
Biodiversity . See also Community analysis; Ecological diversity; Metabolic diversity
Bioorthogonal noncanonical amino acid tagging (BONCAT) ********
Biosynthetic capacity, nutritional requirements and
Biotechnology ********. See also Genetic engineering; Industrial microbiology
Listeria monocytogenes strain to deliver anticancer agents
transgenic organisms in agriculture and aquaculture ****
BONCAT (bioorthogonal noncanonical amino acid tagging) ********
C
Carbohydrate metabolism . See also Glucose; Polysaccharide; Sugar
pathway between plant and arbuscular mycorrhizae fungi
Centers for Disease Control and Prevention (CDC) ********
CLASI-FISH (combinatorial labeling and spectral imaging FISH)
Clostridium difficile. See Clostridioides (Clostridium) difficile
Combinatorial labeling and spectral imaging FISH (CLASI-FISH)
Common ancestor. See Last universal common ancestor (LUCA)
Complementarity-determining regions (CDRs) ********
mannose-binding lectin and alternative pathway activation
Cytotoxic T-lymphocyte-associated protein-4 (CTLA-4)
D
Deep-sea hydrothermal vent. See Hydrothermal vent
Denaturing gradient gel electrophoresis (DGGE) ********
DGGE (denaturing gradient gel electrophoresis) ********
Diagnostic methods . See also Antibiotic; Antimicrobial agent; Clinical microbiology
Differential interference contrast (DIC) microscopy
Diffusion methods, antimicrobial agent susceptibility assay using
Dinitrogen, biological utilization. See Nitrogen fixation
epidemiology, pathology, prevention, and treatment
Diphtheria-tetanus-acellular pertussis (DTaP) vaccine
Disease ********. See also infectious disease; Person-to-person microbial diseases; Transmission; specific diseases
Dissimilative reduction of nitrate to ammonia (DRNA)
multiple displacement amplification (MDA) ********
DNA-uptake (natural competence) by predatory bacteria
transfer through conjugation, transduction, transformation
multiple displacement amplification (MDA) ********
DNA probe. See Fluorescence in situ hybridization (FISH)
multiple displacement amplification (MDA) ********
Drug resistance . See also Antibiotic resistance; Antimicrobial agent
Dual functionality of transcriptional regulators in Archaea
E
Earth Microbiome Project, single-cell genomics and
Economic development, contribution to pathogen emergence
chemolithotrophic metabolisms at hydrothermal vents
chemolithotrophic metabolisms at hydrothermal vents
Energy-releasing process. See Catabolism (catabolic reactions)
for chemoorganotrophic and strictly anaerobic bacteria
Environment . See also Built environments, microbiology of; Climate change
Environmental genomics (metagenomics) ****************
Shiga toxin-producing (STEC) (formerly enterohemorrhagic)
structure and function of reversible ATP synthase (ATPase) in
Escherichia coli long-term evolution experiment (LTEE)
F
Filamentous anoxygenic phototrophs. See Green nonsulfur bacteria
Escherichia coli long-term evolution experiment (LTEE)
Fitness profile, Tn-Seq (transposon insertion site sequencing)
Fluorescence in situ hybridization (FISH) ********
G
linking specific genes and functions to specific organisms
Genetically modified organism (GMO) ****. See also Transgenic organism
products from genetically engineered microoganisms
multiple displacement amplification (MDA) ********
Genomic Encyclopedia of Bacteria and Archaea (GEBA)
Glucose-phosphate stress, SgrS sRNA and ptsG mRNA interaction
Group A streptococci. See Streptococcus pyogenes
Group A Streptococcus (GAS). See Streptococcus pyogenes
colonization, succession, and stability of microbiota
H
Hemorrhagic fever with renal syndrome (HFRS) ********
High GC gram-positive bacteria ****. See also Actinobacteria
Hospital-acquired infection. See Nosocomial infection
Human behavior, contribution to pathogen emergence
Hybridization ************. See also Nucleic acid probe
3-Hydroxy-4(1H)-pyridone and 2, 3-dihydroxypyridine (DHP)
I
Industrial development, contribution to pathogen emergence
Industrial microbiology . See also Biotechnology
Infection ********. See also Respiratory infection
Insect. See also Arthropod-transmitted bacterial and viral diseases
Intercellular communication ********. See also Communication
International Code of Nomenclature of Prokaryotes, The
International Genetically Engineered Machine (iGEM)
International Journal of Systematic and Evolutionary Microbiology (IJSEM)
Isotopic methods, linking functions to specific organisms
L
Lateral gene transfer. See Horizontal gene transfer
Low GC gram-positive bacteria ****. See also Firmicutes
Lymphocytes ********. See also B lymphocytes (B cells); T lymphocytes (T cells)
M
Mad cow disease. See Bovine spongiform encephalopathy
Major histocompatibility complex (MHC) proteins ********
MALDI (matrix-assisted laser desorption ionization) spectrometry
MALT. See Mucosa-associated lymphoid tissue (MALT)
diversity of, and associated microbial metabolic processes
Matrix-assisted laser desorption ionization (MALDI) spectrometry
MCP. See Methyl-accepting chemotaxis protein (MCP)
Metabolic diversity . See also Autotroph; Chemolithotrophy; Chemoorganotroph; Nitrogen fixation; Phototroph
Metabolism ********. See also Fermentation; Respiration
Methicillin-resistant Staphylococcus aureus (MRSA)
MHC proteins. See Major histocompatibility complex (MHC) proteins
MIC (minimum inhibitory concentration) ****************
Microbial community analyses. See Community analysis
Microbial diversity . See also Ecological diversity; Metabolic diversity; Morphological diversity
differential interference contrast (DIC) microscopy
Minimum inhibitory concentration (MIC) ****************
MPN test. See Most probable number (MPN) technique
MRSA. See Methicillin-resistant Staphylococcus aureus (MRSA)
Multiple displacement amplification (MDA) ********
Mutation ********. See also specific types of mutations
N
NADPH (nicotinamide adenine dinucleotide phosphate)
New York City municipal subway system, airborne microorganisms
pathway between plant and arbuscular mycorrhizae fungi
NNRTI (nonnucleoside reverse transcriptase inhibitor) ********
Nonnucleoside reverse transcriptase inbibitor (NNRTI) ********
NRTI (nucleoside reverse transcriptase inhibitor) ********
Nucleoside reverse transcriptase inhibitor (NRTI) ********
nutritional significance of obligate intracellular symbionts of insects
Nutritional requirement, biosynthetic capacity and
O
Obligate intracellular parasite . See also Virus
of systems biology. See Functional omics; Genomics
Oxygenic photosynthesis ********. See also Cyanobacteria
P
PAPS. See Phosphoadenosine phosphosulfate (PAPS)
Partial nitrification-denitrification, biological nitrogen removal
antibiotic-resistant . See also Antibiotic resistance
identification . See also Clinical microbiology; Diagnostic methods
Pathogen-associated molecular pattern (PAMP) ********
Petroleum compounds, genes used for evaluating degradation
Pharmaceuticals, synthetic . See also specific drug names
PHB. See Poly-β-hydroxybutyrate; Poly-β-hydroxybutyric acid
pathway between plant and arbuscular mycorrhizae fungi
purple, survival of the fittest and natural selection
hydrothermal vent bacterial and archaeal diversity
Polymorphonuclear leukocytes (PMN). See Neutrophil
Precipitation to potential evapotranspiration (P/PET)
degradation and assimilation, deep sediment marine Archaea
chemotaxis to scavenge nutrients from damaged tissue
R
Reductive TCA cycle. See Reverse citric acid cycle
Resistance, antibiotic. See Antibiotic resistance
Reverse transcription-polymerase chain reaction (RT-PCR)
Rocky Mountain spotted fever (spotted fever rickettsiosis) ********
RT-PCR. See Reverse transcription polymerase chain reaction (RT-PCR)
RuBisCO (ribulose bisphosphate carboxylase) ************
S
San Joaquin Valley fever. See Coccidioidomycosis
SASP. See Small acid-soluble spore proteins (SASPs)
SCID. See Severe combined immune deficiency syndrome (SCID)
SE genes (sea, seb, sec, sed)Staphylococcus aureus
Sequencing ********. See also DNA sequencing; Genomics
Severe acute respiratory syndrome coronavirus (SARS-CoV)
Sexually transmitted infections (STIs) ********. See also specific diseases
Shine-Dalgarno sequence. See Ribosome-binding sequence
microbial composition of termite hindgut inferred from
Sleeping sickness. See Trypanosomiasis (sleeping sickness)
Spotted fever rickettsiosis (Rocky Mountain spotted fever) ********
SSU rRNA. See Small subunit ribosomal RNA (SSU rRNA)
Staphylococcus chromosomal cassette for methicillin resistance (SCCmec)
STEC. See Shiga toxin-producing Escherichia coli (STEC)
syntrophy between anaerobic methanotrophic Archaea (ANME) and
Sulfide-oxidizing bacteria, ecological diversity and strategies
Sulfolobus islandicus rod-shaped virus 2 (SIRV2)
Sulfolobus islandicus turreted icosahedral virus (STIV)
anaerobic methanotrophic Archaea (ANME) and sulfate-reducing bacteria
T
Terminal restriction fragment length polymorphism (T-RFLP)
higher, bacterial diversity and lignocellulose digestion in
Tetanospasmin. See Tetanus toxin (tetanospasmin)
Toxin . See also Cytotoxin; Endotoxin; Enterotoxin; Exotoxin; Neurotoxin
t/pa (transcription termination/polyadenylation signal)
Transmission . See also Foodborne disease; Waterborne disease; Zoonosis; specific vectors
arthropod-transmitted bacterial and viral diseases
Transportation, contribution to pathogen emergence
Transporters associated with antigen processing (TAP)
Trimethylamine oxide/dimethyl sulfoxide respiration
U
Unweighted Pair Group Method with Arithmetic Mean (UPGMA)
Urethritis, nongonococcal. See Nongonococcal urethritis
V
Vaccination ****************. See also Immunization
Vancomycin intermediate Staphylococcus aureus (VISA)
Vancomycin resistant Staphylococcus aureus (VRSA)
arthropod-transmitted bacterial and viral diseases
Viral Special Pathogens Branch of the Centers for Disease Control and Prevention
Virus ****. See also Bacteriophage; DNA virus; RNA virus; specific viruses
W
Wood-Ljungdahl pathway. See Reductive acetyl-CoA pathway
Z
Green and yellow microorganisms live together in a community. The yellow ones are larger and have more visible parts in them than the green.
A cooperative community of brightly colored microbacteria.
A community of microbes yellow, purple and red, mainly rod shaped.
Types are as follows. Animal health, human health, ecosystem health, water and waste, agriculture, natural resources, food, biotechnology, industry, bioenergy.
Part a. Multiple colonies of Bioluminescent bacteria live on petri dish 90 millimeters in diameter. The bacteria emit bright blue light and cover about two thirds of the dish in colonies.
Part b. A single colony is about 2 millimeters in diameter.
Part c. A scanning electron microscope image shows a 10 micrometer square of the colony. The individual bacteria are cylindrical in shape and bright blue in color.
Part a, the structures of a Prokaryotic cell.The prokaryotic cell as a slightly rounded rectangle. The cell wall is the outer boundary of the cell. Just inside it is a thin boundary called the cytoplasmic membrane. The cell’s chromosome coils up at the center to form the nucleoid. Aqueous cytoplasm occupies the majority of the cell and holds the organelles. Circular plasmids store additional D N A. The ribosomes are small dots throughout the cytoplasm. All of the components are indicated on a diagram and also on microscope images of a bacteria and an archaea. The bacteria is an oblong oval shape, while the archaea is a rectangle.
Part b, the structures of a eukaryotic cell. The cell is a slightly irregular sphere. The cell wall is the outer boundary. The cytoplasmic membrane is just inside the cell wall. The mitochondria are oval shaped organelles with coil like inner structures. The nucleus is a sphere at the center of the cell. The nuclear membrane contains the nucleus. The ribosomes are small dots throughout the cytoplasm and attached to the endoplasmic reticulum. The Golgi complex and the endoplasmic reticulum are both stack shaped organelles. The Golgi complex is smaller than the mitochondria while the endoplasmic reticulum is larger. All the components of the cell are indicated on both a diagram and an image from a scanning electron microscope.
The properties of all cells include metabolism, growth, and evolution.
Structure. All cells have a cytoplasmic membrane, cytoplasm, a genome made of DNA, and ribosomes.
Metabolism. All cells use information encoded in DNA to make RNA and protein. All cells take up nutrients, transform them, conserve energy, and expel wastes. 1. Catabolism (transforming molecules to produce energy and building blocks) 2. Anabolism (synthesizing macromolecules).
Growth. Information from DNA is converted into proteins, which do work. Proteins are used to convert nutrients from the environment into new cells.
Evolution. Chance mutations in DNA cause new cells to have new properties, thereby promoting evolution. Phylogenetic trees built from DNA sequences capture evolutionary relationships between species. An image of a phylogenetic tree moves from an ancestral cell to several distinct species.
The properties of only some cells includes differentiation, communication, genetic exchange and motility.
Differentiation involves some cells which can form new cell structures such as a spore. An image of a general cell turning into a spore with a more specific outer layer.
Communication involves cells interacting with each other by chemical messengers. An image of cells with arrows between them indicating communication.
Genetic exchange involves cells exchanging genes by several mechanisms. An image shows a donor cell sending a section of D N A to a recipient cell.
Motility involves cells that are capable of self propulsion. An image shows a cell with a flagellum moving forward.
Multicultural Education in a Pluralistic Society, 11ed
Organism Characteristics Morphology Size, cubic micrometers Cell volume, cubic micrometers Volumes compared to E coli
Thiomargarita namibiensis Sulfur chemolithotroph Cocci in chains 750 200,000,000 100,000,000 times
Epulopiscium fishelson Chemoorganotroph Rods with tapered ends 800 by 600 200,000,000 1,500,000 times
Beggiatoa species Sulfur chemolithotroph Filaments 50 by 160 1,000,000 500,000 times
Achromatium oxaliferum Sulfur chemolithotroph Cocci 35 by 95 80,000 40,000 times
Lyngbya majuscula Cyanobacterium Filaments 8 by 80 40,000 20,000 times
Thiovulum majus Sulfur chemolithotroph Cocci 18 3,000 1,500 times
Staphylothermus marinus Hyperthermophile Cocci in irregular clusters 15 1,800 900 times
Magnetobacterium bavaricum Magnetotactic bacterium Rods 2 by 10 30 15 times
Escherichia coli Chemoorganotroph Rods 1 by 2 2 1 time
Pelagibacter ubique Marine chemoorganotroph Rods 0.2 by 0.5 0.014 0.007 times
Ultra-small bacteria Uncultured, from groundwater Variable less than 0.2 0.009 0.0045 times
Mycoplasma pneumoniae Pathogenic bacterium Pleomorphic 0.2 0.005 0.0025 times
Where radius = 1 micrometer. Surface area, 4 pi r squared = 12.6 square micrometers. Volume, four thirds pi r cubed, = 4.2 cubic micrometers. Surface over volume = 3 over r = 3.
Where radius = 2 micrometers. Surface are = 50.3 square micrometers. Volume = 33.5 micrometers. Surface over volume = 3 over r = 1.5.
Budding and appendaged. Examples. stalk and hypha, thin with spiral or bulbous ends, respectively.
The diagram shows four circles of the same size. In the one hundred micrometer or 1 times 10 to the negative fourth power meter circle, yeast and cyanobacteria are visible. In the ten micrometer or 1 times 10 to the negative fifth power meter circle are large organelles like the cell nucleus and smaller cells like nanoflagellates. In the one micrometer or 1 times 10 to the negative sixth power meter circle are large viruses such as influenza and bacteriophages. In the one hundred nanometer or 1 times 10 to the negative seventh power meter circle you can see small viruses such as the circovirus and inner cell structures such as proteins and ribosomes. Structures larger than point two nanometers can be seen with electron microscopy, those larger than point two micrometers can be seen with light microscopy, and those larger than one hundred micrometers can be seen with the naked eye.
Part a. A circular timeline measuring four point six billion years surrounds the Earth. From the Earth’s origins until about four billion years ago, the Earth was sterile. The first cellular organisms developed four billion years ago. The first anoxygenic phototrophic bacteria developed about two or three million years after that. This begins a period known as the Anoxic Earth. This period ended about two point eight billion years ago when the first cyanobacteria developed. Approximately two billion years ago, modern eukaryotes emerged. About six hundred million years later algae diversified. Half a billion years ago oxygen levels in the atmosphere neared twenty percent and shelly invertebrates, vascular plants, and mammals evolved. Human beings emerged so recently that their mark on the timeline is indistinguishable from the mark representing the present.
Part b. A small tree diagram shows how modern cell domains evolved from the last universal common ancestor. Bacteria separated about three point eight billion years ago, then archaea and eukarya separated about two point eight billion years ago.
Parts, a, b, and c. In image a, Salt marshes contain microbial mats. In image b, cohesive microbial structures called mats form at the sediment surface. In image c, a cross section of microbial mats show how photopigments produce multi colored layers.
Image d. Orange oval bacteria with purple sulfur spots in them.
Image e. Green sulfur bacteria grows close together in dense colonies
Image f. Cyanobacteria glow blue and green under a phase contrast microscope, some are rods and some are groups of circles.
The chart shows what percent of the global biomass of three elements in microbes and what percent is in plants, as well as the major cellular sources of each element. The percentages are as follows.
Carbon’s global biomass is just over twenty percent microbial and just under eighty percent plant based. The main cellular sources of carbon biomass are plant cell walls, proteins, R N A, D N A, membranes, and peptidoglycan.
Nitrogen’s biomass is about eighty percent microbial and twenty percent plant based. The main cellular sources of nitrogen biomass are proteins, R N A, D N A, and peptidoglycan.
Phosphorus’ biomass is about eighty percent microbial and twenty percent plant based. The main cellular sources of phosphorus biomass are R N A, D N A, and membranes.
In the year nineteen hundred the leading cause of death in the United States was influenza and pneumonia, which accounted for about two hundred deaths per every hundred thousand people. The next two leading causes of death were also infectious diseases, Tuberculosis, 190 and Gastroenteritis, 150. After that the causes in descending order were heart disease at 150, stroke at 100, kidney disease at 80, accidents at 70, cancer at 60, infant disease at 50, and diphtheria at 30. Today, the leading cause of death is heart disease, with 210 deaths per hundred thousand population; followed closely by cancer which has 190. The remaining causes are stroke at 50, pulmonary disease at 50, accidents at 50, diabetes at 30, Alzheimer’s disease at 30, influenza and pneumonia at 25, kidney disease at 20, septicemia at 10, and suicide at 10. Today, the only infectious diseases listed as cause of death are septicemia, influenza and pneumonia, and a portion of kidney disease cases.
Part a. Small round nodules on the roots of a soybean contain bacteria that fix nitrogen for use by the plant.
Part b. This process is expressed by the equation N 2 +8 H yields 2 N H 3 + H 2.
Part c. The cycle of nitrogen goes from N H 3 to N O 3 minus to N 2. The cycle of sulfur cycle goes from H 2 S to S super 0 to S O 4 negative 2.
Part d. In rumen, like the cow pictured, digestion moves from grass to cellulose to glucose to microbial fermentation, which leads to both fatty acid nutrition for the animal and waste products including C O 2 + C H 4.
Part a. The P H values and cell counts of the major organs in the gastrointestinal tract and a scanning electron micrograph of microbial bacteria. The organs included are stomach, small intestine, and large intestine. The human stomach has a P H of two and has ten to the fourth power cells per gram. The small intestine has a P H of four to five, and has up to ten to the eighth power cells per gram. The large intestine has a P H of seven and about ten to the eleventh power cells per gram.
Part B. The large intestine hosts a huge variety of microbial life. The scanning electron micrograph of the large intestine shows bacteria in several shapes including circles and rods.
Glucose ferments in one of two ways, either into two lactic acid or into two ethanol plus two carbon dioxide. The lactic acid can help form yogurt, or it can breakdown into propionic acid, acetic acid, and carbon dioxide, which help form cheese. The two ethanol can either create wine, or can further decay into two acetic acid molecules which aid in the fermentation process of pickling.
Wastewater Treatment: Microbes are used to clean wastewater.
Bioremediation: Microbes are used to clean contaminated environments.
Biofilms: Microbes grow on surfaces and can foul pipes and pipelines.
Biotechnology: Microbes can be genetically modified to produce high-value products such as pharmaceuticals and enzymes.
Fermentation: Microbes are used at industrial scale to make chemicals, solvents, enzymes, and pharmaceuticals.
Biofuels: Microbes are used to convert biomass into ethanol and wastes into natural gas (methane).
A drawing of a mold viewable by the first microscopes is also shown. The mold looks like flowers.
Part A, the various parts of a compound light microscope. At the top of the microscope are two eyepieces that you look through to view the specimen. These are on the top of a tube. On the other end of the tube are the objective lenses, which are placed directly above the specimen. On the side of the microscope body a knob focuses the objective lenses. Directly under the objective lens is the stage, a surface with a glass window that the specimen is placed on. A light under the specimen shines through the window and through the specimen. Between the light source and the stage is a condenser, which focuses and strengthens the light.
Part B, a diagram shows the path of light through a compound light microscope. Light travels from the source, through the condenser, then through the specimen. The light projects an image of the specimen through the objective lens and then inverted through the ocular lens. The objective lens magnifies the image ten, forty, or one hundred times and presents an inverted image. The ocular lens magnifies it an additional ten times. When the light passes into the eye of the viewer the image is inverted and the visualized image has been magnified one hundred, four hundred, or one thousand times.
The steps to stain cells for microscopic observation are as follows.
Step one, smear the culture across the slide and allow it to air dry.
Step two, briefly hold the slide over a flame to heat it. Flood the warm slide with stain, then rinse and dry it
Step three, place a small drop of oil on the center of the slide, then use the one hundred magnification objective lens to view it.
Part a. The steps to gram stain cells are as follows.
1. Flood the heat fixed smear with crystal violet for 1 min. The result is two large purple cells and a chain of four small purple cells.
2. Add iodine solution for 1 minute. The result is all six cells are still purple.
3. Decolorize with alcohol briefly, about 20 seconds. The result is the two larger cells, gram negative, turn gray and the gram positive stay purple.
4. Counterstain with safranin for 1 to 2 minutes. The result is the two large cells, gram negative, turn pink, while the four small cells, gram positive, remain purple.
Part b, clusters of pink, pill shaped cells and round purple cells. Part c, thick colonies of green rod shaped cells, with a few orange cells.
Part a, the bright field microscope image is low contrast, two dimensional grayscale image where the cell wall and some of the organelles, appear the darkest.
Part b, a phase contrast microscope creates a high contrast, three dimensional image where the cell wall and some organelles appear with a dark boundary and a lighter center.
Part c, a dark field microscope creates a three dimensional black and white image with negative contrast. The cell wall and some organelles of the cell shine bright white and other sections appear darker.
Part a, two rod shaped cells, one blue and one yellow, packed full of bright green, bean shaped structures in one row.
Part b, two rod shaped cells glow red under a fluorescence microscope with distinct inner structures.
Part c, some large clusters of cells glow blue green under a phase contrast microscope with several internal structures visible.
Part d, some large cells glow yellow and red under a fluorescent showing microscope.
Part e, small, pill shaped blue microbes glow with fluorescent dye under a microscope.
The top of the microscope is a thick cylinder. The top half of the cylinder holds the electron source and the lower half is the evacuated chamber. On the front of the microscope is a round window called the sample port, and at the bottom is a viewing screen.
Part a, a grayscale scan of a bacterial cell in the process of dividing. The cell wall and cytoplasmic membrane appear as dark gray, while the two nucleoids and the septum, the line at the center where the cell is diving, are lighter gray.
Part b, some clusters of flower like cells appear light gray on a dark gray screen. The cell walls and nuclei of the cells are darker than the cytoplasm.
Part c, some bacterial cells appear as light gray, three dimensional pills on a dark black background.
Pasteur’s swan necked flask experiment proceeds as follows.
Non sterile liquid is poured into a long necked flask.
A flame is used to heat the neck of the flask and stretch it out into a thin S shaped curve.
Heat is then placed under the liquid in order to sterilize it, and steam is forced out the opening of the flask.
As the liquid cools, dust and microbes collect in the neck of the flask, contaminating the neck but not the sterile liquid.
If the flask is tipped, the microbe filled dust will contaminate the liquid and it will putrefy.
If the flask is left upright, the dust will be stuck in the neck of the flask and the liquid will remain sterile for a very long time.
Postulates include the suspected pathogen must be present in all cases of the disease and absent from healthy animals, the suspected pathogen must be grown in pure culture, cells from a pure culture of the suspected pathogen must cause disease in a healthy animal, the suspected pathogen must be reisolated and shown to be the same as the original. The laboratory tools used in the experiment include microscopy and staining, laboratory cultures, experimental animals, and laboratory reisolation and culture. In the experimental aspects the blood is taken from a diseased rat. The rat’s blood contains both red blood cells and the suspected pathogen, which can then be grown in a petri dish. The colonies grown from the culture then inoculate a healthy rat. After that rat is sick or deceased, its blood can be taken. When the pathogens from the inoculated rat’s blood are cultured, they must be shown to be the same as those from the original diseased rat. the blood of a healthy rat will contain no pathogens, and will produce no organisms in a culture.
Part a, a healthy, orange and white lung tissue are infected with spores of black microbes.
Part b, a black tuberculosis cells grow on top of orange and white cells of healthy lung tissue.
Part C, some white cell colonies grow in a smear of infected blood on a glass slide.
Part d, blue black tuberculosis cells grow in long cordlike shapes.
Part a. One strain of pneumonia, Strain R, grows in rough colonies and does not have the ability to kill mice. A second strand, Strand S, grows in smooth colonies and does have the ability to kill mice. When the strains are combined, killed strain S and live Strain R transform to have smooth colonies and can kill mice. Part b. If only the D N A from strain S is transferred into strain R, strain R still transforms to have smooth colonies and can kill mice.
Part a, cells are isolated from organisms, and then D N A helices are isolated from these cells. D N A is copied by P C R and sequenced, which creates graphs of how many similarities different sequences of D N A have. Part b, by analyzing these sequences, relationships between organisms can be determined and sophisticated modern phylogenies can be created. A phylogenetic tree has a root of L U C A and different colored branches bacteria, archaea, and eukarya.
Part a. A diagram describes the process of cultivation-independent analysis of rRNA genes as follows. 1.Extract DNA directly from sample. 2. Make copies of rRNA genes by PCR. 3. Isolate individual DNA molecules from the DNA mixture, make copies of each, and then sequence the copies.
Part b. A graph shows haw analysis reveals the extent of biodiversity. The graph plots sequences observed versus year. The plot rises steadily, with increasing steepness from 0 in 1980 to 130,000 in 2014. Milestones responsible for the increases are marked as follows. 1985. Norm Pace describes rRNA-based cultivation analyses. 1995. Capillary sequencing increase output of DNA sequencing. 1999. Jo Handelsman describes metagenomic analyses. 2005. Massively parallel DNA sequencing methods. All values estimated.
Part A, phospholipids have crimped side chains of fatty acids. The ester linkage connects the ends of the chains to a glycerol which is connected to a phosphate group. Part B, the structure of the phospholipid bi layer is a double layered wall. Each molecule has a hydrophobic region in the wall’s center, and a hydrophilic region, which forms the wall’s outer layer. Part C, an electron micrograph image of the phospholipid bilayer in black and white. glycerophosphate forms hydrophilic outer layer while the fatty acid constitutes the hydrophobic center.
Integral membrane proteins embed the membrane so it touches both sides. Peripheral membrane proteins attach to the outer layer of the membrane both on the inside and outside. The width of the bilayer is 6 to 8 nanometers.
Part A, Glycerol diether is composed of the fatty acid phytanyl, with an ether linkage holding a glycerol group at one end. The phytanyl is made up of isoprene which is the parent structure. Isoprene 3 = phytanyl. Isoprene is H 2 C double bond C H single bond C with a C H 3 group with the central c double bonded to C H 2. Part B, diglycerol tetraethers are composed of the fatty acid biphytanyl and have glycerol groups at both ends. part C, the lipid crenarchaeol is composed a complex fatty acid chain, which includes pentagonal carbon rings and hexagonal carbon rings. The chain ends in glycerol groups on both ends. Part D, a lipid bilayer membrane is composed of a double layer of phytanyl fatty acids. Membrane proteins are embedded within the membrane and its glycerophosphate surface. Part E, a lipid monolayer in composed of just one layer of either biphytanylor or crenarchaeol. Membrane proteins are embedded in the membrane.
A key indicates solutes with dots, O H negative with a minus sign, and H positive with a plus sign. Part A, the permeability barrier prevents leakage and functions as a gateway for transport of nutrients into and wastes out of a cell solutes can pass in and out of the cell without assistance as indicated by arrows. Part B, protein anchor, proteins that participate in transport, bioenergetics, and chemotaxis, different shaped proteins are imbedded into the cell membrane and allow solutes to pass as needed. Part C, energy conservation where the cytoplasmic membrane is the site of generation and dissipation of the proton motive force, where the negative charges within the cell are separated from positive charges in the environment.
This graph places External concentration of the solute on the X axis and rate of solute entry on the Y axis. In simple diffusion, the rate at which the solute absorbs increases with a low slope with external concentration. With a low affinity transporter, the relationship is curved, and the rate is always higher than that of simple diffusion. With a high affinity transporter, saturation is achieved even when a very small amount of the solute is present, creating a very steep graph which plateaus to a gentler slope quickly.
Simple transport is driven by the energy in the proton motive force, the substance travels through a transmembrane transporter with a hydrogen ion. Group translocation is chemical modification of the transported substance driven by phosphoenolpyruvate, the phosphate breaks off the transporter and attaches to the transported substance. A B C transporter has periplasmic binding proteins involved and energy for transport comes from A T P, the periplasmic protein is labeled 1, the transmembrane transporter is labeled 2, the A T P hydrolyzing protein is labeled 4.
Part A, the cell wall of a gram positive cell is composed of the cytoplasmic membrane and then a thick layer of peptidoglycan, both embedded with proteins. Part B, the cell wall of a gram negative cell also contains a cytoplasmic membrane with a thin layer of peptidoglycan under it, and an additional outer membrane under that. Gram positive cells stain purple and gram negative cells stain pink.
Part b. The two layers of a gram positive cell wall, the cytoplasmic membrane on the inside and peptidoglycan layer on the outside.
Part c. The three layers of a gram negative cell wall, the inside cytoplasmic membrane, the middle peptidoglycan layer, and the outer membrane.
Part d. A gram positive cell has a fairly smooth exterior.
Part e. A gram negative cell has a textured surface like rope woven randomly upon it.
Glycerin tetrapeptide is made up of two hexagonal rings, N Acetylglucosamine and N Acetylmuramic Acid linked to each other by oxygen atoms labeled beta 1, 4. The bonds connecting the glucose molecules are sensitive to lysozymes. An N Acetyl group is attached to each carbon ring. The amino acids L Alanine, D Glutamic Acid, Diaminopimelic Acid and D Alanine are attached to the N Acetylmuramic Acid ring from the inside to the outside with peptide cross links.
Part A, the structure of peptidoglycan in a gram negative E Coli cell. A polysaccharide backbone attaches to a peptide composed of the amino acids L Alanine, D Glutamic Acid, Diaminopimelic Acid and D Alanine in that order. In e coli, the Diaminopimelic Acid of one glycerin tetrapeptide attaches to the D Alanine of the next with no interbridge. Part B, the structure of peptidoglycan in a gram positive staphylococcus aureus cell. The peptide here is composed of a L Alanine, D Glutamic Acid single bond N H 2, L Lysine and D Alanine. The L Lysine attaches to a glycine interbridge, which connects the D Alanine of the next glycerin tetrapeptide. Part C, the overall structure of peptidoglycan. N acetylglucosamine attaches to N acetylmuramic acid in a repeating chain. Glycosidic bonds confer strength in the X direction. Peptide bonds confer strength in the Y direction.
Part A, peptidoglycans form cables that wrap around the cell and create its membrane. Part B, Ribitol teichoic acid is comprised repeating phosphate based ribitol units. Each ribitol unit consists of two ribitol groups, connected by a backbone of 4 carbons. The first carbon is not attached to an additional group, two carbons are attached to a D Alanine, and one carbon attaches to a D Glucose. Part C, a cell wall has several things attached to it, including teichoic acids, wall associated proteins, and lipoteichoic acids which are embedded in the peptidoglycan layer and partially into the cytoplasmic membrane beneath it.
The pseudomurein backbone comprised of two carbon rings, N Acetylglucosamine and N Acetyltalosaminuronic Acid. The rings are linked by a lysozyme insensitive bond. Each ring is connected to an N acetyl group. The N Acetyltalosaminuronic acid is connected to a peptide of L Glutamine, L Alanine, and L Lysine. A peptide cross link connects this peptide the peptide of the next pseudomurein backbone.
Part A, the cytoplasmic membrane is under the cell wall. From innermost to outermost, the layers of a cell wall are as follows, the periplasm which is the space in between the two membranes, and the outer membrane. The periplasm consists of peptidoglycan and braun lipoprotein although the braun lipoproteins also go a little into the outer membrane. The outer membrane consists of bilayer of phospholipids, porins look like three tubes and go through the outer membrane and the lipopolysaccharide structure or L P S. The L P S is made of chains attached to the outer membrane bi layer phospholipid. The lipid A is attached to the phospholipid head layer. Off the lipid is the core polysaccharide and off of that is O specific polysaccharide. Part B, a black and white microscope scan of the three layers of the cell membrane. Part C, one of the embedded proteins, the porin protein, is roughly triangular and has tube like holes through it.
The O specific polysaccharide is a chain of sugars with three rings in the backbone and one ring branched out from the third ring repeating. The core polysaccharide consists of glucosamine with a glu nac branch, galactose, glucose with a galactrose branch, heptose with a heptose branch and a phosphate group, heptose with two phosphate groups, ketodeoxyoctonatewith a 2 ketodeoxyoctonate branch. The lipid A chains attach to two glucosamine and phosphate groups through its amine group.
Part a, a bacterial colony creates a thick slime, which hangs from an inoculating loop.
Part b, India ink stained bacterial cells appear as dark dots, surrounded by light capsules that have not been affected by the stain.
Part c, dark pill shaped bacterial cells with lighter, cloud shaped capsules surrounding their cell walls.
Part d, a small ovular cell with a large capsule surrounding it. The cell is a clearly defined oval in shape, while the capsule has a less defined form.
Part A, round archaea cells have fiber like appendages called hami extending from their surfaces. Part B, the end of a hamus works like a grappling hook to connect the cells to other cells and structures, several lie next to each other. Part C, a network of small archaea cells are connected by a multitude of hami.
Part A, the chemical structure of poly beta hydroxybutyrate a common poly beta hydroxyalkanoate. The molecule is composed of repeating chains of beta carbon units. A beta carbon unit is a backbone of three carbons and one oxygen with a C H 3 branched off the first carbon, and a double bonded oxygen branched off the third carbon. Part B, thin slices of bacterial cells contain granules of poly beta hydroxyalkanoates which have large sections of P H B in them. In a color photograph, poly beta hydroxyalkanoates containing bacteria are red rods.
Part a, coccus shaped magnetotactic bacteria. Chains of magnetosomes cross many of the cells.
Part b, isolated magnetosomes appear as chains of dark, square shaped particles.
Part c, a micrograph highlights the membrane surrounding each magnetosome in a chain.
Part A, cyano bacteria float in a bright green lake as a result of a cyanobacterial bloom. Part B, a cyanobacteria made up of circles in a chain each circle contains gas vesicle bundles.
Part C, a micrograph of a splitting cyanobacteria Microcystis contains bundles of gas vesicles. Some run parallel to the cross section and appear as rods, while others are perpendicular and appear as groups of circles.
Part A, terminal endospores present are pronounced circles at the end of rod shaped bacteria. Part B, subterminal endospores are bubbles near the end of some of the rod like cells. Part C, central endospores are in the center of the rod which makes the rods look like links on a chain.
The germination process of endospores is broken down into three phases. The first phase is the vegetative cell, with no endospore. These cells appear as solid, dark rods. In the second phase, the endospore develops in the sporulating cell. These appear as pronounced circles near the end of the cells. Finally, in the third phase the mature endospore is expelled and the cell returns to a vegetative state. The mature endospores are free floating, bright spheres outside of the cell.
Part A, the endospore appears as a bright sphere with a thin, dark border. Part B, as the endospore activates. The dark border thickens and extends toward the center of the cell. Part C, the dark border encloses the entire cell and it begins to extend into a rod with one bulbous end. Part D, the spore has lengthened in a mature, rod shaped, vegetative cell.
Part A, the structure of an endospore. The outermost layer is called the exosporium. Within that is the spore coat, which contains the cortex. The final boundary is the core wall, which the D N A is inside.
Part B, The spore coat is green. The mass inside the spore coat takes up about half of the cell’s total volume.
In stage one of the sporulation cycle, bacterial cells begin in a vegetative state of cell growth and division. In stage two, the cell begins to divide asymmetrically. About a quarter of the volume becomes the prespore, which is divided from the mother cell by a barrier called the septum. In stage three, the mother cell engulfs the spore. In stage four, the endospore goes through cortex formation, and the cell wall, cortex, and cytoplasmic membrane form around it. In stage five the spore coat forms and the spore uptakes a calcium cation and dipicolinic acid. In stages six and seven, the spore goes through maturation and cell lysis, where the endospore is expelled from the original cell. At this point the endospore germinates and becomes a new vegetative cell. The cycle can then be repeated, or the cell can enter a vegetative cycle of normal cell division.
Part A, Peritrichous flagella propel the cell by bundling together and rotating, then separating and rotating which is also called a tumble, and repeating. Part B, polar flagella propel the cell by rotating, either in reversible directions or unidirectionally where the cell will need to stop and reorient.
The flagellum are 15 to 20 nanometers in diameter and are made of flagellin circles in circular filaments. The hook is the place where the flagellum is attached to the bacteria the internal part is called the rod. The L ring secures the rod in the outer membrane. The periplasm is the space in between the outer and cytoplasmic membrane and has a peptidoglycan layer with an imbedded P ring to hold the rod. In the cytoplasmic membrane the rod is held by the M S ring on the outer side and the C ring on the inner side. In between the two are fli proteins which is notated motor switch. Rod shaped proteins called Mot proteins surround both rings. The mot protein, labeled A, ring is 45 nanometers diameter. Between the peptidoglycan layer and the mot proteins labeled A are spherical Mot proteins labeled B. The rings together are called the basal body or the flagellum. The second image is a close up of the basal body that is located inside of the cytoplasmic membrane. These two rings and the mot proteins make up a rotor that moves the flagellum. The rings have negative and positive charges that alternate in diagonal rows. The protons travel through the rod shaped mot proteins or stators and as the move through they pull the next negative charge on the ring towards them rotating the rings in a counter clockwise direction.
Synthesis of the flagella occurs in order as follows.
Early hook connecting to the internal rod and with a small gray pre cap on it
Late hook and cap the cap is the outer layer of the hook
Filament the filament grows between the cap and the hook and the hook gets a new gray precap which is called the hook filament junction
Part A. An archaellum embedded in the archaeal cell wall. The filament goes through the S layer to go between the fla J in the cytoplasmic membrane which is surrounded by fla L which is surrounded by Fla X. A T P is used on the fla X to rotate in a counter clockwise direction. Part B. Archaella isolated from the methanogen Methanococcus maripaludis. Part C. Cells of Methanocaldococcus jannaschii with many archaella.
Part A. The large filamentous cyanobacterium, Oscillatoria. Part B. Oscillatoria filaments gliding on an agar surface. The filaments have surly ends. Part C. Masses of the bacterium Flavobacterium johnsoniae gliding away from the center of the colony. There are globs in the middle and strings going outward. Part D. A nongliding mutant strain of Flavobacterium johnsoniae just looks like two circles.
Part A. Twitching mobility. A pilus extends from the cell, attaches to a surface, then retracts, resulting in movement. Part B. Gliding. A helical protein with attached adhesion protein surrounds a cell. As the cell rotates, adhesion proteins move in a helical pattern, pushing the cell forward.
Part A. A capillary is inserted into a bacterial suspension. Part B. The control capillary contains the same concentration of cells as the suspension. Part C. The capillary that contains an attractant contains a high concentration of cells compared to the suspension. Part D. The capillary that contains a repellent that contains a very low concentration of cells compared to the suspension. Part E. A graph plots number of cells in the capillary versus time for the attractant, repellent, and control. The attractant has far more cells than the control or repellent. The control has slightly higher cell counts than the repellent. Part F. The tracks of motile bacteria in seawater are traced as they swarm around an algal cell.
The cytoplasmic membrane is the outer part of the cell. The microfilament provide structure to the cell. The nucleus is at the center of the cell covered by the nuclear envelope which has pores in it called nuclear pores and with a nucleolus sphere inside it. The nucleus is surrounded by the rough endoplasmic reticulum which has ribosomes attached to it. The smooth endoplasmic reticulum is on the outside of the rough endoplasmic reticulum and does not have ribosomes. The ribosomes are scattered throughout the cell and are small spheres. The golgi apparatus sits in the cell not attached to any particular part, it is a folded organelle similar to the endoplasmic reticulum. The microtubules are either in a short rigatoni type shape or uncompressed if replicating. The mitochondrion is shaped like a bean and loose in the cell. The lysosome is sphere loose in the cell. A flagellum is a long tail on the cell.
Part A. A yeast cell that looks like the surface of the moon. A large dome is a nucleus with divots where the divots are pores. Medium size divots are vacuole. Small fossil like shapes are mitochondria. Part B. Histone H 1 structures are grouped together in fours and coiled by double stranded D N A to form a nucleosome core.
Part A, interphase is the regular cell state. Part B. Metaphase is when the chromosomes line up which looks like two back to back combs. Part C. Anaphase is when the chromosome pairs separate and look like two hands with the fingers outspread and facing each other. Part D. Telophase is when the cells renormalize as daughter cells.Part A, interphase is the regular cell state. Part B. Metaphase is when the chromosomes line up which looks like two back to back combs. Part C. Anaphase is when the chromosome pairs separate and look like two hands with the fingers outspread and facing each other. Part D. Telophase is when the cells renormalize as daughter cells.
Part A. In a mitochondrion the porous outer membrane gives way to the inner membrane, which includes a matrix which is an inter membrane space. The folded inside membrane is called Cristae. Part B. A nearly circular mitochondria with folded cristae inside. Part C. A long, rod shaped mitochondria with folded cristae inside.
Part A. A green algae cell highlights chlorophyll fluorescence in chloroplasts which are circles throughout the cell. Part B. The filamentous green alga Spirogyra the circular chloroplasts are linked into a spiral throughout the cell. Part C. A chloroplast of a diatom highlights thylakoid and stroma the thylakoids are the dark stripes and the stroma are light stripes.
Part A. A cell of Tetrahymena has a blue center organelle in the center and has many yellow antibodies around the outside. Part B. An animal cell in the metaphase of mitosis. A layer of tubulin separates two masses of chromosomes the cell is between meta and anaphase. Part C. The cellular slime mold Dictyostelium discoideum with lines scattered through it which are labeled microfilaments.
Part a. During catabolism, reactants yield products, synthesizing ATP. During anabolism, precursors yield cellular materials, consuming ATP and synthesizing ADP + P sub i. Part b. Both anabolism and Catabolism require a reduced electron donor which yields an oxidized electron donor during the process.
A tree of conserving energy is topped by energy sources which splits into chemicals and light. Chemicals leads down to chemotrophy which splits into organic chemicals like glucose, acetate, etcetera and inorganic chemicals like H 2, H 2 S, F e 2 positive, N H 4 positive, etcetera. Organic chemicals leads to chemoorganotrophs which use the equation glucose + 6 O 2 yielding 6 C O 2 + 6 H 2 O to form A T P. An example of this is Escheria coli. Going back to inorganic chemicals the next step is chemolithotrophs which use the equation H 2 S + one half O 2 yields S + H 2 O to form A T P. An example of this is Thiobacillus thiooxidans. Going back to light which steps down to phototrophy. Phototrophy leads to phototrophs which use light to form A T P. An example of this is Rhosobacter capsulatus.
S O 4 negative 2 or H S O 3 negative which has 2 electrons negative 0.52
C O 2 or glucose which has 24 electrons negative 0.43
2 H positive or H 2 which has 2 electrons negative 0.42
C O 2 or methanol which has 6 electrons negative 0.38
N A D positive or N A D H which has 2 electrons negative 0.32
C O 2 or acetate which has 8 electrons negative 0.28
S super 0 or H 2 S which has 2 electrons negative 0.28
C O 2 or C H 4 which has 8 electrons negative 0.24
F A D or F A D H which has 2 electrons negative 0.22
Pyruvate or lactate which has 2 electrons negative 0.19
S O 3 negative 2 or H 2 S which has 6 electrons negative 0.12
Adenosine phosphosulfate or A M P + H S O 3 negative which has 2 electrons negative 0.06
Fumarate or succinate which has 2 electrons positive 0.03
Cytochrome b sub ox and red which has 1 electrons positive 0.035
Ubiquinone sub ox and red which has 2 electrons positive 0.11
D M S O or D M S which has 2 electrons positive 0.16
F e positive 3 or F e positive 2 which has 1 electrons, which has p H 7 positive 0.2
Cytochrome c sub ox or red which has 1 electrons positive 0.25
Chlorobenzoatelectrons or benzoate which has 2 electrons positive 0.3
N O 2 negative or N O which has 2 electrons positive 0.36
Cytochrome a sub ox or red which has 1 electrons positive 0.39
N O 3 negative or N O 2 negative which has 2 electrons positive 0.42
S e O 4 negative 2 or S e O 3 negative 2 which has 2 electrons positive 0.48
N O 3 negative or one half N 2 which has 5 electrons positive 0.74
F e positive 3 or F e positive 2 which has 1 electrons, which has p H 2 positive 0.76
M n positive 4 or M n positive 2 which has 2 electrons positive 0.8
one half O 2 or H 2 O which has 2 electrons positive 0.82
C l O 3 negative or C l negative which has 4 electrons positive 1.03
An arrow indicates the substrates H 2 + fumarate on the table which yields succinate delta g super prime = negative 86 kilojoules. An arrow indicates the substrates H 2 + N O 3 negative on the table which yields N O 2 negative H 2 O delta g super prime = negative 163 kilojoules. An arrow indicates the substrates H 2 + one half O 2 on the table which yields H 2 O delta g super prime = negative 237 kilojoules.
N A D positive is made up of an A D P molecule where the second phosphate is attached to a ribose sugar molecule which is attached to nicotinamide. The Nicotinamide is made up a hexagonal ring with three double bonds and a nitrogen in it and a tail made of C attached to N H 2, the C is also double bonded to an O. When 2 H positive and 2 e negative attach to N A D positive that leads to the reduced form N A D H with an additional H attaching to the ring.
Enzyme 1 has an N A D positive binding side and an active site. Enzyme 1 reacts with an electron donor and oxidized form of coenzyme, N A D positive. The circle of N A D positive is changed into a square to demonstrate the change into N A D H. N A D H and the product are released from enzyme 1. Enzyme 2 has a N A D H binding site and an active site. Enzyme 2 reacts with electron acceptor and reduced form of coenzyme, N A D H. Once the reaction takes place in the enzyme substrate complex the product and N A D positive are released.
A plot representing 1 micrometer propionate rises diagonally from (negative 9, negative 65) to (negative 5, 90). A plot for 100 nanometers propionate rises diagonally from (negative 9, negative 100) to (negative 5, 60). The graph shows that there is a greater free energy yield, lower change in G, as reactant concentration increases. There is greater free energy yield as product concentration decreases. All values estimated.
A table of the energy in important microbial metabolism molecules.
Compound G super 0 prime kilojoules per mole energy above or below 30 kilo joules
Phosphoenolpyruvate has an energy rich anhydride bond. Adenosine triphosphate otherwise known as A T P has two energy rich anhydride bonds and an ester bond. Acetyl Co A has an energy rich thioester bond. Acetyl phosphate has an energy rich anhydride bond. Glucose 6 phosphate has an energy rich ester bond.
The graph begins at the energy level of substrates A and B and increases until the reaction takes place and then drops down to the energy level of Products C and D. The difference between the products and substrate energy is noted with delta G super 0 prime = G sub f super 0 left parenthesis C + D right parenthesis minus G sub f super 0 left parenthesis A + B right parenthesis. With no enzyme the increase over the substrate energy level is large with an enzyme it is small.
A substrate is bound to enzyme active site like a key into a lock. An enzyme substrate complex is formed. A strain is placed on bond. The products are released. The enzyme is ready to bend in a new catalytic cycle.
A stepwise path of glycolysis going through stage 1, stage 2, and stage 3. A list of glycolytic intermediates and enzymes. The intermediates are as follows, Glucose 6 P, Fructose 6 P, Fructose 1, 6 P, Dihydroxyacetone P, Glyceraldehyde 3 P, 1, 3 Bisphosphoglycerate, 3 P Glycerate, 2 P Glycerate, Phosphoenolpyruvate. The enzymes are as follows, Hexokinase, Isomerase, Phosphofructokinase, Aldolase, Triosephosphate isomerase, Glyceraldehyde 3 P dehydrogenase, Phosphoglycerokinase, Phosphoglyceromutase, Enolase, Pyruvate kinase, Lactate dehydrogenase, Pyruvate decarboxylase, Alcohol dehydrogenase. An energetics table is below the steps.
Yeast Glucose yields 2 ethanol + 2 C O 2 negative 239 27%
Lactic acid bacteria Glucose yields 2 lactate negative 196 33%
The citric acid cycle or C A C begins when the two carbon compound acetyl Co A condenses with the four carbon compound oxaloacetate to form the six carbon compound citrate. Through a series of oxidations and transformations, citrate is ultimately converted back to the four carbon compound oxaloacetate, which then begins another cycle with addition of the next molecule of acetyl Co A. Two redox reactions occur but no C O 2 is released from succinate to oxaloacetate. Oxaloacetate can be made from C 3 compounds by the addition of C O 2. The energetics table is below.
Glycolosis glucose + 2 N A D positive yields 2 pyruvate which goes on to C A C + A T P + 2 N A D H goes on to Complex 1
substrate level phosphorylation in glycolosis 2 A D P + P sub i yields 2 A T P
oxidative phosphorylation in glycolosis 2 N A D H yields 6 A T P
C A C 2 Pyruvate + 8 N A D positive + 2 G D P + 2 F A D yields 6 C O 2 + 8 N A D H which goes to complex 1 + 2 F A D H 2 which goes to complex 2 + 2 G T P which is similar to A T P
Substrate level phosphorylation in C A C 2 G D P + p sub i yields 2 G T P which is similar to A T P
oxidative phosphorylation in C A C 8 N A D H yields 24 A T P and 2 F A D H 2 yields 4 A T P
Total of glycolosis and C A C Glucose yields 6 C O 2 + 6 H 2 O yields 38 A T P
The citric acid cycle or C A C begins when the two carbon compound acetyl Co A condenses with the four carbon compound oxaloacetate to form the six carbon compound citrate. Through a series of oxidations and transformations, citrate is ultimately converted back to the four carbon compound oxaloacetate, which then begins another cycle with addition of the next molecule of acetyl Co A. Two redox reactions occur but no C O 2 is released from succinate to oxaloacetate. Oxaloacetate can be made from C 3 compounds by the addition of C O 2. The energetics table is below.
glucose + 2 N A D positive yields 2 pyruvate which goes on to C A C + A T P + 2 N A D H goes on to Complex 1
2 Pyruvate + 8 N A D positive + 2 G D P + 2 F A D yields 6 C O 2 + 8 N A D H which goes to complex 1 + 2 F A D H 2 which goes to complex 2 + 2 G T P which is similar to A T P
2 G D P + p sub i yields 2 G T P which is similar to A T P
8 N A D H yields 24 A T P and 2 F A D H 2 yields 4 A T P
Uptake, an organic compound, enters the cells. It yields an energy-rich compound. Substrate-level phosphoration occurs and ADP is synthesized from ATP, yielding an oxidized compound. The oxidized compound yields the fermentation product which is excreted from the cell. Redox recycling of N A D plus and N A D H occurs between the processes.
F M N + 2 electrons + 2 H yields a reduced F M N H 2. The F M N H 2 is the same as F M N except that two of the nitrogen double bonds in the rings have unbonded to take hydrogens. E sub 0 prime of half reaction = negative 0.22 volts.
One arrangement is a 4 member ring with S on two opposite corners and F e on two opposite corners. The other arrangement is a cube with alternate corners or the upper back left, upper forward right, lower back right, and lower forward left. The other corners are S atoms.
The e sub 0 prime of Co Q is about 0 volts. The oxidized from has double bonds attaching the oxygens to the carbon ring while the reduced form has single bonded O H groups instead.
As electrons enter the chain from a primary electron donor the E sub 0 prime is negative 0.22. When F M N H 2 reduces an F e and S protein protons are extruded the E sub 0 prime is negative 0.0. During the Q cycle reactions the E sub 0 prime is positive 0.1. cytochrome c has E sub 0 prime is positive 0.26. Electrons exit the chain by reducing the terminal electron acceptor which is O 2 the E sub 0 prime is positive 0.39. The E sub 0 prime total change is 1.14 volts.
Part a. The outer part of the A T P ase is F sub 1, the inter membrane part is F sub 0. The F sub 1 section transfers A D P and a phosphate into A T P. The F sub 0 section pumps the H positive ions. Part b. The basic shape is demonstrated in a space filling model as well with the rotor in the cell membrane and the bulbous upper section attached by the gamma like an inner trunk and an outer line piece which is b sub 2.
Lactic acid fermentation. Glucose, through glycolosis, yields 2 pyruvate, which yields 2 lactate. 2 N A D plus yields 2 N A D H, which yields 2 N A D plus. During S L P from glucose to 2 pyruvate, 2 A T P + 2 P sub i yields 2 A T P. Net, Glucose + 2 A D P + 2 P sub i yields 2 lactate + 2 A T P.
Aerobic respiration. Glucose, through glycolosis, yields 2 pyruvate, which, through C A C, yields 6 C O 2. 2 N A D plus yields 2 N A D H. 8 N A D plus then yields 8 N A D H, which after E T yields 10 N A D plus. 2 F A D then yields 2 F A D H 2, which after E T yields 2 F A D. During S L P from glucose to 2 pyruvate, 2 A D P + 2 P sub i yields 2 A T P. During E T, 24 H plus + 6 O 2 yields 12 H 2 0. During oxidative phosphorylation, 34 A D P + 34 P sub i yields 34 A T P.
Parts a and b. In chemoorganotrophy an electron donor which is an organic compound which can either go into fermentation or electron transport or generation of p m f to electron acceptors including S, N O 3 negative, S O 4 negative 2, or organic electron acceptors. It could also go to O 2 in aerobic respiration. In chemolithotrophy an electron donor which can be H 2, H 2 S, F e positive 2, or N H 4 positive which can go into electron transport or generation of p m f to electron acceptors including S, N O 3 negative, or S O 4 negative 2. It could also go to O 2 in aerobic respiration. Part c. There are three processes described. The first is photoheterotrophy where an organic compound turns into cell material. The second is unlabeled where light powers an electron transport into generation of p m f. The third is photoautotrophy where an C O 2 as well as electrons from H 2 O and H 2 S turns into cell material.
Part a. Aerobic respiration. During complex 1, when F M N H 2 reduces an F e and S protein, 4 H + protons are translocated. Complex 2 consists of citric acid cycle reactions, after which 2 H + are translocated. The result is cytochrome b o 3, where 2 H + are released.
Part b. Nitrate reduction. During complex 1, when F M N H 2 reduces an F e and S protein, 4 H + protons are translocated. Complex 2 consists of citric acid cycle reactions, with no H + translocated. The result is nitrate reductatse, where 2 H + are released.
Part a. C O 2 + ribulose bisphosphate yields ribulose bisphosphate carboxylase. After carboxylation, this C 5 compound yields two C 3 compounds. First, it yields an unstable intermediate. With the introduction of H 2 O, the intermediate yields two 3 phosphoglycerate, P G A. Note, Oxygenation––an alternative activity of R u B I s C O, rather than carboxylation.
Part b. While reversing the steps of glycosis, P G A + A T P yields 1, 3 Bisphosphoglycerate. 1, 3 Bisphosphoglycerate + A T P, with the introduction of N A D P H yields Glyceraldehyde 3-phosphate, which leads to biosynthesis.
Part c. In regeneration of C O 2 acceptor, Ribulose 5-phosphate + A T P, in the presence of Phosphoribulokinase, yields ribulose bisphosphate. Ribulose bisphosphate + A D P starts the cycle over.
Carboxylation. 6 Ribulose 1, 5 bisphosphate (30 carbons). RuBisCO + 6 C O 2 yields 12 1, 3 Phosphoglycerate (30 carbons).
Energy input. 12 1,3 Phosphoglycerate + A T P yields 1,3-Bisphospho- glycerate (36 carbons).
Reducing power input. 12 1,3 Phosphoglycerate + 12 N A D, P, H yields 12 Glyceraldehyde 3-phosphate (36 carbons).
Removal of 6 C for biosynthesis yields Fructose 6-phosphate (6 carbons), which exits the cycle.
Various sugar rearrangements. 10 Glyceraldehyde 3-phosphate (30 carbons) then yields 6 ribulose 5-phosphate (30 carbons).
Regeneration of C O 2 acceptor and energy input. Phosphoribulokinase. 6 ribulose 5-phosphate + 6 A T P yields 6 Ribulose 1, 5 bisphosphate.
Overall stoichiometry. 6 C O 2 + 12 N A D P H + 16 A T P + 12 N A D P plus + 18 A D P + 17 P sub i yields Fructose 6 phosphate.
Part a. The process is as follows. Electrons for nitrogenase are obtained. Pyruvate donates electrons to flavodoxin. Flavodoxin reduces dinitrogenase reductase. Nitrogenase activity commences. Electrons transferred to dinitrogenase one at a time. 2 ATP are consumed per electron. Part b. Sum. N, triple bond, N, in the presence of 4 H, after 2 H is translocated, yields H N, double bond, N H, in the presence of 2 H yields H 2 N, single bond, N H 2, in the presence of 2 H yields 2 N H 3. 16 A T P yields 16 A D P + 16 P sub i.
The structure of uridine diphosphosphoglucose. C 2, C 3, C 4, and C 5 compounds go through the citric acid cycle, then oxaloacetate, then phosphoenolpyruvate + C O 2. The reversal of glycolysis creates glucose 6 P. Glucose 6 P passes through the pentose phosphate pathway past steps ribulose 5 P + C O 2 and Ribose 5 P. The ribose then splits down two paths. One goes to ribonucleotides to R N A. The other goes to ribonucleotides and adds N A D P H to go through N A D P H dependent ribonucleotide reductase forms deoxyribonucleotides to create deoxyribonucleotides or D N A.
The primary production on the pentose phosphate pathway goes from glycolysis with a glucose 5 phosphate which then releases N A D P H to 6 phosphogluconate with then releases N A D P H and C O 2 to create Ribulose 5 phosphate. Other reactions in this pathway include isomerase on ribulose 5 phosphate to ribose 5 phosphate to xylulose 5 phosphate, transketolase which take the last two products to create C 7 + C 3 which pass through transaldolase to C 6 + C 4 where C 6 goes on to gluconeogensis and to C 4 is added C 5 to C 6 + C 3.
A table of the cycles and precursors is as follows.
Part of cycle Precursors Amino acid created by the precursor
Glycolysis Chlorismate, made from phosphoenolpyruvate Phenylalanine
Glycolysis Chlorismate, made from phosphoenolpyruvate Tyrosine
Glycolysis Chlorismate, made from phosphoenolpyruvate Tryptophan
Alpha ketoglutarate + N H 3 are combined by Glutamate dehydrogenase with N A D H to create glutamate with N H 2 branched + N A D positive. Glutamate with N H 2 branched + N H 3 combined by glutamine synthetase with A T P to Glutamine with N H 2 and N H 2 branched + A D P + P sub i. Glutamate with N H 2 branched + Oxaloacetate combined by transaminase to make alpha ketoglutarate + Aspartate N H 2 branched. Glutamine with N H 2 and N H 2 branched + alpha ketoglutarate is combined by glutamate synthase with N A D H to make 2 Glutamate N H 2 branched + N A D positive.
Part a. Purine skeleton. In the purine group, nitrogen 1 comes from the amino group of aspartate, carbons 2 and 6 come from a formyl group in folic acid, nitrogen 7 is from glycine, carbon 6 is from C O 2, nitrogens 3 and 9 come from an amide nitrogen of glutamine. Part b. The whole precursor is inosinic acid. Part c. Ortic acid. In the pyridimidine group the N H on the upper left is from N H 3, the C H on the upper right is from aspartic acid, the C double bond O is from C O 2. Part d. The whole precursor is uridylate.
Acetyl A C P and malonyl A C P combine to create acetoacetyl Co A + A C P + C O 2. Acetoacetyl combines with 2 N A D P H to create Acyl A C P and H 2 O and 2 N A D P positive. The Acyl A C P has an arrow down to a loop where every step brings in a Malonyl A C P and gives off a C O 2 while adding 2 more carbons to the chain until Palmitate with 16 carbons is created.
Part a. There is a key over a periodic table that indicates that essential for all microorganisms elements are highlighted in yellow, essential cations or anions for most microorganisms are in microorganisms elements are highlighted in pink, trace metal elements are highlighted in green, used for special functions elements are highlighted in purple, unessential but metabolized elements are highlighted in brown, and unessential not metabolized elements are highlighted in blue. Essential for all elements are mentioned in the text. Essential cations or anions include N a, M g, K, C a, and C l. Trace metals include V, M n, F e, C o, N i, C u, Z n, C u, Z n, M o, and W. Elements used for special functions include, B, F, S i, A s, C d, S r, B a, L a, C e, P r, and N d. Unessential and not metabolized elements include, H e, N e, A r, K r, X e, R n, Z r, N b, H f, T a, R e, O s, I r, and A t. All the rest are unessential but metabolized. Part b. A small table shows the macromolecular composition of the cell as follows.
Part c. A diagram shows the elemental composition of an E coli cell, dry weight.
Multicultural Education in a Pluralistic Society, 11ed
Micronutrients needed by microorganisms. the table is divided into two sections as follows.
Boron, B Autoinducer for quorum sensing in bacteria. Also found in some polyketide antibiotics
Cobalt, Co Vitamin B 12, transcarbamylase, only in propionic acid bacteria
Copper, C u In respiration, cytochrome c oxidase, in photosynthesis, plastocyanin, some superoxide dismutases.
Iron, F e Cytochromes, catalases, peroxidases, iron sulfur proteins, oxygenases, all nitrogenases
Manganese, M n Activator of many enzymes, component of certain superoxide dismutases and of the water splitting enzyme in oxygenic phototrophs, photosystem 2.
Molybdenum, M o Certain flavin containing enzymes, some nitrogenases, nitrate reductases, sulfite oxidases, D M S O T M A O reductases, some formate dehydrogenases
Nickel, N i Most hydrogenases, coenzyme F sub 430 of methanogens, carbon monoxide dehydrogenase, urease
Selenium, S e Formate dehydrogenase, some hydrogenases, the amino acid selenocysteine
Tungsten, W Some formate dehydrogenases, oxo transferases of hyperthermophiles
Zinc, Zn Carbonic anhydrase, nucleic acid polymerases, many DNA–binding proteins
P A B A, p aminobenzoic acid Precursor of folic acid,
Folic acid One carbon metabolism, methyl transfers
Biotin Fatty acid biosynthesis, some C O 2 fixation reactions
B 12, Cobalamin One carbon metabolism, synthesis of deoxyribose
B 6, Pyridoxal Amino acid or keto acid transformations
Nicotinic acid, Niacin Precursor of N A D positive
Lipoic acid Decarboxylation of pyruvate and alpha ketoglutarate
Coenzymes M and B, F sub 420 and F sub 430 Methanogenesis
Part A. A colony of Serratia marcescens streaked on a petri dish. Part B, A close up of Serratia marcescens at the center of the petri dish where each colony is a dot. Part C. Pseudomonas aeruginosa are small white circular colonies with transparent outer layers. Part D. Shigella flexneri are small pink circular colonies. Part E. A variety of bacterial colonies from diluted seawater have created small circular colonies in white and orange.
Part A. Transferring a liquid culture. The steps for transferring a liquid culture are as follows.
Flaming the tip of the tube sterilizes the surface.
Tube is recapped and then steps 2 to 6 are repeated with tube of fresh medium. Loop is then resterilized in the flame in between each tube.
Part B. Streaking a Petri plate. The steps for streaking a petri plate are as follows.
Loop is sterilized and a loopful of inoculum is removed from tube.
Initial streak is streaked back and forth in one fourth edge of the agar plate. Then the plate is turned one fifth and the plate is streaked again in one direction. This second step is then repeated for the third and fourth streaks. Then the plate is turned one fifth and the plate is streaked again in one direction but this time towards the center.
Appearance of well streaked plate after incubation shows colonies of the bacterium micrococcus luteus on a blood agar plate. There is confluent growth at the first step of the streak and then on the fifth step there are multiple single circular colonies.
The sample is added to a coverslip that rests on a series of ridges that support it. Care must be taken not to allow overflow. Space between coverslip and slide is 0.02 millimeters. the whole grid has 25 large squares, a total area of 1 square millimeter and a total volume of 0.02 cubic millimeters. Microscopic observation, all cells are counted in a large square, made of 16 small squares, there are 12 cells in the example. In practice, several large squares are counted and the numbers are averaged. To calculate the number per milliliter of sample, the equation is 12 cells times 25 large squares, times 50, times 10 cubed.
In the spread plate method, the sample is pipetted onto the surface of an agar plate, the sample is spread evenly over the surface with a sterile glass spreader, and the plate is incubated to get an even distribution of small colonies. In the pour plate method, the sample is pipetted onto a sterile plate, a sterile medium is added mixed well with the inoculum, and solidification and incubation produce a plate with a distribution of colonies with varying size.
1 milliliter of a sample is added to a tube with 9 milliliters of broth to get a dilution of 10 to the negative first power. 1 milliliter of that is added to another tube with 9 milliliters of broth to get a dilution of 10 to the negative second power. This is repeated 4 more times to get samples with dilutions of 10 to the negative third power, 10 to the negative fourth power, 10 to the negative fifth power, and 10 to the negative sixth power. 1 milliliter of each is incubated on an agar plate, the results are as follows.
Dilution 10 to the negative 1, too many colonies to count.
Dilution 10 to the negative 2, too many colonies to count.
Dilution 10 to the negative 3 is used to calculate the number of cells per milliliter of the original sample. the plate count of 159 is multiplied by the dilution factor, 10 to the third, to get a result of 1.59 times 10 to the fifth cells per milliliter.
Part A. Light is shined into a prism to create incident light, which is passed through a filter before is shines on a sample containing cells. A photocell measures the unscattered light and a spectrophotometer records optical density. Part B. The optical density of 2 organisms, A and B, is recorded over time. Both organisms’ optical density rises quickly then plateaus, with organism A maintaining a higher optical density overall. Organism A plateaus at a density of about 0.8 after 25 hours, and organism B plateaus at a density of about 0.4 after 27 hours. Part C. Optical density is plotted against cell numbers or dry weight mass. The theoretical value increases at a constant rate, but the actual curve starts to fall off slightly after 0.7 optical density. Part D. 4 samples of Escherichia coli with increasing optical density from left to right. The optical density is 0, 0.18, 0.45, and 0.68. The cells per milliliter are 0, 1.3 times 10 to the eighth power, 3.3 times 10 to the eighth power, and 5 times 10 to the eighth power. Higher optical density results in a more cloudy appearance in the test tube.
A plot for viable count rises gradually during lag and steeply during exponential before plateauing in stationary and falling off in decline.
The data for a cell population that doubles every 30 minutes is described as follows.
Part B. A graph plots number of cells on an arithmetic scale versus time in hours. A logarithmic plot increases by a factor of 10 every hour and a half, A arithmetic plot starts out slowly but rises with increasing steepness, surpassing the logarithmic scale at about 5 hours.
Part A of two graphs calculating microbial growth parameters. A cell population that doubles every 6 hours is represented by a line with a slope equal to, log of, 4 times 10 to the seventh power, minus log of, 2 times 10 to the seventh power, all over 6. The resulting slope is 0.05. t = 6 h, n = 1, g = t over n. Part B of two graphs calculating microbial growth parameters. A cell population that doubles every 6 hours is represented by a line with a slope equal to, log of, 10 to the eighth power, minus log of, 5 times 10 to the seventh power, all over 2. The resulting slope is 0.15. t = 2, n = 1, g = t over n. Part c. A list of exponential growth equations is as follows. Note. g = generation time, t = time, N sub t = cell number at time t, N 0 = starting cell number, n = number of generations, k = specific growth rate.
n = start fraction log N t minus log N 0 over 0.301 end fraction.
Part A is an illustration of a chemostat. Fresh medium is supplied from a reservoir and must pass through a flow rate regulator before it enters the culture vessel above the culture, another tube provides sterile air or other gas to the bottom of the culture. The culture vessel contains a culture in liquid and a gaseous headspace in the culture vessel. Overflow from the culture is pushed through a channel that is aligned with the top of the culture and effluent containing microbial cells is released. Part B. A chemostat setup in a lab next to several other set ups surrounded by tubes.
Limiting nutrient concentration, bacterial concentration, and doubling time are measured against dilution rate in the chemostat. As dilution rate increases, doubling time falls with decreasing steepness and limiting nutrient concentration rises with increasing steepness. Bacterial concentration rises with decreasing steepness from 0 to 0.25, plateaus from 0.25 to 0.75, and falls with increasing steepness back to zero from 0.75 to 1.
Types of cell division in bacteria are categorized as follows.
Binary fission, where one cell splits into two equal parts, most bacteria.
Simple budding where a cell makes a smaller version of itself, Pirellula, blastobacter.
Budding from hyphae where a bud is created off a stalk, Hyphomicrobium, Rhodomicrobium, Pedomicrobium.
Cell division of stalked organism where a cell daughter that has a flagellum is made from a stalked cell, Caulobacter.
Polar growth without differentiation of cell size, Rhodopseudomonas, Nitrobacter, Methylosinus.
A graph plots growth rate versus temperature. The lowest temperature where growth occurs is labeled minimum. At this point, membrane gelling occurs and transport processes are so slow that growth cannot occur. As temperature rises, so does the growth rate, Enzymatic reactions occur as increasingly rapid rates. Growth rate hits a peak, labeled optimum, before it starts to fall again. Enzymatic reactions occur as the maximal possible rate. Continued heating results in a rapid decline in growth rate until it once again reaches 0 at a point labeled maximum. Protein denaturation occurs, the cytoplasmic membrane collapses and causes thermal lysis.
A graph plots growth rate versus temperature in degrees Celsius for various types of organisms. The minimum, optimum, and maximum for each is as follows.
Psychrophile Polaromonas vacuolata negative 5 4 13
Thermophile Geobacillus stearothermophilus 41 60 68
Part A. A core of frozen seawater from McMurdo Sound, Antarctica a dark band is sampled for image b. Part B. A sample of microorganisms found in the frozen seawater core are enlarged and look rectangular. Part C. A sample of Polaromonas a rod shaped bacteria. Part D. Lake Bonney in the McMurdo Dry Valleys, Antarctica is covered in ice. Part E. Garwood Glacier, McMurdo Dry Valleys, Antarctica with 20 meter drop offs on the edges.
At 90 degrees, 100 % activity is maintained. At 100 degrees, activity falls to 70 % after an hour. At 110 degrees, activity falls to 10 % by the fourth hour. At 110 degrees plus C a. 2 plus, activity falls to 0 within a half hour.
The scale runs from 0 to 14, lower values are more acidic and higher values are more basic. A value of 7 represents neutrality. Examples of substances are given for each p H level as follows.
p H 0. No example. Moles per liter of H positive is 1 and moles per liter of 10 to the negative fourteenth power.
p H 1. Volcanic soils and waters, gastric fluids. Moles per liter of H positive is 10 to the negative first power and moles per liter of 10 to the negative thirteenth power.
p H 2. Lemon juice, acid mine drainage, vinegar. Moles per liter of H positive is 10 to the negative second power and moles per liter of 10 to the negative twelfth power.
p H 3. rhubarb, peaches. Moles per liter of H positive is 10 to the negative third power and moles per liter of 10 to the negative eleventh power.
p H 4. Acid soil, tomatoes. Moles per liter of H positive is 10 to the negative fourth power and moles per liter of 10 to the negative tenth power.
p H 5. American cheese, cabbage. Moles per liter of H positive is 10 to the negative fifth power and moles per liter of 10 to the negative ninth power.
p H 6. Peas, corn, salmon, shrimp. Moles per liter of H positive is 10 to the negative sixth power and moles per liter of 10 to the negative eighth power.
p H 7. Pure water. Moles per liter of H positive is 10 to the negative seventh power and moles per liter of 10 to the negative seventh power.
p H 8. Sea water. Moles per liter of H positive is 10 to the negative eighth power and moles per liter of 10 to the negative sixth power.
p H 9. Very alkaline natural soil. Moles per liter of H positive is 10 to the negative ninth power and moles per liter of 10 to the negative fifth power.
p H 10. Alkaline lakes, soap solutions. Moles per liter of H positive is 10 to the negative tenth power and moles per liter of 10 to the negative fourth power.
p H 11. Household ammonia. Moles per liter of H positive is 10 to the negative eleventh power and moles per liter of 10 to the negative third power.
p H 12. Extremely alkaline soda lakes, unsaturated lime solution. Moles per liter of H positive is 10 to the negative twelfth power and moles per liter of 10 to the negative second power.
p H 13. No example. Moles per liter of H positive is 10 to the negative thirteenth power and moles per liter of 10 to the negative first power.
p H 14. No example. Moles per liter of H positive is 10 to the negative fourteenth power and moles per liter of 1.
A graph plots growth rate versus percent N a C l for microorganisms with different salt tolerances. Non Halophiles such as Escherichia coli have an optimum at 0 % salt and a maximum at 1 %. Halotolerant organisms, such as staphylococcus aureus, have an optimal of 1 % and a maximum of 11 %. Halophiles, such as aliivibrio fischeri, have a minimum of 0 %, an optimum of 7 %, and a maximum of 12 %. Extreme halophiles, such as halobacterium salinarum, have a minimum of 11 %, an optimum of 18 %, and no measured maximum.
There are 5 tubes labeled a through e. There is a pink oxic zone and a tan anoxic zone. Where the bacteria grow is noted by black dots. In tube a, the bacteria are in the oxic zone only. In tube b, the bacteria have settled at the bottom of the container, none touch the surface. In tube c, the bacteria are throughout the container but are more concentrated in the oxic zone. In tube d, there are a few in the oxic zone but most are right below the anoxic surface. In tube e, the bacteria are spread evenly.
O 2 + electron + 2 H positive H 2 O 2, hydrogen peroxide
H 2 O 2 + electron + H positive H 2 O + O H positive, hydroxyl radical
The outcome is O 2 + 4 electrons + 4 H positive yield 2 H 2 O.
H 2 O 2 + H 2 O 2 yields 2 H 2 O + O 2 is a catalase reaction. H 2 O 2 + N A D H + H positive yields 2 H 2 O + N A D positive is a peroxidase reaction. O 2 negative + O 2 negative + 2 H positive yield H 2 O 2 + O 2 is a superoxide dismutase reaction. 4 O 2 negative + 4 H positive yield 2 H 2 O + 3 O 2 is a superoxide dismutase and catalase in combination. O 2 negative + 2 H positive + rubredoxin sub reduced yields H 2 O 2 + rubredoxin sub oxidized is a superoxide reductase.
Part a. The y axis is Survival percentage and the x axis is time in minutes. There is a horizontal line indicating only 10 percent survives or the decimal reduction time. The line 50 degrees runs from (0, 100) to (40, 10). The line 60 degrees runs from (0, 100) to (12, 10). The line 70 degrees runs from (0, 100) to (4, 10). Part b. The y axis is decimal reduction time and the x axis is temperature in Celsius. The line a degrees runs from (102, 5) to (116, 0.05). The line b degrees runs from (107, 30) to (0.09, 125). The line c degrees runs from (112, 100) to (130, 0.9).
Part a. The flow of steam through an autoclave. An autoclave is made up of several parts. On the bottom, the steam enters past a steam supply valve. The steam travels through the jacket chamber which surrounds the main chamber. The steam then travels in a pipe above the chamber to loop back to the main chamber and enter behind a shield at the back of the main chamber. The steam exits the main chamber at the top and bottom towards the door on the front. On the top, the tube is monitored by a chamber pressure gauge and a steam exhaust valve while it exits through steam exhaust. On the bottom, the steam tube has a thermometer and valve and exits through the vent. Part b. A graph of the autoclave cycle. A graph has two lines on y axis temperatures and time in minutes. The first line is the autoclave itself which has flowing steam to keep it at 100 degrees when off. When turned on the pressure begins and the temperature goes from 100 to 121 in about 10 minutes. The autoclave stays on for 15 minutes and stays hot for one minute after the steam is turned off then decreases over 24 minutes back to 100 degrees. The steam and pressure combine for the autoclave time. The object in the autoclave gets put in at 0 minutes when the machine is turned on. The temperature increases over 15 minutes to 120 degrees and stays there for 15 minutes which is the sterilization time. The temperature then decreases to 100 degrees over 30 minutes. Part c. The autoclave. An autoclave is a tall, rectangular, metal cabinet with a small door at its center.
Bacteriostatic cell count and viable cell count go up steadily and stay the same for about the same amount of time before going up equally again when the agent is removed. Bactericidal cell count and viable cell count go up equally until the agent is added then total cell count stays the same and viable cell count goes down steadily. Bacteriolytic cell count and viable cell count go up steadily once the agent is added both go down steadily and equally.
10 test tubes vary with anti microbial dilution amount. The three on the left most side have maximum growth with a large amount of opacity. The middle 4 loose opacity as they move to the right. The last three are transparent and have no growth. The third tube from the right side is labeled minimum inhibitory concentration.
10 test tubes vary with anti microbial dilution amount. The three on the left most side have maximum growth with a large amount of opacity. The middle 4 loose opacity as they move to the right. The last three are transparent and have no growth. The third tube from the right side is labeled minimum inhibitory concentration.
Part A. The ebola virion is striated and helical. Part B. A 3 D surface representation of an ebola tomograph. There are spikes on both sides and lines of orange inside the spikes. A green layer inside the orange and a blue wrapped purple layer in the center. Part C. The influenza virus has s shaped and c shaped cells surrounded by an envelope. Part D. the vaccina virus has round, nearly symmetrical cells surrounded by an envelope.
Part A. The steps of making a plaque assay. The cell phage mixture made of molten top agar, bacterial cells and diluted phage suspension is poured onto a solidified nutrient agar plate. The mixture is left to solidify into a sandwich of top agar and nutrient agar and incubation allows for bacterial growth and phage replication. The end product has a lawn of host cells and spots of phage plaques. Part B. Plaques formed by bacteriophage on a host lawn on a nutrient agar plate. The host lawn is consistent and plagues are dots.
The steps in the replication cycle of a bacterial virus are as follows.
Penetration of viral nucleic acid while the protein coat remains outside.
Synthesis of viral nucleic acid and protein in the host cell.
Assembly and packaging of new viruses in the host cell.
From the time the virus is added, the relative virus count stays constant while early enzymes, nucleic acids, and protein coats are formed. This stage is known as the eclipse virus stage and the latent period in virus count. As assembly occurs during the maturation phase, virus count rapidly increases after the virions are released.
Examples of cell bacteriophages and their receptor sites are as follows.
It attaches by settling on L P S with its tail fibers that are attached to the tail by tail pins and injects its genome with a tail tube through the outer membrane to the site of tail lysozyme activity on the cytoplasmic membrane.
At zero minutes infection occurs. Between 5 and 15 minutes phage D N A replication occurs. Between 20 and 24 minutes self assembly occurs. Between 24 to 25 minutes lysis occurs. During replication, early, middle, and late m R N A are transcribed from 0 minutes to 18 minutes and proteins are translated from 2 minutes to 20 minutes.
Part A. A prohead is constructed from scaffold, capsid, and portal proteins. Scaffold proteins run along the inside of the head's sphere and capsid proteins run along the outside. Portal proteins run along the neck of the prohead. When the first part is complete a packaging motor is attached to the portal protein neck. d s D N A is added into the prohead and scaffold proteins are discarded. After assembly steps are completed, the packaging motor is discarded. Part B. A reconstruction of a T 4 prohead and packaging motor. The structure includes portal, capsid, and A T P ase proteins around the neck while the D N A is being uploaded.
After a temperate virus injects its D N A into a host cell, it can either go down the lytic pathway or the lysogenic pathway. In the lytic path, phage components are synthesized and assembled before the cell undergoes lysis. In the lysogenic path, the Viral D N A is integrated into the host D N A and replicates with the host during cell division. Some of the cells produced undergo induction, which makes them follow the lytic pathway.
If the cell replicates, it could lead to tumor cell division. If the virus multiplies, lysis occurs when the cell dies and the virus is released, a persistent infection occurs when the virus is released slowly without killing the cell, and a latent infection occurs when the virus is present but does not replicate.
Virions infect adjacent cell and move into vascular system.
Part a. D N A undergoes replication to make more D N A. R N A is produced from D N A by transcription. R N A is converted by translation into amino acid sequences in proteins. Nucleic acids and proteins are called informational macromolecules. Part b. D N A’s nucleic acid backbone alternates between sugar and phosphate molecules. The first phosphate is linked by a 5 prime carbon on the first sugar labeled, 5 prime position, and a 3 prime on the second sugar, labeled 3 position. On this same sugar H is linked to H 2 prime, labeled O H in R N A, Deoxyribose, and finally H prime is labeled in the base position as a nitrogen base attached to the 1 prime position. This represents a nucleotide, sugar, base, and phosphate. The next sugar is labeled phosphodiester bond, and is attached to a new sequence of nucleoside, sugar plus base. Part c. Nitrogen bases of D N A and R N A are paired between cytosine and guanine, and between thymine and adenine via hydrogen bonds. In a cytosine and guanine pairing, cytosine and guanine are bonded via a hydrogen bond. Both pairings show a presence of D N A and R N A. Cytosine is labeled, pyrimidine, and guanine is labeled, purine. The location of the bond to the backbone on the ring is labeled 1, and at numbering is completed through position 6 in a counter clockwise direction. In a thymine and adenine pairing, only D N A is present in thymine. Thymine is labeled, pyrimidine, and adenine is labeled, purine. A C H 3 molecule binds to the system of rings and is labeled, absent in uracil, R N A only. Both D N A and R N A are present in adenine.
Part a. A computer model of a D N A segment shows a sugar phosphate backbone with a minor groove at the first helical turn and a second major groove at the second helical turn. One helical turn, 10 base pairs, measures 3.4 nanometers. Part b. An atomic force microscopy shows the structure of D N A and the locations of the major and minor groove.
Part a. The supercoiling process is as follows. A relaxed circular D N A strand is a complete helix. One part of circle is laid over the other. Helix makes contact in two places. D N A gyrase makes double-strand break. Unbroken helix is passed through the break and break is resealed by D N A gyrase, resulting in supercoiled D N A. Part b. A chromosomal D N A with supercoiled domains includes a center ring of proteins with 7 strands of supercoiled circular D N A stretching out in the shape of a starfish. An atomic force microscopy shows the Escherichia coli nucleotide at the end of one supercoiled domain. A simultaneous phase contrast and fluorescence image of e coli shows the location of the nucleotide at the end of each strand.
In replication, both strands of D N A are templates for the new D N A strands. When the helix separates into two strands, D N A polymerase goes between them to begin the process. During transcription, one of the stands becomes a template for R N A synthesis. On this strand and R N A polymerase forms to help bind the m R N A strand to the 5 primes strand. During translation, messenger R N A is the template for protein synthesis. The M R N A strand shows a ribosome where t R N A attaches as a protein chain, labeled, His single bond C O O H, and single bond Leu, single bond Leu, single bond Arg, single bond Met, single bond H 2 N.
Fluorescence microscopy and protein tagging shows how E coli cells grow. R N A polymerase and ribosomes overlap in position during transcription and translation. When combined, R N A polymerase, m R N A, ribosomes, and a nucleoid are coupled. A close up shows a ribosome actively translating an m R N A as it is synthesized by R N A polymerase. A nucleoid, polypeptide and ribosome form during this process
A circular figure is labeled, Escherichia coli K 12, 4629675 base pairs, and shows the map locations of 100 kilobases of D N A as follows.
The inner circle is labeled, Plasmid R 100, and shows the size in kilo base pairs. Points are labeled equidance from each other from the top center at, 94.3 and 0, right, 25, bottom, 50, and left, 75 kilo base pairs. The outer circle shows the location of antibiotic resistance genes. The locations of major antibiotic resistance genes and other key functions are as follows.
Mercuric ion resistance, streptomycin resistance, chloramphenicol resistance, and intersertion sequence 1, between 0 and 25 kilobase pairs.
Insertion sequence 10 and transposon 10 between 25 kilobase pairs and 50 kilobase pairs.
Origin of conjugative transfer and transfer functions between 50 and 80 kilobase pairs.
Replication functions between 88 and 94.3 kilobase pairs.
Part a. An overview of D N A replication. D N A replication is a semiconservative process in all cells. Two new double helices are formed which each contain one new daughter strand and one parent strand. Part b. An extension of a D N A chain shows that growth proceeds from both the 5 prime phosphate to the 3 prime hydroxyl from a growing point on the base. D N A polymerase activity results in P P sub i being cleaved off of the base. A phosphodiester bond is formed between the two bases and a deoxyribonucleoside triphosphate makes up the growth at the 3 prime end.
A close up of the end of a supercoiled chromosome shows a single strand binding protein at the 5 prime end of a strand. A D N A polymerase 3 is at the end of a leading strand of an R N A primer as it attaches to the 3 prime end of the D N A strand. Primase and R N A primers attached to the lagging strand of D N A in short segments in order to continue their work from 5 to 3.
D N A polymerase 3 synthesizes D N A strand from 5 to 3 prime end. A polymerase R N A primer helps to connects to the other piece of the segmented strand. D N A polymerase 1 replaces the D N A polymerase 3. The excised R N A primer leaves the strand as D N A ligase replaces polymerase 1. D N A ligase seals the two fragments together, which forms a final, complete product of complementary and antiparallel double stranded D N A. The now sealed gap shows a 3 prime O H and a 5 prime P binding the gap.
A circular D N A has an origin of replication and a terminus of replication. Replisome binds and initiated synthesis forming a theta structure which looks like a loop forming inside a circle with a replication fork of newly synthesized D N A. The Origin, the D N A A binding site, leading and lagging strands of D N A A form, so that parts of the center part of the D N A contains for separate strands. Replication forks continue synthesis in opposite directions until the forks hit terminus of replication and collide, releasing two chromosome copies, or two circular D N A strands.
The replisome consists of D N A polymerase 3 and D N A gyrase, in addition to a D N A helicase and primase which forms the primosome. Starting at the leading strand template, in the direction of new synthesis, the Tau connects the two D N A polymerase and helicase. D N A gyrase removes supercoils in the D N A to be replicated in opposite directions. Single strand binding proteins form on uncoiled D N A. The lagging strand template loops around to move in the direction of new synthesis.
Proofreading beings at the time of nucleotide insertion. Abnormal hydrogen bonding occurs where there is a mismatched nucleotide within D N A polymerase 3. Normal hydrogen bonding occurs at the 3 prime end of the D N A strand.
Mismatched nucleotide is excised from the growing D N A strand.
Correct nucleotide is inserted into the growing D N A strand.
Part b. A micrograph shows a large cluster of E coli D N A polymerase surrounding and bound to a D N A double helix.
Part a. A sigma factor recognizes promoter and initiation sites along the strand of D N A. R N A polymerase moves down the D N A chain. The Sigma factor binds to the strand near the R N A polymerase, core enzyme. Transcription begins and sigma is released as the R N A chain grows. Termination site is reached and the chain growth stops. Polymerase and R N A is then released. Part b. A close up electron micrograph image shows that shorter transcripts grow into longer transcripts farther into the transcription process and that several transcripts occur at once.
Three representations of cellular R N A polymerase structures include Bacteria, Archaea, and Eukarya as follows.
Bacteria, Thermus aquaticus, 4 subunits, alpha sub two, beta, beta prime, omega.
Part b. 6 different promoter sequences are identified as E coli, and each have different promoter sequences within. Consensus sequences are derived from many different promoter sequences and are highlighted red within the 35 region and the Pribnow box regions of each of the D N A strands.
A D N A strand is comprised of a promoter, a spacer, gene encoding 16 S r N A, gene encoding at t R N A, gene encoding at 23 S r N A, gene encoding at 5 S r N A and a transcription terminator. An R N A strand is comprised of a spacer, a gene encoding a t R N A strand, and a primary transcript. The process removes the spacers which undergo degradation, to form a mature transcript comprised of 16 S r N A, t R N A, 23 S r N A, and 4 S r R N A.
The Operon is labeled as follows, Promoter, 5 prime leader, gene 1, gene 2, gene 3, transcription terminator. Through transcription, the polycistronic m R N A is formed, and is labeled, O R F 1, O R F 2, O R F 3, corresponding to each gene.
Part a. Inverted repeats exist within a strand of D N A. Transcription of the lower strands results in a R N A chain, which forms a secondary structure in the shape of a stem loop. Stem loop in R N A immediately upstream from a run of uracils leads to transcription termination. Part b. The formation of the terminator stem loop in the R N A within the R N A polymerase shows a five prime to 3 prime strand of R N A forming on one of the strands of D N A.
A strand of D N A includes three promoter elements, B R E, T A T A and I N I T. Binding of T B P and T F P allows for the binding of R N A polymerase, and results in transcription. A surface representation shows the transcription factor T F E, R N A polymerase, T F B, T B P, and the D N A strand.
A primary transcript contains a single intron. Its ends are labeled Exon 1 at the 5 prime end and Exon 2 and the 3 prime end. Conserved bases G U and A G are labeled. Ribonucleoprotein particles assemble on a spliceosome. Cutting of the 5 prime splice site results in the formation of lariat. Cutting of the 3 prime splice site results in the joining of exons. Two exons join the 3 prime splice site and a branch point forms at the 5 prime splice site. Intron, lariat, is degraded, and the mature m R N A is exported to the cytoplasm for transcription.
In the nucleus, a strand of D N A, from 5 prime to 3 prime is labeled, Start, Exon 1, Intron, Exon 2, Intron, Exon 3, Stop, Intron, Poly A site. The addition of a 5 prime cap and 3 prime polyadenylation, poly a tail, removes the introns and clips the 3 prime end of the transcript as the introns are excised, the protein in the mature M R N A is exported to the cytoplasm and translation.
The general structure of an amino acid is an amino group, H 2 N, single bonded to a Carbon, the alpha carbon, which is bonded to H, R, and C. C is double bonded to O and single bonded to O H, and make up a carboxylic group. The structure of the amino acid R groups are as follows.
Serine, S e r, S, H O single bond C H 2 single bond
Threonine, T h r, T, C H 3 single bond C H single bond O H single bond
Asparagine, A s n, N, H 2 N, single bond C double bond O and single bond C H 2 single bond
Glutamine, G l n, Q, H 2 N, single bond C double bond O and single bond C H 2 single bond C H 2 single bond
Cysteine, C y s, C, H S single bond C H 2 single bond
Selenocysteine, S e c, U, H S e single bond C H 2 single bond
Tyrosine, T y r, Y, H O single bond benzene ring C H 2 single bond
Aspartate, A s P, D, negative O single bond C double bond O and single bond C H 2 single bond
Glutamate, G l u, E, negative O single bond C double bond O and single bond C H 2 single bond C H 2 single bond.
Lysine, L y s, K, positive N H 3 single bond C H 2 single bond C H 2 single bond C H 2 single bond C H 2 single bond.
Pyrrolysine, P y l, O, H 3 C single bond C H single bond H 2 C single bond C H 2 single bond N double bond C single bond C double bond O and single bond N H single bond C H 2, sub 4, single bond.
Arginine, A r g, R, positive N H 2 double bond C single bond N H 2 and single bond N H, single bond C H 2 single bond C H 2 single bond C HC 2 single bond.
Histidine, H i s, H, pentagonal ring with H N positive and N H in it and a C H 2 single bond on one side.
Valine, V a l, V. C H 3 single bond C H, single bond C H 3, single bond.
Leucine, L e u, L, C H 3 single bond C H single bond C H 3. C H is single bonded to C H 2.
Isoleucine, I l e, I. C H 3 single bond C H 2 single bond C H, single bond C H 3, single bond.
Methionine, M e t, M. C H 3 single bond S single bond C H 2 single bond C H 2 single bond.
Phenylalanine, P h e, F, benzene single bond C H 2 single bond.
Tryptophan, T r p, W, benzene sharing a double bond with pentagonal ring at carbon 4 of the ring, C H 2 single bond.
Proline, P r o, P, pentagonal ring single bonded to C O O negative at C 2.
Aspartate and glutamate are ionizable, acidic. Lysine, Pyrrolysine, Arginine, and Histidine are ionizable, basic. Serine, Threonine, asparagine, glutamine, cysteine, selenocysteine, and tyrosine are non ionizable polar. Glycine, alanine, valine, leucine, isoleucine, methionine, phenylalanine, tryptophan, and proline are non polar hydrophobic. Because proline lacks a free amino group, the entire structure of this amino acid is shown not just the R group.
on O H group and a H group come together and release H 2 O. The resulting compound has a c to N single bond. The double protein has an N terminus side and a C terminus side.
Part a. Amino acids in a polypeptide. Hydrogen bonding in the structure snows amino n terminus on one end of the strand and a C terminus on the other end. Part b. An alpha helix secondary structure shows O to H hydrogen bonds between nearby amino acids within the structure. Part c. A beta sheet secondary structure that looks like fan folded sheets that were released shows hydrogen bonds between distant amino acids in other words between proteins on adjacent strands.
Insulin contains two polypeptide chains, labeled a and b chain, and a beta sheet. The alpha chains are held in shape with disulfide linkages. Ribonuclease is a larger protein with two sites of alpha helix and several beta sheets.
Part a. From the 3 prime end to the 5 prime end the parts of the structure are as follows, acceptor end, T psi C loop, base pairings, anti codon paired to an R N A strand’s codon, Anticodon stem, D loop, and the acceptor stem.
The uncharged t R N A specific for valine in other words t R N A superscript V a l, the amino acid valine, and A M P are all attached to an aminoacyl t R N A synthetase for valine. The linkage of valine to t R N A superscript VAL results in a charged valyl t R N A ready for protein synthesis. A computer model shows the interaction of aminoacyl t R N A synthetase with the t R N A which has an acceptor stem and an anticodon loop.
An M R N A interior sequence strand is labeled, from 5 prime to 3 prime, A A C A U A C C G A U C A C. The correct frame, shifted 0 places, is labeled A, A C A, U A C, C G A, U C A, C. The amino acids encoded are, T h r, T y r, A r g, and S e r. The incorrect frame, shifted negative 1 places, is labeled, A A C, A U A, C C G, A U C, A C. The amino acids encoded are, A s n, I l e, P r o, I l e, T h r. The incorrect frame, shifted positive one places, is labeled, A A, C A U, A C C, G A U, C A C. The amino acids encoded are, H i s, T h r, A s p, H i s.
Aninitiator t R N A which carries met and binds to the ribosome which binds to the binding site, R B S on m R N A. The ribosome starts out as a small subunit of the ribosome, small 30 s subunit. Energy from G T P adds a large subunit to the initiation complex. A, P and E Sites are formed on the large ribosomal subunit for the t R N A to attach to.
A ribosome begins with a t R N A attached to a P site. Incoming t R N A enters the A site during the initiation complex during codon recognition. A peptide bond forms which passes the amino acid from the first t R N A to the second t R N A to begin the polypeptide strand. Translocation requires E F T U and E F T sub s, translation moves both t R N A over one allowing the first now empty t R N A to move on to the e or exit site to be released while the t R N A with the two amino acid polypeptide is on site P. The cycle continues three times, resulting in a growing peptide with 5 amino acids on it.
Several m R N A can translate at once. 4 ribosomes are shown on the m R N A with increasingly long polypeptides attached as they attach and move down the m R N A one at a time.
A defective m R N A which is missing its stop codon stalls a ribosome with a partially synthesized polypeptide. To solve this a t m R N A binds on the A site, translation continues to the stop codon which is provided by t m R N A.
Part a. Activity of chaperone proteins. An improperly folded protein is refolded by D n A K or D n A J which is powered by A T P, or by a molecular chaperone G r o E L or G R o E S which also uses A T P, into a properly folded, active protein. Part b. In the cytoplasm, Na r J chaperone binds to N a r G H and inserts M O cofactor into the enzyme. N a r J dissociates from the N a R G H complex and the cofactor containing enzyme binds to membrane bound Nar l.
The translation apparatus consists of a ribosome and protein on an m R N A sequence, without a signal sequence. A Sec A or signal recognition particle, attaches to the protein and carries the protein to the membrane secretion system within the cytoplasmic membrane. The protein is secreted into periplasm if attached to sec A or is inserted into the membrane if attached to a signal recognition particle.
Secretion system 1 is made up of two wider tubes and a small tube i the middle and goes all the way through the membranes. Secretion system 2 is made up of two wider tubes goes all the way through the membranes. Secretion system sec or tat is made up of a bread looking protein in the cytoplasmic membrane which transports proteins into the periplasm space. Secretion system 5 is made up of one wider tube goes from the periplasm space through the outer membranes. Secretion system 3 is goes all the way through the membranes and through the host cell membrane. Secretion system 4 is goes all the way through the membranes and through the host cell membrane to transfer D N A. Secretion system 6 is made up of a wider and then smaller tube in the cytoplasmic membrane which stops in the periplasm space but then has a retracted sheath with a needle tip that punches through the whole membrane and the host cell membrane.
D N A has several zones. The zones are activation, repression which includes the promoter zone, R B S, structural gene, and terminator. The D N A was then transcribed into R N A. The R N A zones are R B S and a structural gene with start codon and stop codon. The R N A was then transcribed into a protein. The protein has 4 mechanisms of controlling enzyme activity. These mechanisms are feedback inhibition, protein to protein interactions, degradation, and covalent modifications.
The top domain contains protein to protein contacts, which holds the protein dimer together. The D N A binding domain on the other side fits in the major groove on the D N A along sugar phosphate backbone.
Part a. In a D N A binding protein one attachment side is the recognition helix, the other side is the stabilizing helix and the connection point between the two sides is the turn. Part b. A computer model of both subunits of the bacteriophage lambda repressor bound to its operator with two sides that are like legs.
Part a. When an inducer + activator protein binds to the activator binding site promoter R N A polymerase, transcriptions proceeds. Part b. When repressor protein + compressor binds to the operator site, transcription is blocked. Allosteric change resulting from effector binding allows protein to bind DNA.
Part a. A graph of Enzyme repression. Cell number and total protein levels increase steadily over time. Arginine biosynthesis enzymes increase steadily as well until arginine is added and then the enzymes immediately plateau. Part b. Enzyme repression in the arginine operon. When the D N A binding protein has no added to the repressor then transcription is not blocked and proceeds. Part c. When corepressor protein acts on the repressor protein the repressor can connect to the arg operator and transcription is blocked.
Part a. A graph of enzyme induction. Cell number and total protein levels increase steadily over time. beta galactosidase is at a plateau until lactose is added and then the enzyme increases rapidly. Part b. Enzyme induction in the lactose operon. When the D N A binding protein attaches to the lac operator section ahead of the R N A polymerase, transcription is blocked. Part c. When an inducer acts on the repressor protein the repressor can not connect and transcription proceeds.
One activator site is next to the promotor site and the activator protein and R N A polymerase attach right next to each other. One activator site is far away from the promoter site and the D N A has to make a loop so the activator protein and R N A polymerase can attach back to back.
Part a. A maltose activator protein and R N A polymerase hover above D N A where no transcription takes place. Part b. When an inducer attaches to the maltose activator protein then it can attach to the activator binding site which allows R N A polymerase to attach and transcription to proceed.
The E coli D N A is circular. There is a lac section in the upper right which translates to the left, and three mal sections between the top and left sides that translate left or right. The lac section has a lac regulatory protein and the mal sections have a mal regulatory protein.
N r p R blocks T F B and T B P binding and prevents transcription. If an alpha ketoglutarate attaches to N r p R then the N r p R release and T F B can bind so that transcription can proceed.
Part a. T r m B L 1 binds to D N A blocking R N A polymerase blocking transcription. Maltose binds to T r m B L 1 allowing it to be released and for R N A polymerase to bind allowing transcription. Part b. T r m B L 1 recruits the initiation complex by binding upstream. Maltose binds to T r m B L 1 allowing it to be released and which prevents T B P and T F B from binding which prevents transcription.
An environmental signal is attached to a sensor kinase which triggers an A T P reaction to phosphorylate the kinase. The phosphate is pulled from a response regulator. When the response regulator has its phosphate the transcription on the D N A is blocked.
Part a. The protein Env Z phosphorylates Omp R when osmotic pressure changes which are moderated by Omp F and Omp C. More Omp C creation is started by high osmotic pressure. Omp F is created under low osmotic pressure and is repressed under high osmotic pressure. Part b. Through kinase activity, nitrogen regulator N R I I yields N R I I p, which binds to the activator binding site, causing D N A to loop around so that the regulator makes contact with R N A polymerase at the promoter site. Transcription proceeds. When there is an ammonia excess, N R I I p yields N R I I through phosphatase activity and there is no transcription.
Decreased attractant binding to M C P triggers phosphorylation of the che A and che w complex. M C P is both methylated and de methylated. Che A and Che w phosphorylate che Y and che B. Phosphorylated Che y binds to flagellar switch. Che Z dephosphorylates phosphorylated che y.
Part a. Cells of the same species release A H L which is taken in by the cell and attaches to an activator protein. The activator protein attaches to the chromosomes. Chromosomes create quorum specific proteins and A H L synthase. Quorum specific proteins also attach to A H L synthase. A H L is then released from the cell. Part b. The structure of A H L or Acyl homoserine lactone is a carbon chain attached to a nitrogen which is attached to a pentose ring.
Part a. In an E. coli cell in an intestinal cell an A l 3 synthase makes A l 3 which leaves the E. coli. A l 3 and intestinal hormones are taken in to the E. coli cell and attach to sensor kinases which activate transcriptional regulators which activate toxin production. The toxins then leave the E. coli and enter the intestinal cell. Part b. Basal transcription of pre A I P is converted to A I P by Arg B which is in the cell membrane and is exported out of the cell. Binding of A I P to Arg C which is in the cell membrane leads to autophosphorylation which causes Arg C to change to Arg A. Phosphorylated Arg A activates expression of genes required for pre A I P and virulence proteins.
The cell grows steeply on glucose and then plateaus when glucose is exhausted. The cell growth then picks up again at a slower rate with lactose. The rate of beta galactosidase increases steeply when glucose runs out.
Two C R P proteins attach to each other and to c A M P and then binds to D N A with R N A polymerase. Transcription occurs on both sides of the binding site. Translation occurs fine on one side to go on to lactose catabolism. The other side has an inducer attached to it, active repressor binds to operator and blocks translation.
In Part a, a graph shows R N A and protein growth. First growth increases steadily, then when p p g p p and p p p g p p the growth plateaus. This plateau is labeled stringent response. Once p p g p p and p p p g p p starts decreasing the R N A and protein growth rate increasing again. In Part b, the structure of p p G p p is shown. Four phosphate groups come off of a pentagon ring two on the left side and two on the bottom, on the right side guanine is attached. In Part c, A charged t R N A provides normal translation. In part D, uncharged t R N A stops activity, which triggers synthesis of p p p g p p and p p g p p. When stringent response is activated, r R N A and t R N A syntheses decreased, amino acid biosynthetic operons are activated, cell division is halted, and stress survival pathways are activated.
In a limited stress environment like a nutrient rich large intestine E. coli has normal division. In a stringent environment like a river where amino acids, carbon, iron, or phosphate starvation occurs cell division is arrested. In a limited stress environment like an oligotrophic or low level of nutrients lake caulobacter crescentus has mostly stalked cells. In a stringent environment like an ammonia or carbon starved lake caulobacter crescentus has mostly swarmer cells. In a limited stress environment like healthy lungs mycobacterium tuberculosis has a small amount of persister cells. In a stringent environment like lungs with an immune response mycobacterium tuberculosis has a large amount of persister cells. Antibiotics can kill vegetative cells but not persister cells and these cells remain to form granulomas.
A low phosphate signal is sent to pho R. Pho R kinase starts phosphorylating Pho P. Phosphorylated Pho P represses genes encoding activators for antibiotic synthesis which reduces antibiotic production. Phosphorylated Pho P represses gln A and amt B which lowers nitrogen metabolism. Phosphorylated Pho P activates genes encoding phosphate uptake proteins which increases phosphorus metabolism.
In low temperature R p o H is attached to D n a K which either leads to degradation of R p o H or if the temperature increases R p o H is released and is free to transcribe heat shock genes. In low temperature is a normal protein, if this shifts into high temperature the protein unfolds which is called denaturing. D n a K binds and refolds proteins.
In Part a, m R N A must have an open R B S site to be translated. A straight piece of m R N A is translated. A piece of R N A with a s R N A attached to R B S is not translated. A bent piece of R N A has no translation. S R N A attached to an area that is not R B S does have translation. In Part b, ribonuclease degrades R N A. A straight piece of m R N A is translated. A ribonuclease attached behind a bonded piece of s R N A degrades R N A. A ribonuclease bonded to a strait piece of R N A degrades. A piece of R N A with a piece of s R N A over the ribonuclease binding site prevents attachment and degradation.
S g r S is red and pts G m R N A is shown in green. At zero minutes the cells have many green spots and few red. At 10 minutes the cells have many red spots and few green.
Part a. Regulation by a riboswitch. In translational regulation, a metabolite can bond to an initial domain to create a loop with the second and third domains rather than the first and second. This prevents translation. Part b. In transcriptional regulation, the secondary structure of the ribosome domain is inverted, resulting a terminator. Transcription is then terminated.
D N A with P, O, L regions in front of trp structural genes. The L section reads met, lys, ala, ile, phe, val, leu, lys, gly, trp, trp, arg, thr, ser with both trp highlighted. In section b, there are L sections from threonine, histidine, and phenylalanine. The threonine is Met, Lys, Arg, Ile, Ser, Thr, Thr, Ile, Thr, Thr, Thr, Ile, Thr, Ile, Thr, Thr, Gly, Asn, Gly, Ala, Gly with the thr and ile highlighted. The histidine is Met, Thr, Arg, Val, Gln, Phe, Lys, His, His, His, His, His, His, His, Pro, Asp with the his highlighted. The phenykakanine is Met, Lys, His, Ile, Pro, Phe, Phe, Phe, Ala, Phe, Phe, Phe, Thr, Phe, Pro with the phe highlighted.
Part a. The ribosome starts out with a trp rich leader peptide and the 3 and 4 domains on the m R N A link causing transcription to terminate before tryptophan structural genes are transcribed. Part b. The ribosome starts out with a leader peptide and the 2 and 3 domains on the m R N A link causing transcription to continue and transcribe tryptophan structural genes.
Part a. The path reads that the starting substrate and the allosteric enzyme A change to intermediate 1. Enzyme b leads to intermediate 2. Enzyme c leads to intermediate 3. Enzyme d leads to the end product. The end product then blocks enzyme A. Part b. In enzyme A either the end product which is an allosteric effector or a substrate can bind to the enzyme. If the end product binds inhibition takes place and there is no reaction. If the substrate binds then activity takes place and there is a reaction. Part c. Phosphoenol pyruvate + erythrose 4 phosphate are the initial substrates in a path that runs through three D A H P isoenzymes to create chorismate which can create tyrosine, phenylalanine, or tryptophan. Any of these three end products can block one kind of D A H P isoenzyme partially but all three are needed to block it fully.
Part a. Active glutamine synthetase. If not bound to glutamine, G l n D possesses uridyltransferase activity. P I I, U M P stimulates glutamine synthetase adenylyltransferase to deadenylate G S. Part b, Inactive glutamine synthetase. Binding of glutamine triggers G l n D to remove U M P from P I I. P I I stimulates glutamine synthetase adenylyltransferase activity. Part c, G S fully active. G S A M P 6, half active with 6 glutamine attached to it. G S A M P 12, inactive with 12 glutamine attached to it. The more glutamine attached to G S, the higher the concentration of glutamine.
Part a. Under normal conditions, R p o E is sequestered at the membrane by R s e A which is imbedded in the cytoplasmic membrane and O M P is a channel imbedded in the outer membrane, so no transcription takes place. Part b, Membrane stress unfolds O M P into the periplasm, triggering degradation of R s e A and freeing of R p o E and then transcription occurs.
Part A. During endospore formation in Bacillus one side is highlighted in red and the other smaller side is highlighted in green. Part B. The Escherichia coli chromosome during cell cycle progression, ori c and both sides of the cell are highlighted. Part C. Time lapse in an elongated E coli cell shows a section being created and destroyed. Part D. Synthesis is visible at the septum region of several cells, progressing in a concentric fashion.
Part A. A map of the movement of the nucleoid binding protein M u k B in an individual Escherichia coli cell. There are 4 sections highlighted and the cell is filed with straight lines jumbled together. Part B. Caulobacter cellular structures. One pop Z is on each side of each cell. Several crestins are in a line across the cell width wise.
The steps of the bacterial cell cycle are as follows.
The step in G 1 is binding of D N A A to o r i C initiates replication.
The first step in S phase is blocking of o r i C regions by S e q A and cell elongation.
The second step in S phase is segregation of chromosomes.
Part A. E coli cells that double every 60 minutes use a single replication fork, which takes 40 minutes to replicate. Part B. Cells that double every 20 minutes use multiple replication forks, which take still take 40 minutes to replicate completely but multiple are made at once.
Different pieces of this process are notated in a key. The para a activity notates the new section of the cell. Pop Z indicates the old pole of the cell and the terminus indicates the new pole. Replisomes duplicate the D N A. Par B and par s combine and hold one end to the old pole and pull the other end to the new pole.
Part A. A cut away of a rod shaped cell shows a f t s Z ring within the cytoplasmic membrane as well as zip a which attaches f t s z to the membrane and the assistor f t s including f t s a, f t s l, and f t s k. f t s z and f t s a are powered. Part B. A time lapse of f t s Z ring activity during cell division. the f t s z ring forms a ring in the center of the cell.
At minute zero the cell is in its regular state, with a nucleoid with a min c d and then min e wrapped around it and the outside of the cell wrapped in a cell membrane which is wrapped in a cell wall. At 20 minutes the center ring of the cell gathers min. At 40 minutes the center ring of the cell continues to gather min and the cell elongates. At 60 minutes the f t s z ring forms and a divisive complex collects. At 80 minutes the septum forms and the nucleoid separates into two parts, min e returns to normal.
Part A. M r e B on both sides of a F t s Z ring move perpendicularly to the long axis of the cell. Part B. Cells of Bacillus subtilis. The first image is normal and the second image has fluorescing rings that run perpendicular to the long axis. Part C. Cells of Caulobacter crescentus which show their c shape forming proteins fluorescently.
The Phylogeny of alphaproteobacteria is broken down into branches of a tree as follows.
Hyphomicrobium denitrificans, budding, rod with stalk shape.
Agrobacterium tumefaciens, polar elongation, rod shape.
Prosthecomicrobium hirschii, budding, amoeboid shape.
Ancalomicrobium adentum, budding, star like shape.
Hirshia baltica, budding, two circles connected by a line with a flagella on one end.
Caulobacter crescentus, lateral elongation, two rods with a flagella on both ends.
Escherichia coli, lateral elongation, a rod shape.
Part A. In cocci cells, cell wall synthesis is focused entirely around the Fts Z ring during cell division wall bands form around it and pull away from each other to create a growth zone. Part B. Streptococcus hemolyticus cells show cell wall growth during division the first has a distinct septum and the second has three clear lines for the wall bands and the septum.
Part A. Inactive spo 2 A A is attached to a phosphor group. Desiccation, cell density, and starvation leads to spo 0 A which leads to spo 2 E which removes the phosphorus group. Active Spo 2 A A and spo 2 A B connected to sigma f comes in and splits with the active spo 2 A A binding to the spo 2 A B and the sigma factor is released. Part B. Signal from endospore activates sigma E early and endospore genes are transcribed. A Signal from the mother cell triggers synthesis of sigma G in the endospore and pro sigma K in the mother cell. A signal from the endospore activates sigma K.
Stage 1. Receptor binding to germinant; cation and DPA release; partial rehydration.
Stage 2. Cortex hydrolysis, further hydration; membrane remodelling.
Stage 3. Metabolism and cell wall biosynthesis; cell elongation and escape from spore coats
In G 1 the swarmer loses its flagellum. In s phase the cell forms a stalk. in the G 2 phase the parent cell has a stalk and the daughter cell has a flagellum. The stalked cell is released and the swarmer cell is reproduced again.
Part A. A filament of Anabaena with highlighted heterocysts at regular intervals. Part B. Fixed carbon from photosynthesis in the vegetative cells is transferred to the heterocyst, while the heterocyst provides them fixed nitrogen. Part C. An increase in alpha ketoglutarate concentration leads to N t c A activation and h e t R expression. This leads to H e t R activating genes necessary for heterocyst formation.
Part A. The steps of biofilm formation are as follows.
Attachment, adhesion of a few motile cells to a suitable solid surface.
Colonization, intercellular communication, growth, and polysaccharide formation.
Development, more growth and polysaccharide, water channels form.
Active dispersal, triggered by environmental factors such as nutrient availability.
Part B. A biofilm on a stainless steel pipe, stained with D A P I there are large gaps in the biofilm which are called water channels.
Cyclic di guanosine monophosphate is made up of two guanosines and two riboses. G T P is converted to c d i G M P using the following processes. 1. Transcription factors. 2. Riboswitches 3. Protein modification. 4. GGDEF and phosphodiesterases
Part A. A time series micrograph shows the growth R b m A, R b m C, and B a p 1 during biofilm formation after 120, 180, and 270 minutes. Part B. At low cell density, biofilm formation is promoted. Part C. At high cell density, biofilm formation is inhibited.
Mechanisms of antibiotic resistance are as follows.
Part A, a bacteria sample is exposed to antibiotics in order to isolate persisters. The antibiotics are then removed and the persisters grow and multiply. Part B, Normally Hip B attaches to Hip A sequestering it, if long poly p is around they don’t bind and the toxin is free to distribute itself, slowing cell growth. Part C. The Mechanism of Hip A toxin. Hip A phosphorylates glt X which prevents the charging of t R N A and suppresses growth.
During transduction, a virus-infected cell releases a transducing particle which enters a recpient cell with U V-light induced D N A damage. During conjugation, a conjugation bridge forms between a plasmid-donating cell and the recipient cell, through which material is passed. During transformation, a cell releases free D N A and vesicles containing D N A. Retracting pilus from the recipient cell retrieve the free D N A, or the vesicles fuse to it.
Wild type. Top row. P m a l, m a l K, l a m B, m a l M. Bottom row. P m a l, m a l Q.
M 1, deletion of l a m B. Top row. P m a l, m a l K, m a l M. Bottom row. P m a l, m a l Q.
M 2, mutation in m a l Q. Top row. P m a l, m a l K, l a m B, m a l M. Bottom row. P m a l, mutation, m a l Q.
Part b. A plate of Escherichia coli grows in three cultures, 1 wild type and 2 mutant strands. The wild type is stained red while the two mutant types remain yellow.
Part A. Antibody resistant bacteria grow within the inhibition zone of an antibiotic assay disc. Part B. A sample of wild type and mutant Serratia marcescens. Wild type are deep red and mutants are white. Part C. Colonies of Halobacterium. Wild types are pink, while mutant types are brownish red.
Bacteria from a master plate is grown on a complete medium. The first step is to pick and transfer colonies to a fresh medium, either complete or selective, and arrange in a grid-like pattern. For the second step, using a sterile toothpick, incubate and examine plates. In the complete medium, all colonies grow, including the centrally positioned mutants. In the selective medium, the mutants do not grow.
A dark green strand of 5 prime d n a reading t a c is bonded to a light green strand of 5 prime d n a reading a t g. The bond has 3 mutation variations and one normal d n a replication. When transcription of the light green strand occurs, the m r n a reads u a c, which bonds to Tyrosine, which is a normal protein representing a wild type. The mutated strands read as follows. When base pairs t a mutate to form a t, it results in an m r n a strand of a a c, which bonds to asparagine, which is a faulty protein representing a missense mutation. When base pairs c g mutate to form g c, it results in an m r n a strand of u a g, which bonds to stop, which is an incomplete protein representing a nonsense mutation. When base pairs c g mutate to form t a, it results in an m r n a strand of u a u, which bonds to Tyrosine, which is a normal protein representing a silent mutation.
A dark green strand of d n a reading g t g c c t g t t is bonded to a light green strand of d n a reading c a c g g a c a a. When transcription off of light green strand occurs, m r n a strand has 3 codons of g u g, c c u, and g u u. This represents a normal protein with a reading frame of zero. When inserting a c g pair, the d n a strands read g t g c c c t g t t and c a c g g g a c a a respectively. Transcriptions off of light green strands result a in m r n a strand reading g u g, c c c, u g u, u. This results in a reading frame of plus 1. When deleting a c g pair, the d n a strands read g t g c t g t t and c a c g a c a a respectively. Transcription off of light green strand results in a m r n a strand reading g u g, c u g, u u. This results in a reading frame of negative 1.
A d n a strand reads g t c. A nonsense mutation occurs, resulting in a g to a transition. The transcription of the mutated d n a in a nonsense mutation leads to a 5 prime to 3 prime strand reading u a g.
An electromagnetic spectrum gives wavelength ranges for different types of light and radiation as follows.
Ionizing radiation, greater than 10 to the negative 6 to 10 nanometers.
X rays, 10 to the negative 5 to 10 to the negative 1 nanometers.
In transformation, the donor cell undergoes lysis and the D N A is released into the recipient cell. In transduction, the donor cell is injected with viruses and the chromosomes are disrupted. when the viruses burst out of the donor cell, they carry the cell’s D N A with them and inject it into the recipient cell. In conjugation, the donor cell and the recipient cells are directly connected to one another. In a plasmid transfer, a plasmid from the donor cell is moved into the recipient cell. In chromosome transfer, a donor cell with an integrated plasmid transfers a chromosome to the recipient cell.
The steps are as follows. 1. Binding D N A. A double stranded D N A is bound by D N A binding proteins in the bacteria’s membrane. 2. Uptake of single-stranded D N A. Nuclease degrades one of the D N A strands while the other is drawn into the cell. 3. RecA-mediated homologous recombination. The D N A strand is bound by proteins and recombined with the bacterial chromosome. The D N A is fully integrated into the cell.
In the lytic cycle, a phage attaches to a donor cell and injects D N A into it. The phage D N A destroys the host D N A and more phages are produced along with transducing particles that contain the donor cell D N A. The cell bursts, and these are released. Transduction occurs when a transducing particle attaches to a cell and injects D N A into it. The cell undergoes homologous recombination, and a transduced cell is produced.
A lysogenized cell contains a host chromosome with phage D N A and genes that code for galactose. Part A. The steps of the normal event are as follows.
Phage D N A circularizes and detaches from host D N A
A portion of host D N A is exchanged for phage D N A.
Defective phage that can transduce galactose genes are released.
Part A. The steps of plasmid D N A transfer are as follows.
Cell pairs are stabilized. F plasmid nicked in one strand
Transfer of one stand from F positive cell to F negative cell. F plasmid simultaneously replicated in F positive cell
Synthesis of the complementary strand begins in the recipient cell.
Completion of D N A transfer and synthesis. Cells separate. \
Part B. The replication and transfer process of the F plasmid. Part C. D N A transfer by conjugation. Donor cell containing a plasmid with the l a c O region makes contact with recipient cell. L a c l G F P in the recipient cell binds to the l a c O region on the transferred plasmid after conjugation.
The steps to transfer chromosomal D N A by conjugation are as follows.
Synthesis of second strand in recipient and donor cells.
Part a. A bacterial chromosome is labeled with letters A to Z, with A at the top and continuing alphabetically in a clockwise direction. F plasmids are marked between B and C, G and H, L and M, and W and X. In order, these are labeled H f r 1, 4, 2, and 3. Part b. In h f r 1, Gene C is donated first, in clockwise order. in h f r 2, L is donated first, in counter clockwise order. In h f r 3, X is donated first, in clockwise order. In h f r 4, G is donated first, in counter clockwise order.
Part A. I S 2 transcripts t n p from right to left and has inverted repeats at both ends. Part B. T n 5 consists of segments I S 5 0 L and I S 5 0 R, which border the gene sequence k A n, s t r, and b l e o to the left and right respectively. I S 5 0 L contains a nonsense mutation. I S 5 0 R Transcripts t n p from right to left.
Part a. A transposable element with Inverted repeats on both sides is inserted into a target D N A sequence, resulting in duplicated target sequences on both sides of the transposed element. Part b. In conservative transposition, the transposon is excised from its donor, resulting in a D N A with a break. In replicative transposition, the transposon replicates and the donor D N A is undamaged.
Outcomes are as follows. a. Successful infection b. Modification of virus receptor-no infection c. Restriction endonuclease degrades foreign DNA d. Phage exclusion, enzyme modifies viral DNA, preventing its replication e. Abortive infection, host cell commits suicide to avoid infection f. CRISPR: Cas system specifically recognizes foreign DNA and degrades it.
Transcriptomics Proteomics Metabolomics which includes interactive mapping and predictive modeling.
Specific sequences for strain identification, which helps with monitoring disease outbreaks.
Diagnostics, including detecting pathogens or determining types of microbes in an environmental sample.
Proteomics, which assists with identifying potential drug targets, 3 d structure to tailor drug design and immune response to help in vaccine development.
Insights into metabolism or virulence, revealing nutrients required for culturing and clues regarding pathogenicity.
Bacteria and Archaea, Escherichia 4.7 mega base pairs.
Bacteria and Archaea genome size is between 10 to the fifth power to 10 to the eighth power. Fungi genome size is between 10 to the seventh power to 10 to the eighth power. Plants genome size is between 10 to the eighth power to 10 to the eleventh power. Mammals genome size is between 10 to the eighth power and ten to the ninth power and between 10 to the ninth and 10 to the eighth power.
Part a. Synthesis of new D N A occurs until incorporation of a d d N T P. Capillary electrophoresis of fragments and detection of fluorescent labels occurs in a test tube where the longer fragments are on the top and shorter fragments are on the bottom. Part b. Automated sequencer reads output. In D N A creation, Apyrase cleaves unused deoxyribonucleotides. Sulfurylase converts A M P + P P sub i into A T P. Luciferase consumes A T P and emits light. Light flash is detected by sensor.
6. Computer decides if O R F is likely to be genuine.
Part a. The correlation between genome size and O R F content in prokaryotic cells. The total O R F s in genome are directly related to genome size in megabases. The average line rises through (1, 1000) and (9, 8000). Part b. A histogram of genome size shows a right-skewed distribution, with the greatest frequencies occurring between 0.5 and 2.5, from 10 to 20%. All values estimated.
Mycoplasma genitalium Tremblaya Zinderia Carsonella Hodgkinia Sulcia
Mollicutes Beta proteobacteria Beta proteobacteria Gamma proteobacteria Alpha proteobacteria Bacteroidetes
580.1 kilo base pairs 138.9 kilo base pairs 208.5 kilo base pairs 159.6 kilo base pairs 143.7 kilo base pairs 245.5 kilo base pairs
Guanine or Cytosine, 31.7% Guanine or Cytosine, 58.8% Guanine or Cytosine, 13.5% Guanine or Cytosine, 16.6% Guanine or Cytosine, 58.4% Guanine or Cytosine, 22.4%
In small genomes D N A replication and translation take up larger portions of the genome. In larger genomes transcription, signal transduction, and energy generation take up a larger part of the genome.
The graph is as follows. The first number is the total number of types of proteins, the second number is the total number of proteins.
Protists including microsporidia, giardia, cryptosporidium have no introns per gene. The fungi Saccharomyces cerevisiae has less than one intron per gene. The fungi Saccharomyces pombe has less than one intron per gene. The protist slime mold Plasmodium has 1 intron per gene. The fungi Neurospora has just less than 2 introns per gene. The fungi Aspergillus has just less than 3 introns per gene. The animal type, insects just less than 3 introns per gene. The animal type fish has 3 introns per gene. All plants have an average of 4 introns per gene. The animal nematode has 5 introns per gene. The animal types mammals and birds have an average of 8 introns per gene.
The process is as follows. Sample D N A is isolated from a cave. 1. Clone DNA into vectors. 2. Transform into host cells and select for ABR. 3. Sequence vectors from positive clones. Antibiotic resistant genes detected are as follows. Bioinformatical discovery.
Aminoglycosides a a d K, a p h (3 minus)-l, a n t(4 prime)-l.
Part a. A bacteriophage binds to the flagellated cell pole of a cell. Part b. The replication cycle of sigma C b K is as follows. Phage receptor binding and infection. Phage replication and cell lysis. Phage adsorption. Part c. The concentration of sigma C b K increases in a pool of T n mutants. Part d. A graph plots cells per tube versus sigma C b K concentration. A plot for wild type drops steeply. Phage absorption mutant extends horizontally then drops steeply. A plot for phage replication mutant drops steeply, then extends horizontally. A plot for Phage receptor mutant extends horizontally.
From a sample of sea water the cells are lysed and D N A is being extracted and sequenced then organized. Four major protobacteria sub groups in the ocean are graphed. The sub groups are beta, delta, alpha, and gamma. The most beta cells are at 100 meter depth and 500 meter depth. The most delta is at 10 meters and at 200 meters. The most alpha is at 10 meters and at 200 meters. The most gamma is from 70 to 130 and 770 to 4000.
The table, from greatest to least percentage, is as follows.
Part a. In the graph 5371 genes are organized by number and are compared in three sections, from 0 to 6 hours, from 0 to 12 hours, and from 0 to 21 hours of nitrogen deprivation. The first section is mostly decreasing the middle section is more increasing and the last section is mostly increasing. Cluster 1, 2, 3, 4 are highlighted and a note reads nitrogen fixation and heterocyst genes. Part b. The top line reads p s b B, 190 with the line below reading negative 328. The middle line reads p e t F, 275 with the line below reads negative 100. The bottom line reads n r r A, 68 with the bottom line reading negative 27.
One cell is in the exponential phase and one is in the stationary phase. Both cell types have low levels of glycolysis genes, but the exponential phase has more. Both cell types have high levels of sporulation genes, but the stationary phase has more.
A sample is on a matrix inside a flight tube. a laser beam bounces negative ions off of the matrix and sample through a positively charged grid to hit the T O F detector. The results are shown on a monitor where mass and intensity are compared.
The graph shows the percentage of modification in nine categories for an unmodified proteome and five modified proteomes. The categories are as follows.
Phosphorylation. Regulatory proteins increased. Hypothetical proteins decreased.
Glycosylation. Cell wall and cell process increased. Lipid metabolism increased. Hypothetical proteins decreased.
Pupylation. Metabolism and respiration increased from approximately 18% to 50%.
Lipidation. Cell wall and cell processed increased from approximately 16% to 80%.
Acetylation. Lipid metabolism increased. Metabolism and respiration increased.
Part a. A tangled web of proteins includes chemotaxis proteins, flagellar or motility proteins, M C P proteins, and not motility related proteins. M C P proteins are aligned along the top of the web. The tips of branches end with flagellar or motility proteins, there are 5 and they are labeled, Flg G, Fla C, Flh F, Fli M, and Fli Y. There are 4 chemotaxis proteins that are near the center of the web that are labeled as follows, Che W, Che A, Che Y, and Che V. Part b. High confidence interactions between all proteins known to have roles in motility. A large tangle of proteins has a center starburst pattern. Off to the side are 6 small protein items.
Two small graphs are on the side show the N I M S results. The propafenone has a peak at 342. The cell is 30 microns and has a peak at 800.
On the female the metabolomics are heaviest on the face and neck, upper back, and back of the calf. On the female the microbes are the heaviest on the back of the upper legs, the upper back and under the arms and the top of the chest and lower abdomen. On the male the metabolomics are heaviest on the back of the neck, the shoulders and top of chest, and the hands and calves. On the male the microbes are the heaviest on the lower back and chest the hands and back of the upper leg.
The four components of systems biology are genome, transcriptome, proteome, and metabolome. The genome and transcriptome are both regulatory networks which are functional subsystems which is part of an integrated biological system. The proteome and metabolome are both metabolic pathways which are functional subsystems which is part of an integrated biological system.
A cell is selected from an environmental sample. This cell is then lysed and the pieces are isolated into proteins, genome, and m R N A. The proteins are evaluated by fluorescence analyses to be studied by proteomics. The genome is amplified by M D A and then sequenced to be studied by genomics. The m R N A is R N A sequence or amplification to be studied by transcriptomics.
Process single cells for D N A and amplify D N A by M D A.
The detection methods in the Venn diagram are known D e v R regulon, C h I P s e q, and data from other experiments. The unique number of genes in each part of the Venn diagram are as follows.
The overlaps between the parts of the Venn diagram are as follows.
Known D e v R regulon and C h I P s e q overlap, 28.
C h I P s e q and data from other experiments overlap, 7.
Data from other experiments and known D e v R regulon overlap, 3.
The overlap between all three parts of the diagram is 37.
Genomes of bacteria contain D N A and have between 10 to the fifth and 10 to the seventh base pairs. Viruses of Eukaryotes have both D N A and R N A and between 10 to the third and 10 to the sixth bases or base pairs. Viruses of bacteria have R N A and D N A and between 10 to the third and 10 to the fifth bases and base pairs. Viroids have only R N A and have less than 10 to the third bases.
Class Examples Genome Transcription genome replication.
Class 1, d s D N A, plus, virus Phage T 4 Double strand D N A Transcription of the minus strand D N A Virus, classical semiconservative
Class 2, s s D N A, plus, virus Phi X 174, Parvovirus Single strand D N A Synthesis of the minus strand, d s D N A intermediate D N A virus, classical semiconservative, discard minus strand.
Class 3, d s R N A, plus, virus Phage phi 6, rotavirus Double strand R N A Transcription of the minus strand R N A virus, make s s R N A + and transcribe from this to give s s R N A minus complementary strand.
Class 4, s s R N A, plus, virus Phage M S 2, Poliovirus Single strand R N A Used directly as m R N A R N A Virus, make s s R N A minus and transcribe from this to give s s R N A + genome
Class 5, s s R N A, minus, virus Rabies virus, influenza virus Single strand R N A Transcription of the minus strand R N A virus, make s s R N A + and transcribe from this to give s s R N A minus genome
Class 6, s s R N A, plus, retrovirus H I V, mouse leukemia virus. Single strand R N A Reverse transcription, d s D N A intermediate, transcription of the minus strand R N A Virus, make s s R N A + genome by transcription of minus strand of d s D N A
Class 7, d s D N A, plus, virus Hepatitis B Double strand D N A Transcription of the minus strand D N A Virus, transcription followed by reverse transcription
Part a. Virus host preferences by cellular domain are divided by number of viruses per Baltimore class as follows.
Bacteria, class 1, 1160, class 2, 48, class 3, 5, class 4, 10.
Eukarya, class 1, 429, class 2, 470, class 3, 160, class 4, 866, class 5, 110, class 6, 56, class 7, 64.
Virus host preferences by major eukaryotic groups are divided by number of viruses per Baltimore class as follows.
Plants, class 1, 18, class 2, 348, class 3, 40, class 4, 500, class 5, 1. class 7, 55.
Animals, class 1, 394, class 2, 122, class 3, 46, class 4, 321, class 5, 109, class 6, 56, class 7, 9.
Part b. Viruses are broken down by genome type as follows. Single strand R N A.
By domain, the percentage of viral orders are as follows. Bacteria.
Part a. The mimivirus. Part b. The phylogeny of major groups of N C L D V is as follows. Ancestral N C L D V separates into two branches. One branch splits into Chordate pox virus and Insect pox virus. The other branch splits further, one branch splits into Fish iridoviruses and amphibian iridoviruses, the other splits into Mimiviruses and phycodnaviruses.
Part a. The origin of genomic replication is located at the top of the D N A, and m R N A reads in a clockwise direction through genes listed as follows.
A overlaps A star, and A star overlaps B and K. D overlaps E. Part b. S s D N A turns into its replicative form, d s D N A. Transcription off of the minus strand yields viral m R N A and genomic copies are made by rolling circle replication.
The steps of rolling circle replication are as follows.
Replicative form D N A is nicked by gene A protein.
Continued extension of original plus strand with synthesis of new plus strand.
One revolution complete and one progeny virus made.
Phi X 174 replicative form is ready for now genome synthesis.
Part a. The base 5-hydroxymethylcytosine is nearly identical to cytosine, but replaces a side H atom with the molecule H C H 2 C, the site of glucosylation. Part b. Virus length T 4 D N A molecules are generated as follows. The recombination of multiple nearly replicated copies of the T 4 genome forms a single concatemer. The concatemer is cut at constant lengths by T 4 endonuclease, with each length representing one headful of T 4 D N A. The T 4 genomes generated have different termini.
Part a. A bulge forms at the origin of replication and expands into the eye form, then transitions into the Y form as the duplicate strand pulls the original aPart eventually forming Completed strands containing unreplicated terminal repeats. Part b. unreplicated terminal repeats are paired up and D N A polymerase and ligase activities commence. The two molecules are joined to form a concatemer. Part c. A cutting enzyme makes single stranded cuts, and the D N A polymerase completes the single strands. A mature T 7 molecule with terminal repeats is formed.
Part a. The bacteriophage lambda consists of a capsid containing the lambda genome and a tail. Part b. Lambda D N A is integrated into a host as follows. 1. Lambda genome cyclizes at its cohesive ends. 2. A site-specific endonuclease creates staggered ends of phage and host D N A. 3. Lambda genome integrates and gaps are closed by D N A ligase. Part c. Lambda undergoes rolling circle replication. The opposite end represents one lambda genome.
Part a. Circular D N A of a tumor virus. Part b. Infection occurs when the tumor virus D N A integrates itself into the host D N A. The tumor inducing genes are transcripted, the m R N A is transported to cytoplasm and translated, and tumor induction proteins transform cells into the tumor state.
The process is as follows. Viral DNA enters cell nucleus and circularizes, creating immediate early proteins and delayed early proteins. Rolling circle replication produces concatemers and late proteins. Concatemer processing yields viral genomic D N A. Viral self-assembly of the late proteins occurs. A final viral coat is then added as progeny viruses bud through the nuclear membrane.
Part a. A micrograph of phage M S 2. Part b. A genome is 3569 nucleotides in length. The first 130 nucleotides are 1335 are uncoated. Nucleotides 1335 to 1724 are coated in a coat. Nucleotides 1724 to 1761 are coated in the lysis protein. Nucleotides 1761 to 3395 are coated in a replicase. Nucleotides 3395 to 3569 are uncoated. The lysis protein overlaps the coat protein and the replicase genes. Part c. In the flow of events during viral multiplication for a viral genome, s s R N A, plus, the minus strand is synthesized, becoming R N A, minus, and the genome is used directly as m R N A. From the s s R N A, minus, the plus strand is synthesized, and, with self assembly of the s s R N A, plus, the R N A replicase, and viral proteins, the lysis protein is produced and the progeny virions are released.
Part a. Reovirus virions. Part b. A 3 D reconstruction of a reovirus virion. Part c. The steps of reovirus replication are as follows.
As the reovirus enters the host cytoplasmic membrane, the outer virion layers are removed in lysosomes.
Production of genomic plus R N A and uptake by viral core.
New viral cores containing R N A replicase and genomic plus R N A synthesize minus strands to create cores with a complete genome.
Progeny virus is released by budding or cell lysis.
Part a. The components of a retrovirus are as follows. Surface envelope protein, transmembrane envelope protein, R N A, enzymes, reverse transcriptase and integrase, lipid membrane bilayer, core shell protein, core protein. Part b. The flow of events during replication are as follows.
3. Viral DNA enters nucleus and integrates into the host genome.
4. Transcription by host RNA polymerase forms viral mRNA and genome copies.
5. Translation of mRNA forms viral proteins; new nucleocapsids assembled and released through the host cytoplasmic membrane by budding.
The steps of double stranded D N A formation are given as follows.
Reverse transcription of about 100 nucleotides at the 5 terminus is catalyzed by reverse transcriptase.
Terminally redundant viral R N A is removed by reverse transcriptase ribonuclease activity
Continued synthesis of D N A leads to extension of the minus strand D N A.
Ribonuclease activity removes all of the plus strand of R N A except for a small fragment used as a primer.
completion of a short segment of the plus strand D N A and removal of both primers.
Reverse transcriptase moves to the other strand and completes complementary minus strand D N A synthesis.
Formation of double stranded D N A by reverse transcriptase.
Integration into host chromosomal D N A to form provirus state.
1. Genetic engineering and assembly of biobricks. Includes promoters, R B S’s, terminators, enhancers, sensors, spacers, activator- and repressor-binding sites, s R N A’s, regulator O R F’s, enzyme O R F’s.
2. Insert assembled biobricks into vector or chromosome.
4. Products. Products fall in to three categories, industrial, agricultural, and medical. Examples are as follows. Industrial. Enzymes, plastics, food additives, textiles, bioenergy. Agricultural. Modified food, pest control, stress resistance. Medical. Antibiotics, vaccines, therapeutics.
Part a. The polymerase chain reaction is a cycle that is repeated to create several copies of the target sequence. Part b. A graph provides the copes of the target sequence versus the number of P C R cycles. The graph is a line that rises through points (4, 10 squared) and (10, 10 to the fourth power).
A P C R product with ends homologous to the insertion site is inserted into a vector with a target site. It is transformed into cell line grown at 40 degrees Celsius to express lambda Red recombinase system to produce a recombinant vector.
Transform into Escherichia coli and select on ampicillin plates containing X gal
Bacteria, Escherichia coli Well developed genetics, Many strains available, Most studied bacterium Potentially pathogenic, Periplasm traps proteins
Bacteria, Bacillus subtilis Easily transformed, Nonpathogenic, naturally secretes proteins, Endospore formation simplifies culture Genetically unstable, Genetics less developed than in E. coli.
Eukaryote, Saccharomyces cerevisiae Well developed genetics, Nonpathogenic, can process eukaryotic m R N A’s, easy to grow Plasmids unstable, will not replicate most bacterial plasmids
Part a. Site directed mutagenesis is a 4 step process as follows.
Clone source gene into plasmid and denature to yield single stranded D N A.
Add synthetic oligonucleotide with one base mismatch
Part b. Cassette mutagenesis has 3 steps as follows.
Cut with B a. m H I and transform into cell with wild type gene X.
Recombination and selection for kanamycin resistant cells.
Bovine somatotropin m R N A. Convert B S T m R N A to c D N A using reverse transcriptase.
Bovine somatotropin c D N A combines with an expression vector transform into cells of Escherichia coli.
The D N A gun consists of several chambers. In the chamber furthest from the target tissue, there is helium, separated from the next chamber by a gas vent. A plunger pushes the helium toward the gas vent. The next chamber has a disc with microprojectiles with transfecting nucleic acid. The next chamber has a fine screen, while the chamber closest to the target tissue has a rough screen. After gas release, the helium flows through the gas vent and the disc, pushing the microprojectiles through the fine and rough screens to the target tissue.
Binding of anthrax protective antigen complexed to a synthetic antibody
Synthetic antibody, protective antigen complex forms a pore in the endosome for escape
Synthetic antibody binds to cytoplasmic protein, recruiting immune system to kill the cell.
Collect D N A samples from different environments.
Transform host cells and plate on selective media.
Tryptophan, Tryptophanase activity, already in E. coli, becomes indole.
Indole, Naphthalene oxygenase activity, from Pseudomonas, becomes Indole 2 3 dihydrodiol.
Indole 2 3 dihydrodiol, Spontaneous dehydration, becomes indoxyl.
Indoxyl, Spontaneous oxidation by O 2, becomes indigo.
Part a. The wildtype pathway is as follows. Nonessential gene, Essential H gene, essential D, essential K, nonessential gene, and essential E, followed by 13 nonessential genes. Operons are spaced along the length of the pathway. Part b. Steps in pathway refactoring are as follows.
The refactored nitrogen fixation pathway is as follows. Promoter, H gene, terminator, spacer, promoter, spacer, R B S, D gene, spacer, R B S, K gene, spacer, R B S, Y gene, spacer, R B S, E gene.
The steps of the synthesis are as follows, starting with an initial yeast strain.
Introduce genes for amorphadiene production, resulting in amorphadiene.
Introduce genes for oxidation, resulting in artemisinic acid.
Improvement of oxidation steps, resulting in a strain that produces a higher yield of artemisinic acid.
Optimized fermentation and extraction protocols, resulting in pure artemisinic acid.
Chemical processing, resulting in pure artemisinin.
Part a. In an E coli cell, a light source hits one photoreceptor but not the other. The photoreceptor not covered in light transfers phosphate to O m p R, which transcribes l a c Z, while the photoreceptor under light is inactive. Part b. A light source shines over a lawn of bacterial cells. A mask with holes is placed between the light source and the lawn. Light shines through the holes, resulting in no beta galactosidase, while beta galactosidase is active where the light doesn’t shine. Part c. A bacterial photograph depicts Charles Darwin.
Assemble the D N A fragments by homologous recombination in the yeast.
Transform the synthetic chromosomes into M capricolum.
Cell division results in synthetic mycoplasma and M capricolum.
In the synthetic mycoplasma, l a c Z is expressed and X gal is cleaved to yield a blue color.
In the M capricolum, l a c Z is absent, and there is no blue color.
A model shows the crystal structure of a Cas 9 protein with target D N A and guide R N A.
A mosquito contains a G F P. When the altered allele is spread by normal mating and inheritance, there are few offspring with the G F P. When the allele is linked to Cas 9 and s g R N A, the wild type chromosome is cut. With Cas 9 spread of the gene drive, the entire population ultimately ends up with the G F P.
Eon, billions of years ago Events Percent of current atmospheric oxygen
Phanerozoic, between 0 and 0.5 billion years ago. 0.1 billion years ago, extinction of the dinosaurs. 0.4 billion year ago, origins of the first animals. Percent of current atmospheric oxygen is a curve that starts at 100 percent, dips to 70 percent 0.1 billion years ago, then increases to a maximum greater than 100 percent 0.2 billion years ago. The curve then decreases to 100 percent at 0.25 billion years ago and remains there for the rest of the eon.
Proterozoic, between 0.5 and 2.5 billion years ago. 0.6 billion years ago, start of Cambrian explosion. Between 1.3 and 1.9 billion years ago, evidence for multicellular eukaryotes. 2.0 billion years ago, ozone shield forming. 2.4 billion years ago, start of the Great Oxidation Event. A curve that starts at 10 percent at 0.5 billion years ago and remains steady until 1.6 billion years ago, then decreases with decreasing steepness to 0 at 2.5 billion years ago.
Archaean, between 2.5 and 3.75 billion years ago. 2.5 to 3.25 billion years ago, origins of cyanobacteria. 3.25 to 3.6 billion years ago, origins of anoxygenic photosynthesis. 3.6 to 3.7 billion years ago, divergence of bacteria and archaea. 3.7 to 4.2 billion years ago, origins of cellular life. Anoxic atmosphere.
Hadean, between 3.75 and 4.75 billion years ago. 3.7 to 4.2 billion years ago, origins of cellular life. 4.25 to 4.5 billion years ago, formation of the crust and oceans. 4.5 to 4.75 billion years ago, formation of Earth. 4.2 to 4.75 billion years ago, Earth sterile. Anoxic atmosphere.
The process of a transition from prebiotic chemistry to cellular life is as follows.
A mound is built from precipitated hydrothermal fluid mixed with clay, metal sulfides and sulfur, silica, and carbonates.
Nutrients in hypodermal fluid flow up through mound.
Abiotic reactions produce precursor molecules. Precursors: amino acids, sugars, and nitrogenous bases.
Pores allow coupling of energetic reactions to molecular replication.
Eventually, lipid bilayers took the place of mineral compartments, allowing the first cells to disperse to new habitats.
The events are as follows. Prebiotic chemistry, precellular life, and early cellular life are 3.8 to 4.3 billion years ago. In prebiotic chemistry, biological building blocks include amino acids, nucleosides, and sugars. In precellular life, the R N A world includes catalytic R N A and self replicating R N A. Protein synthesis includes R N A templated translation. D N A includes replication and transcription. In early cellular life, lipid bilayers include cellular compartments. Early cells likely had high rates of H G T. L U C A and evolutionary diversification are 3.7 to 3.8 billion years ago. In this era, divergence of bacteria and archaea includes components of D N A replication, transcription, and translation all in place.
Bacteria, archaea, and eukarya each branch from L U C A, the origin of life. The branches are as follows.
Bacteria. Thermotogae. Aquificae. Deinococcus Thermus. Chloroflexi. Thermodesulfobacteria. Spirochaetes. Chlorobi. Plastids. Cyanobacteria. Planctomycetes. Chlamydiae. Verrucomicrobia. Fibrobacteres. Lentisphaerae. Gemmatimonadetes. Fusobacteria. Tenericutes. Firmicutes. Actinobacteria. Bacteroidetes. Acidobacteria. Nitrospira. Gammaproteobacteria, betaproteobacteria, alphaproteobacteria, mitochondria, deltaproteobacteria, and epsilonproteobacteria are all part of a single branch.
Archaea. Korarchaeota. Crenarchaeota. Thaumarchaeota. Euryarchaeota. Nanoarchaeota.
Eukarya. Plants. Rhizaria. Stramenopiles. Alveolates. Parabasalids. Diplomonads. Excavata. Amoebozoa. Fungi. Animals.
For all populations, after ancestral cells grow to fill the first tube, 4 random cells are transferred to the second tube. This process is then repeated between the second and third tubes. Genetic drift causes evolutionary divergence of populations due to random processes and is independent of selection. The genetic drift is as follows.
Cell type Ancestor Population 1 a. Population 1 b Population 1 c Population 2 a. Population 2 b Population 2 c Population 3 a. Population 3 b Population 3 c
Part A. E. coli long term evolution experiment. Part B. Fitness increases dramatically at first. After initial increase, fitness change becomes more gradual. Mutation rate is constant over time. Part C. A mutant is observed that can use citrate. The initial citrate using mutant had low fitness, but fitness improves over time.
Part a. The principle of gene duplication. One gene undergoes minor changes and the enzyme retains its original role. The other has major changes and evolves a new role where the enzyme catalyses a novel reaction. Part b. The gene family of RuBisCO. An ancestral gene was duplicated to produce R L P alpha genes which encode an enzyme in methionine metabolism, genes with unknown functions, and multiple forms of RuBisCO.
The core genome of Salmonella bacteria has 2811 genes. Different types of salmonella have different amounts of unique genes. Each petal of the flower has a different number of unique genes between 29 and 504.
In a graph that plots number of genes versus number of genomes analyzed, the pan genome curve rises with a decreasing slope from (1, 0) to (20, 16,000). The core genome curve falls with a decreasing slope from (1, 500) to (20, 1976). All values approximated.
Three D N A sequences before alignment are as follows.
After alignment, gaps are added in the chain align as many similar sequences as possible. The sequence differences before and after alignment are presented in a matrix. Differences before alignment are as follows.
The sequence differences after alignment are as follows.
The following list provides the major forms of anaerobic respiration, with their approximate charge and products, from most electronegative to most electropositive.
Negative 0.42. Proton reduction. Pyrococcus furiosus, obligate anaerobe. 2 H plus yields H 2.
Negative 0.28 to negative 0.3. Carbonate respiration. Acetogenic bacteria, obligate anaerobes. C O 2 yields C H 3 single bond C O O minus.
Negative 0.27. Sulfur respiration. Facultative aerobes and obligate anaerobes. S super 0 yields H S minus.
Negative 0.23 to negative 0.25. Carbonate respiration. Methanogenic Archaea, obligate anaerobes. C O 2 yields C H 4.
Negative 0.20 to negative 0.22. Sulfate respiration, or sulfate reduction. Obligate anaerobes. S O 3, 2 minus, yields H S minus. A complete reaction reads as follows. S O 4, 2 minus, yields S O 3, 2 minus. E sub 0, prime, = negative 0.52.
0. Fumarate respiration. Facultative aerobes. Fumarate yields succinate.
Positive 0.13 to positive 0.15. Arsenate respiration. Facultative aerobes and obligate aerobes. A s O 4, 3 minus, yields A s O 3, 3 minus.
Positive 0.15 to 0.18. Trimethylamine oxide, or, dimethyl sulfoxide respiration. Facultative aerobes. T M A O or D M S O yields T M A or D M S.
Positive 0.19 to positive 0.21. Iron respiration. Facultative aerobes and obligate anaerobes. F e, 3 plus, yields F e, 2 plus.
Positive 0.25 to positive 0.33. Reductive dichlorination. Facultative aerobes and obligate anaerobes. Chlorobenzoate yields benzoate + H C l.
Positive 0.34 to positive 0.42. Nitrate respiration. Facultative aerobes, some of which reduce N O 3, minus, to N H 4, plus. N O 3, minus, yields N O 2, minus.
Positive 0.42 to positive 0.43. Selenate respiration. Facultative aerobes. S e O 4, 2 minus, yields S e O 3, 2 minus.
Positive 0.75. Denitrification. Facultative aerobes. N O 3, minus, yields N 2.
Positive 0.76 to positive 0.78. Manganese respiration. Facultative aerobes. M n, 4 plus, yields M n, 2 plus.
Positive 0.79 to positive 0.82. Aerobic respiration. Obligate and facultative aerobes. 1 half O 2 yields H 2 O.
Part a. In the chlorophyll a structure, a carbon is single bonded to C H, which is double bonded to C H 2. In bacteriochlorophyll a, the carbon is single bonded to C, which is double bonded to O and single bonded to C H 3. Part b. The curve for chlorophyll a rises to (430, 0.66), falls to (480, 0.62), falls to a local minimum, then rises to a local maximum at (680, 0.62), then falls to (800, 0). The curve for bacteriochlorophyll a rises to (360, 0.8), falls to (475, 0.5), falls to (525, 0.47), then falls again to (590, 0.36). The curve then rises to (805, 0.7), falls, and then rises to (870, 0.8), then falls again.
Pigment, absorption maxima, in vivo R 1 R 2 R 3 R 4 R 5 R 6 R 7
B c h l a, purple bacteria, 805, 830 to 890 n m. Carbon with 2 single bonds, one to C H 3, and a double bond to O A single bond to C H 3. No double bond between C 3 and C 4, additional H atoms are in positions C 3 and C 4. A single bond to C H 2, single bonded to C H 3. A single bond to C H 3. A single bond to C, single bonded to O, which is single bonded to C H 3. The C is also double bonded to O. P, G g. Single bond to H.
B c h l b, purple bacteria, 835 to 850, 1020 to 1040 n m. C, with two single bonds, one to C H 3, and a double bond to O. A single bond to C H 3 C with two single bonds to H and C H 3 and one double bond. A single bond to C H 3. C, with 2 single bonds and one double bond to O. One of the single bonds is to O, which has a single bond to C H 3 P A single bond to H
B c h l c, green sulfur bacteria, 745 to 755 n m. C has 4 single bonds, to H, C H 3, and O H. A single bond to C H 3. A single bond to C 2 H 5. A single bond to C 3 H 7. Single bond to C 4 H 9. A single bond to C 2 H 5. A single bond to C H 3. A single bond to H. F A single bond to C H 3.
B c h l c s, green nonsulfur bacteria, 740 n m. C has 4 single bonds, to H, C H 3, and O H. A single bond to C H 3. A single bond to C 2 H 5. A single bond to C H 3. A single bond to H. S A single bond to C H 3.
B c h l d, green sulfur bacteria, 705 to 740 n m. C has 4 single bonds, to H, C H 3, and O H. A single bond to C H 3. A single bond to C 2 H 5. A single bond to C 3 H 7. A single bond to C 4 H 9. A single bond to C 2 H 5. A single bond to C H 3. A single bond to H. F A single bond to H.
B c h l e, green sulfur bacteria, 719 to 726 n m. C has 4 single bonds, to H, C H 3, and O H. A single bond to C, which has a double bond with O and a single bond with H. A single bond to C 2 H 5. A single bond to C 3 H 7. A single bond to C 4 H 9. A single bond to C 2 H 5. A single bond to H. F A single bond to C H 3.
B c h l g, heliobacteria, 670, 788 n m. C has a 2 single bonds, one to H, and a double bond to C H 2. A single bond to C H 3. A single bond to C 2 H 5. A single bond to C H 3. C has 2 single bonds, one to O, which has a single bond to C H 3. C has a double bond to O. F A single bond to H.
Note about B c h l a, R 6, P, G g. P, phytyl ester, C 20 H 39 O. F, farnesyl ester, C 15 H 25 O. G g, geranylgeraniol ester, C 10 H 17 O. S, stearyl alcohol, C 18 H 37 O. Note about B c h l b, R 2. No double bond between C 3 and C 4. An additional H atom is in position C 3. Note about B c h l c, R 3. Bacteriochlorophylls c, d, and e consist of isomeric mixtures with the different substituents on R 3 as shown.
Part a. Micrographs of phycobiliproteins and phycobilisomes. Part b. In the phycobilisome, P S 2 reaction centers are in the thylakoid membrane. Allophycocyanin are above the thylakoid membrane, and phycocyanin emanate from the allophycocyanin. Part c. Micrograph of phycobiliproteins and phycobilisomes.
Electron transport generates a proton motive force. In the oxidation of ammonia, N H 3 + O 2 + 2 H yields N H 2 O H + H 2 O. The O atoms in the products come from O 2 in the reactants, and the H atoms of H 2 O come from 2 H plus. In the oxidation of hydroxylamine, N H 2 O H, with H 2 O, yields N single bonded to O minus and double bonded to O, + 5 H plus. The O atoms in the products come from the O atoms in the reactants. In the reduction of oxygen, 1 half O 2 + 4 H plus yields H 2 O and 2 H plus. A D P + P sub i, with H plus, yields A T P.
Electron transport generates a proton motive force. In the oxidation of nitrite, H 2 O + N O 2, minus, yields an N single bonded to O minus and double bonded to 2 O atoms, + 2 H plus. The O minus and the 2 H plus in the products come from the H 2 O of the reactants. In the reduction of oxygen, 1 half O 2 + 4 H plus yields H 2 O and 2 H plus. A D P + P sub i, with H plus, yields A T P.
Part a. A phase contrast photomicrograph shows cells as dark, circular shapes on a light background.
Part b. An oval shaped cell has and outer membrane and inner compartments including a large fibrillar anammoxosome.
Part c. Ladderane lipids separate the cytoplasm from inside the anammoxosome. H plus enters the anammoxosome via electron transport. With N I R, N O 2, minus, with the introduction of 2 H plus and 1 e minus yields N O and a byproduct of H 2 O. With H Z S, N O with the introduction of N H 4, plus, + 2 H plus, and 3 e minus, yields N 2 H 4 and a byproduct of H 2 O. With H D H, N 2 H 4 yields N 2, 4 e minus, and 4 H plus. H plus from inside the anammoxosome is used in the cytoplasm in A D P + P sub i yields A T P.
The reduction of nitrate is as follows, in a denitrification, pseudomonas stutzeri, process. In nitrate reduction, Escherichia coli, nitrate, N O 3, minus, yields nitrite N O 2, minus, via nitrate reductase. Nitrite, N O 2, minus, yields nitric oxide, N O, via nitrite reductase. Nitric oxide, N O, yields nitrous oxide, N 2 O, via nitric oxide reductase. N 2 O yields dinitrogen, N 2, via nitrous oxide reductase. N O, N 2 O, and N 2 are gases.
Part a. A P S, adenosine 5 prime phosphosulfate, consists of a 5 sided ring with one O atoms and 4 C atoms, single bonded to a chain with phosphate group and sulfate group. This structure is used in dissimilative metabolism. P A P S, phosphoadenosine 5 prime phosphosulfate, has the same structure except that an O H group on the ring in A P S is replaced by a second phosphate group. This structure is used in assimilative metabolism.
Part b. The reaction begins as follows. S O 4, 2 minus, undergoes A T P sulfurylase, with A T P converted to P P sub I, to yield A P S. The dissimilative sulfate reduction process continues from this point as follows. A P S undergoes A PP S reductase, with 2 e minus, to yield S O 3, 2 minus, and a byproduct of A M P. S O 3, 2 minus, undergoes sulfite reductase, with 6 e minus, to yield H 2 S. H 2 S undergoes excretion. Alternatively, A P S undergoes A P S kinase, with A T P converted to A D P, and yields P A P S. The assimilative sulfate reduction process continues from this point as follows. P A P S, with the introduction of N A D P H, yields S O 3, 2 minus, and byproducts of N A D P, plus, and P A P. S O 3, 2 minus, with 6 e minus, yields H 2 S. H 2 S yields organic sulfur compounds such as cysteine, methionine, and so on.
Part 1. Coenzymes that function as C 1 carriers, plus F 430. Shaded atoms are identified as follows.
Early steps, part a. The structure of methanofuran consists of a 5 sided ring with 1 O atom and 4 C atoms, bonded by C H 2, O, to a 6 sided ring, which is bonded to a bent chain. Single bonded to the 5 sided ring is C H 2, single bond, N H 2. The N H 2 is shaded.
Middle steps, part b. The structure of methanopterin consists of joined 6 sided and 5 sided rings, bonded by C H C H 3, single bond, N H, to a second 6 sided ring. This 6 sided ring is bonded via a chain to a 5 sided ring, which is bonded to a phosphate group and 5 carbon chain. The 5 sided ring has two points occupied by N H. The upper N H and the N H of the chain between the 5 sided ring and 6 sided ring are highlighted.
Final steps, part c. The structure of coenzyme M, Co M, is as follows. S H, single bond, C H 2, single bond, C H 2, single bond, S double bonded to 2 O atoms and single bonded to O minus. The S H is highlighted.
Final steps, part d. Coenzyme F 430 is a multi ring structure with a central N i plus.
Part 2. Coenzymes that function as electron donors.
Part e. For coenzyme F 420, minus 2 H yields the reduced structure and + 2 H yields the oxidized structure. Both structures consist of 3 adjacent 6 sided rings. In the reduced structure, the central ring is single bonded below to H and H, with the left H highlighted. The central ring of the oxidized structure is bonded to a bent chain. In the oxidized structure, the central ring is single bonded below to a single H, which is highlighted.
Part f. The structure of coenzyme B, Co B, is as follows. All bonds are single unless specified. S H, C H 2, C H 2, C H 2, C H 2, C H 2, C H 2, C double bonded to O, N H, C H single bonded to C O O minus, C H single bonded to C H 3, phosphate group. The S H is highlighted.
Part a. The reaction for methanol to C H 4 is as follows. 4 C H 3 O H yields 3 C H 4 + C O 2 + 2 H 2 O. Delta G super 0 prime = negative 321 kilojoules. Part b. The reaction for acetate to C H 4 is as follows. Acetate + H plus yields C O 2 + C H 4. Delta G super 0 prime = negative 37 kilojoules.
The overall reaction for part a, the serine pathway, is as follows. Formaldehyde + C O 2 + 2 N A D H + =2 A T P, with the introduction of C o A, yields acetyl S C o A + 2 H 2 O. The overall reaction for part b, the ribulose monophosphate pathway, is as follows. 3 formaldehyde + A T P yields glyceraldehyde 3 P.
Formate hydrogenlyase. Formate, minus, + H, plus, yields C O 2 + H 2.
Hydrogenase, cytoplasmic. F d, reduced, + 2 H, plus, yields F d, oxidized, + H 2.
Energy-converting hydrogenase, transmembrane. F d, reduced, + 2 H plus, yields F d, oxidized, + p m f + H 2.
Electron confurcation. Low E sub 0 prime donor, such as F d, reduced, + 2 H, plus, yields 2 H 2. High E sub 0 prime donor, such as N A D H + H, plus, yields 2 H 2.
The overall reaction for part a, homofermentative, is as follows. Glucose, or C 6 H 12 O 6, yields 2 lactate, or 2, C 3 H 5 O 3, + 2 H plus. Delta G super 0 prime = negative 196 kilojoules, 2 A T P. The overall reaction for part b, heterofermentative, is as follows. Glucose, or C 6 H 12 O 6, yields lactate, or C 3 H 5 O 3, + ethanol, or C 2 H 5 O H, + C O 2, + H plus. Delta G super 0 prime = negative 216 kilojoules, 1 A T P.
The overall reactions are as follows. Glucose yields butyrate + 2 C O 2 + 2 H 2 + H plus. Delta G super 0 prime = negative 264 kilojoules, 3 A T P per glucose. 2 glucose yields acetone + butanol + 5 C O 2 + 4 H 2. Delta G super 0 prime = negative 468 kilojoules, 2 A T P per glucose. Bolded fermentation products are as follows. Acetate. Ethanol, a minor product. Acetone. Isopropanol, a minor product. Butyrate. Butanol.
Part a, reactions. Ethanol fermentation carried out by the syntroph. 2 C H 3 C H 2 O H + 2 H 2 O yields 4 H 2 + 2 C H 3 C O O, minus, + 2 H, plus. Delta G, 0 prime, = positive 19.4 kilojoules per reaction. Methanogenesis carried out by the methanogen. 4 H 2 + C O 2 yields C H 4 + 2 H 2 O. Delta G, 0 prime, = negative 130.7 kilojoules per reaction. Coupled reaction in coculture of syntroph and methanogen. 2 C H 3 C H 2 O H + C O 2 yields C H 4 + 2 C H 3 C O O, minus, + 2 H, plus. Delta G, 0 prime, = negative 111.3 kilojoules per reaction. Part b, an overview of syntropic transfer of H 2. In an ethanol fermenter, 2 ethanol yields 2 acetate, with a transfer of 4 H 2 to methanogen, in which C O 2 yields C H 4.
The sum for part a, syntrophic culture, is as follows. Butyrate + 2 H 2 O yields 2 acetate + H plus, + 2 H 2. Delta G super 0 prime = positive 48.2 kilojoules, delta G = negative 18 kilojoules. The sum for part b, pure culture, is as follows. 2 crotonate + 2 H 2 O yields 2 acetate + butyrate + H plus. Detail G super 0 prime = negative 352 kilojoules.
Parts are as follows. Part a, hydrocarbon oxidation. The following list provides the redox state and associated reaction that results in the next state.
Redox state, hydrocarbon. Reaction, oxygenation. n octane, or C 7 H 15 single bond C H 3, + N A D H + O 2.
Redox state, alcohol. Reaction, dehydrogenation. n octanol, or C 7 H 15 C H 2 O H, + N A D plus, + H 2 O. The O atoms come from O 2 in oxygenation, and the C atom in C H 2 comes from n octane.
Redox state, aldehyde. Reaction, dehydrogenation. n octanal, or C 7 H 15 C single bonded to H and double bonded to O, with the introduction of H 2 O yields n octanoic acid and a byproduct of N A D H.
Redox state, acid. Reaction, generation of acetyl C o A. n octanoic acid, or C 7 H 15 C single bonded to O H and double bonded to O, with the introduction of A T P and C o A, results in a final redox state of acid, and the beta oxidation to 4 acetyl C o A in part b.
Part b, fatty acid oxidation. Steps are as follows.
Structure 1. C H 3 single bond C H 2, sub n, single bond C H 2, single bond C H 2, single bond C O O H. A fatty acid of n + 4 carbons, with the introduction of A T P and S H single bond C o A, undergoes C o A activation to yield structure 2.
Structure2. C H 3 single bond C H 2, sub n, single bond C H 2, single bond C H 2, single bond C double bonded to O, S single bond C o A. From structure 2 there is the formation of a double bond, and a byproduct of F A D H.
Structure 3 is the same as structure 2, except with a double bond between the central C atoms, replacing C H 2 single bond C H 2 with C H double bond C H 2. From structure 3, with the addition of H 2 O, there is an addition of a hydroxyl group.
Structure 4 has a hydroxyl group, O H, single bonded to the central C H, which is now single bonded to C H 2 rather than double bonded. From structure 4, there is a byproduct of N A D H and oxidation to a keto group.
Structure 5 has a double bonded O atom in place of the hydroxyl group. From structure 5, with the introduction of C o A, there is cleavage to yield acetyl C o A and fatty acid of n + 2 carbons for a new round of beta oxidation.
Structure 6 is as follows. C H 3, single bond, C H 2, sub n, single bond, C double bonded to O, single bond, S, single bond, C o A. Structure 6 + acetyl C o A yields 2 C O 2 + 8 H. Oxidation in citric acid cycle, see figure 3.16.
Part a, monooxygenase. Benzene, a 6 sided ring with alternating double and single bonds, with O 2 and N A D H yields a byproduct of H 2 O and benzene epoxide. The ring structure of benzene epoxide is single bonded to 2 H atoms and 1 O atom, from 2 adjacent C atoms. Benzene epoxide with the introduction of H 2 O yields benzenediol. In this structure, the adjacent C atoms are each bonded to H and O H. Benzenediol yields a byproduct of N A D H and catechol. In this structure, the adjacent C atoms are each bonded to O H.
Part b, dioxygenase. Catechol, in the presence of O 2, yields catechol dioxetane, hypothetical. This structure is bracketed, and has the 2 adjacent carbons in the ring each bonded to O H and O. The O atoms are also single bonded. Catechol dioxetane yields cis, cis muconate. The bond between the adjacent carbons on the ring is removed. Each carbon is single bonded to O H and double bonded to O. The O atoms are not bonded together.
Part c, sequential dioxygenases, which extends from toluene dioxygenase to methyl catechol 2, 3 dioxygenase. Toluene is a 6 sided ring with alternating double and single bonds, with one carbon atom single bonded to C H 3. With the introduction of O 2 and N A D H, toluene yields a structure with an O H group bonded to the first 2 carbon atoms to the right of the C H 3 group. This structure yields a byproduct of N A D H and a structure with the O H groups in the same plane as the ring. This structure, with the introduction of O 2, yields a structure where the bond between the first and second carbon atoms in the ring is removed. The first carbon is single bonded to C H 3 and double bonded to O. The second is single bonded to 2 O H groups and double bonded to O.
Type Phyla Hydrogen Oxidation Homoacetogens Methylotrophy Nitrogen Fixation Denitrification Nitrification Dissimilative Iron Oxidation Dissimilative Iron Reduction Dissimilative Sulfur Oxidation Dissimilative Sulfate Reduction Dissimilative Sulfur Reduction Oxygenic Phototrophy Anoxygenic Phototrophy
Archaea Korarchaeota Not Present Not Present Not Present Not Present Not Present Not Present Not Present Not Present Not Present Not Present Not Present Not Present Not Present
Archaea Nanoarchaeota Not Present Not Present Not Present Not Present Not Present Not Present Not Present Not Present Not Present Not Present Not Present Not Present Not Present
Archaea Crenarchaeota Present Not Present Not Present Not Present Present Not Present Present Present Present Not Present Present Not Present Not Present
Archaea Thaumarchaeota Not Present Not Present Not Present Not Present Not Present Present Not Present Not Present Not Present Not Present Not Present Not Present Not Present
Archaea Euryarchaeota Present Not Present Present Present Present Not Present Present Not Present Not Present Present Not Present Not Present Not Present
Bacteria Aquificae Present Not Present Not Present Not Present Present Not Present Not Present Not Present Present Not Present Present Not Present Not Present
Bacteria Thermotogae Present Not Present Not Present Not Present Not Present Not Present Not Present Present Not Present Not Present Not Present Not Present Not Present
Bacteria Thermodesulfobacteria Not Present Not Present Not Present Not Present Not Present Not Present Not Present Not Present Not Present Present Not Present Not Present Not Present
Bacteria Deinococcus Thermus Not Present Not Present Not Present Not Present Not Present Not Present Not Present Present Present Not Present Not Present Not Present Not Present
Bacteria Chloroflexi Present Not Present Not Present Present Not Present Present Not Present Present Not Present Not Present Not Present Not Present Present
Bacteria Gemmatimonadetes Not Present Not Present Not Present Not Present Not Present Not Present Not Present Not Present Not Present Not Present Not Present Not Present Present
Bacteria Fibrobacteres Not Present Not Present Not Present Not Present Not Present Not Present Not Present Not Present Not Present Not Present Not Present Not Present Not Present
Bacteria Planctomycetes Not Present Not Present Not Present Not Present Not Present Not Present Not Present Not Present Not Present Not Present Not Present Not Present Not Present
Bacteria Verrucomicrobia Not Present Not Present Present Present Not Present Not Present Not Present Not Present Not Present Not Present Not Present Not Present Not Present
Bacteria Chlamydiae Not Present Not Present Not Present Not Present Not Present Not Present Not Present Not Present Not Present Not Present Not Present Not Present Not Present
Bacteria Lentisphaerae Not Present Not Present Not Present Not Present Not Present Not Present Not Present Not Present Not Present Not Present Not Present Not Present Not Present
Bacteria Cyanobacteria Present Not Present Not Present Present Present Not Present Not Present Not Present Not Present Not Present Not Present Present Not Present
Bacteria Fusobacteria Not Present Not Present Not Present Not Present Not Present Not Present Not Present Not Present Not Present Not Present Not Present Not Present Not Present
Bacteria Firmicutes Present Present Present Present Present Not Present Present Present Not Present Present Present Not Present Present
Bacteria Tenericutes Not Present Not Present Not Present Not Present Not Present Not Present Not Present Not Present Not Present Not Present Not Present Not Present Not Present
Bacteria Spriochaetes Present Present Not Present Present Not Present Not Present Not Present Not Present Not Present Not Present Not Present Not Present Not Present
Bacteria Chlorobi Present Not Present Not Present Present Not Present Not Present Present Not Present Not Present Not Present Not Present Not Present Present
Bacteria Bacteroidetes Present Not Present Present Present Present Not Present Not Present Not Present Not Present Not Present Not Present Not Present Not Present
Bacteria Actinobacteria Present Not Present Present Present Present Not Present Not Present Not Present Not Present Not Present Not Present Not Present Not Present
Bacteria Nitrospirae Present Not Present Not Present Not Present Not Present Present Present Not Present Not Present Present Not Present Not Present Not Present
Bacteria Acidobacteria Present Present Not Present Not Present Not Present Not Present Not Present Present Not Present Not Present Not Present Not Present Present
Bacteria Epsilonproteobacteria Present Not Present Not Present Present Present Not Present Not Present Present Present Not Present Present Not Present Not Present
Bacteria Deltaproteobacteria Present Present Not Present Present Present Present Present Present Not Present Present Present Not Present Not Present
Bacteria Alphaproteobacteria Present Not Present Present Present Present Present Present Not Present Present Not Present Not Present Not Present Present
Bacteria Zetaproteobacteria Not Present Not Present Not Present Not Present Not Present Not Present Present Not Present Not Present Not Present Not Present Not Present Not Present
Bacteria Gammaproteobacteria Present Not Present Present Present Present Present Present Present Present Not Present Present Not Present Present
Bacteria Betaproteobacteria Present Not Present Present Present Present Present Present Present Present Not Present Not Present Not Present Present
Cyanobacteria Multiple Fission Branching Filaments Heterocyst Forming Filamentous Nitrogen Fixing
Gloeobacter violaceu Not present Not present Not present Not present Not present
Synechococcus elongatus Not present Not present Not present Not present Not present
Synechococcus sp. WH8102 Not present Not present Not present Not present Not present
Prochloro. marinus sp. MIT9303 Not present Not present Not present Not present Not present
Prochloro. marinus sp. MIT9515 G Not present Not present Not present Not present Not present
Cyanothece sp.PCC8802 Not present Not present Not present Not present Present
Crocosphaera watsonii Not present Not present Not present Not present Present
Synechococcus sp. PCC7002 Not present Not present Not present Not present Not present
Pleurocapsa sp. PCC73193 Present Not present Not present Not present Not present
Chroococcidiopsis sp. PCC6712 Present Not present Not present Not present Not present
Microcoleus chthonoplastes Not present Not present Not present Present Present
Trichodesmium erythraeum Not present Not present Not present Present Present
Lyngbya sp. PCC81068 Not present Not present Not present Present Present
Arthrospira maxima Not present Not present Not present Present Present
Anabaena Variabilis Not present Not present Present Present Present
Nostoc punctiforme Not present Not present Present Present Present
Nodularia spumigena Not present Not present Present Present Present
Fischerella major Not present Present Present Present Present
Chlorogloeopsis fritschii Not present Present Present Present Present
Part A. a phase contrast micrograph of Chlorochromatium aggregatum. Part B, a differential interference contrast micrograph of Chlorochromatium aggregatum. Part C, A fluorescence micrograph of Chlorochromatium aggregatum. Part D, Transmission electron micrograph of a cross section through a single consortium.
Part A. A long chain diol. At one end of the diol, a primary O H group is on one side while a secondary O H group is on the other side. At the other end is a C H 3 group. Part B. The long chain diol forms the end of a membrane, while a mirrored long chain diol with an H 3 C group rather than a C H 3 group forms the out end of the membrane.
16 S r R N A gene phylogeny. The root node branches to Methanosarcina acetivorans, which is a euryarchaeota and an obligate anaerobe. The other branch of the root node branches to Frankia alni, an Actinobacteria species that forms symbioses with Eukarya. The other branch of the secondary node has two branches. The first branches to anabaena variabilis, a Cyanobacteria, and to Treponema primitia, a Spirochaetes and an obligate anaerobe and a species that forms symbioses with Eukarya, and chlorobium limicola, a chlorobi and an obligate anaerobe. The other branch of the tertiary node branches to clostridium acetobutylicum, a Firmicutes and an obligate anaerobe, and paenibacillus abekawaensis, also a Firmicutes, and to two fourth layer nodes. The first of the fourth layer node branches to desulfovibrio gigas and geobacter metallireducens, both of which are obligate anaerobes and Deltaproteobacteria. The second fourth layer node branches to burkholderia nodosa, a Betaproteobacteria, which is a species that forms symbioses with Eukarya, and to 2 fifth layer nodes. The first fifth layer node is azospirillum brasilense, an Alphaproteobacteria. The second fifth layer node branches to 2 sixth layer nodes. The first sixth layer node is mesorhizobium loti, an Alphaproteobacteria and a species that forms symbioses with Eukarya. The second sixth layer node branches to two seventh layer nodes. The first is bradyrhizobium japonicum and the second is beijerinckia indica, both of which are Alphaproteobacteria species that form symbioses with Eukarya.
N I f Phylogeny. The root node branches to 2 secondary nodes. The first secondary node branches to Methanosarcina acetivorans and to Treponema primitia. The first secondary node also branches further to two tertiary nodes, chlorobium limicola and desulfovibrio gigas, and clostridium acetobutylicum. The second seconday node branches to a tertiary node, geobacter metallireducens, and further branches to two fourth layer nodes. The first fourth layer node is paenibacillus abekawaensis and the second branches to two fifth layer nodes. The first fifth layer node branches to two sixth layer nodes, Frankia alni and anabaena variabilis. The second fifth layer node has two sixth layer nodes. The first is mesorhizobium loti and the second branches to two seventh layer nodes. The first is azospirillum brasilense and the second branches to two eighth layer nodes. The first is burkholderia nodosa and the second branches to two ninth layer nodes, bradyrhizobium japonicum and beijerinckia indica.
Thermodesulfobacteria Thermodesulfobacterium Incomplete oxidizer
Deltaproteobacteria Desulfovibrio Incomplete oxidizer
Deltaproteobacteria Desulfomicrobium Incomplete oxidizer
Deltaproteobacteria Desulfobulbus Incomplete oxidizer
Deltaproteobacteria Desulforhopalus Complete oxidizer
Deltaproteobacteria Desulfofustis Incomplete oxidizer
Deltaproteobacteria Desulfomonile Incomplete oxidizer
Deltaproteobacteria Desulfoflacinum Complete oxidizer
Deltaproteobacteria Desulforhabdus Incomplete oxidizer
Deltaproteobacteria Desulfobacterium Complete oxidizer
Deltaproteobacteria Desulfarculus Complete oxidizer
Deltaproteobacteria Desulfobacter Complete oxidizer
Deltaproteobacteria Desulfobotulus Incomplete oxidizer
Deltaproteobacteria Desulfosarcina Complete oxidizer
Deltaproteobacteria Desulfococcus Complete oxidizer
Part A. Desulfovibrio desulfuricans. Part B, Desulfonema limicola. Part C, Desulfobulbus propionicus. Part D, Desulfobacter postgatei. Part E, Desulfosarcina variabilis. Part F, Desulfuromonas acetoxidans. Part G, Enrichment culture of sulfate reducing bacteria.
After 5 to 20 minutes, penetration of prey periplasmic space.
After 40 to 60 minutes, Elongation of Bdellovibrio inside the bdelloplast.
Vegetative cycle, can also lead back to myxospores by chemical induction.
Part a. Micrograph of Spirochaeta zuelzerae. Part b. Diagram of mobility in a spirochete cell. The spirochete cell consists of 3 parts, as follows. The outer sheath, which is flexible, the endoflagellum, and an inner protoplasmic cylinder, which is rigid and generally helical. The endoflagellum, between the outer sheath and the protoplasmic cylinder, is rigid, rotates, and attached to one end of the protoplasmic cylinder.
The hypha, at one end of the mother cell, lengthens and the D N A replicates.
A copy of the chromosome enters the bud at the end of the lengthening hypha.
The cross septum forms at the end of the hypha, below the bud.
The motile swarmer matures and swims away, with a flagellum.
The stages of the Caulobacter cell cycle are as follows.
Swarmer cell, at minute 0. The swarmer cell has a flagellum.
Initiation of D N A synthesis at minute 30, resulting in a stalked cell.
Synthesis of flagellin at minute 65, resulting in an elongated stalked cell.
Cross band formation at minute 82, resulting in a predivisional cell.
Stalk elongation and D N A synthesis span from minute 20 to minute 90.
Part a. The major phyla of bacteria are as follows.
Part b. Proteobacteria types include gamma, alpha, beta, delta, epsilon, and zeta. For each, there are more 16 S r R N A gene sequences than type species, with both decreasing from proteobacteria to zetaproteobacteria, which has no type species. For the remaining phyla, 16 S r R N A gene sequences are between 1 and 10 to the sixth power, while type species is low for some phyla, such as Gemmatimonadetes and Lentisphaerae, and higher for others, including Actinobacteria and Firmicutes.
The phyla of proteobacteria and their proteobacterial classes are as follows.
Nitrosococcus, ammonia, N H 3, or nitrate, N O 2, minus, chemolithotrophy, gamma proteobacterial class.
Thermochromatium, anoxygenic phototrophy major metabolism, gamma proteobacterial class.
Acidithiobacillus, ferrous iron, F e, 2 plus, chemolithotrophy, gamma proteobacterial class.
Beggiatoa, sulfur compounds, H 2 S, S, 0, et cetera, chemolithotrophy, gamma proteobacterial class.
Pseudomonas, nitrogen fixation major metabolism, gamma proteobacterial class.
Methylobacter, methylotrophy major metabolism, gamma proteobacterial class.
Gallionella, ferrous iron, F e, 2 plus, chemolithotrophy, beta proteobacterial class.
Nitrocomonas, ammonia, N H 3, or nitrate, N O 2, minus, chemolithotrophy, beta proteobacterial class.
Methylophilus, methylotrophy major metabolism, beta proteobacterial class.
Derxia, nitrogen fixation major metabolism, beta proteobacterial class.
Ralstonia, hydrogen, H 2, chemolithotrophy, beta proteobacterial class.
Rhodocyclus, anoxygenic phototrophy major metabolism, beta proteobacterial class.
Thiobacillus, sulfur compounds, H 2 S, S, 0, et cetera, chemolithotrophy, beta proteobacterial class.
Methylobacterium, methylotrophy major metabolism, alpha proteobacterial class.
Nitrobacter, ammonia, N H 3, or nitrate, N O 2, minus, chemolithotrophy, alpha proteobacterial class.
Rhodopseudomonas, anoxygenic phototrophy major metabolism, alpha proteobacterial class.
Beijerinckia, nitrogen fixation major metabolism, alpha proteobacterial class.
Paracoccus, hydrogen, H 2, chemolithotrophy, alpha proteobacterial class.
Azotobacter, nitrogen fixation major metabolism, alpha proteobacterial class.
Mariprofundus, ferrous iron, F e, 2 plus, chemolithotrophy, zeta proteobacterial class.
Sulfurimonas, ferrous iron, F e, 2 plus, chemolithotrophy, epsilon proteobacterial class.
Thiovulum, sulfur compounds, H 2 S, S, 0, et cetera, chemolithotrophy, epsilon proteobacterial class.
Desulfosarcina, sulfate reduction major metabolism, delta proteobacterial class.
Desulfovibrio, sulfate reduction major metabolism, delta proteobacterial class.
Nitrospina, ammonia, N H 3, or nitrate, N O 2, minus, chemolithotrophy, delta proteobacterial class.
The orders of alphabacteria, with their phyla, are as follows. Rickettsiales.
The orders and the phyla in each order are as follows. Rhodocyclales.
The phyla in each order are as follows. Acidithiobacillales. -
In the mixed acid fermentation, glucose produces pyruvate via glycolysis. Reactions from pyruvate lead to major products, lactate and acetyl C o A + Formate, and a minor product, with C O 2, succinate. Acetyl C o A has two major products, ethanol and acetate. Formate has two major products, C O 2 and H 2. In the butanediol fermentation, glucose produces pyruvate via glycolysis. Reactions from pyruvate lead to major products, 2, 3 butanediol + C O 2, ethanol, lactate, and C O 2 + H 2, and minor products, succinate and acetate.
The phyla of epsilonproteobacteria are as follows, in the class campylobacterales.
The phyla of deltaproteobacteria are as follows, by class. Bdellovibrionales.
The phyla in each order are as follows. Actinobacteria. Actinomycetales.
The mycolic acid structure is as follows. R 1 is single bonded to C, which is bonded to H, C, and O H. The second C is single bonded to H, C O O, minus, and R 2. R 1 and R 2 are long chain aliphatic hydrocarbons. The basic fuchsin structure is as follows. C is single bonded to 2 rings with alternating single and double bonds. C is double bonded to a ring with 2 opposing double bonds. One of the rings with alternating single and double bonds is single bonded to H 2 N. The other ring with alternating single and double bonds is single bonded to N H 2. The third ring is double bonded to N H 2 + C l, minus.
The stages are as follows. 1, growth phase. The hypha is arranged in a straight line. 2, tip curls. The end of the hypha curves in a wave like pattern. 3, partitioning of tip, the end of the hypha has a more pronounced zig zagging pattern. 4, cell walls thicken and constrict. Throughout the hypha, distinct spherical cells form. 5, spores mature.
Morphologies of spore bearing structures in the streptomycetes. Straight, Flexous, Fascicled, Monoverticillate no spirals, Open loops primitive spirals hooks, Open spirals, Closed spirals, Monoverticillate with spirals, Biverticillate no spirals, Biverticillate with spirals.
The orders of bacteroidetes and their phyla are as follows. Sphingobacteriales.
Glycerol. H is single bonded to C, which is single bonded to H, C, and O H. The second C is single bonded to H, C, and O H. The third C is single bonded to H, H, and O H.
Sphingosine. H 3 C is single bonded to C H 2, 12, which is single bonded to C. C is single bonded to H and double bonded to C H. C H is single bonded to H C , which is single bonded to both H C and to O H. The second H C is single bonded to C H 2 O H and to N H 3, plus. The O H in this structure is highlighted green, while the N is highlighted red.
The phyla in each major order are as follows. Planctomycetes. Planctomycetales.
4, multiplication of reticulate bodies in the host cell.
5, conversion from the reticulate bodies to elementary bodies in the host cell.
6, release of the elementary bodies from the host cell. The cycle begins again.
The structure of the lipid consists of H 2 C single bonded to O, linked to a chain that is single bonded to C H 3. H 2 C is single bonded to H C, which is single bonded to O, which is linked to a chain that is single bonded to C H 3. H C is single bonded to H 2 C, which is single bonded to R. The links between C and O are ether linkages. R is hydrophilic residue.
The 5 phyla and their major orders are as follows. Eurarchaeota.
Nanoarchaeota, nanoarchaeales. Korarchaeota, korarchaeales. Crenarchaeota.
The graph plots maximum growth temperature in degrees Celsius over time, as follows.
1958, 60 degrees. Geobacillus stearothermophilus, bacteria.
1979, 83 degrees. Sulfolobus acidocaldarius, archaea.
2007, 122 degrees. Methanopyrus kandleri, archaea.
The tree diagram is as follows. In primary endosymbiosis, the cell of eukarya contains a mitochondrion, a nucleus, and a cell from the cyanobacterial lineage of bacteria. Red and green algae diverge as separate lineages in secondary endosymbioses. The red alga branch leads to dinoflagellates, apicomplexans, and stramenopiles, each of which contains a chloroplast from red alga. The green alga branch leads to euglenids and chlorarachniophytes, each of which contains a chloroplast from green alga.
Primary endosymbiosis of bacteria leads to the development of both mitochondria chloroplasts, depending on the bacteria absorbed. mitochondrial ancestors connect to the base of the tree, while chloroplast ancestors connect to the archaeplastida branch. The branches of the Phylogenetic tree of Eukarya are as follows. Archaeplastida
Red algae can undergo secondary endosymbiosis to develop into anything in the chromalveolata branch. Green algae can undergo secondary endosymbiosis to develop into Chlorarachniophytes in the Rhizaria branch, or Euglenids and kinetoplastids in the Excavata branch.
The heights for each stage of fruiting body formation are as follows. Aggregation of amoebae.
Slug migration. D through G, hours 3 through 4, less than 0.2 millimeters. Fruiting body formation.
K, hour 6, 0.6 millimeters. A distinct bulb forms at the top of the body.
Mature fruiting body. M, hour 7, greater than 1.2 millimeters.
In a tree diagram, the main limb branches into Microsporidia, such as encephalitozoon, and a sub branch. The sub branch splits between chytridiomycota, such as Batrachochytrium, and a further sub branch. The second sub branch splits between Zygomycota, such as Rhizopus, and a further sub branch. The third sub branch splits between Glomeromycota, such as Glomus, and a further sub branch. The fourth sub branch splits between Ascomycota, such as Saccharomyces, and Basidiomycota, such as Amanita.
Hyploid cells A and alpha undergo asexual reproduction by budding cell division. This cycle of reproduction repeats until cell types A and alpha mate and fuse, turning them into a diploid. Diploid cells undergo asexual reproduction by budding cell division. A diploid undergoes meiosis to become an ascus, which becomes ascospores and can germinate into haploids.
A cassette mechanism for ascomycete yeast consists of a promoter, silent genes for types A and alpha, and an active alpha type gene located at the M A T locus. The cell can become A type by discarding the gene at the M A T locus and inserting a copy of the master A type gene.
Part A. Dunaliella cells have flagella. Part B. Chara. Part C. A micrasterias cell is circular. Part D. A packet of four scenedesmus cells. Part E. Spirogyra has spiral shaped chloroplasts. Part F. A Volvox carteri colony consists of 8 smaller colonies. Part G. Botryococcus braunii is surrounded by circular oil droplets.
A flask contains a mineral salts medium that contains mannitol but lacks N H 4 +, N 0 3 minus, or organic nitrogen. If soil is added and the flask incubates aerobically, the absence of N H 4 + forces cells to fix N 2. Such cells can also use N H 4 + if available. A plate with and without N H 4 + both grow a bacteria culture, those the N H 4 + plate has a larger culture. Adding N H 4 + to the enrichment media selects against N 2 fixing bacteria. A plate with N H 4 + contains a bacteria culture, and a plate without N H 4 + is empty.
Part a. The top half the column contains lake or pond water and the bottom half contains mud supplemented with organic nutrients and C a S O 4. The water contains algae, cyanobacteria, and purple nonsulfer bacteria sulfur chemolithotrophs. The mud contains purple nonsulfer bacteria sulfur chemolithotrophs, patches of purple sulfur or green sulfur bacteria, and anoxic decomposition and sulfate reduction. O 2 concentration in the lake water drops with depth and H 2 s concentration in the mud increases with depth.
A milliliter is poured from an enrichment culture or natural sample into a test tube with 9 milliliters of broth. This is a dilution of 10 to the negative 1. a milliliter of this sample is poured into another test tube with 9 milliliters of broth to produce a dilution of 10 to the negative 2. This process is repeated 4 more times to produce dilutions of 10 to the negative 3, 10 to the negative 4, 10 to the negative 5, and 10 to the negative 6. Growth occurs in all samples except the dilutions of 10 to the negative 5 and 10 to the negative 6.
Part a. A laser beam moves through the objective lens of a microscope. Laser beams a and b move through the beam focus on the cell and cross to either side. Downward forces F sub A and F sub B allow the laser beam to drag the cell. Part b. Once it is trapped, the separated cell can be flushed from the capillary into a tube of sterile medium.
Part b. Sterile seawater plus minerals supplemented with different nutrients is poured into each well of a microtiter plate. Single cells from seawater are deposited into individual wells of microtiter plates, individual cells are obtained by flow cytometric sorting or dilution. The microtiter plates are incubated and monitored for microbial growth or specific target genes. Wells showing growth contain stimulatory nutrients.
Part A. Twelve different fluorescent proteins, F P 1 through F P 12, are listed alongside a color spectrum. The proteins are all either red, orange, green, or blue. Part B. Sinorhizobium meliloti cells carry a plasmid fused to F P P 5 and fluoresce green. Part C. Sinorhizobium meliloti cells carry a plasmid fused to F P P 5. The cells fluoresce orange and green.
Part A. A phase contrast image of a sample of field cells. The cells all appear similar to one another. Part b. A phylogenetic F I S H image of a sample of field cells. Color staining shows three different types of cells, one stained blue, one stained yellow, and one stained green
Part A. A Phase contrast photomicrograph of Bacillus megaterium cells and yeast Saccharomyces cerevisiae cells. Part b. A Phase contrast photomicrograph of cells of Bacillus megaterium and the yeast Saccharomyces cerevisiae. The bacillus cells are stained yellow and the yeast cells are stained orange. Part C. A phase contrast photomicrograph of cells of Bacillus megaterium and the yeast Saccharomyces cerevisiae. The yeast cells are stained red and the bacillus cells are not visible.
Part A. A F I S H analysis of activated sludge from a wastewater treatment plant. Ammonia oxidizing bacteria are stained red and nitrite oxidizing bacteria are stained green. Part B. A F I S H analysis of activated sludge from a wastewater treatment plant. Probes stain bacteria red, blue, or green. Bacteria affected by multiple probes appear turquoise, yellow, purple, or white.
Step 1. Total community D N A is extracted from a microbial community
Step 2. P C R is used to obtain the 16 S r R N A gene products
Step 3 A. Using fluorescently tagged primers, amplify a region of the 16 S or 23 S r R N A gene and cut with a restriction enzyme, T R F L P. Or, amplify a region connecting the 1 6 S and 23 S r R N A genes, A R I S A.
Step 4 A. Resolve D N A fragments by length by electrophoresis, generally using an automated system with fluorescence detection.
Step 3 B. Amplify a region of the 16 S or 23 S r R N A gene using general or specific primers, for example, Bacteria specific, or more restrictive primers, to target endospore forming bacteria.
Step 4 B. If D G G E is used, Run pooled 16 S r R N A genes from each sample on D G G E. Excise bands to create sequences of individual bands, and perform phylogenetic analysis. If next generation sequencing is used, millions of amplified fragment sequences are run through phylogenetic analysis.
Part c. In the D G G E profile of microbial communities from wastewater treatment facilities, a phylotype in lane 5 appears to be universal. A phylotype in lane 2 is unique to treatment facility 2, and another phylotype in lane 2 is present in both treatment facilities 1 and 2.
Part a. A bar graph plots throughput in millions of nucleotides per run for different sequencing technologies. the first bar shows a read length of 100 nucleotides and a throughput of between 10 and 10 squared. The second bar has a read length of greater than 200 nucleotides and a throughput of 10 squared. the third bar has a read length of greater than 400 nucleotides and a throughput between 10 squared and 10 cubed. The fourth bar has 3 read lengths, 100, greater than 800, and greater than 10000 nucleotides. the 10000 read length has a throughput of between 10 and 10 squared, 800 has a throughput of between 10 squared and 10 cubed, and 100 has a throughput of 10 to the sixth. Part b. Sensitivity of phylotype detection using Sanger or fluorescent dye technology to sequence approximately 100, low sensitivity, or 1000, medium sensitivity, clones from an environmental library. Low sensitivity detection finds about 30 unique phylotypes, which make up 4.8% of the phylotypes in the environmental D N A sample. Medium sensitivity detection finds about 90 unique phylotypes, which make up 3.4% of the phylotypes in the environmental D N A sample. High sensitivity detection, next generation sequencing, allows for detection of the rare biosphere. It detects more than 500 unique phylotypes, which make up about 0.5% of the phylotypes in the environmental D N A sample.
Functional Category Genes families total probes Database gene coverage percent
Individual omics are used on the following components of a microbial community.
Probe-based single-cell microscopic or cell-sorting analysis.
DNA. Targeted gene analysis. Metagenome. Mapping. Potential activity is analyzed using phylogeny, diversity, and gene, pathway function, Single-gene amplification, Genome sequencing, Microarrays.
RNA. Metatranscriptome. Gene expression is analysed through mapping and gene expression profiles.
Proteins. Metaproteome. Gene expression is analysed using mapping and protein identification.
Metabolites. Metabolome. Activities of communities and single cells are analysed using community food webs.
Stable and radioactive isotopes. Activities of communities and single cells are analysed using stable isotope probing, single cell activity, MAR, Nano SIMS, isotopic tracers for process measurements.
Probe-based single-cell microscopic or cell-sorting analyses. Activities are analysed using FISH, BONCAT, FACS, and single cell genomics.
After total community D N A is extracted from a microbial community, either the community sampling approach or the environmental genomics approach can be taken. In the community sampling approach, a single gene is amplified, for example, a gene encoding 16 S r R N A or a gene encoding a specific function, such as ammonia oxidation. this gene is sequenced and a tree is generated. the benefits of A single gene phylogenetic tree are that it provides a phylogenetic snapshot of most members of the community and the phylogenetic diversity of a microbial guild, such as the ammonia oxidizing archaea. In the environmental genomics approach, the total D N A is restriction digested and put through a shotgun sequence or sequenced directly, without cloning, using a high throughput D N A sequence. This data is assembled and annotated into partial or complete genomes. The benefits of a total gene pool of the community are that is provides identification of all gene categories, allows for the discovery of new genes, and links genes to phylotypes.
The analysis is as follows. Cell growth, phosphorus assimilation, P sub i high affinity transport.
Cell growth, phosphorus assimilation, P sub i low affinity transport.
Cell growth, phosphorus assimilation, polyphosphate.
Cell growth, phosphorus assimilation, alkaline phosphatase.
Cell growth, nitrogen assimilation, nitrogen fixation.
Cell growth, nitrogen assimilation, assimilative nitrate reduction.
Energy conservation, anaerobic respiration, dissimilative nitrate reduction, membrane, cytoplasmic.
Energy conservation, chemolithotrophy, ammonia oxidation.
Part b. Along with the proteins, key enzymes identified are as follows.
5. Phosphoenolpyruvate synthase, pyruvate phosphate dikinase (EMP in Archaea)
Part A. Sulfate reduction. A graph plots amount of lactate or H 2 S over time. Lactate decreases at an increasing rate over time and H 2 S increases at a decreasing rate over time. Part B. Photosynthesis. A graph plots 14 C O 2 incorporation over time. 14 C O 2 incorporation increases at a decreasing rate for microbes exposed to light. It increases by a very small amount at a constant rate for microbes in the dark, and is at a constant zero for the Formalin killed control. Part C. Sulfate reduction. A graph plots amount of H 2 superscript 35 S over time. Values rise at a decreasing rate when H 2 is present and rise at a low, constant rate when H 2 is absent. The formalin killed control rises at an even lower rate. Part D. C glucose respiration. A graph plots amount of 14 C O 2 over time. Values increase at a decreasing rate. The formalin killed control increases at a very slow rate.
A stoppered vial containing cells suspension has the following atmosphere. 10% C 2 H 2 in air, aerobes, or 10% C 2 H 2 in N 2 ir argon, anaerobes. After incubation, the nitrogenase reaction is as follows. Acetylene in the presence of 2 H yields Ethylene. After nitrogenase activity, sample headspace periodically and inject into gas chromatograph. A time series chart recorder for the chromatograph shows no ethylene at time 0, but increasing production of it as time continues.
Part a. The microsensor narrows to a point with silicone rubber at the end. Inside the microsensor on the other wise from the end of the silicone rubber is an electrolyte and a gold cathode. On the other side of the cathode is platinum. The microsensor is encased in glass. Part b. The end of the microsensor is 50 to 100 micrometers tall. N O 3, minus, passes through a membrane at the end of the sensor. Through bacteria, the N o 3, minus, becomes N 2 O. The N 2 O passes through another membrane to the gold cathode. On the other side of the cathode, 2 e, minus, + N 2 O + H 2 O yields N 2 + 2 O H, minus in a nutrient solution.
A graph plots depth in sediment in millimeters versus concentration of Oxygen and nitrate in micromoles. Seawater fills depths less than zero, Oxic sediment makes up depths of zero to 4.9 millimeters, and anoxic sediment fills depths below 4.9 millimeters. In seawater, Oxygen has a concentration of about 230 micromoles and nitrate has a concentration of about 8.5 micromoles. In the oxic sediment layer, nitration occurs and nitrate concentration increases to about 11 micromoles while oxygen concentration falls rapidly to 0. In the anoxic sediment layer, denitrification occurs and nitrate concentration falls to 0.
3.5 billion year old rocks, from negative 22 to negative 13.
Recent marine sediments, from negative 35 to negative 10.
Green sulfur bacteria, from negative 20 to negative 9.
Purple sulfur bacteria, from negative 35 to negative 20.
Calvin cycle plants, from negative 27 to negative 14.
Atmospheric C O 2, from negative 10 to negative 7.
Elemental sulfur, from negative 18 to positive 19.
Sulfide from marine mud, from negative 30 to positive 6.
Meteoritic sulfide, from negative 2 to positive 2.
Sedimentary sulfide, from negative 38 to positive 12.
Part A. schematic of nano S I M S operation. Part B, Demonstration of interspecies nutrient transfer. Part C, 16 N, Although nitrogen is fixed in the heterocyst, this cell is terminally differentiated and nongrowing. Thus, only the epibiont and adjacent vegetative cell, white arrows, are 15 N labeled. Part D, 19 F.
The graph has three curves, for 0 hour, 72 hour, and 120 hour incubations. The cellular components of the curves are as follows. Carbohydrates, approximately 1030 to 1090 wave numbers. Carbohydrates, approximately 400 to 580 wave numbers. Nucleic acids, 781 wave numbers in the 72 hour curve. Protein, 833 wave numbers in the 120 hour curve. 13 C Phenylalanine 967 wave numbers in the 120 hour curve. Unsaturated lipids, 1,664 wave numbers in the 120 hour curve. There are peaks diagnostic for labeled phenylalanine at points in the 72 hour and 120 hour curves as follows. 590 wave numbers, 967 wave numbers, 1170 wave numbers, and 1540 wave numbers. There is an asterisk at 1,003 wave numbers. All values approximated.
Part a. A researcher collects samples from a lake. Part b. High species richness in Saint John’s River, Florida, shown by microscopy of planktonic microorganisms including cyanobacteria, diatoms, green algae, flagellates, and bacteria. Part c. Shift of Saint John’s River community to low richness but high abundance following a bloom of the cyanobacterium Microcystis.
In an example setting, populations, guilds, and communities are as follows.
Community 1, Photic zone, Oxygenic phototrophs 6 C O 2 + 6 H 2 O yields C 6 H 12 O 6 + 6 O 2
Community 2, Oxic zone, Aerobes and facultative aerobes C 6 H 12 O 6 + 6 O 2 yields 6 C O 2 + 6 H 2 O.
Community 3, Anoxic sediments, contains 4 guilds, as follows.
Guild 1, denitrifying bacteria, N O 3, minus, yields N 2, ferric iron reducing bacteria, F e, 3 plus, yields F e, 2 plus.
Guild 2, sulfate reducing bacteria, S O 4, 2 minus, yields H 2 S, sulfur reducing bacteria, S 0 yields H 2 S.
Guild 4, methanogens, C O 2 yields C H 4, acetogens, C O 2 yields acetate.
In the graph for O 2, oxygen level is at 200 above a depth of 0 millimeters. At 0 millimeters, oxygen level increases to 500, then, at a depth of 1 millimeter, oxygen level decreases to 0. The curve for H 2 S starts at 0 at a depth of 1 millimeter then increases to greater than 1000 at a depth of 2.5. The curve for p H starts at 8.1 at a depth above 0, increases to 8.75 at a depth of 0, then decreases to 6.6 at a depth of 2.75 millimeters. All values approximated.
A horizon. Surface soil, high in organic matter, dark in color, is tilled for agriculture. Plants and large numbers of microorganisms grow here. Microbial activity is high.
B horizon. Subsoil, minerals, humus, and so on, leached from the soil surface accumulate here. Little organic matter. Microbial activity detectable but lower than A horizon.
C horizon. Soil base, develops directly from underlying bedrock, microbial activity generally very low.
The groups in a pie chart provide the composition of prokaryotic soil communities from largest portion to smallest, as follows.
Archaea, consisting of thaumarchaeota and other archaea and euryarchaeota
The Proteobacteria composition is as follows in groups from largest portion to smallest.
Alpha. Rhizobiales, Sphingomonadales, Rhodospirillales, Caulobacterales, other.
Gamma. Enterobacteriales, Pseudomonadales, Xanthomonadales, other.
Delta. Myxococcales, Desulfuromonales, Bdellovibrionales, other. Other proteobacteria.
The Acidobacteria composition is as follows in groups from largest portion to smallest. G p 6, g p 4, g p 1, Other Acidobacteria, g p 3, g p 2, g p 5, and g p 7. The Bacteroidetes composition is as follows in groups from largest portion to smallest. Sphingobacteria, Other Bacteroidetes, and Flavobacteria.
The tree diagram is as follows. D P A N N superphylum make up one of the main branches of the tree diagram, and are highlighted. From the initial branch, the superphylum has a sub branch, parvarchaeota, and another sub branch with two additional sub branches each. The first includes nanoarchaeota and diapherotrites. The second includes nanohaloarchaeota and aenigmarchaeota. The initial branch of the tree diagram has two additional sub branches. The first is euryarchaeota. The second has two sub branches. The first is korarchaeota. The second has two sub branches. The first is lokiarchaeota, which is highlighted. The second has two additional sub branches. The first is crenarchaeota. The second has two sub branches. The first has two sub branches, thaumarchaeota and aigarchaeota. The second is bathyarchaeota. Aigarchaeota and bathyarchaeota are highlighted.
The curves for O 2, H 2 S, and temperature levels are as follows. The O 2 curve starts at 0 milligrams per liter at a depth of 8.2 meters. The curve rises to 9.2 milligrams per liter at a depth of 5 meters and then ends at 8.7 meters at a depth of 0 meters. The H 2 S curve starts at 0 milligrams per liter at a depth of 8.2 meters, then falls to 5.5 milligrams per liter at a depth of 13 meters. The temperature curve starts at 6 degrees Celsius at a depth of 13 meters, rises to 7 degrees at a depth of 7.5 meters, continues to rise more rapidly to 21 degrees at 5 meters, and then rises to 23 degrees at a depth of 0 meters. The thermocline is between 5 and 7.5 meters of depth, where the water temperature increased from 7 to 21 degrees. All values approximated.
Part a. The curves are as follows. The O 2 curve is steady until an input of sewage and other waste waters. The curve decreases after the input, hits a minimum, and then increases. The bacteria, organic carbon, and B O D curve starts steady, below the O 2 curve, then, with the sewage input, the curve increases and hits a maximum, higher than the initial O 2 level, at the same distance as the O 2’s minimum. The bacteria curve then decreases. The algae and cyanobacteria curve starts steady, higher than the initial bacteria level and lower than the initial O 2 level, then decreases after the sewage input. After hitting a minimum, the curve rises to a maximum higher than the initial O 2 level but lower than the bacteria maximum. After hitting the maximum, the algae curve decreases. The N O 3, minus, curve starts at the input of sewage point, rises to a maximum lower than the initial O 2 level, then falls. The N H 4, plus, and P O 4, 3 minus, curve starts at the input of sewage point, rises to a maximum higher than the N O 3, minus, maximum but lower than the initial O 2 level, and then falls to a minimum, where the curve is steady.
From a freshwater lake bacterial sample, 1, extract lake microbial community D N A, and 2, isolate, sequence, and analyze 16 S r R N A genes. The distribution of the bacteria is as follows.
Actinobacteria, including actinobacteridae and unclassified actinobacteria.
Bacteroidetes, including flavobacteria, sphingobacteria, and unclassified bacteroidetes.
Archaea, including auryarchaeota and thaumarchaeota and other archaea.
Under shallow water, as depth into the sediment increases, there is decreasing activity and electron acceptor availability. This region is characterized by anaerobic respirations. N O 3, minus, yields N 2 or N 2 O or N H 4, plus. M n, 4 plus, yields M n, 2 plus. F e, 3 plus, yields F e, 2 plus. N O 2, minus, yields N 2 or N 2 O or N H 4, plus. S O 4, 2 minus, yields H S, minus. C O 2 yields C H 4. Above the sediment surface in the water, O 2 yields H 2 O, coastal hypoxia and aerobic respiration. Deep sediments characterized by extremely low fermentation and methanogenesis activities. In productive surface waters, particulate organic carbon sinks, while N 2 O rises from an oxygen minimum zone. In the sediment below the productive surface waters, C H 4 + S O 4, 2 minus, yields H C O 3, minus, + H 2 O + H S, minus. Gas hydrates and cold seeps into the water. In the oxygen minimum zone in the water, N H 4, plus, 1.5 O 2 yields N O 2, minus, + 2 H, plus, plus H 2 O. N H 4, plus, + N O 2, minus, yields N 2 + 2 H 2 O. N O 2, minus, yields N 2 or N 2 O or N H 4, plus. Material from hydrothermal vents includes electron donors for chemolithotrophy, H 2, H 2 S, C H 4, N H 4, plus, F e, 2 plus, M n, 2 plus.
Part a. Temperature reaches a maximum in autumn and a minimum in spring. Nitrogen level reaches a maximum between winter and spring and a minimum between summer and autumn. Light level reaches a minimum in winter and a maximum in summer. Part b. In the phylogeny chart, predator resistance adaptations occur on the same branch. Nitrogen availability adaptations occur on the same branch, above the predator resistance branch. Temperature adaptations also occur on the same branch, above the nitrogen availability branch.
The photic zone reaches from the surface to a depth of 250 meters. The archaea curve is steady at 10 percent at depths between 3 and 100 meters, then increases to 40 meters at a depth of 500 meters. The curve then decreases to 30 percent at 1,000 meters, then increases to 40 percent at 2,000 meters. The curve decreases to 35 percent at 3,000 meters, then ends at 45 percent at 5,000 meters. The bacteria curve is steady at 77 percent at depths between 3 and 13.5 meters. The curve then decreases to 28 percent at 2,000 meters, increases to 30 percent at 3,000 meters, then ends at 45 percent at 5,000 meters. A table provides the absolute numbers of archaea and bacteria at various depths, as follows.
Depth Archaea, cells per milliliter Bacteria, cells per milliliter
5 meters 3 times 10 to the fourth power 3 times 10 to the fifth power
100 meters 3 times 10 to the fourth power 2 times 10 to the fifth power
500 meters 2 times 10 to the fourth power 3 times 10 to the fourth power
1,000 meters 7 times 10 to the third power 1 times 10 to the fourth power
2,000 meters 5 times 10 to the third power 3 times 10 to the third power
5,000 meters 4 times 10 to the third power 4 times 10 to the third power
From an ocean sample, 1, extract ocean water microbial community D N A, 2, isolate, sequence, and analyze 16 S r R N A genes. From largest portion to smallest portion, the distribution is as follows. Proteobacteria, Bacteroidetes, unclassified and minor bacterial groups, cyanobacteria, archaea, which consists of crenarchaeota, euryarchaeota, and other archaea, actinobacteria, verrucomicrobia, planctomycetes, and firmicutes. The proteobacteria contains subgroups as follows.
Gamma. Alteromonadales, oceanospirillales, pseudomonadales, vibrionales, other.
Growth of piezo tolerant, piezophilic, and extremely piezophilic bacteria as follows. At 0 atmospheres piezo tolerant bacteria double 4 times per day, starting at 300 atmospheres it sharply declines to 0 growth rate at 500 atmospheres. At 0 atmospheres piezophilic bacteria double about 2 times per day and slowly increase to 3.75 doublings per day at 500 atmospheres, and decreases slightly to 2.75 doublings per day at 700 atmospheres. At 0 atmospheres extremely piezophilic bacteria double 0 times per day and start growing at about 300 atmospheres, it sharply increases to 5 doublings per day at 700 atmospheres and decreases slightly to 4 doublings per day at around 1000 atmospheres.
The pressure and temperature optima for each bacteria and archaea culture is as follows. Bacteria.
Marinitoga piezophila, 65 degrees, 40 megapascals.
Photobacterium profundum S S 9, 15 degrees, 27 megapascals.
Desulfovibrio profundus, 22 degrees, 14 megapascals.
Methanococcus jannaschii, 85 degrees, 75 megapascals.
Methanococcus thermolithotrophicus, 65 degrees, 50 megapascals.
Thermococcus barophilus, 82 degrees, 41 megapascals.
An abundance of cells exists the most in above and in methane hydrates at 500 meters at 10 to the eighth power c m cubed. Some cells exist around 1500 meters depth with 10 to the fourth power c m cubed. Less than 100 c m cubed cells exist in coal beds at 2000 to 2500 meters.
From a marine sediment sample, 1, extract the sediment microbial community D N A, 2, isolate, sequence, and analyze 16 S r R N A genes. The composition of the sediment, from largest portion to smallest, is as follows. Proteobacteria, archaea, consisting of euryarchaeota, crenarchaeota, and other archaea, bacteroidetes, planctomycetes, firmicutes, cyanobacteria, chloroflexi, actinobacteria, and acidobacteria. The proteobacteria composition is as follows.
Gamma. Alteromonadales, chromatiales, oceanospirillales, pseudomonadales, thiotrichales, vibrionales, other.
Near warm vents, seawater permeates the surficial sediments between 20 and 100 degrees Celsius. Sedimentation from the hot vent covers the sub seafloor with surficial sediments. From a basalt layer, S O 4, 2 minus, yields S, 2 minus. H C O 3, minus, yields C O 2 and C H 4. M n, 2 plus, C a, 2 plus, F e, 2 plus, C u, 2 plus, also emanate from the basalt layer. In the sub seafloor, hydrothermal fluid, H 2 S, rises to the warm vent. H 2 S and F e S rises to the hot vent. F e, 2 plus, + s, 2 minus, yields F e S. From the hot vent, F e S, M n, 2 plus, + O 2 yields F e O, O H, M n O 2.
From a hydrothermal vent bacteria sample, 1, extract vent fluids microbial community D N A, 2, isolate, sequence, and analyze 16 S r R N A genes. The composition of the hydrothermal vent is as follows, from largest portion to smallest. Proteobacteria. Archaea, consisting of euryarchaeota, crenarchaeota, and other archaea. Unclassified and minor bacterial groups. Bacteroidetes. Firmicutes. Aquificae. Chloroflexi. Planctomycetes. The proteobacteria portion is made up of portions as follows.
Gamma. Alteromonadales, oceanospirillales, thiotrichales, other.
Epsilon. Arcobacter, sulfurospirillum, sulfurimonas, sulfurovum, nautiliales, other.
The major carbon reservoirs on earth are as follows.
Reservoir, percent of total carbon, 76 times 10 to the 15 tons
Rocks and sediments, 99.5, 80 % of which is inorganic.
The seasonal methane flares emanate from seasonally stable gas hydrates at depths between 350 and 400 meters, between 2000 and 3000 meters from the shore. Below the seasonally stable gas hydrates is a permanent gas hydrate stability zone, at depths between 350 and 450 meters, between 2250 and 3250 meters from the shore.
High Denitrification decrease primary production and nitrification increase N O 3 minus and primary production. Low N H 4 + decrease primary production. High organic carbon will increase N 2 fixation while low organic carbon will decrease it.
Complex polymers such as Cellulose, other polysaccharides, proteins, lipids, nucleic acids are broken down by Hydrolysis by cellulolytic and other polymer degrading bacteria into monomers. Monomers such as Sugars, amino acids, fatty acids are broken down by Fermentation by primary fermenters into H 2 and C O 2, acetate, and Propionate, Butyrate, Succinate, and Alcohols. H 2 and C O 2 are converted into Acetate by acetogenesis. Propionate, Butyrate, Succinate, and Alcohols are broken down by H 2 and C O 2 and Acetate by syntrophy. Acetate is broken down by Methanogens into C H 4 and C O 2.
N H 4 + to N O 3 minus Comammox, Nitrospira species
N H 4 + to N O 2 minus Nitrosomonas, Nitrosopumilus, Archaea
Denitrification, N O 3 minus to N 2 Bacillus, Paracoccus, Pseudomonas
Free living anaerobic Clostridium, purple and green phototrophic bacteria. Methanobacterium, Archaea
Ammonification, organic N to N H 4 + Many organisms can do this
Anammox, N O 2 minus + N H 3 yields 2 N 2 Brocadia
Sulfide and or sulfur oxidation, H 2 S to S 0 to S O 4 2 minus, aerobic Sulfur chemolithotrophs, Thiobacillus, Beggiatoa, many others
Sulfide and or sulfur oxidation, H 2 S to S 0 to S O 4 2 minus, anaerobic Purple and green phototrophic bacteria, some chemolithotrophs
Sulfate reduction, anaerobic, S O 4 2 minus to H 2 S Desulfovibrio, Desulfobacter, Archaeoglobus, Archaea
Sulfur reduction, anaerobic, S0 to H 2 S Desulfuromonas, many hyperthermophilic Archaea
Sulfur disproportionation, S 2 O 3 2 minus to H 2 S + S O 4 2 minus Desulfovibrio, and others
Organic sulfur compound oxidation or reduction, C H 3 S H to C O 2 + H 2 S, and D M S O to D M S Many organisms can do this
Desulfurylation, organic S to H 2 S Many organisms can do this
Part a. A freshwater microbial mat. Part b. Phase-contrast of a sheath-forming an iron oxidizer. Part c. Epifluoresence photomicrographs of a sheath-forming an iron oxidizer. Part d. A stalk showing cell division at the end of an iron-oxide encrusted stalk. Part e. An iron-oxidized deep-sea mat. Part f. TEM of biogenic oxides. Part g. Phase contrast of marine iron oxidizers.
Part c. The marine calcium cycle is as follows. Detrital C a C O 3 in sediment becomes dissolved C a 2 + and H C O 3 minus which becomes calcareous exoskeletons which turn back into detrital C a C O 3. dissolved C a 2 + and H C O 3 minus are also produced by upwelling of the sediments. Calcareous exoskeletons contribute to the sediments by sinking. The equation is C a 2 +, + 2 H C O 3 Minus in equilibrium with C a C O 3 + C O 2 + H 2 O. The C O 2 and H 2 O are in equilibrium with H 2 C O 3 which is in equilibrium with H + and H C O 3 minus.
The marine silica cycle is as follows. Detrital S i O 2 in sediment becomes dissolved H 4 S i O 4 which becomes diatom frustules, S i O 2, which turn back into detrital S i O 2 or back into dissolved H 4 S i O. Dissolved H 4 S i O 4 are also produced by upwelling of the sediments. Diatom frustules, S i O 2, contribute to the sediments by sinking. The equation is H 4 S i O 4 in equilibrium with S i O 2 and 2 H 2 O.
The enzyme system in a bacterial cell consists of three parts, as follows. The first part is a cycle. C H 3 bonded to H g c A leads to H g c A and H g c B, which leads to H g c A. In another part of the system, H g, 2 plus, leads to C H 3 H g. In a third part of the system, C H 3 bonded to T H F leads to T H F.
Part a. The operon consists of 7 cells, R O T P A B D. The first cell, R, encodes M e r R, a transcriptional repressor and activator. The second cell, O, is the operator region. The last cell, D, encodes M e r D, a regulator. Part b. The enzyme organomercury lyase degrades C H 3 H g, plus to H g 2, plus. C H 4 and Mer A reduce H g, 2 plus to H g 0.
In the graph for carbon dioxide, C O 2 rises from 340 parts per million in 1980 to 390 in 2010. In the methane curve, C H 4 rises with a decreasing slope from 1650 parts per million in 1985 to 1750 in 1995 to 1775 in 2005. The curve then rises to 1825 in 2015. In the nitrous oxide graph, N 2 O rises from 300 parts per million in 1980 to 320 in 2005. In the fourth graph, a curve for C F C’s and minor gases is steady at 0.25 watts per square meter over time. The curve for N 2 O is steady above the C F C curve, rising to 0.5. The curve for C H 4 rises above the N 2 O curve, to 1.0. The C O 2 curve starts at 1.5 in 1980 and rises to 3.0 in 2014.
By size, the sources of methane emissions are as follows.
Part a. The horizontal axis has a scale from 0 to 30, left to right. The vertical has a scale from 500 to 0, from bottom to top. A plot of predicted C H 4 concentration in in equilibrium with air rises left from (18, 350) to (14, 100), then rises vertically to (14, 0). A plot of measured C H 4 concentration rises right from (19, 460) to (25, 125), farther right to (36, 100), then rises left to (22, 50), then right to (24, 0). All values estimated. Part b. The pathway for methylphosphonic acid biosynthesis is as follows. Phosphoenolpyruvic acid, with Pep M, to Phosphonopyruvic acid. Phosphonopyruvic acid to 2-Hydroxyethylphosphonic acid. 2-Hydroxyethylphosphonic acid, with M p n S, to Methylphosphonic acid. Part c. The structures are as follows. Glphosphate. O H, single bond, P double bonded to O above and single bonded to O H below, single bond, C, single bond, N H, single bond, C, single bond, C double bonded to O above, single bond, O H. Fosfomycin. C, single bond, C, each single bonded to the same O above. The right C is wedged bonded to a side C. The left C is wedge bonded to a side P, which is double bonded to O H above, double bonded to a side O, and single bonded to O H below.
An oxidation pond at the base of the arrangement holds Leptospirillum ferrooxidans and Acidithiobacillus ferrooxidans. The chemical process is as follows. F e, 2 plus, + 1 fourth O 2 + H plus yields F e, 3 plus, + 1 half H 2 O. The acidic solution from the oxidation pond is pumped back to the top of the leach dump, with the addition of H 2 S O 4. At the top, the pipe sprinkles the acidic solution on a tank with low grade copper ore, C u S. Copper ore can be oxidized by oxygen dependent and oxygen independent reactions, solubilizing the copper. The reactions are as follows.
Oxygen dependent. C u S + 2 O 2 yields C u, 2 plus, + S O 4, 2 minus.
Oxygen independent. C u S + 8 F e, 3 plus, + 4 H 2 O yields C u, 2 plus, + 8 F e, 2 plus, + S O 4, 2 minus, + 8 H plus.
Soluble C u, 2 plus, drains from this tank into a lower precipitation pond for the recovery of copper metal, C u super 0. The chemical reaction is as follows. F e super 0 + C u, 2 plus, yields C u super 0 + F e, 2 plus. The F e super 0 is from scrap steel. Copper metal, C u super 0, is deposited in a pile below the precipitation pond, while an acidic F e, 2 plus, rich solution is dumped into the oxidation pond, completing the loop.
Part c. The propagation cycle extends between F e S 2, F e, 2 plus, and F e, 3 plus. The transition from F e, 2 plus, to F e, 3 plus, is via bacteria or can be spontaneous. The transition from F e, 3 plus, to F e S 2 is spontaneous. F e, 3 plus, is the oxidant for the propagation cycle. The full initiator reaction is as follows. F e S 2 + 3, 1 half O 2, + H 2 O yields F e, 2 plus, + 2 S O 4, 2 minus, + H plus, which leads to acidification.
D D T, dichlorodiphenyltrichloroethane, an organochlorine
Malathion, mercaptosuccinic acid diethyl ester, an organophosphate
Atrazine, 2 chloro 4 ethylamino 6 isopropylaminotriazine
Monuron, 3, 4 chlorophenyl, 1 1 dimethylurea, a substituted urea
Chlorinated biphenyl, P C B, shown is 2 3 4 2 prime, 4 prime, 5 prime hexachlorobiphenyl
Anaerobic pathway is as follows. Perchloroethylene, P C E, to Trichloroethylene, T C E. T C T to, cis Dichloroethylene, D C E. D C E to Vinyl chloride, V C. V C to Ethene. Aerobic pathway. Through Monooxygenases, T C E to TCE epoxide. In a spontaneous reaction, T C E epoxide to Glyoxylate, CO, and formate.
The tree is as follows. Root branches to node 1. Node 1 branches to node 2 and branch Chloroflexi and node 3. Node 3 branches to branch ends Dehalogenimonas and Dehalococcoides. Node 2 branches to branch Proteobacteria and node 4, and branch Firmicutes and node 5. Node 5 branches to branch ends Desulfitobacterium and Dehalobacter. Node 4 branches to node 6 and node 7. Node 6 branches to branch ends Desulfovibrio and Sulfurospirillum. Node 7 branches to branch end Anaeromyxobacter and node 8. Node 8 branches to branch ends Geobacter and Desulfuromonas. Branch ends Desulfovibrio through Desulfitobacterium represent facultative. Branch ends Dehalobacter through Dehalococcoides represent obligate.
Parts are as follows. Part a. All structures are displayed in brackets, with sub n at the right. All bonds are single bonds. The following list provides the plastic and monomeric structure.
Polystyrene. C H 2, C H left parenthesis C 6 H 6, right parenthesis.
Part b. A copolymer. The structures have a base, zig zag chain. P H V is as follows. O, C H single bonded to C H 2, C H 3. C H 2, C double bonded to O, O. P H B is as follows. C H single bonded to C H 3. C H 2, C double bonded to O, O. Part e. The pathway is as follows. Polyethylene terephthalate, P E T, through P E T ase to Mono (2-hydroxyethyl) terephthalic acid, M H E T. M H T, through M H E T ase, to Terephthalic acid plus ethylene glycol. Terephthalic acid plus ethylene glycol to Metabolized as carbon sources.
Wastewater treatment is as follows. Used water from industrial and residential sources enters the primary treatment stage, in which the wastewater goes through screening and sedimentation. After the primary treatment, the wastewater enters secondary treatment, in which the wastewater branches into anaerobic digestion, which leads to digested sludge, drying, incineration, use as fertilizer, or burial. The wastewater also branches to aerobic oxidation, which consists of activated sludge, aeration and a trickling filter, and leads to disinfection, which in turn leads to treated effluent to discharge.
Part b. Wastewater from primary treatment enters an aeration tank, along with air and materials from the activated sludge return. The aeration tank creates activated sludge, which is piped to a settling tank where activated sludge settles to the bottom. Clear effluent passes out of the settling tank via a pipe near the top of the settling tank, while excess sludge is piped below to an anaerobic digester.
The plot for extracellular phosphate rises with increasing then decreasing steepness to a peak, then falls with increasing then decreasing steepness to the x axis.
The plot for intracellular P H A starts from the y axis just below the plot for extracellular phosphate. The plot rises to a lower peak, then falls less steeply than the plot for extracellular phosphate.
The plot for intracellular polyphosphate starts at the highest point of all plots, on the y axis. The plot falls to a minimum below plots for extracellular phosphate and intracellular P H A, then rises to a roughly horizontal level above both plots.
The plot for extracellular short chain fatty acids falls from a point on the y axis below the plot for intracellular polyphosphate and above other plots. The plot falls with increasing then decreasing steepness to the x axis. The plot shown is roughly 1 fourth as long as other plots.
Wastewater from secondary treatment enters a primary tank with an anaerobic zone with a mixer and an aerobic zone with air pumped in through a diffuser. The water than flows into a setting tank. Low P effluent exits through one end and sludge waste through another. Recycled sludge flows back to the primary tank.
All processes are displayed as pipes connecting 2 boxes. The first box has a mixer. The second has a mixer and diffuser, and a pipe that inputs air. The treatment processes are as follows.
Part a. Classical denitrification. Wastewater containing N H 4, plus, N O 3, minus enters the first box. The process in the first box is denitrification, with an anoxic environment and high C and N required. N H 4, plus, passes into the second box. The process in the second box is nitrification, with ambient temp and long S R T. Clean water exits the second box, and N O 3, minus, is recycled back to the first.
Part b. Wastewater containing N H 4, plus, N O 3, minus enters the first box. The process in the first box is denitrification, with an anoxic environment and low C and N sufficient. N H 4, plus, passes into the second box. The process in the second box is nitrification, ammonia oxidation stopped at N O 2, minus, with warm temperature, short S R T, and p H control. Clean water exits the second box, and N O 2, minus, is recycled back to the first.
Part a. Steps at times T 1 through 4 are as follows. T 1. Anoxic wastewater fed from bottom of a tank containing granular sludge. Entering wastewater displaces clean water at top. Clean water is expelled. T 2. Anoxic; P release. T 3. Air mixing. Simultaneous P uptake and denitrification. T 4. Rapid settling and partial sludge removal through bottom for P recovery. Repeat cycle at T 1.
Part b. A photo of granular sludge settles in the bottom of a vial.
Part c and d. A micrograph and diagram of granulaes. Granules have oxic outer layers and anoxic core. Outer layer processes are Aerobic phosphate uptake and nitrification. Core processes are concurrent denitrification and phosphate uptake, and anaerobic phosphate release.
Part b. The process of sludge digestion is as follows. Through hydrolysis by microbial enzymes, Complex polymers such as polysaccharides, lipids, proteins, lead to monomers, such as sugars, fatty acids, amino acids. Through fermentation monomers lead to either acetate or H 2 + C O 2. Through methanogenesis, acetate leads to C H 4 + C O 2 and H 2 + C O 2 leads to C H 4 + H 2 O.
Part c. The sludge digester has a gas outlet at the top and sludge outlet at the bottom. The area in the digester at the top is occupied by C H 4 and C O 2. Below this space is a scum layer, with an outlet for scum removal on the side of the digester. Below the scum layer is the supernatant layer, which has the sludge inlet on one side and an outlet for supernatant removal on the other side. The next layer down is actively digesting sludge, followed at the bottom by stabilized sludge. Liquids and solids are separated. Solids are removed and used for land application, incineration, or landfill. Liquid goes through anammox treatment.
Part d. Warm liquid with N H 4, plus, and low C O D enters the first tank with a mixer and diffuser. The process is partial nitritation. Half of ammonia is oxidized to N O 2, minus. Warm temperature, Low O 2, Short S R T. A 50, 50 mix with M H 4 plus, N O 2, minus, enters a second tank with a mixer. The process is anammox. It is anoxic and autotrophic. N 2 is separated and clean water exits the tank.
Part a. Water flows from a river pumping station on the Ohio River to the sedimentation basins, where if flows in a cycle between basins. Water then flows to the coagulation basin, and onward to filter buildings. The water then undergoes chlorination, and is pumped to an underground clear water reservoir. Part b. The processes of the purification system are as follows.
Remove sand, gravel, large particulates from raw water creating sedimentation.
Form and remove floc containing insoluble material and microorganisms in coagulation.
Remove remaining particulates and most organic and inorganic compounds in filtration
Kill remaining microorganisms and prevent growth of new inocula in chlorination.
Water flows from a catchment and reservoir to a water purification plant, then to a point of production. From here, it is routed for industrial usage, and to storage. Water from storage is routed for residential usage via transmission mains with meters on them, and then to distribution mains and domestic lines.
Part a. In the anodic region 4 F e super 0 yields 4 F e, 3 plus, at the corrosion pit, and 8 electrons which are contributed to 4 H 2 + S O 4, 2 minus. In the cathodic region, 8 H 2 O yields 8 O H minus + 8 H plus. The sulfate reducing bacterium causes the chemical process, 4 H 2 + S O 4, 2 minus, yields H S minus. Part b. 4 F e super 0 yield 8 electrons, which are transferred to the electron transfer and sulfate reduction complex spanning the periplasm of the sulfate reducing bacterium. S O 4, 2 minus, yields H S minus, via the sulfate reducing bacterium. This is combined with 3 H C O 3, minus, and 4 F e, 2 plus, to yield F e S and 3 F e C O 3. The corrosion products cover the corrosion pit and surrounding surface.
The steps in the formation of root nodules in a legume infected by rhizobium are as follows.
Recognition and attachment, rhicadhesin mediated. Rhizobial cells attach to root hairs.
Bacterium secretes nod factors, causing root hair curling.
Invasion. Rhizobia penetrate root hair and multiply within an infection thread. Infected plant cells and those nearby are stimulated to divide.
Bacteria in infection thread grow toward root cell.
Formation of bacteroid state within plant root cells. Continued plant and bacterial cell division leads to nodules.
The general nod structure contains R 1, R 2, and R 3. The table is as follows.
Sinorhizobium meliloti, alfalfa A. c C16 to 2 or C16 to 3 S O 3 H
Rhizobium leguminosarum biovar viciae, pea A. c C 18, 1 or C 18, 4 H or A. c
Glomus intraradices, many agricultural crops H C 16 or C 16, 1 or C 16, 2 or C 18 or C18, 1 delta 9 Z H or S O 3 H
Signaling molecules send signals through the membrane into cytoplasm and then into the nucleus by an unidentified second messenger. In the nucleus, Nuclear C a, 2 plus, oscillations, calcium spiking, leads to activation of calcium and or calmodulin dependent protein kinases which leads to induction of expression of M y c or N o d genes required for organo genesis, nodule or arbuscule formation.
The structure of the inducer of nod gene expression is as follows. 5, 7, 3 prime, 4 prime tetrahydroxyflavone. O H is single bonded to a hexagonal ring with alternating single and double bonds. The ring is single bonded to H O and shares a single bond side with another hexagonal ring, which has one double bond. One of the atoms of the ring is O, and the ring is double bonded to O. The second ring is also single bonded to another hexagonal ring with alternating single and double bonds, and which is single bonded to two O H atoms. The structure of the inhibitor of nod gene expression is as follows. 5, 7, 4 prime trihydroxyisoflavone. The structure is the same as the inducer structure, except that the last hexagonal ring is bonded to a single O H atom, rather than 2.
The major metabolic reactions. Photosynthesis produces sugars which produces organic acids which, when passing through the symbiosome membrane and bacteroid membrane, become succinate, malate, and fumarate. These then go either into the citric acid cycle or go on to become pyruvate. The citric acid cycle leads to the electron transport chain and finally produce leghemoglobin and O 2 leghemoglobin. The pyruvate combines with A. T P and leads to nitrogenase and N 2. N 2 is processed by the nitrogenase into N H 3 which becomes Glutamine and Asparagine.
The plasmid consists of a T D N A region, which consists of oncogenes and opine synthesis. The plasmid also consists of transmissibility genes and opine catabolism genes, as well as v i r genes, A through E, that encode virulence factors.
The microbial composition of termite hindgut is broken down from greatest to least percentage as follows.
Firmicutes composition is broken down from greatest to least percentage as follows.
The curve for symbiodinium type C 1 b c rises with decreasing steepness to a maximum, then falls with increasing steepness as thermal stress increases. The first third of the curve is death, the middle third is partial mortality, and the last third is bleaching. The curve for symbiodinium type D 1 rises with decreasing steepness to a maximum that is greater in thermal stress and lower in susceptible host symbiont combinations than symbiodinium type C 1 b c. After reaching the maximum, the curve falls with increasing steepness. The first eighth of the curve is partial mortality, the next eighth is bleaching, and the remaining part of the curve is tolerance.
From the root node, the tree branches to 2 secondary nodes. The first secondary node branches to two tertiary nodes. The first tertiary node branches to a fourth level node, which branches to a sheep and cow, herbivores, and a pig, an omnivore. The second tertiary node is a horse. The second tertiary node branches to a fourth level node, which branches to a lion, a carnivore, and to a fourth level node. The fourth level node branches to a dog, a carnivore, and to a fifth level node, which branches to a brown bear, an omnivore, and a giant panda, an herbivore. The secondary node branches to a rabbit, an herbivore, and to a tertiary node. The tertiary node branches to a lemur, an omnivore, and to a fourth level node. The fourth level node branches to a spider money, an omnivore, and to a fifth level node. The fifth level node branches to a baboon, and omnivore, and to a sixth level node. The sixth level node branches to an orangutan, an herbivore, and to a seventh level node, which branches to a human, an omnivore, and a gorilla, an herbivore.
For foregut fermenters, foregut fermentation occurs in a chamber at the end of the esophagus near the acidic stomach. The stomach leads to the small intestine, which leads to the cecum and large intestine, or colon. The cecum and the large intestine make up the hindgut fermentation chambers. Foregut fermenters include ruminants, colobine monkeys, macropod marsupials, and hoatzin. Hindgut fermenters include cecal animals, primates, some rodents, and some reptiles.
The overall stoichiometry of rumen fermentation is 57.5 glucose yields 65 acetate, 20 propionate, 15 butyrate, 60 C O 2, 35 C H 4, and 25 H 2 O. Feed, Hay, etc. becomes cellulose, starch, and sugars. The cellulose, starch, and sugars are processed by cellulysis, amylolysis to become sugars. The sugars go through fermentation, major pathways, to become acetate, propionate, and butyrate. The acetate, propionate, and butyrate pass through the Rumen wall to the ruminant bloodstream. C O 2 and C H 4 are removed by eructation to atmosphere.
The ruminal microbial community is broken down for greatest to least percentage as follows.
Euryarchaeota are broken down for greatest to least percentage as follows.
Firmicutes are broken down for greatest to least percentage as follows.
Lachnospiraceae are broken down for greatest to least percentage as follows.
Ruminococcaceae are broken down for greatest to least percentage as follows.
Oral Attached gingivae, Hard palate, Throat, Palatine tonsils, Tongue dorsum, Buccal mucosa, Supragingival plaque, Subgingival plaque, Saliva
Skin Left and right retroauricular crease antecubital fossa
Vagina Posterior fornix, Mid vagina, Vaginal introitus
Body Site Microbial population from largest to smallest.
Skin Propionibacterium, Staphylococcus, Corynebacterium, Anaerococcus, Streptococcus, Other
Saliva Streptococcus, Pasteurellaceae, Prevotella, Veillonella, Fusobacterium Neisseria, Actinomyces, Porphyromonas, Other
Urogenital tract Lactobacillus, Prevotella, Gardnerella, Atopobium, Sneathia, Bifidobacterium, Megasphaera, Anaerococcus, Other
Gastrointestinal tract Bacteroidetes, Firmicutes, Lentisphaerae, Proteobacteria, Tenericutes, Verrucomicrobia, Other
Major bacteria present Organ Major physiological processes
Proteobacteria Stomach Secretion of acid (HCI) Helicobacter Digestion of macromolecules, p h 2
Bacteroidetes Stomach Secretion of acid (HCI) Helicobacter Digestion of macromolecules, p h 2
Actinobacteria Stomach Secretion of acid (HCI) Helicobacter Digestion of macromolecules, p h 2
Fusobacteria Stomach Secretion of acid (HCI) Helicobacter Digestion of macromolecules, p h 2
Firmicutes Stomach Secretion of acid (HCI) Helicobacter Digestion of macromolecules, p h 2
Enterococci small intestine Continued digestion Absorption of monosaccharides, amino acids, fatty acids, water p H 4 to 5
Lactobacilli Jejunum small intestine Continued digestion Absorption of monosaccharides, amino acids, fatty acids, water p H 4 to 5
Bacteroides Large intestine Absorption of bile, acids, vitamin B 12, p H 7
Bifidobacterium Large intestine Absorption of bile, acids, vitamin B 12, p H 7
Clostridium Large intestine Absorption of bile, acids, vitamin B 12, p H 7
Enterobacteria Large intestine Absorption of bile, acids, vitamin B 12, p H 7
Enterococcus Large intestine Absorption of bile, acids, vitamin B 12, p H 7
Escherichia Large intestine Absorption of bile, acids, vitamin B 12, p H 7
Eubacterium Large intestine Absorption of bile, acids, vitamin B 12, p H 7
Klebsiella Large intestine Absorption of bile, acids, vitamin B 12, p H 7
Lactobacillus Large intestine Absorption of bile, acids, vitamin B 12, p H 7
Methanobrevibacter, Archae Large intestine Absorption of bile, acids, vitamin B 12, p H 7
Peptococcus Large intestine Absorption of bile, acids, vitamin B 12, p H 7
Peptostreptococcus Anus Large intestine Absorption of bile, acids, vitamin B 12, p H 7
Proteus Large intestine Absorption of bile, acids, vitamin B 12, p H 7
Ruminococcus Large intestine Absorption of bile, acids, vitamin B 12, p H 7
Staphylococcus Large intestine Absorption of bile, acids, vitamin B 12, p H 7
Streptococcus Large intestine Absorption of bile, acids, vitamin B 12, p H 7
From largest proportion and decreasing, the bacterial orders of saliva are as follows. Firmicutes, bacteroidetes, proteobacteria, T M 7, actinobacteria, fusobacteria, S R 1, tenericutes, and spirochaetes. The phyla in the firmicutes, bacteroidetes, proteobacteria orders are as follows. Firmicutes.
From largest proportion and decreasing, the bacterial orders of subgingival plaque are as follows. Firmicutes, bacteroidetes, proteobacteria, actinobacteria, fusobacteria, T M 7, spirochaetes, and synergistetes. The phyla in the firmicutes, bacteroidetes, proteobacteria, and actinobacteria orders are as follows. Firmicutes.
Bacterial diversity, largest to smallest percentage
Actinobacteriaceae, largest to smallest percentage
Part a. The phyla detected in the healthy human volunteers are as follows. Actinobacteria, 51.8 %. Firmicutes 24.4 %. Proteobacteria, 16.5 %. Bacteroidetes, 6.5 %. Others, 1 %. Part b. The bacterial distributions are as follows. Sebaceous skin.
Skin bacterial Diversity, largest percentage to smallest
Part a. Viruses are as follows. Anellovirus, Polyomavirus, Circovirus, Papillomavirus, Adenovirus, Pepper mild mottle virus.
Plots for 6 bacteria rise and fall irregularly across the graph with the following general trends. Bacteroidaceae rises from 31% at 1 month to 41% at 36 months. Enterobacteriaceae falls from 25% at 1 month to 0% at 36 months. Lachnospiraceae rises from 5% at 1 month to 21% at 12 months, then falls to 15% at 36 months. Ruminococcaceae rises from 0% at 1 month to 19% at 36 months. Bifidobacteriacae falls from 15% at 1 month to 2% at 36 months. Clostridiaceae falls from 9% at 1 month to 0% at 36 months. All values estimated.
Lacto n tetraose. Galactose binds to n acetylglucosamine, which binds to galactose, which in turn binds to glucose.
Lacto n fucopentose 1. Fucose binds to galactose, which binds to n acetylglucosamine, which binds to galactose, which in turn binds to glucose.
Monosialyl lacto N neohexaose 1. N acetylneuraminic acid binds to galactose, which binds to N acetylglucosamine, which binds to galactose. Galactose then binds to glucose and to N acetylneuraminic, which in turn binds to galactose.
Short-chain fatty acids are responsible for the following aspects of intestinal health. Increased synthesis of tight junction proteins. Repression of glycolysis. Activates d-oxidation of fatty acids, reducing oxygen diffusion into the gut. Suppression of inflammation.
The graphs are as follows. The healthy subjects curve rises from (260, 0 percent) to a maximum at (630, 32 percent), then falls to (900, 0 percent). The I B D patients curve starts at (200, 7 percent) to a maximum at (450, 36 percent), then falls to (800, 0 percent), where it remains steady. All values approximated.
Part a. Lean mice have more bacteroidetes and firmicutes than methanogens. Food leads to fermentation, which produces H 2. High H 2 retards fermentation. Fermentation produces V F A’s and nutrients for host. Obese mice have more methanogens than bacteroidetes. Food leads to fermentation, which leads to H 2. Low H 2 promotes fermentation. H 2 produces C H 4. Fermentation produces V F A’s and nutrients for host. Part b. Microbiota from an obese twin to a recipient mouse with a low fat, high fiber diet leads to an obese mouse. Microbiota from a lean twin to a recipient mouse with a low fat, high fiber diet leads to a lean mouse.
During antibiotic treatment, loss of community bacterial diversity decreased, then increases after antibiotic treatment. During antibiotic treatment, antibiotic resistant C difficile has a growth advantage. After the antibiotic treatment, C difficile either persists, maintaining its highest level during antibiotic treatment, or it is displaced, decreasing to the level prior to treatment.
Intestinal Bacillus species inhibit colonization Staphylococcus aureus as follows. Signaling by A I P is blocked by fengycin binding to the ArgC sensor kinase. Blocking phosphorylation of the Arg A regulator inhibits its activation. Transcription of virulence genes required for colonization is repressed in the presence of fengycin. Pre A I P is converted to AIP by ArgB and exported out of the cell.
For no disease, overall intestinal bacteria only grows slightly from 1 month to 60 months, maintaining nearly the same distribution of Enterobacteriaceae, Bacillus s p p, Clostridium s p p, and Veillonellaceae. For necrotizing enterocolitis, overall bacteria shows increased growth over the same period, with significant overgrowth of Enterobacteriaceae.
Part a. Reduced exploration. A mouse subject does not explore his habitat. Part b. Reduced vocalization. One mouse does not vocalize as much as another mouse. Part c. Bar graphs compare center duration in seconds and the total number of calls for control, M I A offspring, and M I A offspring fed B fragilis. The data in the graphs are as follows. Center duration in seconds.
Part d. The structures of tyrosine and 4 ethylphenylsulfate are as follows. Tyrosine. H O is single bonded to a hexagonal ring with alternating single and double bonds, which is single bonded to an atom, which is single bonded to another atom, which is single bonded to N H 2 and to another atom, which is single bonded to O H and double bonded to O. After transformation by gut microbiota, 4 ethylphenylsulfate consists of O 3 S O single bonded to a hexagonal ring with alternating single and double bonds, which is single bonded to an atom, which has another single bond.
The events of the infection process are as follows.
Multiplication, Growth and Production of virulent factors or toxins
The events of the disease process is as follows. From the infection process, the disease process branches to toxicity or invasiveness. In toxicity, toxin effecs are local or systemic, while in invasiveness, there is further growth at original and distant sites. Both toxicity and invasiveness lead to tissue or systemic damage.
For the highly virulent organism, from 10 to the first power to 10 squared, the percentage of mice killed increases at a decreasing rate from 10 to 98 percent. For the moderately virulent organism, from 10 squared to 10 to the sixth power, the percentage of mice killed increases at a decreasing rate from 10 to 98 percent.
Final preparation of attenuated vaccine in fertilized chicken eggs.
Administration of vaccine to susceptible individual to elicit immune response without disease symptoms.
Injectisome, i n v and p r g products form complex
Flagellum, motility, H antigen, adherence, inhibits phagocyte killing
Cytotoxin, inhibits host cell protein synthesis, C a 2 + efflux from host cell, adherence
Part b. Coagulase and streptokinase are as follows.
Clot walls off pathogen, blocking access to immune system cells
Streptokinase dissolves clot, releasing pathogen to bloodstream and deeper tissues.
Normal ion movement, Na + from lumen to blood, no net C l, minus, movement.
Activation of epithelial adenylate cyclase by cholera toxin.
Elevated c A. M P blocks N a +, net anion movement to intestinal lumen.
Massive water movement to the lumen and ion loss trigger cholera symptoms.
In innate immunity, phagocytes are primary effector cells. The response with innate immunity is rapid, within several hours. Dendritic cells, neutrophils, and macrophages offer a general response to a broad range of pathogens. In adaptive immunity, lymphocytes are primary effector cells. B and T lymphocytes provide a focused attack on a specific pathogen. Antibodies, from plasma cells, and cytotoxic T cells help clear specific infection. Post exposure immunity by B and T memory cells is common. Response with adaptive immunity requires several days.
Removal of particles, including microorganisms by cilia in nasopharynx.
Skin, is a physical barrier and produces antimicrobial fatty acids and anti bacterial peptides. Normal microbiota inhabit infection.
Stomach acidity, p H 2, inhibits microbial growth.
Normal microbiota competes with pathogens in the gut and on the skin.
Lysozyme in tears and other secretions dissolves bacterial cell walls.
Mucus and cilia lining trachea suspend and move microorganisms out of the body.
Mucus, antibacterial peptides, and phagocytes in lungs prevent infection.
Blood and lymph proteins inhibit microbial growth.
Rapid p H change from stomach to intestine inhibits microbial growth.
Epithelial cells throughout the body have tight junctions that inhibit pathogen invasion and infection.
Part a. An anatomical diagram depicts the body’s blood vessels and lymphatic organs. The lymphatic organs include the Thymus, bone marrow, lymph nodes, the thoracic duct, The Mucosa associated lymphoid tissue, M A L T, and the spleen. Part b. Connections between the lymphatic and blood system. Blood circulates through the body from veins, to heart, to arteries, to capillaries, to veins again. Blood in the capillaries exchanges material with the lymph capillaries, which in turn cycle to lymphatic vessels, lymph nodes, the thoracic duct, and finally the left subclavian vein. Part c. Cells and fluids pass from blood capillaries to lymph capillaries through a network of fibers and fiber bundles. Part d. The major anatomical areas of the lymph node and the immune cells concentrated in the area are as follows
A hematopoietic stem cell is in red bone marrow. Hematopoietic stem cells include myeloid precursors and lymphoid precursors. With bone marrow maturation, the lymphoid precursor leads to a B cell, which in turn leads to a plasma cell. With thymus maturation, the lymphoid precursor leads to a natural killer cell and a T cell. The myeloid precursor leads to a monocyte, which leads to a dendritic cell and a macrophage. The myeloid precursor also leads to granulocytes, which lead to a neutrophil and a mast cell. Dendritic cells and macrophages are part of an antigen presentation and, along with neutrophil, are part of phagocytosis. The mast cell is part of an inflammatory response. The natural killer cell and the T cell are part of cell mediated immunity. The plasma cell is part of antibody immunity. Dendritic cells, macrophages, neutrophils, mast cells, and natural killer cells are part of innate immunity, while T cells, plasma cells, and B cells are part of adaptive immunity.
A, a razor blade cuts through the epidermis to the dermis, introducing bacteria. A cytokine and chemokine gradient is near the introduced bacteria. B, bacterium surrounds a capillary. Neutrophils squeeze between capillary endothelial cells out of the capillary into the surrounding tissue. C, the bacterium is gone from the tissue around the capillary.
Part a. A phagocyte has P R R 1 and P R R 2. Pathogens with P A M P’s are recognized by the P R R’s. Binding by phagocyte P R R activates the phagocyte to kill the pathogen. Part b. Spherical Staphylococcus aureus, M R S A, cells are on the surface of a neutrophil. The irregularly shaped neutrophil covers parts of the M R S A cells
An L P S fragment is bound by L B P and transferred the C D 14 on the surface of the phagocyte to trigger the T L R 4 receptor. This triggers a Kinase cascade that activates N F k B, which then crosses through the nuclear membrane and binds to the cell’s D N A.
Part a. Local infection leads to inflammation in a small part of the body, followed by healing. a woman has inflammation on her right arm. Part b. Systemic infection leads to inflammation and disease throughout the body. A woman has inflammation through her entire body.
Part a. A natural killer cell identifies a healthy cell with the M H C 1 recognition receptor. No reaction, cell is licensed. Part b. The natural killer cell’s stress protein receptor identifies a stress protein released by a diseased cell. The N K cell releases granules with perforin and granzymes into the cell, which leads to cell death by apoptosis.
Part a. Specificity. Immune cells have specific surface receptors that interact with individual antigens to produce an immune response. Part b. Memory. The first antigen exposure induces multiplication of antigen reactive cells, resulting in multiple copies, or clones. After a subsequent exposure to the same antigen, the immune response is faster and stronger due to the large number of responding cells. The responding cells create a collective immune response. Part c. A graph of immune responses. As a result of immune memory, antigen reexposure triggers a much stronger secondary response. A graph plots adaptive immune cells and antibodies over time in days. A curve starts at 0, the antigen exposure, rises to a local maximum, then falls to a local minimum at 100 days, antigen re exposure. The first 100 days is the primary response. The curve then rises to a maximum at approximately 115 days and then there is a slow decline in immune response. Starting at day 100 and moving after day 200 is the secondary response.
Pre T cells come from bone marrow. They migrate to the thymus where T cell receptors develop. T cells that interact with M H C peptide complexes in the thymus divide and grow. Those that do not interact stop growing and eventually die. T cells that interact very strongly with M H C self peptide die. Those that do not interact too strongly continue to proliferate. T cells that interact with foreign antigens leave the thymus and reenter the lymphatic circulation.
Natural immunity includes active and passive. 1, active. The immune system responds to an active infection such as measles. 2, passive. Antibodies are transferred from mother to infant in utero and in breast milk. Artificial immunity includes active and passive. 3, active. The immune system responds to antigens present in a vaccine. 4, passive. Venom from a rattlesnake can be neutralized by antibodies in rattlesnake antivenom.
1, an antigen reactive B cell uptakes and degrades a pathogen. 2, the B cell connects to a T h 2 cell via a chain that consists of M H C 2, a pathogen antigen, and T C R. the processed antigen is presented to the T h 2 cell. 3, cytokines from the T h 2 cell activate the B cell. 4, the B cell produces short lived plasma cells and long listed memory cells. 5, the plasma cell produces antibodies. 6, upon second exposure, a memory B cell produces many plasma cells and additional memory cells.
Immunoglobulin G consists of an F c region and an F a b region. The F c region consists of constant domains, C H 3, C H 2, C H 1, and C L. The C L constants connect to V L variables, while the C H 1 constant connect to V H variables. The variables bind to antigens. In a space filling model, a red and dark blue chain branches to a dark blue and green chain and a light blue and red chain.
A, I g G, I g A, and I g D structures have 2 constant chains that branch to another constant and a variable attached to an antigen. B, I g M and I g E structures have 3 constant chains that branch to another constant and a variable attached to an antigen. C, an I g M pentamer structure consists of 5 structures with 3 constant chains that branch to another constant and a variable, which is attached to an antigen. The structures are connected by a disulfide bond. 2 of the structures are connected by a J chain. D, an I g A dimer structure consists of 2 structures with 2 constant chains that branch to another constant and a variable attached to an antigen. The structures are connected by a J chain and are also connected by a secretory component.
The graph is a curve that starts at 0. The initial antigen contact at day 0 initiates a primary immune response. The curve rises with decreasing steepness. After several days, I g M antibody is produced at detectable but low titers. The curve then falls with increasing steepness. In the absence of an antigen, the titer decreases with time. The primary response ends after 100 days. The curve then rises after a secondary exposure. Another contact with the same antigen at day 100 initiates the secondary immune response. The curve reaches a maximum, mostly I g G. Antibody class switches rapidly to I g G, now produced in high titers. The curve then falls as it approaches day 200. In the absence of an antigen, the titer again decreases with time.
A, the structure consists of constant, C H 3, C H 2, C H 1, and C L, and variables as follows. C D R 1, C D R 2, and C D R 3, which consists of the variable, a D region, and a J region. The antigen is attached to the variables. B, an antigen is above a chain of V H, C D R 3, and a chain of V L, C D R 3. The antigen is surrounded on one side by 2 chains of V L, C D R 2, and 2 chains of V H, C D R 1.
Part a. Class 1, class 2, and class 3 genes on the H L A complex of the human chromosome. Part b. Schematic of M H C class 1 protein. Part c. Schematic of M H C class 2 protein. Part d. Ribbon structure model of M H C class 1 protein. Part e. Model of M H C 1 protein. Part f. Ribbon model structure of M H C 1 protein with bound peptide.
Part a. In polymorphism, a cell contains an H L A A 29 gene and an H L A A 2 gene, and H L A A 29 and H L A A 2 proteins. Part b. In polygeny, a cell has genes as follows. A, red. C, yellow. B, blue. A, pink. C, brown. B, orange. The proteins around the cell are as follows. A, A, C, C, B, B.
Part a. T c cell interacts with an M H C peptide and A P C. Part b. Activated T cell kills target cell by Release of perforin and granzymes causing Membrane damage, apoptosis, death. Part c. T c cell interacts with an M H C peptide, but not A P C, resulting in no activation. Part b. The non-activated, anergized, T c cell has no effector function.
The class 1 and class 2 M H C proteins consist of 4 domains each. In each protein, the top 2 domains attach to the antigen, while the bottom 2 domains are C domains. The T cell receptor consist of 2 base C domains and 2 V domains near the antigen. The immunoglobulin consists of a chain that branches to 2 antigen receptors. There are 6 C domains at the base of the chain, 2 in each of the branches, and 2 V domains at the ends of either branch, near the antigen receptors.
A, a pathogen bound by P R R is attached to a dendritic cell. 1, antigens from the phagocytosed pathogen are presented on M H C 2 to a T h cell. Pathogen interaction activates the dendritic cell to produce I L 6 and T G F beta cytokines. 2, I L 6 and T G F beta catalyze the T h cell differentiation to make T h 17 cells. 3, T h 17 cells produce I L 17, which activates numerous tissue cells to produce chemoattractants. 4, neutrophils attracted to the site of pathogen contact initiate inflammation. B, a dendritic cell is connected to a Treg cell. 1, a dendritic cell that is not activated by a pathogen can contact a T h cell through M H C 2, peptide, T C R interaction. The peptide is derived from a self protein. 2, the nonactivated dendritic cell does not produce stimulatory cytokines. Absence of I L 6 causes the potentially self reactive T h cell to differentiate to a Treg cell. 3, the Treg cell produces T G F beta and I L 10, cytokines that suppress inflammation and other immune cells.
2. Allergen processed and presented to T h 2 cell.
6. I g E sensitizes tissue mast cells by binding to surface I g E receptors.
9. Release of allergic mediators, such as histamines, serotonin, etcetera.
Immunizations against bacteria Immunizations against viruses
Haemophilus Influenzae Type B, H I b Hepatitis A virus
Meningococcal, Neisseria meningitidis Hepatitis B virus
Pneumococcal, Streptococcus pneumoniae Human papillomavirus, H P V
Tetanus, diphtheria, pertussis, D T a P, T dap Influenza virus
Pneumococcal polysaccharide linked to diphtheria toxoid binds to a B cell with an anti polysaccharide antibody.
The conjugate antigen is taken in and digested by the B cell.
Polysaccharides cannot be presented to T h 2 cells by B cells. Peptides from the toxoid, however, are efficiently presented by B cells to the T h 2 cells.
Interaction with the toxoid peptide presented by the B cell activates the T h 2 cell.
The activated T h 2 cell makes cytokines that drive the B cell to make plasma cells.
Plasma cells make antibodies to pneumococcal polysaccharide. The antibodies bind to the capsule and neutralize or opsonize the pathogen.
From a patient, either dendrite cells are extracted, or a tumor tissue biopsy is performed.
The dendrites are used to generate anticancer vaccines.
The tissue biopsy is either used to generate anticancer vaccines, used to create a tumour biomarker for omics analysis, or used to isolate T I L’s.
The biomarkers are used for tumor-specific neoantigen identification. The neoantigens are then used for, C A R T cell therapy as monoclonal antibodies
The isolated T I L’s are used in an adoptive T cell transfer, T I L therapy, or C A R T cell therapy.
Cell wall synthesis. Cycloserine, Vancomycin, Bacitracin, Penicillins, Cephalosporins, Monobactams, Carbapenems
Cytoplasmic membrane structure and function. Polymyxins, Daptomycin
D N A gyrase. Quinolones such as Nalidixic acid and ciprofloxacin. Novobiocin.
D N A directed R N A polymerase. Rifampin, Streptovaricins.
Protein Synthesis, 50 S inhibitors. Erythromycin, macrolides, Chloramphenicol, Clindamycin, Lincomycin
Protein Synthesis, 530 S inhibitors. Tetracyclines, Spectinomycin, Streptomycin, Gentamicin, Kanamycin, Amikacin, Nitrofurans
A natural penicillin, penicillin G, has gram positive activity, is beta lactamase and acid sensitive. The N acyl group is a hexagonal ring of alternating single and double bonds, single bonded to a C H 2 atom, single bonded to a C O atom. Outside the N acyl group, the C O atom is single bonded to an H N atom, which is connected by a wedge to an H atom. The H atom is on a beta lactam ring, which consists of the H atom, another H atom, an N atom, and an O atom, which is double bonded. A red arrow indicates between the O and the N atoms. The second H and the N atoms are connected to a thiazolidine ring, which consists of the H atom, an S atom, a C H 3 atom, a C O O H atom, and the N atom. The ring is connected by wedges to a C H 3 atom near the first C H 3 atom and to an H atom by the C O O H atom. The table is as follows.
N acyl group modification Semisynthetic penicillins
A hexagonal ring of alternating single and double bonds is single bonded to an O C H 3 atom, to a C O atom, and to an O C H 3 atom. Methicillin, acid stable, beta lactamase resistant.
A hexagonal ring of alternating single and double bonds is single bonded to a C O atom. The bond between the ring and the C O atom contains a double bond to an N atom, which is single bonded to an O atom, which is single bonded to a double bond with the bond between the ring and the C O atom. The bond intersection is also single bonded to a C H 3 atom. Oxacillin, acid stable, beta lactamase resistant.
A hexagonal ring of alternating single and double bonds is single bonded to a C H atom, which is single bonded to a C O atom. The C H atom is single bonded to an N H 2 atom. Ampicillin, broadened spectrum of activity, especially against gram negative Bacteria, acid stable, beta lactamase sensitive.
A hexagonal ring of alternating single and double bonds is single bonded to a C H atom, which is single bonded to a C O atom. The C H atom is single bonded to a C O O H atom. Carbenicillin, broadened spectrum of activity, especially against Pseudomonas aeruginosa, acid stable but ineffective orally, beta lactamase sensitive.
A cell contains a nucleus, partly surrounded by endoplasmic reticulum, with mitochondria, ribosomes surrounding the nucleus and a Golgi complex near the nucleus. The antifungal agents are as follows.
Membrane functions Polyenes bind to ergosterol and disrupt membrane integrity.
Ergosterol synthesis Azoles and allylamines inhibit synthesis.
Microtubule formation Griseofulvin disrupts microtubule aggregation during mitosis.
Cell wall synthesis Polyoxins inhibit chitin synthesis. Echinocandins inhibit glucan synthesis
Nucleic acid synthesis 5 Fluorocytosine is a nucleotide analog that inhibits nucleic acid synthesis.
In the graph, penicillin is recommended from 1975 to 1989. Ciprofloxacin is recommended from 1989 to 2002. Ceftriaxone is recommended from 2002 to 2014. Ceftriaxone + azithromycin is recommended starting in 2014. The penicillin curve starts at (1975, 0), rises with increasing steepness through (1988, 5), rises with decreasing steepness through a maximum at (1996, 10.5), then falls to (2015, 7.5). The ciprofloxacin curve starts at (1989, 0), rises with increasing steepness through (1999, 4) and then rises with decreasing steepness through (2015, 8.25). The ceftriaxone curve starts at (2002, 0), and rises to (2015, 4). The ceftriaxone + azithromycin curve starts at (2005, 0) and rises to (2015, 0.25).
Part b. In the saquinavir structure, the highlighted region is O double bound to a carbon, which is single bound to H N, single bound to a carbon, single bound to a carbon, single bound to N and double bound to O. In the indinavir structure, the highlighted region is O double bound to a carbon, single bound to H N.
The flowchart starts with a patient suspected to have an infectious disease. One path, immunological assays, uses a blood sample to search for antibodies or antigens using agglutination, immunofluorescence, enzyme immunoassay, E I A, and so on, to detect an antibody against a suspected pathogen. In another path, other essays, samples taken include blood, feces, urine, tissue biopsy, mucosal swab. This path leads to growth dependent microbiology and molecular biology or immunology. In growth dependent microbiology, enrichment, the use of selective or differential media, leads to isolation, pure culture, which leads to identification, use of growth dependent, biochemical, immunological, or molecular assays. Molecular biology or immunology leads to two paths, antigen assays, to search for microbial or virus antigens using fluorescent antibody, E I A, and so on, and molecular assays, to search for pathogen genes by gene amplification.
Part a. Burkholderia colonies are round, with distinct, lighter centers. The colonies are arranged together, side by side. Part b. Francisella tularensis colonies are round, and have distinct globs. Part c. Escherichia coli and Pseudomonas aeruginosa are side by side on agar. The colonies form zig zags. The E coli colony has a shiny, yellow appearance, while the P aeruginosa colony has a dull blue color.
Part a. Tubes contain liquid that changes in color over time from yellow to red. In one of the tubes, a bubble indicates gas production. Part b. Organisms ferment in tubes. In one tube, space at the bottom of the tube indicates gas production. Part c. Miniaturized media kit strips include labeled tubes of different colors.
Part a. A microtiter plate contains 12 rows of 7 wells. There is growth in all wells except for the wells to the left in rows 1, 2, 4, 9, 10, and 11. There is growth in all wells for row 3. Part b. A machine has a screen and a slot. Part c. Cards are attached to tubes. Cells in the cards have different colors. Part d. A person uses a tool to mix colonies on a disc. Part e. A swab collects bacteria from a tube. Part f. The swab is run over an agar disc. Part g. A strip is placed on agar. There are two spherical discs on the agar. The agar near the strip is red.
Urine has no bacteria for the first week, then low numbers of bacteria at the first week halfway through the second week. Urine has no bacteria for the remaining weeks. Feces has no bacteria for the first part of the first week, then low numbers of bacteria at the end of the first week, then high numbers of bacteria from the first week to the end of the third week. Feces has low numbers of bacteria for the first part of the third week, and then no bacteria for the remaining weeks. Blood has high numbers of bacteria for the first week, low numbers of bacteria into the second week, and then no bacteria for the remaining weeks. In the graph, the last 2 thirds of week 0 and the first two thirds of week 1 constitute acute infection. Then, the last third of week 1 into the first third of week 3 constitute convalescence. The body temperature curve starts at 37 degrees at week 0, then rises to 40 degrees halfway through the week. Temperature remains steady at 40 degrees until a third of the way through week 1. Then, the curve falls to 38 degrees 2 thirds through week 2, and then to 37 at the end of week 2. The curve remains steady at 37 degrees for the remaining weeks. The antibody titer curve starts at 2 at the start of week 0, then rises to a maximum at 2048 at the end of week 2, then falls to 32 at the end of week 5.
A mouse is injected with an antigen. Isolate antibody producing B cells from the mouse spleen, and then fuse with myeloma cells to make hybridomas. Grow cells with in vitro culture system, clone individual hybridomas in microtiter wells. Perpetuate clone. The hybridoma cells are cultured, leading to monoclonal antibodies. A mouse is injected with a hybridoma tumor, creating monoclonal antibodies.
The graph’s curve is bell shaped and divided into three sections, the zone of antibody excess, equivalence, and the zone of antigen excess. In antibody excess, antibodies outnumber antigens. In equivalence, where the curve reaches its maximum, antibodies and antigens are equal. In the zone of antigen excess, there are more antigens than antibodies. In an inset photo, 4 wells are labeled A, B, C, and S. A band forms between wells A, B, and C, and well S.
Part a. The reaction with type O is smooth, without clumps. The reaction with type B creates round globs in the center and along the outside edges of the sample. The reaction with type A creates denser clumps in the center of the sample. Part b. The table is as follows.
Blood type Percentage of U S population Serum, Anti A. Serum, Anti B.
The flow chart begins with a bacterial cell surrounded by antigens. The cell leads to direct immunofluorescence, with a fluorescently labeled antibacterial antibody, and indirect immunofluorescence, with an unlabeled antibacterial antibody made in a rabbit. With direct immunofluorescence, detection is due to the labeled antibacterial antibody. The antibodies are covered with fluorescent material. With indirect immunofluorescence, fluorescently labeled anti rabbit antibodies are added to the unlabeled antibacterial antibody. Detection is due to the labeled secondary antibody binding the antibacterial primary antibody.
In the chart, black antibodies and antigens are supplied as part of assay kit. Colored antibodies and antigens are from the patient sample. Two E’s connected by a cross represent an enzyme conjugated to antibody or antigen. A yellow circle indicates color development due to enzyme activity. The immunoassay types are as follows.
A, direct. From a solid phase support, black antibodies are connected to antigens from a patient sample, which are in turn connected to black antibodies. Enzymes are conjugated to the black antibodies, and there is color development due to enzyme activity. A graph plots color versus antibody. The graph is a line that rises.
B, indirect. Antigens are on a solid phase support. Antibodies from a patient sample are connected to the antigens, and black antibodies are connected to the patient sample antibodies. There are enzymes conjugated to the black antibodies, and color development due to enzyme activity. A graph plots color versus antibody. The graph is a line that rises.
C, sandwich. Antigens are on a solid phase support, connected to antibodies from a patient sample, which are further connected to another antigen. Enzymes are conjugated to the antigens and there is color development due to enzyme activity. A graph plots color versus antibody. The graph is a line that rises.
D, combination. A black antigen and a black antibody are on the solid phase support. The antigen is connected to an antibody from a patient sample, which is connected to another black antigen. The black antibody is connected to antigens from a patient sample, which are connected to a black antibody. Enzymes conjugate to the black antigen and the black antibody, and there is color development due to enzyme activity. A graph plots color versus antigen and antibody. The graph is a line that rises.
Part a. A sample well contains a patient specimen. Time progresses and a labeled antibody pool contains an antibody attached to a chromophore. Time progresses again and a test line forms, where antibodies are attached to antigens and to a chromophore. Time progresses again and a control line forms, including two antibodies attached to a chromophore.
Treat membrane containing separated H I V proteins with patient serum. H I V positive antibodies bind to membrane.
Add a secondary antibody conjugated to enzyme to bind to antigen antibody complexes.
Expose to enzyme substrate to reveal antibody labeled protein. Membrane shows only antibody labeled bands.
Part b. A sample immunoblot contains 5 lanes. Vertical bands along lanes 1, 3, and 4 correspond to p 24 and g p 41. The bands for lane 3 are darker than the bands for lane 4. There is no banding in lanes 2 and 5.
Lyse cells and generate single stranded target D N A
Add a reporter labeled probe, allow for reannealing to target
Measure hybridization directly if reporter is radioactive or fluorescent. Add enzyme substrate if reporter is enzyme.
Detection is completed by a radioactivity detector, a fluorimeter, or a colorimeter and visual inspection.
Lyse and denature sample in N a O H. A reporter probe includes a region complementary to target D N A and a capture probe.
Hybridize sample D N A to probes in solution. Nucleases destroy unhybridized probe. The reporter probe and the target D N A are hybridized.
Capture with dipstick. A swab is inserted into a solution.
Part a. The graph of relative fluorescence intensity versus amplification cycles is two curves, A and B. The curve for A starts at (0, 0), rises with increasing steepness through (15, 0.15), and then rises with decreasing steepness through (30, 0.28) and (40, 0.28). The curve for B starts at (0, 0), rises with increasing steepness through (23, 0.15), and then rises with decreasing steepness through (30, 0.27) and (40, 0.28). All values approximated.
A curve rises from a minimum to a local maximum at a temperature of 54 degrees. This is the H S V 1 standard. The curve falls to a local minimum at a temperature of 62 degrees, then rises to a maximum at 68 degrees, the H S V 2 standard. The graph falls again to a minimum. A patient sample curve starts at a minimum, then rises to a maximum at 68 degrees, under the H S V 2 standard. The curve then falls again to a minimum.
Tuesday. New cases, 100. Existing cases, 50. Uninfected, 850.
Wednesday. New cases, 150. This is the incidence. Existing cases, 150. Uninfected, 700.
Thursday. New cases, 150. Existing cases, 300. The new cases plus the existing cases is the prevalence. Uninfected, 550.
Friday. New cases, 200. Existing cases, 450. Uninfected, 350.
The incidence in the whole 5 day period is 650 per 1000 persons per 5 days. The prevalence on Tuesday is 150 cases per 1000 persons, 15 percent infected. The prevalence on Friday is 650 cases per 1000 persons, 65 percent infected.
Part a. Endemic disease is scattered throughout North and South America, with more cases or outbreaks in North American than in South America. Part b. Epidemic diseases are also scattered throughout North and South America, in the same places as endemic disease. However, there are clumps of additional diseases in central North America, near the Great Lakes, and in the northeast coast of the United States. Another clump if cases or outbreaks is in southeastern South America, a clump on the eastern coast of Brazil. Part c. Outbreaks of pandemic disease nearly covers both North and South America, apart from patches in central North America, the eastern coast of North America, the northern part of North America, Central America, and patches in central, northwestern, and northeastern South America.
The curve for rabbit mortality starts at 95 percent at year zero, falls to 87 percent at year 1.5, then falls with an increasing slope to 30 percent at year 6. The curve for virus virulence starts at 100 percent at year zero, falls with an increasing slope to 85 percent at year 2.5, then falls with a decreasing slope to 81 percent at year 6. All values approximated.
In A, no immunity, an infected person spreads disease to four susceptible people. The susceptible people each transmit the disease to other susceptible people. In b, an infected person is surrounded by 5 people. 4 of the people are immune and disease transmission is blocked. The fifth person, A, is susceptible and the disease is transmitted. There are two other immune people between the infected person and two susceptible people, B and C. The disease does not transmit to the susceptible people.
A mosquito bites human skin. The La Crosse encephalitis virus is a cluster of spherical cells. In a graph of cases over time, there are spikes in late summer months, of 47 cases in 2000, 40 cases in 2001, 48 cases in 2002, and 43 cases in 2003, with declines to 0 in winter and early spring months.
In the graph, the onset of the epidemic is at day 0. The curve for the common source epidemic, for example, cholera, rises to a maximum at day 1 then falls with decreasing steepness to 0 at day 5.5. The curve for the host to host epidemic, for example, influenza, rises with increasing steepness to a maximum at 7.5 days, then falls to half its maximum at 12 days. All values approximated.
The curve starts at 3,000 in 1885, and rises to a maximum at just under 10,000 cases in 1906. With filtration, the curve decreases to 1,100 in 1913. With chlorination in 1913, the curve decreases again to 150 in 1940. All values approximated.
The curve starts at 325 in 1950, rises to 680 in 1952, falls to 450 in 1953, rises to 680 in 1954, falls to 550 in 1955, rises to 620 in 1957, falls to 490 in 1956, then rises to a maximum at 760 in 1957, falls to 400 in 1958, rises to 450 in 1960, falls to 425 in 1962, rises to 500 in 1962, falls to 390 in 1963, when the vaccine is licensed. The curve rises to 475 in 1964, then falls to 250 in 1965, and falls again to 25 in 1967. Between 1967 and 1980, the curve stays between 10 and 80. Then, after 1980, the curve is constant at 0. All values approximated.
The total death in Africa and the Americas are broken up as follows. Africa, total population in 2008, 837 million. 14.1 million deaths, 16.8 per 1000 people.
Americas, total population of north, central, and south America in 2008, 924 million. 5.6 million deaths, 6.1 per 1000 people.
A world map details recent disease outbreaks by region and year as follows. North America.
1987, 30,000. Introduction of the first anti H I V drug, A Z T.
1992, 79,000. Introduction of the anti H I V drug cocktails.
1995, 64,000. Introduction of Saquinavir and H A A R T.
AIDS cases are broken up by gender and risk group as follows. Males.
Men who have sex with men and injection drug use, 4%
A timeline maps global cholera pandemics as follows.
2 Classic, India 1828 to 1849 Europe, North America, Latin America.
3 Classic, India 1850 to 1958 Asia, Europe, North America, Africa
4 Classic, India 1860 to 1877 Middle East, Europe, Africa, North America
5 Classic, India 1880 to 1896 Asia, Africa, South America, Europe, Japan
6 Classic, India 1897 to 1925 India, Middle East, Africa, Europe
7 El Tor, indonesia 1961 to present Asia, Middle East, Italy, South America in 1999, Haiti in 2010.
8, potentially O 1 3 9, Bangladesh 1991 to present Unknown.
A world map reports the number of confirmed cases of H 1 N 1, 2009 influenza, by country as follows. Greater than 50000.
Part a. Bacillus anthracis cells are tube shaped. Light colored endospores develop on one end of some of the cells, or in the center of other cells. Part b. B anthracis colonies have solid round centers surrounded by rings that are rougher, and more irregular. Part c. A person’s arm has a legion extending from near the elbow to the wrist. The legion is widest in its center, and tapers at either end. The skin in the center of the legion is black. Part d. The outside of a human brain is dark in color. The inside of the brain, visible through a split, has a lighter color.
The particle penetration, body region and airborne pathogen is as follows.
Penetrable particle in micrometers Body region Airborne pathogen
over 60 Upper respiratory tract, Nasal cavity Staphylococcus aureus
over 60 Upper respiratory tract, Oral cavity, Pharynx Neisseria meningitidis, Streptococcus pyogenes, Corynebacterium diphtheriae
45 Lower respiratory tract, Larynx Haemophilus influenzae, Common cold virus
40 Lower respiratory tract, Trachea Mycoplasma pneumoniae
30 Lower respiratory tract, Primary bronchus Influenza virus
10 Lower respiratory tract, Secondary bronchus Mycobacterium tuberculosis
8 Lower respiratory tract, Respiratory bronchiole Coccidioides immitis, Bordetella pertussis
6 Lower respiratory tract, Terminal bronchus Streptococcus pneumoniae, Pneumonia viruses
below 3 Lower respiratory tract, Alveolar sacs Coxiella burnetii
below 3 Lower respiratory tract, Alveoli Chlamydophila pneumoniae
The graph rises from 1 in 1982 to a local maximum at 9 in 2004, then falls to 4 in 2007, then rises to a maximum at 15.5 in 2012. All values approximated.
Part a. A sputum sample contains orange tube shapes, which are mycobacterium tuberculosis cells. Part b. A normal chest x ray. The lungs are dark in color. There are faint lighter lines spreading up and down on either lung. Part c. In an x ray with pulmonary tuberculosis, there are white patches in the lung areas. The patches in these areas are more pronounced than in the normal chest x ray.
The center of the influenza virus consists of strands of R N A, N P, P A, P B 1, and P B 2. The virus consists of two outer layers. The inner layer is M protein while the outer layer is lipid bilayer. Spikes on the outside of virus are H A trimer and N A tetramer.
Part a. Antigenic drift. In year 1, a major strain of influenza virus contains X capsid antigens. The year 1 vaccine contains anti X antibodies. Vaccine efficacy for year 1 is good. In year 2, the influenza virus contains X and Y antigens. The year 2 vaccine contains anti X and anti Y antibodies. Vaccine efficacy for year 2 is fair with the year 1 vaccine and good with the year 2 vaccine. In year 3, the influenza virus contains Y and Z antigens. The year 3 vaccine contains anti Y and anti Z antibodies. Vaccine efficacy for year 3 is none for the year 1 vaccine, fair for the year 2 vaccine, and good for the year 3 vaccine. Part b. In antigenic shift, a bird contains bird influenza virus. A human contains human influenza virus. A pig is infected with bird virus and with human virus. In the pic, reassortment of human and bird viruses forms a highly virulent reassortant virus. A human is infected with the reassortant influenza virus.
In the global map, China is the country of origin. From china, the disease spreads west to southwest Asia and southwest, then north to Europe. The spread of the disease creates countrywide epidemic in southern Asia, Australia, and New Zealand. From China and southeastern Asia, the disease spreads to western North America, creating countrywide epidemic in the United States. From the western United States, the disease spreads south to western South America, creating countrywide epidemic in countries on the western coast of South America. From South America, the disease spreads north and then northeast to Europe. There are countrywide epidemics in southern Europe, eastern Africa, and southern Asia. There are localized outbreaks in Russia, Alaska, the Pacific Ocean, Canada along the U S border, Mexico, Brazil, the Caribbean, in northwestern Africa, and in patches throughout Europe.
In the boil, leucocidin and other bacterial enzymes lead to pus formation. Coagulase production by S aureus leads to fibrin formation, and fibrin walls off infection. Fibrin forms a coat between the pus and the surrounding skin. Escaping pus contains dead host cells and bacteria.
Part a. M S A has samples of staphylococcus epidermidis and staphylococcus aureus. The samples resemble curves. The red S epidermidis sample is a darker red than the M S A and the S aureus sample is yellow, and stands out from the M S A. Part b. An M S A has a sample that is primarily yellow, indicating the presence of S aureus.
The curve for hepatitis A starts at 16 in 1975, decreases to 8 in 1983, rises to a spike at 13 in 1989, decreases to 8 in 1992, rises to 12 in 1995, then, with the H A V vaccine in 1995, decreases to 1 in 2015. The curve for hepatitis B starts at 6 in 1975, rises to a maximum at 11 in 1984, then falls to 2 in 2015. The H B V vaccine was introduced in 1982. The hepatitis C curve starts at 2 in 1982, rises to a maximum of 2.5 in 1992, then falls to 1 in 2015. All values approximated.
The curve for syphilis starts at 150 in 1920 and rises to a maximum of 450 in 1943, during World War 2. With penicillin in 1944, the curve drops over time to 20 in 1975 to 2010. The curve for gonorrhea starts at 175 in 1920, falls to 110 in 1933, then rises to a local maximum of 275 in 1947. The curve falls to 115 in 1957 then begins rising in 1964, with the introduction of birth control pills, to a maximum of 455 in 1976. The curve then falls to 140 in 2000 and remains there to 2010. All values approximated.
A target cell has a nucleus and C C R 5 and C D 4 receptors. An H I V is lined on the outside with g p 120 and g p 41 proteins. The steps of infection are as follows.
1, H I V g p 120 and g p 41 protein binds to the C D 4 receptor and the C C R 5 receptor.
2, interaction of the virus with a receptor co receptor pair on the host cell. The H I V contains a nucleocapsid. The H I V’s proteins are attached to the receptors on the host cell’s membrane.
3, the viral envelope and host membrane coalesce. The bottom of the H I V merges with the membrane of the host cell.
4, the H I V’s nucleocapsid is inserted into the host cell, beginning the viral infection. The nucleocapsid is below the host cell’s membrane.
The curve for T cells per cubic millimeter of blood is as follows.
0 75, 78, and 81 months after infection, when death occurs.
The curve for H I V R N A copies starts at 0, rises to 10 to the sixth power 2 months after infection, falls to 10 to the fourth power 3 months after infection, rises to 10 to the fifth power 5 months after infection, falls to 10 to the fourth power 6 months after infection, then steadily rises to 10 to the sixth power 81 months after infection, when death occurs.
Part a. Candida albicans pathogens are in string clumps. Part b. Cryptococcus neoformans are spherical pathogens in lung tissue. Part c. Histoplasma capsulatum are spherical cells on the ends of several thin branches. Part d. Pneumocystis jirovecii are spherical pathogens. Part e. Cryptosporidium are globular pathogens clumped together. Part f. Toxoplasma gondii pathogens are clustered together in a spherical clump. Part g. Mycobacterium pathogens are clustered in a band.
Part a. In a chain reaction, a sample containing H I V leads to R N A genome of H I V via Lyse H I V, the R N A genome leads to a D N A copy of the H I V genome via reverse transcription, and the D N A copy of the genome leads to multiple D N A copies of the HIV genome via P C R. Part b. A graph plots R N A copies per milliliter and C D 4 cells per cubic millimeter over time for a poor prognosis and a good prognosis.
In the poor prognosis graph, C D 4 falls from 850 cells at month 0 to 200 cells in month 2, the curve then rises to 400 cells in month 5, then falls to 0 in year 2 from infection. The R N A curve rises to 10 cubed in month 0, rises to a maximum at 10 to the eighth power after 2 months of the infection. The curve then falls to 10 to the sixth power after 6 months and remains at 10 to the sixth power. Death occurs at 2 years.
In the good prognosis graph, C D 4 starts at 1000 at the beginning of the infection, falls to 800 2 months after the infection, rises to 850 5 months after the infection, then falls to 650 10 years after the infection. The R N A curve starts at 10 at the beginning of the infection, rises to a maximum of 10 to the seventh power 2 months after the infection, falls to just above 10 squared 6 months after the infection, then rises to just under 10 to the fourth power 10 years after the infection. All values approximated.
Part a. The curve for domestic rabies cases starts at 1,000 in 1982 and falls to 500 in 2012. The curve for wild rabies cases starts at 6,000 in 1982, falls to a minimum of 4,250 un 1987, rises to a maximum of 9,100 cases in 1993. The curve then falls o 5,500 in 2012. The total curve starts at 6,750 in 1982, falls to a minimum of 5,000 in 1987, then rises to a maximum of 10,000 in 1993. The curve then falls to a minimum of 6,100 in 2012. All values approximated. Part b. The skunk’s vector is a column that covers the central part of the United States, as well as a smaller area in northern California. The raccoon’s vector covers the eastern part of the United States. The fox’s vector covers the southwestern part of the United States, in parts of Arizona, New Mexico, and Texas, as well as southwestern and northwestern Alaska. The mongoose’s vector covers Puerto Rico.
By state, the data in the map are as follows. Zero cases per million people.
Nevada, Kansas, South Dakota, West Virginia, Vermont, Massachusetts, Connecticut.
Washington, Oregon, California, Utah, Colorado, New Mexico, Texas, North Dakota, Louisiana, Florida, Wisconsin, Minnesota, Michigan, Ohio, Pennsylvania, New Hampshire, Kentucky.
Montana, Idaho, Wyoming, Arizona, Nebraska, Iowa, Illinois, Indiana, New York, Virginia, Maryland, New York, New Jersey, Rhode Island, Maine, Mississippi, Alabama, Georgia, South Carolina.
Oklahoma, Missouri, Arkansas, Tennessee, North Carolina, Delaware.
Lyme disease is concentrated in states as follows. Minnesota, Wisconsin, northern Illinois, northern Virginia, Maryland, Delaware, Pennsylvania, New Jersey, New York, Connecticut, Massachusetts, Rhode Island, Vermont, New Hampshire, and southern Maine.
0.01 to 0.24. Oregon, Washington, Wisconsin, Florida, Alabama, Georgia, South Carolina, North Carolina, Tennessee, Kentucky, Virginia, West Virginia, Maryland, Delaware, Pennsylvania, New Jersey, New York, Massachusetts, Connecticut, Rhode Island, Vermont, New Hampshire, Maine.
0.25 to 0.49. California, Nevada, Utah, Arkansas, Missouri, Iowa, Minnesota, Indiana, Ohio.
0.50 to 0.74. Texas, Oklahoma, Kansas, Illinois, Michigan.
0.75 to 0.99. Montana, Idaho, New Mexico, Arizona.
Greater than 1.00. Louisiana, Mississippi, Colorado, Wyoming, Nebraska, South Dakota, North Dakota.
The plague cycle is as follows. 1, an infected rodent infects a flea, and the infected flea infects a rodent, creating a cycle of sylvatic plague in wild rodents, which is fatal and nonfatal. 2, the infected flea infects a rat. Sylvatic plague in rats is fatal, and the infected rat dies. The flea, infected from rat or wild rodent reservoir, infects a human with bubonic plague. Y pestis infecting the bloodstream leads to septicemic plague. Airborne transmission leads to pneumonic plague. These are fatal forms of human plague.
1. Ingestion of V. cholerae and colonization of small intestine.
Two micrographs show Vibrio cholerae associated with the freshwater alga Volvox (red) in cholera-endemic area and Vibrio cholerae by scanning electron microscopy.
2. V.cholerae isolated and identified by microscopy in stained preparation.
3. Patient restricted to cholera cot receives rehydration therapy. The cot has a hole cut in it with a bucket underneath.
Part a. Cryptococcus neoformans. The fungi appear as concentric spheres grouped together. Part b. Trichophyton s p p mycelia and conidia. The fungi appear as branches off of central limb. Part c. Candida albicans. The fungi appear as green fluorescent spheres grouped together in clumps. Part d. Sporothrix schenckii mycelia and conidia. The fungi appear as spherical globs bunched together on the end of branches. Part e. Histoplasma capsulatum mycelia and large conidia. The fungi appear as spherical globs on the end of branches. Part f. Coccidioides immitis conidia. The fungi appear as strings of spherical globs.
Part a. Histoplasma are spherical cells in tissue. Part b. Part of an arm is covered with an irregularly shaped bump. Part c. There are several spherical cells in lung tissue. Part d. Several cells are clumped together in lung tissue. Part e. A face is covered with discolored sores, particularly around the mouth. Part f. Yellow globs are attached to the back of the throat.
The life cycle of plasmodium in a human is as follows.
Transmission by bite of mosquito. Sporozoites removed from blood by liver.
Exoerythrocytic stage, Formation of schizont and merozoites in the liver.
Erythrocytic stage, merozoites infect and reproduce in red blood cells. Symptoms of malaria occur in this stage.
The life cycle of plasmodium in a mosquito is as follows.
Part a. Schistosoma mansoni is an elongated worm. Part b. An s mansoni egg is spherical with a spike. Part c. Cercaria is elongated with a head and a two pronged tail. Part d. Five infection sites on the arm resemble five discolored blemishes of approximately the same size.
The defined culture medium for Escherichia coli is as follows.
Trace elements, F e, C o, M n, Z n, C u, N i, M o, 2 to 10 micrograms each
The defined culture medium for Leuconostoc mesenteroides is as follows.
Amino acids, alanine, arginine, asparagine, aspartate, cysteine, glutamate, glutamine, glycine, histidine, isoleucine, leucine, lysine, methionine, phenylalanine, proline, serine, threonine, tryptophan, tyrosine, valine, 100 to 200 micrograms of each
Purines and pyrimidines, adenine, guanine, uracil, xanthine, 10 milligrams of each
Vitamins, biotin, folate, nicotinic acid, pyridoxal, pyridoxamine, pyridoxine, riboflavin, thiamine, pantothenate, p aminobenzoic acid, 0.01 to 1 milligrams of each
Trace elements, as in first column, 2 to 10 micrograms each
The Complex culture medium for either E. coli or L. mesenteroides is as follows.
The Defined culture medium for Thiobacillus thioparus is as follows.
Trace elements, as in first column, 2 to 10 micrograms each
Compatible solutes of microorganisms are described as follows.
Organism group and example Major cytoplasmic compatible solutes Minimum a sub w for growth Solute
Most nonphototrophic Bacteria, Escherichia, and freshwater cyanobacteria, Anabaena Amino acids, mainly glutamate or prolinea, or sucrose, trehalose 0.98 Sucrose
Marine cyanobacteria, Synechococcus alpha Glucosylglycerol 0.92 blank
Marine algae, Phaeocystis Mannitol, various glycosides, dimethylsulfoniopropionate 0.92 Dimethylsulfoniopropionate
Halotolerant Bacteria, Staphylococcus Amino acids 0.90 blank
Salt lake cyanobacteria, Aphanothece Glycine betaine 0.75 Glycine betaine
Halophilic phototrophic purple Bacteria, Halorhodospira Glycine betaine, ectoine, trehalose 0.75 Ectoine
Extremely halophilic Archaea, Halobacterium, and some Bacteria, Salinibacter K C l 0.75 Ectoine
Halophilic green algae, Dunaliella Glycerol 0.75 Ectoine
Haloalkaliphilic Archaea, Natrinema K C l 0.68 blank
Xerophilic and osmophilic yeasts, Zygosaccharomyces Glycerol 0.62 Glycerol
Xerophilic filamentous fungi, Xeromyces Glycerol 0.605 blank
Domain Bacteria Bacterial cells, r R N A. gene sequences typical of Bacteria Microscopy, 16 S r R N A. gene sequence analysis, presence of unique biomarkers, for example, peptidoglycan
Phylum Proteobacteria r R N A. gene sequence typical of Proteobacteria 16 S r R N A. gene sequence analysis
Class Gammaproteobacteria Gram negative bacteria, r R N A. sequence typical of Gammaproteobacteria Gram staining, microscopy
Order Chromatiales Phototrophic purple bacteria Characteristic pigments, Figures 14.2, 14.3, and 14.9
Family Chromatiaceae Purple sulfur bacteria Ability to oxidize H2S and store S0 within cells, microscopic observation of S0, see photo, 16 S r R N A. gene sequence
Genus Allochromatium Rod shaped purple sulfur bacteria, less than 95% 16 S r R N A. gene sequence identity with other genera Microscopy, see photo
Species warmingii Cells 3.5 to 4.0 micrometers by 5 to 11 micrometers, storage of sulfur mainly in poles of cell, see photo, less than 97% 16 S r R N A. gene sequence identity with other species Cell size measured microscopically with a micrometer, observation of polar position of S0 globules in cells, see photo, 16 S r R N A. gene sequence
Mode of action Antibiotic class Examples Representative structures
Inhibit cell wall synthesis beta lactams Penicillins, cephalosporins Ceftriaxone
Inhibit cell wall synthesis Isoniazids Isoniazid Isoniazid
Inhibit cell wall synthesis Polypeptide antibiotics Vancomycin, bacitracin Vancomycin, see Figure 28.34
Inhibit protein synthesis Aminoglycosides Streptomycin, kanamycin, gentamicin Kanamycin
Inhibit protein synthesis Tetracyclines Tetracycline doxycycline Tetracycline,
Inhibit protein synthesis Macrolides Erythromycin, azithromycin Erythromycin
Inhibit protein synthesis Chloramphenicol Chloramphenicol Chloramphenicol
Mode of action Antibiotic class Example(s) Representative structures
Inhibit nucleic acid synthesis Quinolones and fluoroquinolones Nalidixic acid, ciprofloxacin, moxifloxacin Ciprofloxacin
Inhibit nucleic acid synthesis Rifamycins Rifampin Rifampin
Inhibit metabolite synthesis Trimethoprim Trimethoprim Trimethoprim
Inhibit metabolite synthesis Sulfa drugs Sulfanilamide, sulfamethoxazole Sulfanilamide
Damage to the cell membrane Lipid biosynthesis disruptor Platensimycin Platensimycin
Damage to the cell membrane Membrane structure disruptor Daptomycin Daptomycin
Wound and or surgical site, bloodstream, pneumonia, urinary tract
Connected tube like cells are arranged together in connected bunches.
Round discs with depressions in their centers are connected.
Gastrointestinal tract, Pneumonia, endocarditis, arthritis, peritonitis, myonecrosis
Enterobacteriaceae, carbapenem resistant, especially Escherichia coli and Klebsiella pneumoniae
Urinary tract, pneumonia, wound or surgical site, bloodstream
E coli. Tubular structures are arranged side by side in groups. Klebsiella. A tubular structure is attached to a shorter, rounder structure.
Enterococcus Wound or surgical site, bloodstream, urinary tract
Spherical structures are connected end to end in a bunch.
Hepatitis B virus structures are spherical with depressions on their surfaces.
H I V cells are spherical with a dark patch at one end of the cell.
An influenza virus is a tubular structure surrounded by a more rounded structure.
Chronic lung infection Skin and soft tissue infections
M tuberculosis cells are tubular and arranged in bunches side by side.
Norovirus cells are spherical and arranged in a bunch.
Staphylococcus aureus Methicillin resistant, M R S A, and vancomycin intermediate and vancomycin resistant strains
S aureus cells are spherical and arranged in bunches.
Note, Acinetobacter, enterobacteriaceae, vancomycin resistant Enterococcus, mycobacterium tuberculosis, M abscessus, and staphylococcus aureus are antibiotic resistant organisms that exhibit multiple drug resistance. Because of the promiscuous nature by which multiple drug resistant plasmids can be transmitted, many of the pathogens listed as well as members of the normal microbiota could be or become drug resistant in the highly selective nature of the healthcare environment where antibiotics are used routinely and extensively. In addition to the pathogens listed, other extremely pathogenic agents, such as Ebola virus, could be localized to an isolation unit of a healthcare facility, thus making that part of the facility especially dangerous for disease transmission. Note, the micrographs are colorized scanning or transmission electron micrographs obtained from C D C or P H I L. Additional micrograph credits, numbers run top to bottom, 1 to 5, 10, and 12, Janice Haney Carr. 6, Peta Wardell. 7, Erskine Palmer. 8, A Harrison and P Feorino. 9, Frederick Murphy. 11, Charles D. Humphrey.
Erythrocytes 4.2 to 6.2 times 10 to the ninth power
Lymphocytes 1.0 to 4.8 times 10 to the sixth power
Granulocytes and Monocytes up to 7.0 times 10 to the sixth power
A, red blood cells, erythrocytes, are disc shaped with depressions in their centers. B, a lymphocyte is spherical, with a dark patch covering most of the surface. C, neutrophil, a granulocyte, is an irregular round shape. D, a monocyte is round with a depression in one side.
Extreme Descriptive term Genus, species Domain Habitat Minimum Optimum Maximum
High Hyperthermophile Methanopyrus kandleri Archaea Undersea hydrothermal vents 90 °C 106 °C 122°Cb
Low Psychrophile Psychromonas ingrahamii Bacteria Sea ice −12°Cc 5 °C 10 °C
Low Acidophile Picrophilus oshimae Archaea Acidic hot springs −0.06 0.7d 4
High Alkaliphile Natronobacterium gregoryi Archaea Soda lakes 8.5 10e 12
Pressure Barophile (piezophile) Moritella yayanosii Bacteria Deep ocean sediments 500 atm 700 atmf >1000 atm
Salt (NaCl) Halophile Halobacterium salinarum Archaea Salterns 15% 25% 32% (saturation)
Pyruvate/glucose (−0.70) 4 e− Flavodoxinox/red (−0.12) 2 e− NO3 −/NH4 + (+0.34) 8 e−
Acetate/pyruvate (−0.68) 4 e− SO3 2−/H2S (−0.12) 6 e− NO2 −/NO (+0.36) 2 e−
Acetate/acetaldehyde (−0.60) 2 e− Menaquinoneox/red (−0.07) 2 e− SeO4 2−/SeO3 2− (+0.48) 2 e−
SO4 2−/HSO3 − (−0.52) 2 e− APS/AMP+HSO3 − (−0.06) 2 e− Tetrachloroethene/trichloroethylene+Cl− (+0.58) 2 e−
Ferredoxinox/red (−0.42) 2 e− Rubredoxin ox/red (−0.06) 1 e− NO3 −/12 N2 (+0.74) 5 e−
CO2/methanol (−0.38) 6 e− Acrylyl-CoA/proprionyl-CoA (−0.02) 2 e− Fe3+/Fe2+ (+0.77) 1 e− (at pH 2)
Coenzyme F420ox/red (−0.36) 2 e− Fe3+/Fe2+ (+0.20) 1 e− (at pH 7) Mn4+/Mn2+ (+0.80) 2 e−
CO2/acetate (−0.28) 8 e− TMAO/TMA (+0.13) 2 e− ClO3 −/Cl− (+1.03) 4 e−
Methanophenazineox/red (−0.26) 2 e− AsO4 3−/AsO3 3− (+0.14) 2 e− NO/N2O (+1.18) 1 e−
FMN/FMNH2 (−0.22) 2 e− DMSO/DMS (+0.23) 2 e− N2O/N2 (+1.36) 1 e−
Acetaldehyde/ethanol (−0.20) 2 e− Chlorobenzoate/benzoate+Cl− (+0.30) 2 e−
For the reaction in which acetate is oxidized completely to CO2:a
ΔG0′=[Gf0 (products)−Gf0 (reactants)]=[Gf0 (2 CO2+2 H2O)−Gf0(CH3COO−+H++2 O2)]=−852 kJ/reaction
Amino acids and alcohols Gases and inorganic compounds
Fructose (−951.4) Acetate (−369.4) Ketoglutarate (−797.5) Alanine (−371.5) O2, N2, H2, S0, Fe0 (0)
Glucose (−917.2) Benzoate (−245.6) Lactate (−517.8) Aspartate (−700.4) CH4 (−50.8)
Lactose (−1515.2) Butyrate (−352.6) Malate (−845.1) n-Butanol (−171.8) CO2 (−394.4); CO (−137.4)
Ribose (−369.4) Caproate (−335.9) Propionate (−361.1) Ethanol (−181.7) H2O (−237.2); H+ (−39.8); OH− (−198.7)
Sucrose (−757.3) Citrate (−1168.3) Pyruvate (−474.6) Glutamate (−699.6) N2O (+104.2); NO (+86.6)
Formate (−351.1). Succinate (−690.2) Glutamine (−529.7) NO2 − (−37.2); NO3 − (−111.3)
Fumarate (−604.2) Valerate (−344.3) Glycerol (−488.5) NH3 (−26.57); NH4 + (−79.4)
Methanol (−175.4) SO4 2− (−744.6); S2O3 2− (−513.4)
n-Propanol (−175.8) Fe2+ (−78.8); Fe3+ (−4.6); FeS (−100.4)
Physiological class (optima range) Approximate pH optimum for growth Example organisma
0.900 Maple syrup, ham Gram-positive cocci such as Staphylococcus
0.800 Fruit cake, jams Zygosaccharomyces bailii (yeast), Penicillium (fungus)
0.750 Salt lakes, salted fish Halobacterium, Halococcus
0.700 Cereals, candy, dried fruit Xeromyces bisporus and other xerophilic fungi
Group Relationship to O2 Type of metabolism Examplea Habitatb
Obligate Required Aerobic respiration Micrococcus luteus (B) Skin, dust
Facultative Not required, but growth better with O2 Aerobic respiration, anaerobic respiration, fermentation Escherichia coli (B) Mammalian large intestine
Microaerophilic Required but at levels lower than atmospheric Aerobic respiration Spirillum volutans (B) Lake water
Aerotolerant Not required, and growth no better when O2 present Fermentation Streptococcus mutans (B) Oral cavity
Obligate Harmful or lethal Fermentation or anaerobic respiration Methanobacterium formicicum (A) Sewage sludge, anoxic lake sediments
Type of microorganism Characteristics D10a (Gy)
Clostridium botulinum Gram-positive anaerobe; forms endospores 3,300
Deinococcus radiodurans Gram-negative, radiation-resistant coccus 2,200
Lactobacillus brevis Gram-positive, rod-shaped 1,200
Bacillus subtilis Gram-positive aerobe; forms endospores 600
Salmonella enterica (typhimurium) Gram-negative, rod-shaped 200
Saccharomyces cerevisiae Baker’s and brewer’s yeast 500
Foot-and-mouth Pathogen of cloven-hoofed animals 13,000
Alcohol (60–85% ethanol or isopropanol in water) Lipid solvent and protein denaturant Topical antiseptic
Phenol-containing compounds (hexachlorophene, triclosan, chloroxylenol, chlorhexidine) Disrupts cytoplasmic membrane Soaps, lotions, cosmetics, deodorants, topical disinfectants; paper, leather, and textile industries
Cationic detergents, especially quaternary ammonium compounds (benzalkonium chloride) Disrupts cytoplasmic membrane Soaps, lotions, topical disinfectants; metal and petroleum industries
Hydrogen peroxide (3% solution) Oxidizing agent Topical antiseptic
Iodophors (Betadine®) Iodinates proteins, rendering them nonfunctional; oxidizing agent Topical antiseptic
Octenidine Cationic surfactant, disrupts cytoplasmic membrane Topical antiseptic
Alcohol (60–85% ethanol or isopropanol in water) Lipid solvent and protein denaturant General-purpose disinfectant for virtually any surface
Cationic detergents (quaternary ammonium compounds, Lysol® and many related disinfectants) Interacts with phospholipids Disinfectant/sanitizer for medical instruments, food and dairy equipment
Chlorine gas Oxidizing agent Disinfectant for drinking water and electrical/nuclear cooling towers
Chlorine compounds (chloramines, sodium hypochlorite, sodium chlorite, chlorine dioxide) Oxidizing agent Disinfectant/sanitizer for medical instruments, food/dairy equipment, and in water purification
Copper sulfate Protein precipitant Algicide in swimming pools
Ethylene oxide (gas) Alkylating agent Sterilant for temperature-sensitive materials such as plastics
Formaldehyde Alkylating agent Diluted (3% solution) as surface disinfectant/sterilant; concentrated (37% solution) as sterilant
Glutaraldehyde Alkylating agent Disinfectant or sterilant as 2% solution
Hydrogen peroxide Oxidizing agent Vapor used as sterilant
Iodophors (Wescodyne®) Iodinates proteins; oxidizing agent General disinfectant
OPA (ortho-phthalaldehyde) Alkylating agent Powerful disinfectant used for sterilizing medical instruments
Ozone Strong oxidizing agent Disinfectant for drinking water
Peroxyacetic acid Strong oxidizing agent Disinfectant/sterilant
Phenolic compounds Protein denaturant General-purpose disinfectant
Pine oils (Pine-Sol®) (contains phenolics and detergents) Protein denaturant General-purpose disinfectant for household surfaces
Cold sores/genital herpes Herpes simplex dsDNA 152,000
Severe acute respiratory syndrome (SARS) SARS virus ssRNA 29,800
Acquired immunodeficiency syndrome (AIDS) Human immunodeficiency virus (HIV) ssRNA/dsDNA (a retrovirus) 9,700
Cauliflower, turnip, cabbage Cauliflower mosaic virus dsDNA 8,000
>900 plant species Tomato spotted wilt virus ssRNA 16,600
Tobacco, tomato, pepper Tobacco mosaic virus ssRNA 6,500
>1200 plant species Cucumber mosaic virus ssRNA 8,600
Rice, maize, wheat, barley Rice black streaked dwarf virus dsRNA 29,100
Virus Virus genome Single- or double-stranded DNA or RNA Relatively short, circular or linear
Bacteria, Archaea Chromosome Double-stranded DNA Extremely long, usually circular
Eukarya Chromosome Double-stranded DNA Extremely long, linear
Mitochondrion or chloroplast Organellar genome Double-stranded DNA Medium length, usually circular
All organisms Plasmida Double-stranded DNA Relatively short circular or linear, extrachromosomal
All organisms Transposable element Double-stranded DNA Always found inserted into another DNA molecule
DNA gyrase gyrAB Replaces supercoils ahead of replisome
Origin-binding protein dnaA Binds origin of replication to open double helix
Helicase dnaB Unwinds double helix at replication fork
Single-strand binding protein ssb Prevents single strands from annealing
Clamp loader holA–E Loads Pol III onto sliding clamp
Dimerization subunit (Tau) dnaX Holds together the two core enzymes for the leading and lagging strands
DNA polymerase I polA Excises RNA primer and fills in gaps
Tus protein tus Binds terminus and blocks progress of the replication fork
Topoisomerase IV parCE Unlinking of interlocked circles
σ70 RpoD TTGACA For most genes, major housekeeping sigma factor for normal growth
σ38 RpoS CCGGCG Stationary phase, plus oxidative and osmotic stress
σ28 FliA TAAA For genes involved in flagella synthesis
σ24 RpoE GAACTT Response to misfolded proteins in periplasm
σ19 FecI AAGGAAAAT For certain genes in iron transport
System Environmental signal Sensor kinase Response regulator Primary activity of response regulatora
Nitrate and nitrite respiration (Nar) Nitrate and nitrite
Nitrogen utilization (Ntr) Shortage of organic nitrogen NRII (=GlnL) NRI (=GlnG) Activator of promoters requiring RpoN/σ54
Pho regulon Inorganic phosphate PhoR PhoB Activator/repressor
Porin regulation Osmotic pressure EnvZ OmpR Activator/repressor
System Signal Primary activity of regulatory protein Number of genes regulated
Aerobic respiration Presence of O2 Repressor (ArcA) >50
Anaerobic respiration Lack of O2 Activator (FNR) >70
Catabolite repression Cyclic AMP level Activator (CRP) >300
Heat shock Temperature Alternative sigma factors (RpoH and RpoE) >36
Nitrogen utilization NH3 limitation Activator (NRI)/alternative sigma factor (RpoN) >12
Oxidative stress Oxidizing agents Activator (OxyR) >30
General stress response Stress conditions Alternative sigma factor (RpoS) >400
Vitamins Cobalamin (B12), tetrahydrofolate (folic acid), thiamine
Amino acids Glutamine, glycine, lysine, methionine
Nitrogen bases of nucleic acids Adenine, guanine (purine bases)
Others Flavin mononucleotide (FMN), S-adenosylmethionine (SAM), glucosamine 6-phosphate (peptidoglycan precursor), cyclic di-GMP (biofilm signaling molecule), molybdenum cofactor (Moco), fluoride resistance proteins
Auxotroph Loss of enzyme in biosynthetic pathway Inability to grow on medium lacking the nutrient
Temperature-sensitive Alteration of an essential protein so it is more heat-sensitive Inability to grow at a high temperature that normally supports growth
Cold-sensitive Alteration of an essential protein so it is inactivated at low temperature Inability to grow at a low temperature that normally supports growth
Drug-resistant Detoxification of drug or alteration of drug target or permeability to drug Growth on medium containing a normally inhibitory concentration of the drug
Rough colony Loss or change in lipopolysaccharide layer Granular, irregular colonies instead of smooth, glistening colonies
Nonencapsulated Loss or modification of surface capsule Small, rough colonies instead of larger, smooth colonies
Nonmotile Loss of flagella or nonfunctional flagella Compact instead of flat, spreading colonies; lack of motility by microscopy
Pigmentless Loss of enzyme in biosynthetic pathway leading to loss of one or more pigments Presence of different color or lack of color
Sugar fermentation Loss of enzyme in degradative pathway Lack of color change on agar containing sugar and a pH indicator
Virus-resistant Loss of virus receptor Growth in presence of large amounts of virus
5-Bromouracil Incorporated like T; occasional faulty pairing with G AT→GC and occasionally GC→AT
2-Aminopurine Incorporated like A; faulty pairing with C AT→GC and occasionally GC→AT
Nitrous acid (HNO2) Deaminates A and C AT→GC and GC→AT
Monofunctional (for example, ethyl methanesulfonate) Puts methyl on G; faulty pairing with T GC→AT
Bifunctional (for example, mitomycin, nitrogen mustards, nitrosoguanidine) Cross-links DNA strands; faulty region excised by DNase Both point mutations and deletions
Acridines, ethidium bromide Inserts between two base pairs Microinsertions and microdeletions
Ultraviolet (UV) Pyrimidine dimer formation Repair may lead to error or deletion
Ionizing radiation (for example, X-rays) Free-radical attack on DNA, breaking chain Repair may lead to error or deletion
Organism Lifestyle, either endosymbiont, parasite, or free living Size in base pairs O R F’s, open reading frames. Genes encoding known proteins are included, as well as o r f’s that could encode a protein greater than 100 amino acid residues. Smaller o r f’s are not included unless they show similarity to a gene from another organism or unless the codon bias is typical of the organism being studied. Comments
Nasuia deltocephalinicola E 112,091 137 Degenerate sap feeding insect endosymbiont
Tremblaya princeps E 138,931 121 Degenerate mealybug endosymbiont
Hodgkinia cicadicola E 143,795 169 Degenerate cicada endosymbiont
Buchnera aphidicola B C c E 422,434 362 Aphid endosymbiont
Mycoplasma genitalium P 580,070 470 Smallest nonsymbiotic bacterial genome
Borrelia burgdorferi P 910,725 853 Spirochete, linear chromosome, causes Lyme disease
Rickettsia prowazekii P 1,111,523 834 Obligate intracellular parasite, causes epidemic typhus
Treponema pallidum P 1,138,006 1,041 Spirochete, causes syphilis
Methylophilaceae family, strain H T C C 2181 F L 1,304,428 1,354 Marine methylotroph, smallest free living genome
Thermotoga maritima F L 1,860,725 1,877 Hyperthermophile
Deinococcus radiodurans F L 3,284,156 2,185 Radiation resistant, multiple chromosomes
Bdellovibrio bacteriovorus F L 3,782,950 3,584 Predator of other bacteria
Bacillus subtilis F L 4,214,810 4,100 Gram positive genetic model
Mycobacterium tuberculosis P 4,411,529 3,924 Causes tuberculosis
Escherichia coli K to 12 F L 4,639,221 4,288 Gram negative genetic model
Escherichia coli O 157 to H7 F L 5,594,477 5,361 Enteropathogenic strain of E. coli
Pseudomonas aeruginosa F L 6,264,403 5,570 Metabolically versatile opportunistic pathogen
Streptomyces coelicolor F L 8,667,507 7,825 Linear chromosome, produces antibiotics
Bradyrhizobium japonicum F L 9,105,828 8,317 Nitrogen fixation, nodulates soybeans
Sorangium cellulosum F L 14,782,125 11,559 Forms multicellular fruiting bodies
Organism Lifestyle, either endosymbiont, parasite, or free living Size in base pairs O R F’s, open reading frames. Genes encoding known proteins are included, as well as o r f’s that could encode a protein greater than 100 amino acid residues. Smaller o r f’s are not included unless they show similarity to a gene from another organism or unless the codon bias is typical of the organism being studied. Comments
Nanoarchaeum equitans P 490,885 552 Smallest nonsymbiotic cellular genome
Methanocaldococcus jannaschii F L 1,664,976 1,738 Methanogen, hyperthermophile
Pyrococcus horikoshii F L 1,738,505 2,061 Hyperthermophile
Sulfolobus solfataricus F L 2,992,245 2,977 Hyperthermophile, sulfur chemolithotroph
Haloarcula marismortui F L 4,274,642 4,242 Extreme halophile, bacteriorhodopsin
Methanosarcina acetivorans F L 5,751,000 4,252 Acetate using methanogen
First generation Sanger dideoxy method, radioactivity or fluorescence, D N A. amplification Read length, 700 to 900 bases Used for the Human Genome Project
Second generation 454 Pyrosequencing, fluorescence, D N A. amplification, massively parallel Read length, 400 to 500 bases Used to sequence genome of James Watson, completed 2007
Second generation Illumina/Solexa method, fluorescence, D N A. amplification, massively parallel Read length, 50 to 100 bases Giant panda genome, 2009, Beijing Genome Institute, Denisovan genome, 2010
Second generation SOLiD method, fluorescence, D N A. amplification, massively parallel Read length 50 to 100 bases
Third generation HeliScope Single Molecule Sequencer, fluorescence, single molecule Read length, up to 55 bases Fossil D N A. accuracy greatly improved
Third generation Pacific Biosciences SMRT, fluorescence, single molecule, zero mode waveguide Read length, 2500 to 3000 bases
Fourth generation Ion torrent, electronic, p H, D N A. amplification Read length, 100 to 200 bases Sequenced genome of Intel cofounder Gordon Moore, originator of Moore’s law, 2011
Fourth generation Oxford nanopore, electronic, current, single molecule, real time Read length, thousands of bases Portable MinION unit is approximately the size of a flash drive
Arginine codon, Arginine has six codons. Usage of each arginine codon, Escherichia coli Usage of each arginine codon, Fruit fly Usage of each arginine codon, Human
Functional categories Percentage of genes, Escherichia coli, 4.64 mega base pairs. Percentage of genes, Haemophilus influenzae, 1.83 mega base pairs. Percentage of genes, Mycoplasma genitalium, 0.58 mega base pairs.
Organism Comments Lifestyle Genome size Haploid chromosomes O R Fs
Nucleomorph of Bigelowiella natans Degenerate endosymbiotic nucleus Endosymbiont 0.37 3 331
Encephalitozoon intestinalis Smallest known eukaryotic genome, human pathogen Parasite 2.3 11 1,800
Cryptosporidium parvum Parasitic protozoan Parasite 9.1 8 3,800
Plasmodium falciparum Malignant malaria Parasite 23 14 5,300
Saccharomyces cerevisiae Yeast, a model eukaryote Free living 13.4 16 5,800
Ostreococcus tauri Marine green alga, smallest free living eukaryote Free living 12.6 20 8,200
Aspergillus nidulans Filamentous fungus Free living 30 8 9,500
Giardia intestinalis, also called Giardia lamblia Flagellated protozoan, causes acute gastroenteritis Parasite 12 5 9,700
Drosophila melanogaster Fruit fly, model organism for genetic studies Free living 180 4 13,600
Caenorhabditis elegans Roundworm, model for animal development Free living 97 6 19,100
Mus musculus Mouse, a model mammal Free living 2,500 23 25,000
Arabidopsis thaliana Model plant for genetics Free living 125 5 26,000
Paramecium tetraurelia Ciliated protozoan Free living 72 greater than 50 40,000
Pinus taeda Loblolly pine tree Free living 20,000 19 50,000
Trichomonas vaginalis Flagellated protozoan, human pathogen Parasite 160 6 60,000
D N A Genome the total complement of genetic information of a cell or a virus. Metagenome the total genetic complement of all the cells present in a particular environment. Epigenome the total number of possible epigenetic changes. Methylome the total number of methylated sites on the D N A, whether epigenetic or not. Mobilome the total number of mobile genetic elements in a cell.
R N A Transcriptome the total R N A. produced in an organism under a specific set of conditions
Protein Proteome the total set of proteins encoded by a genome; sometimes also used in place of translatome. Translatome the total set of proteins present under specified conditions. Interactome the total set of interactions between proteins, or other macromolecules. Secretome the total set of proteins secreted by a cell
Metabolites Metabolome the total complement of small molecules and metabolic intermediates. Glycome the total complement of sugars and other carbohydrates
Organisms Microbiome the total complement of microorganisms in an environment, including those associated with a higher organism. Virome the total complement of viruses in an environment. Mycobiome the total complement of fungi in a natural environment.
Tissue plasminogen activator Dissolves blood clots
Follicle stimulating hormone Treatment of reproductive disorders
Nerve growth factor Treatment of degenerative neurological disorders and stroke
Somatotropin, growth hormone Treatment of some growth abnormalities
Colony stimulating factor Treatment of infections and cancer
Tumor necrosis factor Antitumor agent, potential treatment of arthritis
beta Glucocerebrosidase Treatment of Gaucher disease, an inherited neurological disease
Morphology Colony morphology, Gram reaction, cell size and shape, pattern of flagellation, presence of spores, inclusion bodies, e.g., P H B, a glycogen, or polyphosphate granules, gas vesicles, magnetosomes, capsules, S layers, or slime layers, stalks or appendages, fruiting body formation
Motility Nonmotile, gliding motility, swimming, flagellar, motility, swarming, motile by gas vesicles
Metabolism Mechanism of energy conservation, phototroph, chemoorganotroph, chemolithotroph, utilization of individual carbon, nitrogen, or sulfur compounds, fermentation of sugars, nitrogen fixation, growth factor requirements Jennifer Ast and Paul Dunlap
Physiology Temperature, pH, and salt ranges for growth, response to oxygen, aerobic, facultative, anaerobic, presence of catalase or oxidase, production of extracellular enzymes
Cell lipid chemistry Fatty acids, b polar lipids, respiratory quinones
Cell wall chemistry Presence or absence of peptidoglycan, amino acid composition of cross links, presence or absence of cross link interbridge
Other traits Pigments, luminescence, antibiotic sensitivity, serotype, production of unique compounds, for example, antibiotics
Energy yields from the oxidation of various inorganic electron donors as follows.
Electron donor Chemolithotrophic reaction Group of chemolithotrophs E 0 prime of couple, V Delta G 0 prime, kilojoules per reaction Number of electrons or reaction Delta G 0 prime, kilojoules per 2 e minus
Phosphite 4 H P O 3, 2 minus, + S O 4, 2 minus, + H, plus, yields 4 H P O 4, 2 minus + H S, minus Phosphite bacteria negative 0.69 negative 364 8 negative 91
Hydrogen H 2 + 1 half O 2 produces H 2 O Hydrogen bacteria negative 0.42 negative 237.2 2 negative 237.2
Sulfide H S, minus, + H, plus, + 1 half O 2 produces S, 0, + H 2 O Sulfur bacteria negative 0.27 negative 209.4 2 negative 209.4
Sulfur S, 0, + 1 and 1 half O 2 + H 2 O produces S O 4, 2 minus, + 2 H, plus Sulfur bacteria negative 0.20 negative 587.1 6 negative 195.7
Ammonium N H 4, plus, + 1 and one half O 2 produces N O 2, minus, + 2 H, plus, + H 2 O Nitrifying bacteria +0.34 negative 274.7 6 negative 91.6
Nitrite N O 2, minus, + 1 half O 2 produces N O 3, minus Nitrifying bacteria +0.43 negative 74.1 2 negative 74.1
Ferrous iron F e, 2 plus, + H plus, + one fourth O 2 produces F e, 3 plus, + one half H 2 O Iron bacteria +0.77 negative 32.9 1 negative 65.8
Comparison of the energetics of oxidation of some common reduced sulfur compounds as follows.
Chemolithotrophic reaction Electrons Stoichiometry Energetics, kilojoules per electron
Sulfide to sulfate 8 H 2 S + 2 O 2 produces S O 4, 2 minus, 2 H plus delta G super 0 prime = negative 798.2 kilojoules per reaction, negative 99.75 kilojoules per e minus
Sulfite to sulfate 2 S O 3, 2 minus, + one half O 2 produces S O 4, 2 minus delta G super 0 prime = negative 258 kilojoules per reaction, negative 129 kilojoules per e minus
Thiosulfate to sulfate 8 S 2 O 3, 2 minus, + H 2 O + 2 O 2 produces 2 S O 4, 2 minus, + 2 H + delta G super 0 prime = negative 818.3 kilojoules per reaction, negative 102 kilojoules per e minus
Oxidation states of key nitrogen compounds as follows.
Sulfur compounds for sulfate reduction as follows.
Thiosulfate, single bond to S, which is single bonded to S O 3, 2 minus negative 2, + 6
Energy rich compounds that can couple to substrate level phosphorylation as follows.
Compound Free energy of hydrolysis, delta G09, kilojoules per mol
Energy of hydrolysis of A T P, A T P produces A D P 1 P sub i negative 31.8
Common fermentations and their energetics and example organisms as follows
Type Reaction Energy yield, delta G super 0 prime, kilojoules per mol Organisms
Alcoholic Hexose produces 2 ethanol + 2 C O 2 negative 239 Yeast, Zymomonas
Homolactic Hexose produces 2 lactate, minus, + 2 H, + negative 196 Streptococcus, some Lactobacillus
Heterolactic Hexose produces lactate, minus, + ethanol + C O 2 + H, + negative 216 Leuconostoc, some Lactobacillus
Propionic acid 3 Lactate, minus, produces 2 propionate, minus, + acetate, minus, + C O 2 + H 2 O negative 170 Propionibacterium, Clostridium propionicum
Mixed acid Hexose produces ethanol + 2, 3 butanediol + succinate, 2 minus, + lactate, minus, + acetate, minus, + formate, minus, + H 2 + C O 2 Depends on product ratio Enteric bacteria including Escherichia, Salmonella, Shigella, Klebsiella, Enterobacter
Butyric acid Hexose produces butyrate, minus, + 2 H 2 + 2 C O 2 + H, + -264 Clostridium butyricum
Butanol 2 Hexose produces butanol + acetone + 5 C O 2 + 4 H 2 negative 468 Clostridium acetobutylicum
Caproate/ Butyrate 6 Ethanol + 3 acetate, minus, produces 3 butyrate, minus, + caproate, minus, + 2 H 2 + 4 H 2 O + H, + negative 183 Clostridium kluyveri
Acetogenic Fructose produces 3 acetate, minus, + 3 H, + negative 276 Clostridium aceticum
Organism Internal membranesa Carbon assimilation pathwayb
Methylococcus I Ribulose monophosphate and Calvin cycle
Methylacidiphilumc Membrane vesicles Calvin cycle
Genus Dimensions (μm) General characteristics Number of endoflagella Habitat Diseases
Cristispira 30–150×0.5–3.0 3–10 complete coils; bundle of endoflagella visible by phase-contrast microscopy ∼100 Digestive tract of molluscs; has not been cultured None known
Spirochaeta 5–250×0.2–0.75 Anaerobic or facultatively aerobic; tightly or loosely coiled 2–40 Aquatic, free-living, freshwater and marine None known
Treponema 5–15×0.1–0.4 Microaerophilic or anaerobic; helical or flattened coil amplitude up to 0.5 μm 2–32 Commensal or parasitic in humans, other animals Syphilis, yaws, swine dysentery, pinta
Borrelia 8–30×0.2–0.5 Microaerophilic; 5–7 coils of approximately 1 μm amplitude 7–20 Humans and other mammals, arthropods Relapsing fever, Lyme disease, ovine and bovine borreliosis
Leptospira 6–20×0.1 Aerobic, tightly coiled, with bent or hooked ends; requires long-chain fatty acids 2 Free-living or parasitic in humans, other mammals Leptospirosis
Leptonema 6–20×0.1 Aerobic; does not require long-chain fatty acids 2 Free-living None known
Brachyspira 7–10×0.35–0.45 Anaerobe 8–28 Intestine of warm-blooded animals Causes diarrhea in chickens and swine
Brevinema 4–5×0.2–0.3 Microaerophile; forms deep branch in spirochete lineage as assessed by 16S rRNA sequence analysis 2 Blood and tissue of mice and shrews Infectious for laboratory mice
Stalk an extension of the cytoplasm and involved in cell division Caulobacter Alphaproteobacteria
Stalk is an excretory product not containing cytoplasm (therefore it is not a prostheca) Gallionella Betaproteobacteria
Single or double prosthecae Asticcacaulis Alphaproteobacteria
Multiple prosthecae Prosthecomicrobium Alphaproteobacteria
Phototrophic, produce hyphae Rhodomicrobium Alphaproteobacteria
Phototrophic, budding without hyphae Rhodopseudomonas Alphaproteobacteria
Chemoorganotrophic, buds on tips of slender hyphae Hyphomicrobium Alphaproteobacteria
Caulobacterales Caulobacter Asymmetric cell division and formation of prosthecae
Rickettsiales Rickettsia Obligate intracellular parasites of humans, transmitted by arthropods
Wolbachia Obligate intracellular parasites of arthropods, affect their reproduction, lack peptidoglycan
Rhizobiales Bartonella Obligate intracellular parasites, transmitted by arthropods
Bradyrhizobium Form root nodules with soybean and other legumes
Brucella Facultative intracellular parasites of animals, zoonotic pathogen
Hyphomicrobium Stalked cells, metabolically versatile
Mesorhizobium Form root nodules with bird’s-foot trefoil and other legumes
Methylobacterium Methylotroph found on plants and in soil
Nitrobacter Nitrifying bacterium that oxidizes NO2 − to NO3 −
Pelagibacter Oligotrophic chemoorganotroph; high abundance in ocean surface
Rhodopseudomonas Metabolically versatile purple nonsulfur bacterium
Rhodobacterales Paracoccus Species used as a model for studying denitrification
Rhodobacter Metabolically versatile purple nonsulfur bacteria
Rhodospirillales Acetobacter Used industrially for producing acetic acid
Gluconobacter Used industrially for producing acetic acid
Sphingomonadales Sphingomonas Aerobic degradation of aromatic organics, biodegradation
Zymomonas Ferments sugars into ethanol, potential for biofuel production
Chemical class Common name Produced by Active againsta
Aminoglycosides Streptomycin S. griseusb Most gram-negative Bacteria
Spectinomycin Streptomyces spp. Mycobacterium tuberculosis, penicillinase-producing Neisseria gonorrhoeae
Neomycin S. fradiae Broad spectrum, usually used in topical applications because of toxicity
Tetracyclines Tetracycline S. aureofaciens Broad spectrum, gram-positive and gram-negative Bacteria, rickettsias and chlamydias, Mycoplasma
Chlortetracycline S. aureofaciens As for tetracycline
Macrolides Erythromycin Saccharopolyspora erythraea Most gram-positive Bacteria, frequently used in place of penicillin; Legionella
Clindamycin S. lincolnensis Effective against obligate anaerobes, especially Bacteroides fragilis, the major cause of anaerobic peritoneal infections
Polyenes Nystatin S. noursei Fungi, especially Candida (a yeast) infections
None Chloramphenicol S. venezuelae Broad spectrum; drug of choice for typhoid fever
Ion Concentration in medium, M Concentration in cells, M
Pathway 1. C O 2 reduction pathway. Carbon dioxide, C O 2, with electrons derived from H 2, certain alcohols, or pyruvate, Formate, H C O O minus, Carbon monoxide, C O.
Pathway 2. Methylotrophic pathway Methanol, C H sub 3 O H, Methylamine, C H sub 3 N H sub 3 plus, Dimethylamine, C H sub 3, sub 2, N H sub 2 plus, Trimethylamine, C H sub 3, sub 3 N H + Methyl mercaptan, C H sub 3 S H, Dimethyl sulfide, C H sub 3, sub 2 S
Pathway 3. Acetoclastic pathway Acetate, C H sub 3 C O Ominus, Pyruvate, C H sub 3 C O C O O minus.
Methanococcus H 2 + C O 2, pyruvate + C O 2, formate
Methanocorpusculum H 2 + C O 2, H 2 + alcohols, formate
Methanoculleus H 2 + C O 2, H 2 + alcohols, formate
Methanosarcina H 2 + C O 2, methanol, methylamines, acetate, C O
Methanohalophilus Methanol, methylamines, methyl sulfides
Methanosalsum Methanol, methylamines, dimethyl sulfide
Methanimicrococcus H 2 + methanol, H 2 + methylamines
Note about substrates for methanogenesis. Methylamines can include the substrates methylamine, C H 3 N H 3 plus, dimethylamine, C H 3, 2 N H 2 plus, and trimethylamine, C H 3, 3 N H plus. Methyl sulfides can include dimethyl sulfide, C H 3, 2 S, and methyl mercaptan, C H 3 S H.
Not about metabolic type, A n R is anaerobic respiration, A e R is aerobic respiration, and F is fermentation. Note about example genera, most are crenarchaeota. The table is as follows. Chemoorganotrophic.
Energy yielding reaction Metabolic type Example genera
Organic compound + S super 0 produces H sub 2 S + C O 2 A n R Thermoproteus, Thermococcus, Desulfurococcus, Thermofilum, Pyrococcus
Organic compound + S O sub 4 super 2 minus produces H sub 2 S + C O 2 A n R Archaeoglobus
Organic compound + O 2 produces H 2 O + C O 2 A e R Sulfolobus
Organic compound produces C O 2 + H 2 + fatty acids A n R Staphylothermus, Pyrodictium
Organic compound + F e super 3 + produces C O 2 + F e super 2 + A n R Pyrodictium
Organic compound + N O sub 3 minus, produces C O 2 + N 2 A n R Pyrobaculum
Pyruvate produces C O 2 + H 2 + acetate A n R Pyrococcus
Peptides produces C O 2 + acetate + butanol F Hyperthermus, Korarchaeum
Energy yielding reaction Metabolic type Example genera
H 2 + S super 0 produces H 2 S A n R Acidianus, Pyrodictium, Thermoproteus, Stygiolobus, Ignicoccus
H 2 + N O 3 minus produces N O 2 minus H 2 O, N O 2 minus is reduced to N 2 by some species A n R Pyrobaculum
4 H 2 + N O sub 3 minus, + H + produces N H sub 4 plus, + 2 H 2 O + O H minus A n R Pyrolobus
H 2 + 2 F e 3 + produces 2 F e super 2 plus, + 2 H+ A n R Pyrobaculum, Pyrodictium, Archaeoglobus
2 H 2 + O 2 produces 2 H 2 O A e R Acidianus, Sulfolobus, Pyrobaculum
2 S super 0 + 3 O 2 + 2 H 2 O produces 2 H sub 2 S O sub 4 A e R Sulfolobus, Acidianus
2 F e S 2 + 7 O 2 + 2 H 2 O produces 2 F e S O 4 + 2 H sub 2 S O 4 A e R Sulfolobus, Acidianus, Metallosphaera
2 F e C O sub 3 + N O sub 3 minus, + 6 H O produces 2 F e, O H sub 3, + N O sub 2 minus, H C O sub 3 minus, + 2 H plus, + H 2 O A n R Ferroglobus
4 H 2 + S O sub 4 super 2 minus, + 2 H + produces 4 H 2 O + H 2 S A n R Archaeoglobus
4 H 2 + C O 2 produces C H 4 + 2 H 2 O A n R Methanopyrus, Methanocaldococcus, Methanothermus
Order or genus Morphology Relationship to O 2 Minimum temperature Optimum temperature Maximum temperature Optimum p H
Staphylothermus Cocci in clusters A n 65 92 98 6 to 7
Pyrodictium Disc shaped with filaments A n 82 105 110 6
Order or genus Morphology Relationship to O 2 Minimum temperature Optimum temperature Maximum temperature Optimum p H
Incubation in air, N2 as nitrogen source Cyanobacteria Pond or lake water, sulfide rich muds, stagnant water, raw sewage, moist, decomposing leaf litter, moist soil exposed to light
Incubation in air, NO3 minus as nitrogen source, 55 degrees C Thermophilic cyanobacteria Hot spring microbial mat
Anoxic incubation, H2 or organic acids, N2 as sole nitrogen source Purple nonsulfur bacteria, heliobacteria Same as above plus hypolimnetic lake water, pasteurized soil, heliobacteria, microbial mats for thermophilic species
Anoxic incubation, H2S as electron donor Purple and green sulfur bacteria
Anoxic incubation, Fe, 2 plus, NO2 minus as electron donor. Purple bacteria
The table is divided into four sections as follows. Chemoorganotrophs, Aerobes.
Electron acceptor Electron donor and nitrogen source Typical organisms enriched Inoculum source
O2 Lactate, benzoate + NH4, plus Mycobacterium, Nocardia, Pseudomonas Soil, mud, lake sediments, decaying vegetation
O2 Hydrocarbons, toluene + NH4, plus Mycobacterium, Nocardia, Pseudomonas Soil, mud, lake sediments, decaying vegetation
O2 Mannitol or benzoate, N2 as nitrogen Azotobacter Soil, mud, lake sediments, decaying vegetation
O2 Ethanol + yeast extract, pH 6.0 Acetobacter, Gluconobacter Soil, mud, lake sediments, decaying vegetation
O2 Cellulose + NH4, plus Cytophaga, Sporocytophaga Soil, mud, lake sediments, decaying vegetation
O2 CH4 + NO3, minus Methylobacter, Methylomicrobium Soil, mud, lake sediments, decaying vegetation
Chemoorganotrophs, Anaerobic respiration and fermentation.
Electron acceptor Electron donor and nitrogen source e Typical organisms enriched Inoculum source
NO3, minus Organic acids + NO3, minus Pseudomonas (denitrifying species) Soil, mud, lake sediments, groundwater seeps, sediments, pasteurized inoculum (80 °C for 15 min) for Bacillus enrichments
NO3, minus Yeast extract + NO3, minus Bacillus (denitrifying species) Soil, mud, lake sediments, groundwater seeps, sediments, pasteurized inoculum (80 °C for 15 min) for Bacillus enrichments
ClO3, minus Acetate Various (per)chlorate-reducing Bacteria and Archaea Contaminated groundwater, rivers, soils, sediments, wastewater treatment systems
PCE Acetate + H2 + NH4, plus Dehalococcoides spp Tetrachloroethene (PCE)-polluted groundwater
SO4, 2 minus Lactate, ethanol, organic acids Desulfovibrio, Desulfotomaculum Soil, mud, sediments, sewage sludge
SO4, 2 minus Acetate, propionate, butyrate Fatty acid-oxidizing sulfate reducers Soil, mud, sediments, sewage sludge
S, 0 Acetate, ethanol Desulfuromonas Soil, mud, sediments, sewage sludge
None Acetate Methanosarcina, Methanosaeta Mud, lake sediments, rotting plant or animal material, dairy products (lactic and propionic acid bacteria); rumen or intestinal contents (enteric bacteria); sewage sludge; soil, pasteurized inoculum for Clostridium enrichments
None Glutamate or histidine Proteolytic Clostridium species Mud, lake sediments, rotting plant or animal material, dairy products (lactic and propionic acid bacteria); rumen or intestinal contents (enteric bacteria); sewage sludge; soil, pasteurized inoculum for Clostridium enrichments
None Starch + NH4, plus Clostridium spp Mud, lake sediments, rotting plant or animal material, dairy products (lactic and propionic acid bacteria); rumen or intestinal contents (enteric bacteria); sewage sludge; soil, pasteurized inoculum for Clostridium enrichments
None Starch + N2 as nitrogen source Clostridium pasteurianum Mud, lake sediments, rotting plant or animal material, dairy products (lactic and propionic acid bacteria); rumen or intestinal contents (enteric bacteria); sewage sludge; soil, pasteurized inoculum for Clostridium enrichments
None Lactate + yeast extract Veillonella spp Mud, lake sediments, rotting plant or animal material, dairy products (lactic and propionic acid bacteria); rumen or intestinal contents (enteric bacteria); sewage sludge; soil, pasteurized inoculum for Clostridium enrichments
None Glucose + yeast extract, p H 5 Lactic acid bacteria (Lactobacillus Mud, lake sediments, rotting plant or animal material, dairy products (lactic and propionic acid bacteria); rumen or intestinal contents (enteric bacteria); sewage sludge; soil, pasteurized inoculum for Clostridium enrichments
None Succinate + NaCl Propionigenium Mud, lake sediments, rotting plant or animal material, dairy products (lactic and propionic acid bacteria); rumen or intestinal contents (enteric bacteria); sewage sludge; soil, pasteurized inoculum for Clostridium enrichments
None Oxalate Oxalobacter Mud, lake sediments, rotting plant or animal material, dairy products (lactic and propionic acid bacteria); rumen or intestinal contents (enteric bacteria); sewage sludge; soil, pasteurized inoculum for Clostridium enrichments
Electron acceptor Electron donor and nitrogen source e Typical organisms enriched Inoculum source
O2 NH4, plus Ammonia-oxidizing Bacteria (Nitrosomonas) and Archaea (Nitrosopumilus), comammox bacteria Lake sediments, thermocline of stratified lake
O2 N O2, minus Nitrite-oxidizing Bacteria (Nitrobacter, Nitrospira) Lake sediments, thermocline of stratified lake
O2 H2 Hydrogen bacteria Lake sediments, thermocline of stratified lake
O2 H2S, S 0, S 2 O 3, 2 minus Thiobacillus spp Lake sediments, thermocline of stratified lake
O2 F e, 2 plus, low p H Acidithiobacillus ferrooxidans Acid mine drainage
O2 Fe, 2 plus, neutral pH Acidovorax, Zetaproteobacteria Groundwater seeps and geothermal seeps
Electron acceptor Electron donor and nitrogen source e Typical organisms enriched Inoculum source
Fe, 3 plus Acetate Geobacter, Geospirillum Groundwater
NO3, minus Fe, 2 plus, + NO3, minus Iron-oxidizing chemolithotrophs Groundwater, groundwater seeps, sediments
NO3, minus S 0, S 2 O 3, 2 minus Thiobacillus denitrificans Mud, lake sediments, soil
NO3, minuis H2 Paracoccus denitrificans Mud, lake sediments, soil
CO2 H2 + NH4, plus Methanogens (chemolithotrophic species only), homoacetogens Mud, lake sediments, rotting plant or animal material, rumen or intestinal contents, sewage sludge
Sulfate reduction apsA Adenosine phosphosulfate reductase
Methane production mcrA Methyl coenzyme M reductase
Degradation of petroleum compounds nahA Naphthalene dioxygenase
Degradation of petroleum compounds alkB Alkane hydroxylase
Anoxygenic photosynthesis pufM M subunit of photosynthetic reaction center
Note, all of the metabolic processes are discussed in chapter 14 and section 3.12.
The organisms are listed as follows. Free-living aerobes. Chemoorganotrophs.
Cyanobacteria, such as Anabaena, Nostoc, Gloeothece, Aphanizomenon
Purple bacteria, such as Chromatium, Methanococcus, Rhodobacter
Soybeans, peas, clover, etcetera with Rhizobium, Bradyrhizobium, Sinorhizobium
Alder, bayberry, autumn olive, many other bushy plants, with the actinomycete Frankia
Resources and conditions that govern microbial growth in nature as follows. Resources.
O 2 and other electron acceptors, N O 3 minus, S O sub 4 super 2 minus, F e 3 plus
Inorganic electron donors, H 2, H 2 S, F e 2 plus, N H 4 plus, N O 2 minus
Osmotic conditions, freshwater and marine and hypersaline
Chemolithotroph Electron donor Electron acceptor Product from donor
Sulfur oxidizing H S, minus, S, 0, S 2 O 3, 2 minus O 2, N O 3, minus S, 0, S O 4, 2 minus
Nitrifying N H 4, plus, N O 2, minus O 2 N O 2, minus, N O 3, minus
Iron and manganese oxidizing F e, 2 plus, M n, 2 plus O 2 F e, 3 plus, M n, 4 plus
Fermentation of glucose to acetate, H2, and CO2d Glucose+4 H2O→2 acetate−+2 HCO3 −+4 H++4 H2 −207 −319
Fermentation of glucose to butyrate, CO2, and H2 Glucose+2 H2O→butyrate−+2 HCO3 −+2 H2+3 H+ −135 −284
Fermentation of butyrate to acetate and H2 Butyrate−+2 H2O→2 acetate−+H++2 H2 +48.2 −17.6
Fermentation of propionate to acetate, CO2, and H2 Propionate−+3 H2O→acetate−+HCO3 −+H++H2 +76.2 −5.5
Fermentation of ethanol to acetate and H2 2 Ethanol+2 H2O→2 acetate−+4 H2+2 H+ +19.4 −37
Fermentation of benzoate to acetate, CO2, and H2 Benzoate−+7 H2O→3 acetate−+3 H++HCO3 −+3 H2 +70.1 −18
Methanogenesis from H2+CO2 4 H2+HCO3 −+H+→CH4+3 H2O −136 −3.2
Methanogenesis from acetate Acetate−+H2O→CH4+HCO3 − −31 −24.7
Acetogenesis from H2+CO2 4 H2+2 HCO3 −+H+→acetate−+4 H2O −105 −7.1
Bean Rhizobium leguminosarum biovar phaseoli a
Clover Rhizobium leguminosarum biovar trifoliia
Soybean Sinorhizobium fredii Sesbania rostrata (a tropical legume) Azorhizobium caulinodans
Aphid Heterotroph (Buchnera) 0.42–0.62 20–26 362–574
Tsetse fly Heterotroph (Wigglesworthia) 0.70 22 617
Carpenter ant Heterotroph (Blochmannia) 0.71–0.79 27–30 583–610
Mealybug Heterotroph (“Candidatus Moranella endobia,” Gammaproteobacteria) 0.54 43.5 406
Mealybug Heterotroph (“Candidatus Tremblaya princeps,” Betaproteobacteria) 0.14 58.8 121
Clam (Calyptogena okutanii) Sulfur oxidizer (unnamed) 1.0 32 975
Clam (Calyptogena magnifica) Sulfur oxidizer (Ruthia) 1.2 34 1248
Tube worm (Riftia pachyptila) Sulfur oxidizer (unnamed) 3.3b NA NA
Porifera (Demospongiae) Sponge Seeps Methanotrophs
Platyhelminthes (Catenulida) Flatworm Shallow water Sulfur chemolithotrophs
Nematoda (Monhysterida) Mouthless nematode Shallow water Sulfur chemolithotrophs
Mollusca (Solemya, Lucina) Clam Vents, seeps, shallow water Sulfur chemolithotrophs
Mollusca (Calyptogena) Clam Vents, seeps, whale fallsa Sulfur chemolithotrophs
Mollusca (Bathymodiolus) Mussel Vents, seeps, whale and wood fallsa Sulfur and H2 chemolithotrophs, methanotrophs
Mollusca (Alviniconcha) Snail Vents Sulfur chemolithotrophs
Annelida (Riftia) Tube worm Vents, seeps, whale and wood fallsa Sulfur chemolithotrophs
Porifera Sponge Cyanobacteria, Chlorella, Symbiodinium Cnidaria Coral, sea anemone Symbiodinium, Chlorella Platyhelminthes Flatworm Diatoms, primitive chlorophytes
Mollusca Snail, clam Symbiodinium, Chlorella Ascidia Sea squirt Cyanobacteria
Fibrobacter succinogenesb Rod Succinate, acetate, formate
Ruminococcus albusc Coccus Acetate, formate, H2, CO2
Butyrivibrio fibrisolvensc Curved rod Acetate, formate, lactate, butyrate, H2, CO2
Clostridium lochheadii Rod (endospores) Acetate, formate, butyrate, H2, CO2
Prevotella ruminicolad Rod Formate, acetate, succinate
Ruminobacter amylophilus Rod Formate, acetate, succinate
Selenomonas ruminantium Curved rod Acetate, propionate, lactate
Succinomonas amylolytica Oval Acetate, propionate, succinate
Selenomonas ruminantium subsp. lactilytica Curved rod Acetate, succinate
Megasphaera elsdenii Coccus Acetate, propionate, butyrate, valerate, caproate, H2, CO2
Lachnospira multipara Curved rod Acetate, formate, lactate, H2, CO2
Methanobrevibacter ruminantium Rod CH4 (from H2+CO2 or formate)
Methanomicrobium mobile Rod CH4 (from H2+CO2 or formate)
Research program Participating countries Programmatic objectives
MetaGenoPolis France Demonstrate the impact of the human gut microbiota on health and disease using metagenomics technology
International Human Microbiome Standards European Commission Optimize methods for the assessment of the effects of the gut microbiome on human health through the standardization of procedures and protocols
Korean Twin Cohort Project Korea Characterize microbiota associated with epithelial tissue in a twin cohort study group, with the goal of identifying targets for early disease diagnosis and prevention
NIH Human Microbiome Project (HMP) USA Characterize the microbes that live in and on the human body, and assess the ability to demonstrate correlations of changes of the human microbiome with health
Canadian Human Microbiome Initiative Canada Characterize the microorganisms colonizing the human body. Evaluate their relationship to health and examine compositional changes associated with chronic disease
NIH Jumpstart Program USA Generate the complete genome sequences of 200 bacterial strains isolated from the human body; recruit donors for securing samples from five body regions, and perform 16S rRNA and metagenomic sequence analysis of the sampled body regions
American Gut: An Open Platform for Citizen Science Microbiome Research USA Crowdsourcing model to secure fecal samples for comparative 16S rRNA, metagenomic, and metabolomic analyses
Vitamin synthesis Thiamine, riboflavin, pyridoxine, B 12, K
Amino acid synthesis footnote a. Asparagine, glutamate, methionine, tryptophan, lysine, and others
Odor production H 2 S, N H 3, amines, indole, skatole, butyric acid
Organic acid production Acetic, propionic, butyric acids
Glycosidase reactions beta Glucuronidase, beta galactosidase, beta glucosidase, alpha glucosidase, alpha galactosidase
Steroid metabolism, bile acids Esterified, dehydroxylated, oxidized, or reduced steroids
Note about amino acid synthesis, capacity for amino acid biosynthesis inferred from the identification of biochemical pathways encoded in gut metagenomic sequences, sections 9.8 and 19.8.
R i P P, lantibiotic Ruminococcin A. Ruminococcus gnavus Antibiotic
R i P P, bacteriocin Ruminococcin C Ruminococcus gnavus Antibiotic
Amino acid metabolite Indolepropionic acid Clostridium sporogenes Protective anti oxidant
Amino acid metabolite 4 Ethylphenylsulfate Undefined Neuromodulatory
Amino acid metabolite Tryptamine Ruminococcus gnavus Neurotransmitter
Volatile fatty acid Propionic acid Bacteroides s p p. Immunomodulatory
Oligosaccharide Polysaccharide A. B. fragilis Immunomodulatory
Note, R I P P are ribosomally synthesized and post translationally modified peptides. Note about immunomodulatory activity, these small molecules promote colonization by normal microbiota.
Staphylococcus aureus Pus forming infections Coagulase Induces fibrin clotting, allows bacterial cells to remain at site of infection, prevents access to pathogens by cells of the immune response
Staphylococcus aureus Pus forming infections Nuclease, lipase Break down nucleic acids or lipids
Streptococcus pyogenes Pus forming infections, scarlet fever Hyaluronidase Dissolves hyaluronic acid in connective tissues, allows bacterial cells to spread, enhances pathogen invasion,
Streptococcus pyogenes Pus forming infections, scarlet fever Streptokinase Dissolves fibrin clots, allows bacterial cells to spread
Clostridium perfringens Gas gangrene, food poisoning Collagenase Breaks down collagen, a protein,, allowing the bacterium to spread to other tissues
Clostridium perfringens Gas gangrene, food poisoning Protease Breaks down proteins
Note about enzymes, the activities of coagulase, hyaluronidase, and streptokinase are depicted in figure 25.12.
Not about toxins, A B is the A B toxin, C T is cytotoxin, and S A is superantigen. The table is as follows.
Bacillus anthracis Anthrax Lethal factor, Edema factor, Protective antigen, A B Combine to cause cell death
Bordetella pertussis Whooping cough Pertussis toxin, A B Blocks G protein function, kills cells
Clostridium botulinum Botulism Botulinum toxin, A B Causes flaccid paralysis
Clostridium tetani Tetanus Tetanospasmin, A B Causes rigid paralysis
Clostridium perfringens Gas gangrene alpha, beta, gamma, delta toxins, A B Hemolysis, lecithin destruction
Clostridium perfringens Food poisoning Enterotoxin, C T Alters intestinal tract permeability
Corynebacterium diphtheriae Diphtheria Diphtheria toxin, A B Inhibits eukaryotic protein synthesis
Escherichia coli, enterotoxigenic strains only, Gastroenteritis Shiga like, E. coli, A B Inhibits protein synthesis, induces bloody diarrhea
Pseudomonas aeruginosa Burn and certain wound and ear infections, cystic fibrosis lung infections Exotoxin A, A B Inhibits eukaryotic protein synthesis
Salmonella s p. Gastroenteritis Enterotoxin, A B Lyses cells, inhibits protein synthesis
Salmonella s p. Gastroenteritis Cytotoxin, C T Induces fluid loss from intestine
Shigella dysenteriae Gastroenteritis Shiga toxin, A B Bloody diarrhea and hemolytic uremic syndrome
Staphylococcus aureus Pyogenic, pus forming, wounds, food poisoning, toxic shock alpha, beta, gamma, delta toxins, C T, Toxic shock toxin, SA, Enterotoxins A through E Hemolysis, leukolysis, cell death Systemic shock Vomiting, diarrhea, systemic shock
Streptococcus pyogenes Pyogenic infections, strep throat, scarlet fever Streptolysis O, S, C T, Erythrogenic toxin, SA Hemolysis, Causes scarlet fever
Vibrio cholerae Cholera Cholera, A B Induces fluid loss from intestine
Chemistry Proteins, secreted by certain gram positive or gram negative Bacteria, generally heat labile Lipopolysaccharide lipoprotein complexes, released on cell lysis as part of the outer membrane of gram negative Bacteria, extremely heat stable
Mode of action, symptoms Specific, usually binds to specific cell receptors or structures, either cytotoxin, enterotoxin, or neurotoxin with defined, specific action on cells or tissues General, fever, diarrhea, vomiting
Toxicity Often highly toxic in picogram to microgram quantities, sometimes fatal Moderately toxic in tens to hundreds of microgram amounts, rarely fatal
Immune response Highly immunogenic, stimulate the production of neutralizing antibody, antitoxin Relatively poor immunogen, immune response not sufficient to neutralize toxin
Toxoid potentiala Heat or chemical treatment may destroy toxicity, but treated toxin, toxoid, remains immunogenic None
Fever potential Nonpyrogenic, does not produce fever in the host Pyrogenic, often induces fever in the host
Genetic origin Often encoded on extrachromosomal elements or lysogenic bacteriophages Encoded by chromosomal genes
Note about toxoid potential, a toxoid is a modified toxin that is no longer toxic but can still elicit an immune response against the toxin, section 28.9.
Acquired immunodeficiency syndrome, AIDS T helper lymphocytes Human immunodeficiency virus, H I V
Cholera small intestine epithelium vibrio Cholerae
Dental caries Oral epithelium Streptococcus mutans, S sobrinus, S mitis
Diphtheria throat epithelium Corynebacterium diphtheriae
Gonorrhea Mucosal epithelium Neisseria gonorrhoeae
Influenza respiratory epithelium Influenza a and influenza b virus
Spontaneous abortion, cattle Placenta Brucella abortus
The table is as follows. Soluble extracellular P R R’s.
Pattern recognition receptors, P R R’s Pathogen associated molecular patterns, P A M P’s, and targets Result of interaction
Mannose binding lectin, soluble Mannose containing components of microbial cell surface, as in gram negative bacteria Complement activation
C reactive protein, soluble Components of gram positive cell walls Complement activation
Pattern recognition receptors, P R R’s Pathogen associated molecular patterns, P A M P’s, and targets Result of interaction
T L R 1, toll like receptor 1 Lipoproteins in mycobacteria Signal transduction, phagocyte activation, and inflammation
T L R 2 Peptidoglycan on gram positive bacteria, zymosan in fungi Signal transduction, phagocyte activation, and inflammation
T L R 4 L P S, lipopolysaccharide, in gram negative bacteria Signal transduction, phagocyte activation, and inflammation
T L R 5 Flagellin in bacteria Signal transduction, phagocyte activation, and inflammation
T L R 6 Lipoproteins in mycobacteria, zymosan in fungi Signal transduction, phagocyte activation, and inflammation
Pattern recognition receptors, P R R’s Pathogen associated molecular patterns, P A M P’s, and targets Result of interaction
T L R 3 Double stranded viral R N A Signal transduction, phagocyte activation, and inflammation
T L R 7, T L R 8 Single stranded viral R N A Signal transduction, phagocyte activation, and inflammation
T L R 9 Unmethylated C p G oligonucleotides in bacteria Signal transduction, phagocyte activation, and inflammation
Cytoplasmic P R R’s, N L R’s, N O D like receptors.
Pattern recognition receptors, P R R’s Pathogen associated molecular patterns, P A M P’s, and targets Result of interaction
N O D 1 Peptidoglycan on gram negative bacteria Triggers release of proinflammatory cytokines, increasing inflammation
N O D 2 Peptidoglycan on gram positive bacteria Triggers release of proinflammatory cytokines, increasing inflammation
N L R P 3 Inflammasome component Triggers release of proinflammatory cytokines, increasing inflammation
Note about soluble extracellular P R R’s. The extracellular soluble P R R’s are produced by liver cells in response to inflammatory cytokines. Note about endosomal membrane associated P R R’s. T L R 3, 7, 8, and 9 are found in intracellular organelle membranes such as in lysosomes. A tenth toll like receptor, T L R 10, has unknown ligand specificity and function. Note about signal transduction, phagocyte activation, and inflammation. Toll like receptors initiate phagocyte activation via signal transduction.
Exposure to antigen, immunity achieved by purposely administering antigen or through infection
Specific immune response made by individual achieving immunity
Immunity activated by antigen, immune memory in effect
Immunity can be maintained via stimulation of memory cells, booster immunization
No exposure to antigen, immunity achieved by injecting antibodies or antigen reactive T cells
Specific immune response made by the donor of antibodies or T cells
Class over H chain Structural conformation or Antigen binding sites Serum concentration, m g over ml, divided by Percent of total circulating antibody Properties Distribution
I g G, gamma Monomer, 2 13.5, 70 to 80% Major circulating antibody, four subclasses, I g G 1, I g G 2, I g G 3, I g G 4, I g G 1 and I g G 3 activate complement Extracellular fluid, blood and lymph, intestine, crosses placenta
0 First antibody to appear in primary response to extracellular pathogens or after immunization, pentamer especially effective in agglutinating antigens, strong complement activator Blood and lymph, monomer is B cell surface receptor, B C R
I g A, alpha Monomer, 2, Dimer, 4 3.5, 10 to 20%, 0.05, 0.2 to 0.3% Important circulating antibody,
Major secretory antibody Blood and lymph, monomer, and secretions, such as mucus, saliva, and colostrum, dimer
I g D, delta Monomer, 2 0.03, 0.2 to 0.3% Minor circulating antibody, mostly associated with mature B cells B cell surface receptor, B C R, blood and lymph, trace
I g E, epsilon Monomer, 2 0.00005, 0.0003% Facilitates parasite immunity but also triggers allergic reactions Blood and lymph, binds to mast cells and eosinophils
Note, all immunoglobulins may have either lambda or kappa light chain types, but not both.
Diversity generating mechanism B cell I g receptors, heavy and light chains T cell receptors, A and B chains
Nucleotide additions at V D J or V J junctions Yes Yes
Antigen presenting cell Macrophage B cell Activated dendritic cell Non Activated dendritic cell
Major cytokines produced I L 2, I F N g, T N F a I L 4, I L 5 I L 17, I L 6 I L 10, T G F b
Cellular effects Activation of T cells I L 2 and macrophages Activation of B cells Activation and recruitment of neutrophils Suppression of adaptive immune cells
Systemic effects Cell mediated immunity Antibody mediated immunity Amplification of innate immunity Control of T h immunity
Cytokine, chemokine Major producer cells Major target cells Major effect
I L 4 a T h 2 B cells Activation, proliferation, differentiation, I g G 1 and I g E synthesis
I L 5 T h 2 B cells Activation, proliferation, differentiation, I g A synthesis
I L 2 Naive T cells, T h 1, and T c T cells Proliferation, often autocrine
G M, C S F c T h 1 Macrophages Growth and differentiation
T N F a d T h 1 Macrophages Activation, production of proinflammatory cytokines
Blank Macrophages Vascular epithelium Activation, inflammation
I L 1 b Macrophages Vascular epithelium, lymphocytes Activation, inflammation
I L 6 Macrophages, dendritic cells Lymphocytes Activation
I L 12 Macrophages, endothelial cells NK cells, naive T cells Activation, enhances differentiation to Th1
C X C L 8, chemokine Macrophages Neutrophils, basophils, T cells Chemotactic factor
C C L 2, M C P 1 e, chemokine Macrophages Macrophages, T cells Chemotactic factor, activator
Note about I L 4, I L, interleukin. Note about I F N gamma, I F N, interferon. Note about G M C S F, G M C S F, granulocyte monocyte colony stimulating factor. Note about T N F alpha, T N F, tumor necrosis factor. Note about M C P 1, M C P, macrophage chemoattractant protein.
Classification Description Immune mechanism Time of latency Examples
Type I Immediate IgE sensitization of mast cells Minutes
Type II Cytotoxic IgG interaction with cell surface antigen Hours Drug reactions (penicillin)
Type III Immune complex IgG interaction with soluble or circulating antigen Hours Systemic lupus erythematosus (SLE)
Type IV Delayed type Th1 inflammatory cell activation of macrophages Days (24–48 h)
Disease Organ, cell, or molecule affected Mechanism (hypersensitivity typea)
Type 1 diabetes (insulin-dependent diabetes mellitus) Pancreas Cell-mediated immunity and autoantibodies against surface and cytoplasmic antigens of beta cells of pancreatic islets (II and IV)
Myasthenia gravis Skeletal muscle Autoantibodies against acetylcholine receptors on skeletal muscle (II)
Goodpasture’s syndrome Kidney Autoantibodies against basement membrane of kidney glomeruli (II)
Rheumatoid arthritis Cartilage Autoantibodies against self IgG antibodies, which form complexes deposited in joint tissue, causing inflammation and cartilage destruction (III)
Hashimoto’s disease (hypothyroidism) Thyroid Autoantibodies to thyroid surface antigens (II)
Male infertility (some cases) Sperm cells Autoantibodies agglutinate host sperm cells (II)
Pernicious anemia Intrinsic factor Autoantibodies prevent absorption of vitamin B12 (III)
Systemic lupus erythematosus (SLE) DNA, cardiolipin, nucleoprotein, blood clotting proteins Autoantibody response to various cellular constituents results in immune complex formation (III)
Addison’s disease Adrenal glands Autoantibodies to adrenal cell antigens (II)
Allergic encephalitis Brain Cell-mediated response against brain tissue (IV)
Multiple sclerosis Brain Cell-mediated and autoantibody response against central nervous system (II and IV)
Cholera Killed cells or cell extract (Vibrio cholerae)
Haemophilus influenzae type b meningitis Conjugated vaccine (polysaccharide of Haemophilus influenzae type b conjugated to protein)
Meningitis Purified polysaccharide from Neisseria meningitidis
Paratyphoid fever Killed bacteria (Salmonella enterica [paratyphi])
Pertussis Killed bacteria (Bordetella pertussis) or acellular proteins
Plague Killed cells or cell extract (Yersinia pestis)
Pneumonia (bacterial) Purified polysaccharide from Streptococcus pneumoniae or polysaccharide–toxoid conjugate
Tuberculosis Attenuated strain of Mycobacterium tuberculosis
Typhoid fever Killed bacteria (Salmonella enterica [typhi])
Hepatitis B Recombinant DNA vaccine or inactivated virus
Human papillomavirus (HPV) Recombinant DNA vaccine
Influenza (seasonal or H1N1) Inactivated or attenuated virus
Polio Attenuated virus (Sabin) or inactivated virus (Salk)
Rabies Inactivated virus (human) or attenuated virus (animal)
Smallpox and monkeypox Cross-reacting virus (vaccinia)
Enfuvirtide Blocks fusion of HIV with T lymphocyte membrane HIV (human immunodeficiency virus)
α-, β-, γ-Interferon Induces proteins that inhibit viral replication Broad spectrum (host-specific)
Oseltamivir and zanamivir Block active site of influenza neuraminidase Influenza A and B
Acyclovir (Figure 31.43) Viral polymerase inhibitor Herpesviruses, Varicella zoster
Zidovudine (AZT) (Figure 31.49a) Reverse transcriptase inhibitor HIV
Ribavirin Blocks capping of viral RNA Respiratory syncytial virus, influenza A and B, Lassa fever
Cidofovir Viral polymerase inhibitor Cytomegalovirus, herpesviruses
Tenofovir (TDF) Reverse transcriptase inhibitor HIV
Indinavir, saquinavir (Figure 28.20b) Viral protease inhibitors HIV
Allylamines Ergosterol synthesis Terbinafine Oral, topical
Aromatic antibiotic Mitosis inhibitor Griseofulvin Oral
Chitin synthesis inhibitor Chitin synthesis Nikkomycin Z Experimental
Echinocandins Cell wall synthesis Caspofungin Intravenous
Nucleic acid analogs DNA synthesis 5-Fluorocytosine Oral
Polyenes Ergosterol synthesis Amphotericin B Oral, intravenous
Polyoxins Chitin synthesis Polyoxin A and B Agricultural
Resistance mechanism Antibiotic example Genetic basis of resistance Mechanism present in
Reduced permeability Penicillins Chromosomal Gram-negative bacteria
Examples: β-lactamases; modifying enzymes, such as methylases, acetylases, phosphorylases, and others
Examples: RNA polymerase, rifamycin; ribosome, erythromycin and streptomycin; DNA gyrase, quinolones
Development of resistant biochemical pathway Sulfonamides Chromosomal
Efflux (pumping out of cell) Tetracyclines Plasmid Enteric bacteria
Only laboratory workers and trained support personnel have access.
Eating, drinking, applying cosmetics, and manipulating contact lenses are forbidden in the laboratory. Hand washing prevents spread of pathogens.
Lab coats, gloves, eye protection, and respirators are recommended or required depending on the pathogens being handled.
Personnel must be vaccinated against agents to which they may be exposed.
Assume all clinical specimens are infectious and handle appropriately.
After use or exposure, decontaminate specimens, surfaces, and materials by disinfecting, autoclaving, or incinerating.
Can transfer pathogens between and among patients, healthcare personnel may be asymptomatic disease carriers
Breaching the skin barrier can introduce pathogens
Exposes internal organs, may introduce pathogens, and causes stress, which lowers resistance to infection
May select for resistant and opportunistic pathogens
Deaths, percent of death from all infectious diseases
Note, data show the ten leading causes of death due to infectious diseases in 2016. Worldwide there were nearly 57 million total deaths, and 20% of these were from infectious diseases, mostly in developing countries. In the United States in 2016, deaths from infectious diseases were about 4% of total deaths (influenza, pneumonia and septicemia were leading causes). Data adapted from data published by the World Health Organization (WHO) and the Centers for Disease Control and Prevention (CDC), Atlanta, Georgia, USA.. Note, for some acute respiratory agents such as influenza and Streptococcus pneumoniae there are effective vaccines, for others, such as colds, there are no vaccines. Note, tuberculosis, measles, meningitis bacterial, pertussis, whopping cough, and tetanus are diseases for which effective vaccines are available. Note, vaccines are available for the hepatitis A virus and the hepatitis B virus.
Common means of disease transmission are as follows.
Person to person, direct contact, sexual intercourse, handshakes.
Vector, arthropods or insects, mites, ticks, mosquitoes
The reproduction number, R sub 0, and herd immunity required to be protected from various diseases are as follows.
Note, reproduction number and herd immunity values are the highest estimates for each disease. herd immunity values are shown only for those diseases for which vaccines are available. Note about influenza, values shown are for the pandemic, H 1 N 1, 2009 influenza. Each influenza epidemic has a different Reproduction number and herd immunity value. Herd immunity values assume a 100% effective vaccine. Vaccine efficacy for influenza is about 60% and observed herd immunity values are 40% or greater depending on the susceptible host populations.
Infectious agents and diseases are listed as follows. Diseases caused by bacteria.
Vancomycin resistant Staphylococcus aureus, V R S A
Arboviruses, encephalitis, non neuroinvasive disease, and Zika
Lyme disease, rash, fever, neurological and cardiac abnormalities, arthritis
Increase in deer and human populations in wooded areas
Sputum droplets, exhaled through a cough or sneeze, from a person with active disease
Antimicrobial drug resistance as multidrug resistant and extensively drug resistant tuberculosis
Water contaminated with the feces of infected persons; food exposed to contaminated water
Poor sanitation and hygiene, carried to non endemic areas via infected travelers and commerce
Bite of an infected mosquito, primarily Aedes aegypti
Poor mosquito control, increased urbanization in tropics, increased
Direct contact with infected blood, organs, secretions, and semen
Direct contact with infected animals or humans, not easily spread via respiratory aerosols
Danger of animal human virus reassortment, antigenic shift
Asymptomatic, or fever, rash, muscle and joint pain, headache
Bite of an infected mosquito, primarily Aedes aegypti, mother to fetus, sexual contact, blood transfusion
Poor mosquito control, increased urbanization in tropics
Candidiasis, fungal infections of the gastrointestinal tract, vagina, and oral cavity
Member of endogenous microbiota becomes an opportunistic pathogen, contact with secretions or excretions from infected persons
Immunosuppression, medical devices, catheters, antibiotic use
Diseases are broken down by threat level as follows. Category A, Highest priority agents that pose a risk to national security. These agents are easily disseminated or transmitted and result in high mortality rates. They require special action for public health preparedness.
Viral hemorrhagic fevers, filoviruses, e. g. Ebola, Marburg, and arenaviruses, e. g. Lassa, Machupo
Category B, Second highest-priority agents. These agents are moderately easy to disseminate, result in moderate morbidity and low mortality, and require specific enhancements of public health diagnostic capacity and disease surveillance.
Food safety threats, e. g. Salmonella s p p, Escherichia coli O 1 5 7 H 7, Shigella
Staphylococcal enterotoxin B, Staphylococcus aureus
Viral encephalitis, alphaviruses such as Venezuelan equine encephalitis, eastern equine encephalitis, western equine encephalitis
Water safety threats, Vibrio cholerae, Cryptosporidium parvum, and others
Category C, Third highest priority agents are emerging pathogens that are available, easily produced and disseminated, with high potential for high morbidity and mortality.
Common, often quite severe, can last several weeks
Note, incidence is based on cases per 100 people per year in the United States for recent years. Incidence of all other infectious diseases totals about 30 cases per 100 people per year.
Note about the virus and genome, examples and discussion of each of these genomes can be found in chapter 11.
The table is as follows. Note, B is bacterium, V is virus, P is protest, F is fungus.
Cefixime or ceftriaxone, and azithromycin or doxycycline
C. trachomatis, B, or Ureaplasma urealyticum, B, or Mycoplasma genitalium, B, or Trichomonas vaginalis, P
No known cure, symptoms can be controlled by several antiviral drugs.
No known cure, symptomatic warts can be removed surgically, chemically, or by cryotherapy.
No known cure, several drugs can stop viral replication and slow disease progression.
The table is divided into two sections for viral diseases and bacterial diseases as follows. Viral diseases.
Nosocomial pneumonia, septicemia, and skin infections
Note, except for S enterica, typhi, these bacteria have been associated with major outbreaks of waterborne illness in the United States in recent years, as have the bacteria Shigella sonnei and leptospira s p. Note about parasites, see chapter 34. C parvum and G intestinalis are unicellular microbial parasites. Schistosoma is a microscopic worm 10 to 20 millimeters long.
A table of the causes, by percentage, is as follows.
Note, numbers in the table are rounded to the nearest percent and were obtained from the centers for disease control waterborne disease and outbreak surveillance system. Note about multiple causes, outbreak was linked to more than one cause. Note about other, suspected to be caused by one or more microbes or chemicals but not confirmed.
Erwinia, Pseudomonas, Corynebacterium, mainly vegetable pathogens, rarely spoil fruit
Aspergillus, Botrytis, Geotrichum, Rhizopus, Penicillium, Cladosporium, Alternaria, Phytophthora, various yeasts
Acinetobacter, Aeromonas, Pseudomonas, Micrococcus, Achromobacter, Flavobacterium, Proteus, Salmonella, Escherichia, Campylobacter, Listeria
Cladosporium, Mucor, Rhizopus, Penicillium, Geotrichum, Sporotrichum, Candida, Torula, Rhodotorula
Streptococcus, Leuconostoc, Lactococcus, Lactobacillus, Pseudomonas, Proteus
Note, the organisms listed are the most commonly observed spoilage agents of fresh, perishable foods. Many of these genera include species that are human pathogens, chapters 31 to 34.
The food categories and fermenting organisms are as follows.
Dairy foods and or Lactic acid, propionic acid Cheeses
Lactococcus, Lactobacillus, Streptococcus thermophilus, Propionibacterium, Swiss cheese
Fermented milk products, Buttermilk and sour cream
Meat products and or Lactic and other acids. Dry sausages, pepperoni, salami, and semi dry sausages, summer sausage, bologna
Pediococcus, Lactobacillus, Micrococcus, Staphylococcus
Soy sauce and or Lactic acid and many other substances
Note, unless otherwise noted, these microorganisms are all species of Firmicutes except for Micrococcus, which is in the Actinobateria, and Zymomonas and Acetobacter, which are in the Alphaproteobacteria. Note, saccharomyces and saccharomyces cerevisiae is yeast. Various saccharomyces species are used in alcohol fermentations. S cerevisiae is the common baker's yeast. To make sourdough bread, species of lactobacillus are used. Note, nonfermented pickles are cucumbers marinated in vinegar, 5 to 8 percent acetic acid. Note, aspergillus is a mold.
Rice and starchy foods, high sugar foods, meats, gravies, pudding, dry milk
Improperly heat processed non acidic foods such as home canned vegetables, beans, potatoes, corn, asparagus
Meat and vegetables held at improper storage temperature
Note, data about diseases is from the centers for disease control and prevention, Atlanta, Georgia, U S A. Note, the numbers indicated with food infection are the ranks in the top five foodborne pathogens in the United States. Note, all of the protists are discussed in chapter 34.
Note, symptoms of many of these diseases are shown in figures 34.3 to 34.5. Aspergillus can also cause allergies, toxemia, and limited infections. Candida albicans is an opportunistic pathogen frequently implicated in the pathogenesis of H I V aids.