Wiring the Brain
BOX 23.1 OF SPECIAL INTEREST: Neurogenesis in Adult Humans
BOX 23.2 PATH OF DISCOVERY: Making a Map of the Mind, by Pasko Rakic
BOX 23.3 OF SPECIAL INTEREST: Why Our CNS Axons Don’t Regenerate
BOX 23.4 OF SPECIAL INTEREST: The Mystery of Autism
BOX 23.5 BRAIN FOOD: Three-Eyed Frogs, Ocular Dominance Columns, and Other Oddities

ELEMENTARY MECHANISMS OF CORTICAL SYNAPTIC PLASTICITY
Excitatory Synaptic Transmission in the Immature Visual System
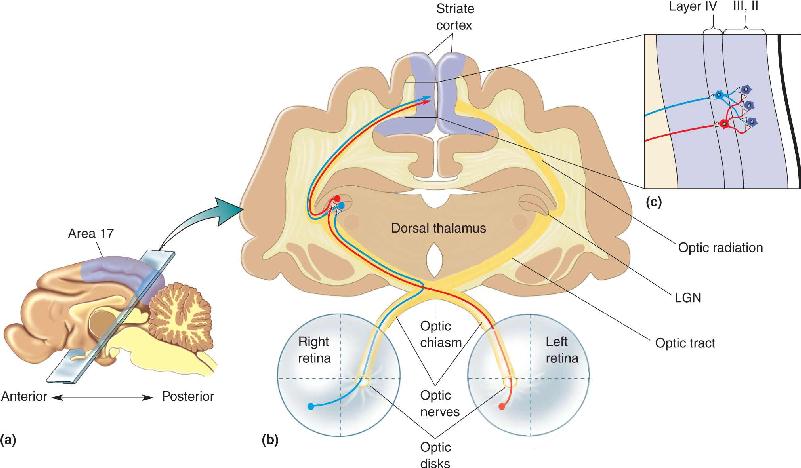
We have seen that most of the operations of the brain depend on remarkably precise interconnections among its 85 billion neurons. As an example, consider the precision in the wiring of the visual system, from retina to lateral geniculate nucleus (LGN) to cortex, shown in Figure 23.1. All retinal ganglion cells extend axons into the optic nerve, but only ganglion cell axons from the nasal retinas cross at the optic chiasm. Axons from the two eyes are mixed in the optic tract, but in the LGN, they are sorted out again (1) by ganglion cell type, (2) by eye of origin (ipsilateral or contralateral), and (3) by retinotopic position. LGN neurons project axons into the optic radiations that travel via the internal capsule to the primary visual (striate) cortex. Here, they terminate (1) only in cortical area 17, (2) only in specific cortical layers (mainly layer IV), and (3) again according to cell type and retinotopic position. Finally, the neurons in layer IV make very specific connections with cells in other cortical layers that are appropriate for binocular vision and are specialized to enable the detection of contrast borders. How did such precise wiring arise?

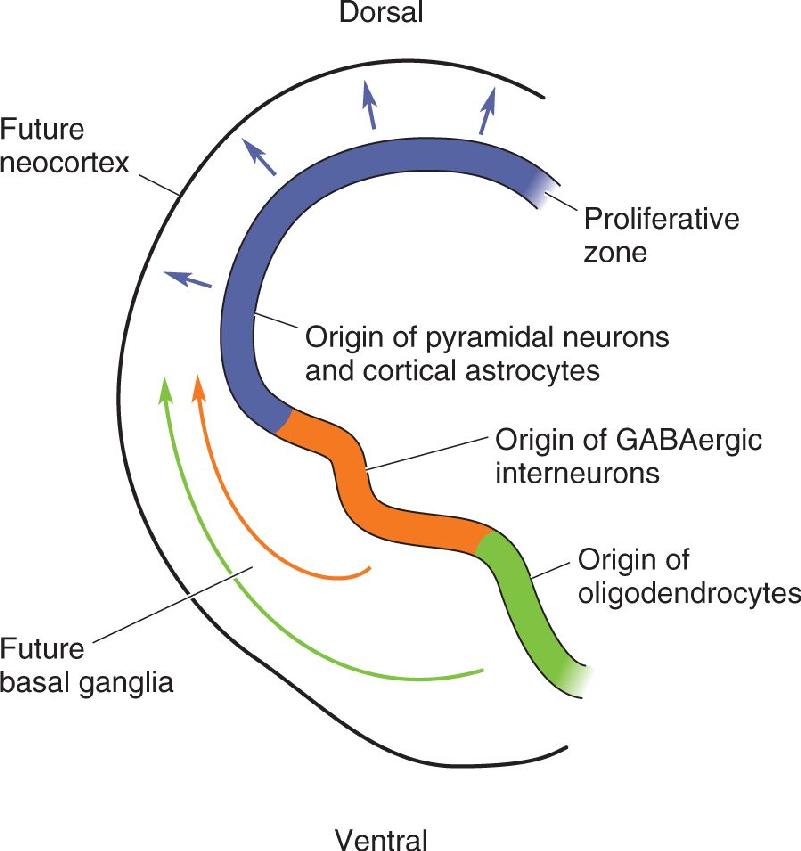
FIGURE 23.1 Components of the mature mammalian retinogeniculocortical pathway. (a) A midsagittal view of a cat brain, showing the location of primary visual cortex (striate cortex, area 17). (b) Components of the ascending visual pathway. Notice that the right eye’s temporal retina and the left eye’s nasal retina project axons via the optic nerve and optic tract to the LGN of the right dorsal thalamus. Inputs from the eyes remain segregated in separate layers at the level of this synaptic relay. LGN neurons project to striate cortex via the optic radiations. These axons terminate mainly in layer IV, where inputs serving the eyes continue to be segregated. (c) The first site of major convergence of inputs from both eyes is in the projection of layer IV cells onto cells in layer III. Description
Back in Chapter 7, we looked at the embryological and fetal development of the nervous system to understand how it changed from a simple tube in the early embryo into the structures we recognize in the adult as the brain and spinal cord. Here, we’ll take another look at brain development, this time to see how connections are formed and modified as the brain matures. We will discover that most of the wiring in the brain is specified by genetic programs that allow axons to detect the correct pathways and the correct targets. However, a small but important component of the final wiring depends on sensory information about the world around us during early childhood. In this way, “nurture and nature” both contribute to the final structure and function of the nervous system. We will be using the central visual system as an example whenever possible, so you may want to quickly review Chapter 10 before continuing.
The first step in wiring the nervous system together is the generation of neurons. Consider as an example the striate cortex. In the adult, there are six cortical layers, and the neurons in each of these layers have characteristic appearances and connections that distinguish striate cortex from other areas. Neuronal structure develops in three major stages: cell proliferation, cell migration, and cell differentiation.
Recall from Chapter 7 that the brain develops from the walls of the five fluid-filled vesicles. These fluid-filled spaces remain in the adult and constitute the ventricular system. Very early in development, the walls of the vesicles consist of only two layers: the ventricular zone and the marginal zone. The ventricular zone lines the inside of each vesicle, and the marginal zone faces the overlying pia. Within these layers of the telencephalic vesicle, a cellular ballet is performed that gives rise to all the neurons and glia of the visual cortex. The choreography of cell proliferation is described later, and the five “positions” correspond to the circled numbers in Figure 23.2a:
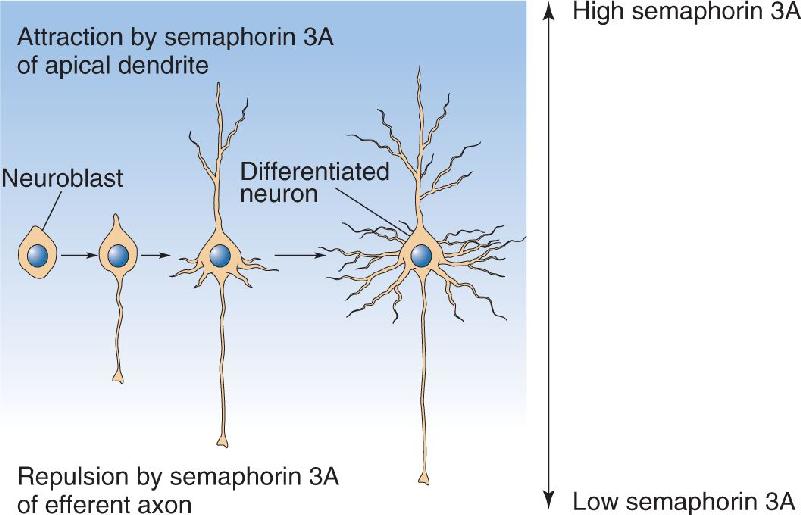

FIGURE 23.2 The choreography of cell proliferation. (a) The wall of the brain vesicles initially consists of only two layers, the marginal zone and the ventricular zone. Each cell performs a characteristic “dance” as it divides, shown here from left to right. The circled numbers correspond to the five “positions” described in the text. The fate of the daughter cells depends on the plane of cleavage during division. (b) After symmetrical cell division, both daughters remain in the ventricular zone to divide again. (c) After asymmetrical cell division, the daughter farthest away from the ventricle ceases further division and migrates away. Description
- First position: A cell in the ventricular zone extends a process that reaches upward toward the pia.
- Second position: The nucleus of the cell migrates upward from the ventricular surface toward the pial surface; the cell’s DNA is copied.
- Third position: The nucleus, containing two complete copies of the genetic instructions, settles back to the ventricular surface.
- Fourth position: The cell retracts its arm from the pial surface.
These dividing cells—the neural progenitors that give rise to all the neurons and astrocytes of the cerebral cortex—are called radial glial cells. For many years it was believed these cells served only as a temporary scaffold to guide newly formed neurons to their final destinations. We now understand that the radial glial cells also give rise to most of the neurons of the central nervous system.
Early in embryonic development, the radial glial cells number in the hundreds. To give rise to the billions of neurons in the adult brain, these multipotent stem cells—meaning they can assume several different destinies—divide to expand the population of neural progenitors via a process called symmetrical cell division (Figure 23.2b). Later in development, asymmetrical cell division is the rule. In this case, one “daughter” cell migrates away to take up its position in the cortex, where it will never divide again. The other daughter remains in the ventricular zone to undergo more divisions (Figure 23.2c). Radial glial cells repeat this pattern until all the neurons and glia of the cortex have been generated.
In humans, the vast majority of neocortical neurons are born between the fifth week and the fifth month of gestation (pregnancy), peaking at the astonishing rate of 250,000 new neurons per minute. Although most of the action is over well before birth, some restricted regions of the adult brain retain some capacity to generate new neurons (Box 23.1). However, it is important to realize that once a daughter cell commits to a neuronal fate, it will never divide again. Furthermore, in most parts of the brain, the neurons you are born with are all you will have in your lifetime.
Neurogenesis in Adult Humans (or How Neuroscientists Learned to Love the Bomb)
For many years, neuroscientists believed that neurogenesis—the generation of new neurons—was restricted to early brain development. But new findings have challenged this view. It now appears that new neurons are continuously generated by neural progenitors in the adult brain.
Cell division requires the synthesis of DNA, which can be detected by feeding the cells chemically labeled DNA precursor molecules. Cells undergoing division at the time the precursor is available incorporate the chemical label into their DNA. In the mid-1980s, Fernando Nottebohm of Rockefeller University used this approach to prove that new neurons are generated in the brains of adult canaries, particularly in regions associated with song learning. This finding resurrected interest in adult neurogenesis in mammals, which had actually first been described in 1965 by Joseph Altman and Gopal Das of the Massachusetts Institute of Technology. Research in the past few years by Fred Gage at the Salk Institute has established definitively that new neurons are generated in the adult rat hippocampus, a structure that is important for learning and memory (as we will see in Chapter 24). Interestingly, the number of new neurons goes up in this region if the animal is exposed to an enriched environment, filled with toys and playmates. In addition, rats given the chance to have a daily run on an exercise wheel show enhanced neurogenesis. In both cases, the increased number of neurons correlates with enhanced performance on memory tasks that require the hippocampus.
Until very recently, however, it has been unclear if neurogenesis also continues in the adult human brain. A definitive answer was finally obtained by the analysis of an experiment that several governments, most prominently those of the United States and the Soviet Union, unwittingly performed on the world population during the Cold War. In the years between 1955 and 1963, hundreds of nuclear bombs were detonated in atmospheric tests (Figure A), causing the widespread dissemination of radioactive fallout. There was a spike in the environmental levels of the radioactive isotope of carbon, 14C, which was incorporated into the biological molecules of all living things, including the replicating DNA of human neurons. This radioactivity put a time stamp on every cell born during the “bomb pulse.” Inspired by Gage’s findings in rodents, Kirsty Spalding, Jonas Frisén, and their colleagues working at the Karolinska Institutet in Stockholm, Sweden developed methods to detect this carbon dating in the neurons of human postmortem brains. They discovered that the neurons of the neocortex were as old as the individual, meaning no new cells had been generated as adults, consistent with dogma. However, the data showed that hippocampal neurons were continuously generated across the lifespan. According to their calculations, in the adult human brain, 700 new neurons are added to the hippocampus every day. About as many are also lost, keeping the total number of hippocampal cells roughly constant. The annual turnover rate is almost 2%. Your hippocampus is not the same hippocampus you had a year ago.

Neurogenesis in the adult brain appears to be a peculiarity of the hippocampus and is still far too limited to repair CNS damage. However, understanding how adult neurogenesis is regulated—for example, by the quality of the environment—might suggest ways it can be harnessed to promote regeneration of the hippocampus after brain injury or disease.
How is a cell’s fate determined? Remember that all of our cells contain the same complement of DNA we inherited from our parents, so every daughter cell has the same genes. The factor that makes one cell different from another is the specific genes that generate mRNA and, ultimately, protein. Thus, cell fate is regulated by differences in gene expression during development. Recall from Chapter 2 that gene expression is regulated by cellular proteins called transcription factors. If transcription factors, or the “upstream” molecules that regulate them, are unevenly distributed within a cell, then the cleavage plane during asymmetrical cell division can determine which factors are passed on to the daughter cells and this can determine their fate (Figure 23.3).

FIGURE 23.3 The distribution of cell constituents in precursor cells. The proteins notch-1 and numb are differentially distributed in the precursor cells of the developing neocortex. Symmetrical cleavage partitions these proteins equally in the daughters, but asymmetrical cleavage does not. Differences in the distribution of proteins in the daughters causes them to have different fates. Description
Mature cortical cells can be classified as glia or neurons, and the neurons can be further classified according to the layer in which they reside, their dendritic morphology and axonal connections, and the neurotransmitter they use. Conceivably, this diversity could arise from different types of precursor cell in the ventricular zone. In other words, there could be one class of precursor cell that gives rise only to layer VI pyramidal cells, another which gives rise to layer V cells, and so on. However, this is not the case. Multiple cell types, including neurons and glia, can arise from the same precursor cell depending on what genes are transcribed during early development.
The ultimate fate of the migrating daughter cell is determined by a combination of factors, including the age of the precursor cell, its position within the ventricular zone, and its environment at the time of division. Cortical pyramidal neurons and astrocytes derive from the dorsal ventricular zone, whereas inhibitory interneurons and oligodendroglia derive from the ventral telencephalon (Figure 23.4). The first cells to migrate away from the dorsal ventricular zone are destined to reside in a layer called the subplate, which eventually disappears as development proceeds. The next cells to divide become layer VI neurons, followed by the neurons of layers V, IV, III, and II.

FIGURE 23.4 The sources of cortical cells. Proliferation of cortical pyramidal neurons and astrocytes occurs in the ventricular zone of the dorsal telencephalon. However, inhibitory interneurons and oligodendroglia are generated in the ventricular zone of the ventral telencephalon; consequently, these cells must migrate laterally over some distance to arrive at their final destination in the cortex. (Source: Adapted from Ross, et al., 2003.) Description
It is worth noting that most of what we understand about cortical development has come from studies on rodents. The general principles appear to apply to primates such as ourselves, but there are some differences that account for the complexity of the primate neocortex. One of these is the elaboration of a second proliferative layer of cells, called the subventricular zone. The neurons deriving from the subventricular zone are destined for the upper layers of the cortex (layers II–III), which, in the adult brain, are the source of corticocortical connections that connect cytoarchitecturally distinct areas. It is reasonable to speculate that the increased computational powers of the primate brain are, in part, a product of this difference in brain development.
Many daughter cells migrate by slithering along the thin fibers emitted by radial glial cells that span the distance between the ventricular zone and the pia. The immature neurons, called neural precursor cells, follow this radial path from the ventricular zone toward the surface of the brain (Figure 23.5). When cortical assembly is complete, the radial glia withdraw their radial processes. Not all migrating cells follow the path provided by the radial glial cells, however. About one-third of the neural precursor cells wander horizontally on their way to the cortex.

FIGURE 23.5 The migration of neural precursor cells to the cortical plate. This is a schematic section through the dorsal telencephalon early in development. The expanded view shows a neural precursor cell crawling along the thin processes of the radial glia en route to the cortical plate, which forms just under the marginal zone. Description
The neural precursor cells destined to become subplate cells are among the first to migrate away from the ventricular zone. Neural precursor cells destined to become the adult cortex migrate next. They cross the subplate and form another cell layer called the cortical plate. The first cells to arrive in the cortical plate are those that will become layer VI neurons. Next come the layer V cells, followed by layer IV cells, and so on. Notice that each new wave of neural precursor cells migrates right past those in the existing cortical plate. In this way, the cortex is said to be assembled inside out (Figure 23.6). This orderly process can be disrupted by a number of gene mutations. For example, in a mutant mouse called reeler (describing the mouse’s wobbly appearance), the neurons of the cortical plate are unable to pass through the subplate and pile up below it. Subsequent discovery of the affected gene revealed one of the factors, a protein called reelin that regulates the assembly of the cortex.

FIGURE 23.6 Inside out development of the cortex. The first cells to migrate to the cortical plate are those that form the subplate. As these differentiate into neurons, the neural precursor cells destined to become layer VI cells migrate past and collect in the cortical plate. This process repeats again and again until all layers of the cortex have differentiated. The subplate neurons then disappear. Description
The process by which a cell takes on the appearance and characteristics of a neuron is called cell differentiation. Differentiation is the consequence of a specific spatiotemporal pattern of gene expression. As we have seen, neural precursor cell differentiation begins as soon as the precursor cells divide with the uneven distribution of cell constituents. Further neuronal differentiation occurs when the neural precursor cell arrives in the cortical plate. Thus, layer V and VI neurons have differentiated into recognizable pyramidal cells even before layer II cells have migrated into the cortical plate. Neuronal differentiation occurs first, followed by astrocyte differentiation that peaks at about the time of birth. Oligodendrocytes are the last cells to differentiate.
Differentiation of the neural precursor cell into a neuron begins with the appearance of neurites sprouting off the cell body. At first, these neurites all appear about the same, but soon one becomes recognizable as the axon and the others as dendrites. Differentiation will occur even if the neural precursor cell is removed from the brain and placed in a tissue culture. For example, cells destined to become neocortical pyramidal cells will often assume the same characteristic dendritic architecture in the tissue culture. This means that differentiation is programmed well before the neural precursor cell arrives at its final resting place. However, the stereotypical architecture of cortical dendrites and axons also depends on intercellular signals. As we have learned, pyramidal neurons are characterized by a large apical dendrite that extends radially, toward the pia, and an axon that projects in the opposite direction. Research has shown that a protein called semaphorin 3A is secreted by cells in the marginal zone. The protein acts first to repel growing pyramidal cell axons, causing them to stream away from the pial surface, and second to attract the growing apical dendrites, causing them to stream toward the brain surface (Figure 23.7). We will see that the oriented growth of neurites in response to diffusible molecules is a recurring theme in neural development.

FIGURE 23.7 The differentiation of a neural precursor cell into a pyramidal neuron. Semaphorin 3A, a protein secreted by cells in the marginal zone, repels the growing axon and attracts the growing apical dendrite, giving the pyramidal neuron its characteristic polarity. Description
The neocortex is often described as a sheet of tissue. In reality, however, cortex is much more like a patchwork quilt, with many structurally distinct areas stitched together. One of the consequences of human evolution was the creation of new neocortical areas that are specialized for increasingly sophisticated analysis. It is natural to wonder exactly how all these areas arise during development.
As we have seen, most cortical neurons are born in the ventricular zone and then migrate along radial glia to take up their final position in one of the cortical layers. Thus, it seems reasonable to conclude that cortical areas in the adult brain simply reflect an organization that is already present in the ventricular zone of the fetal telencephalon. According to this idea, the ventricular zone contains something like a film record of the future cortex, which is projected onto the wall of the telencephalon as development proceeds.
The idea of such a cortical “protomap,” proposed by Yale University neuroscientist Pasko Rakic (Box 23.2), is based on the assumption that migrating neural precursor cells are precisely guided to the cortical plate by the network of radial glial fibers. If migration is strictly radial, we might expect that all the offspring of a single neural progenitor cell would migrate to exactly the same neighborhood of the cortex. Indeed, this has proven to be the case for the majority of cortical neurons. The concept that an entire radial column of cortical neurons originates from the same birthplace in the ventricular zone, called the radial unit hypothesis, suggests a basis for the dramatic expansion of the human neocortex over the course of evolution. The surface area of the human cerebral cortex is 1000 × greater than that of the mouse and 10 × greater than a macaque monkey, but differs in thickness by less than a factor of two. These differences in surface area arise from the size of the proliferative ventricular zone, which in turn can arise from differences in the duration of the period of symmetrical cell division early in gestation. An appealing hypothesis is that one happy accident of human evolution was the chance mutation of genes that regulate the kinetics of cell proliferation, allowing for an increase in the number of proliferative radial glial cells and consequently an enlarged surface of the neocortex.
My interest in the development of a cerebral cortical map began in the mid-1960s while I was a resident in neurosurgery at the Belgrade University. My professors repeatedly warned me to be extremely conservative when cutting the cerebral cortex “because unlike other organs, it is a map of the different areas that are precisely wired for specific functions, and once removed, cannot be replaced or regenerated.” When I inquired how the map was formed, I was referred to nineteenth century literature since little had been learned since then. This is when I decided to abandon neurosurgery until I found an answer to my question. I was fortunate to receive a U.S. Fogarty International Fellowship, which took me to Harvard where I met Paul Yakovlev, a giant figure in developmental neuropathology. I learned from him about the old Wilhelm His hypothesis that cortical neurons in humans originate near the cerebral cavity. Experimental proof, however, was lacking.
Upon returning to Belgrade from the fellowship, I made slices of fresh human embryonic forebrain tissue at various prenatal ages and placed them into a dish of culture medium containing radioactive thymidine, one of the building blocks of DNA. This specific DNA replication marker was impossible to get in Eastern Europe, but I succeeded in bringing it in from the United States unnoticed. To my knowledge, this experiment was the first use of a slice preparation to study cortical development. Since cells continue to divide and synthesize DNA supravitally (after death), I was able to localize them close to the ventricular cavity and in the layer just above, which I named the ventricular (VZ) and subventricular (SVZ) zones, terms later adopted by the Boulder Nomenclature Committee for the neurogenic zones in all vertebrates. Most importantly, I did not find incorporation of radioactivity into cells in the cortical plate, providing the first experimental evidence that, indeed, newly generated neurons are programed to migrate outward to the developing cortex situated below the cerebral surface. This finding was part of my doctoral thesis on the development of the human brain that not only opened a new field of inquiry but also prompted an offer from Professor Raymond Adams to join the faculty at Harvard Medical School in 1969.
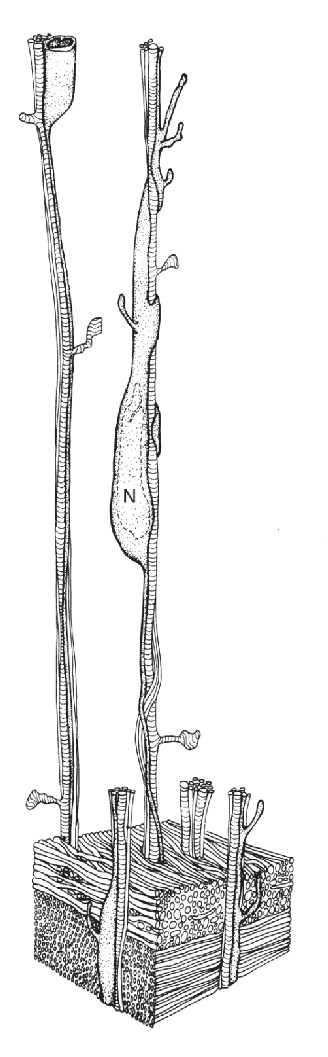
After establishing my laboratory at Harvard, I initiated a comprehensive analysis of when neurons are born, migrate, and differentiated in the cerebral cortex of the macaque monkey, chosen because of its slowly developing brain similar to the human brain. I learned that, even in this large, convoluted cerebrum, neurons migrate and settle in columns in which each new generation of neurons bypasses the previous one. Furthermore, since at mid-gestation in this species postmitotic neurons require more than 2 weeks to migrate to their final destination, I was able to explore the mechanism of how they find their final position in the increasingly distant and convoluted cortex. For example, reconstruction of electron microscopic images of serially sectioned tissue revealed selective attachment of migrating neurons to radial glial cells. In primates, these transient cells are distinct and more differentiated than in other mammals, and their elongated shaft spans the entire thickness of the fetal cerebral wall (see the animated Figure A at http://rakiclab.med.yale.edu/research/CorticalNeuronMigration.aspx). Since this is a huge distance for a small migrating neuron, we performed a full reconstruction of monkey fetal cerebral wall at various ages, each requiring thousands of serial electron micrographs. To create an automated 3D reconstruction in the era before microcomputers, we were given free access to the NASA computers used for the Apollo Project.

Figure A This drawing is based on a 3D reconstruction of thousands of electron microscopic images, showing a neural precursor cell (labeled N) migrating along a radial glial fiber. (Source: Courtesy of Dr. Pasko Rakic.)
These discoveries inspired a new research field and led me to postulate the radial unit and protomap hypotheses of how the complex three-dimensional organization of the cortex is built from a two-dimensional layer of dividing neural stem cells in the proliferative ventricular and subventricular zones (see the animated Figure B at http://rakiclab.med.yale.edu/research/RadialMigration.aspx). These hypotheses suggested a mechanism for the evolutionary expansion of the surface, rather than the thickness, of the cerebral cortex. The protomap hypothesis also explained how genetic modifications could induce arrays of different radial units, giving rise to different cortical areas. Experiments with transgenic mice have provided further supporting evidence for both models.

Figure B This drawing shows how the protomap in the ventricular (VZ) and subventricular zones (SVZ) is related to the mature cerebral cortex. (Abbreviations: IZ, intermediate zone; SP, subplate; CP, cortical plate; MZ, marginal zone; CC, corpus callosum; TR, thalamic radiations; MA, monoamine input; NB, nucleus basalis input; RG, radial glia; MN, migrating neural precursor cell. (Source: Courtesy of Dr. Pasko Rakic.)
The realization that the largest structure of our brain receives all its neurons by orderly, long-distance migration fascinated me so much that after moving to Yale University in 1979, I decided to focus on the molecular mechanisms underlying the coordination of these complex processes. My strategy has been to perform comparative studies of cortical development in rodents, nonhuman primates, and humans using a variety of in vitro and in vivo assays, including genetic manipulations in animals together with mRNA profiling in embryonic human brain slices following laser microdissection. I began with the idea of differential cell adhesion and searched for molecules that would enable a migrating neuron to recognize the surface of the radial glial cell shaft, similar to an antigen–antibody interaction. We have identified a number of genes and signaling molecules involved in the regulation of the proliferation and migration of cortical neurons to their proper areal laminar and columnar positions. By manipulating neuronal migration using genetic and environmental factors, we discovered hidden abnormalities of neuronal positioning that cannot be discerned by routine postmortem examination, opening new insights into the pathogenesis of brain disorders (see Box 23.4).
Over the years, I have come to recognize that the development of the cortex is a complex, multipronged process involving many genes, regulatory elements, and signaling molecules. Thus, even after five decades of effort, I am still as committed as ever to my quest to find out how the cortical map is formed, not only because it is the organ that holds the secret to what distinguishes us from all other species but also because it is also the site of devastating mental disorders yet to be fully understood.
As mentioned earlier, however, one-third of all neural precursor cells stray considerable distances as they migrate toward the cortical plate. How do they find their final resting place? One solution to this puzzle is suggested by the finding that neurons in different regions of the cortex have distinct molecular identities. For example, two complementary gradients of transcription factors, called Emx2 and Pax6, have been discovered along the anterior–posterior axis of the ventricular zone of the developing neocortex (Figure 23.8). Neurons destined for the anterior region of neocortex express higher levels of Pax6, and neurons destined for posterior cortex express higher levels of Emx2. Recall that differences in transcription factors lead to differences in gene expression and protein production; these can be used as signals to attract neural precursor cells to the appropriate destinations. Indeed, if mice are genetically engineered to produce less Emx2, there is an expansion of the anterior cortical areas, such as the motor cortex, and a shrinkage of posterior cortical areas, such as the visual cortex. Conversely, if Pax6 is knocked out, there is an expansion of visual cortex and a shrinkage of frontal cortex.

FIGURE 23.8 Gradients of transcription factors control the size of cortical areas. (a) In the fetal telencephalon, Pax6 and Emx2 are expressed by neural precursor cells in complementary gradients, with Pax6 highest in anterior cortex and Emx2 highest in posterior cortex. (b) The sizes of different cortical areas change if these gradients are changed. In mice genetically engineered to produce less Emx2, there is an expansion in the size of anterior areas. In mice with reduced Pax6, there is an expansion of posterior areas. Abbreviations: M, motor cortex; S, somatosensory cortex; A, auditory cortex; V, visual cortex. (Source: Adapted from Hamasaki et al., 2004.) Description
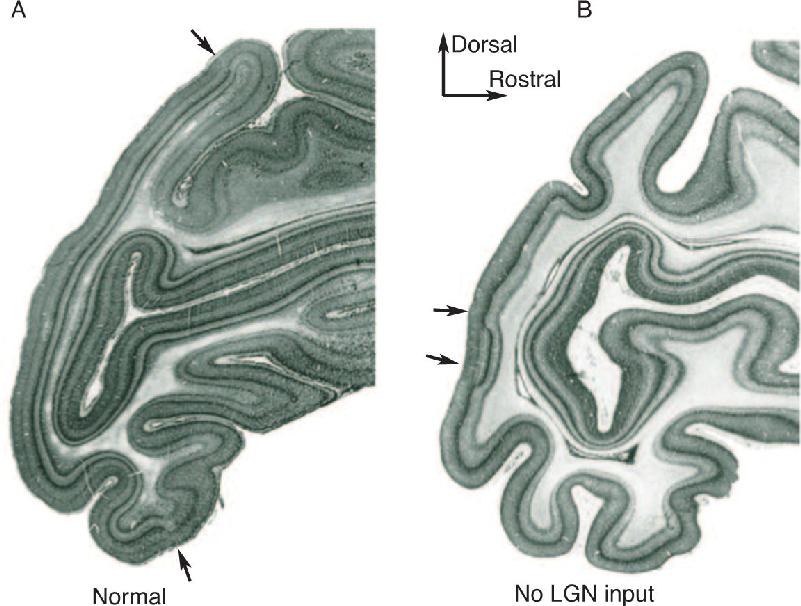
Cortical areas differ not only in terms of cytoarchitecture but also in terms of connections, particularly with the dorsal thalamus. Area 17 receives input from the LGN, area 3 receives input from the ventral posterior (VP) nucleus, and so on. What is the contribution of the thalamic input to the cytoarchitectural differentiation of cortical areas? A clear answer has been provided by experiments in which the LGN input to monkey striate cortex area 17 was eliminated early in fetal life. In these animals, area 17 was greatly reduced in size, with a concomitant increase in the size of the extrastriate cortex (Figure 23.9).

FIGURE 23.9 Differentiation of monkey striate cortex requires LGN input during fetal development. The arrowheads indicate the borders between areas 17 and 18 in (a) a normal monkey, and (b) a monkey in which the LGN input degenerated early in fetal development. (Source: Dehay and Kennedy, 2007.) Description
Thalamic input is clearly necessary, but is it sufficient to induce cytoarchitectural differentiation in a cortical area? Researchers Brad Schlaggar and Dennis O’Leary of the Salk Institute addressed this question in a clever way. In rats, the thalamic fibers wait in the cortical white matter and do not enter the cortex until a few days after birth. Schlaggar and O’Leary peeled off the parietal cortex in newborn rats and replaced it with a piece of occipital cortex. This created a situation in which the thalamic fibers from the VP nucleus were waiting under what would have been visual cortex. Remarkably, the fibers invaded the new piece of cortex and it assumed the cytoarchitecture that is characteristic of the rodent somatosensory cortex (the “barrels”; see Figure 12.21). Together, these results suggest that the thalamus is important for specifying the pattern of cortical areas.
But how did the appropriate thalamic axons come to lie in wait under the parietal cortex in the first place? The answer, apparently, lies in the subplate. Subplate neurons, which have a more strictly radial migration pattern, attract the appropriate thalamic axons to different parts of the developing cortex: LGN axons to occipital cortex, VP nucleus axons to parietal cortex, and so on. The area-specific thalamic axons initially innervate distinct populations of subplate cells. When the overlying cortical plate grows to a sufficient size, the axons invade the cortex. The arrival of the thalamic axons causes the cytoarchitectural differentiation we recognize in the adult brain. Thus, the subplate layer of earliest born neurons seems to contain the instructions for the assembly of the cortical quilt.
As neurons differentiate, they extend axons that must find their appropriate targets. Think of this development of long-range connections, or pathway formation, in the central nervous system (CNS) as occurring in three phases: pathway selection, target selection, and address selection. Let’s understand the meaning of these terms in the context of the development of the visual pathway from the retina to the LGN, as shown in Figure 23.10.

FIGURE 23.10 The three phases of pathway formation. The growing retinal axon must make several “decisions” to find its correct target in the LGN. ① During pathway selection, the axon must choose the correct path. ② During target selection, the axon must choose the correct structure to innervate. ③ During address selection, the axon must choose the correct cells to synapse with in the target structure. Description
Imagine for a moment that you must lead a growing retinal ganglion cell axon to the correct location in the LGN. First you travel down the optic stalk toward the brain. But soon you reach the optic chiasm at the base of the brain and must decide which fork in the road to take. You have three choices: You can enter the optic tract on the same side, you can enter the optic tract on the opposite side, or you can dive into the other optic nerve. The correct path depends on the location in the retina of your ganglion cell and on the cell type. If you came from the nasal retina, you would cross over at the chiasm into the contralateral optic tract, but if you came from the temporal retina, you would stay in the tract on the same side. And in no case would you enter the other optic nerve. These are examples of the “decisions” that must be made by the growing axon during pathway selection.
Having forged your way into the dorsal thalamus, you are now confronted with the choice of which thalamic nucleus to innervate. The correct choice, of course, is the lateral geniculate nucleus. This decision is called target selection.
But finding the correct target still isn’t enough. You must now find the correct layer of the LGN. You also must make sure that you sort yourself out with respect to other invading retinal axons so that retinotopy in the LGN is established. These are examples of the decisions that must be made by the growing axon during address selection.
We will see that each of the three phases of pathway formation depends critically on communication between cells. This communication occurs in several ways: direct cell–cell contact, contact between cells and the extracellular secretions of other cells, and communication between cells over a distance via diffusible chemicals. As the pathways develop, the neurons also begin to communicate via action potentials and synaptic transmission.
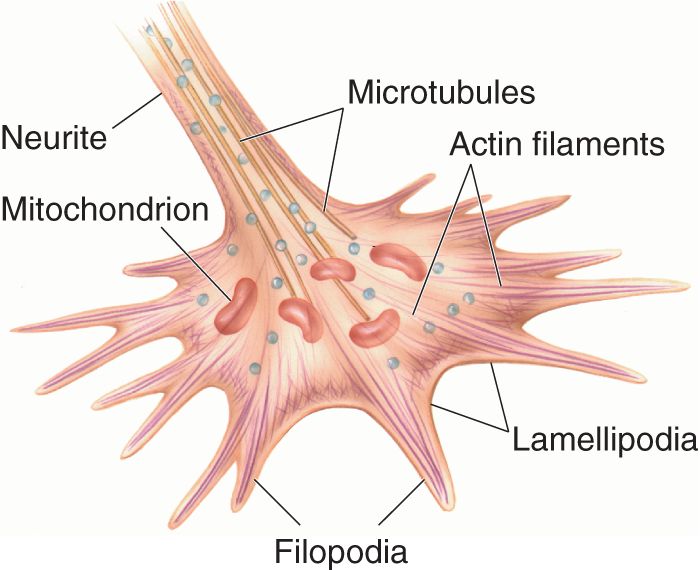
Once the neural precursor cell has migrated to take up its appropriate position in the nervous system, the neuron differentiates and extends the processes that will ultimately become the axon and dendrites. At this early stage, however, the axonal and dendritic processes appear quite similar and collectively are still called neurites. The growing tip of a neurite is called a growth cone (Figure 23.11).

FIGURE 23.11 The growth cone. The filopodia probe the environment and direct the growth of the neurite towards attractive cues. Description
The growth cone is specialized to identify an appropriate path for neurite elongation. The leading edge of the growth cone consists of flat sheets of membrane called lamellipodia that undulate in rhythmic waves like the wings of a stingray swimming along the ocean bottom. Extending from the lamellipodia are thin spikes called filopodia, which constantly probe the environment, moving in and out of the lamellipodia. Growth of the neurite occurs when a filopodium, instead of retracting, takes hold of the substrate (the surface on which it is growing) and pulls the advancing growth cone forward.
Obviously, axonal growth cannot occur unless the growth cone is able to advance along the substrate. An important substrate consists of fibrous proteins that are deposited in the spaces between cells, the extracellular matrix. Growth occurs only if the extracellular matrix contains the appropriate proteins. An example of a permissive substrate is the glycoprotein laminin. The growing axons express special surface molecules called integrins that bind laminin, and this interaction promotes axonal elongation. Permissive substrates, bordered by repulsive ones, can provide corridors that channel axon growth along specific pathways.
Travel down such molecular highways is also aided by fasciculation, a mechanism that causes axons growing together to stick together (Figure 23.12). Fasciculation is due to the expression of specific surface molecules called cell-adhesion molecules (CAMs). The CAMs in the membrane of neighboring axons bind tightly to one another, causing the axons to grow in unison.

FIGURE 23.12 Fasciculation. The bottom axon grows along the molecular “highway” of the extracellular matrix. The other axons ride piggyback, sticking to one another by the interaction of cell-adhesion molecules (CAMs) on their surfaces. Description
Wiring the brain appears to be a formidable challenge, particularly in view of the long distances that many axons traverse in the mature nervous system. Remember, though, that distances are not nearly as great early in development, when the entire nervous system is no more than a few centimeters long. A common mode of pathway formation is the initial establishment of connections by pioneer axons. These axons “stretch” as the nervous system expands and guide their later developing neighbor axons to the same targets. Still, the question remains of how the pioneer axons grow in the correct direction, along the correct paths, to the correct targets. The answer appears to be that the trajectory of the axon is broken into short segments that may only be a few hundred microns long. The axon concludes a segment when it arrives at an intermediate target. The interaction of the axon and the intermediate target throws a molecular switch that sends the axon onward to another intermediate target. Thus, by “connecting the dots,” the axon eventually arrives at its final destination.
Guidance Cues. Growth cones differ in terms of the molecules they express on their membranes. Interactions of these cell surface molecules with guidance cues in the environment determine the direction and amount of growth. Guidance cues can be attractive or repulsive, depending on the receptors expressed by the axons.
A chemoattractant is a diffusible molecule that acts over a distance to attract growing axons toward their targets, like the aroma of freshly brewed java might attract a coffee lover. Although the existence of such chemoattractants was proposed over a century ago by Cajal and was inferred by many experimental studies since then, only very recently have attractant molecules been identified in mammals. The first to be discovered is a protein called netrin. Netrin is secreted by neurons in the ventral midline of the spinal cord (Figure 23.13). The gradient of netrin attracts the axons of dorsal horn neurons that will cross the midline to form the spinothalamic tract. These axons possess netrin receptors, and the binding of netrin to the receptor spurs growth toward the source of netrin.

FIGURE 23.13 Chemoattraction and chemorepulsion. Axons grow across the midline in two stages. First they are attracted to the midline, and then they are repelled from the midline. (a) The protein called netrin is secreted by cells in the ventral midline of the spinal cord. Axons with the appropriate netrin receptors are attracted to the region of highest netrin concentration. (b) The protein called slit is also secreted by midline cells. Axons that express the protein called robo, the slit receptor, grow away from the region of highest slit concentration. Up-regulation of robo by axons that cross the midline ensures that they keep growing away from the midline. Description
But that’s only half the story. Once the decussating axons cross the midline, they need to escape the powerful siren song of netrin. This escape is enabled by the action of slit, another protein secreted by midline cells. Slit is an example of a chemorepellent, a diffusible molecule that chases axons away. For slit to exert this action, however, the axon must express on its surface the slit receptor, a protein called robo. The growth cones that are attracted to the midline by netrin express little robo and are therefore insensitive to repulsion by slit. However, once they cross the midline, they encounter a signal that causes robo to be up-regulated. Now slit repels the axons so they grow away from the midline.
This example shows how axons can be “pulled” and “pushed” by the coordinated actions of chemoattractants and chemorepellents. The trajectory of the axons to and from the midline is also constrained by the permissive substrates that are available for growth. In this example, the cells of the midline are an intermediate target—one of the “dots”—along the molecular highway that spans the midline. These cells serve to alternately attract and then repel the growing axon as it crosses from one side of the CNS to the other.
Establishing Topographic Maps. Let’s return to the example of the growing retinogeniculate axon (see Figure 23.10). These axons grow along the substrate provided by the extracellular matrix of the ventral wall of the optic stalk. An important “choice point” occurs at the optic chiasm. Axons from the nasal retina cross and ascend in the contralateral optic tract, while axons from the temporal retina remain in the ipsilateral optic tract. From our discussion so far, we can infer that nasal and temporal retinal axons express different receptors to cues secreted at the midline.
Once the axons from the retinas are sorted out at the midline, they continue on to innervate targets such as the LGN and the superior colliculus. Sorting of the axons occurs again, this time to establish a retinotopic map in the target structure. If we accept the notion that axons differ depending on their position in the retina (as they must, to account for the partial decussation at the optic chiasm), then we have a potential molecular basis for the establishment of retinotopy. This idea, that chemical markers on growing axons are matched with complementary chemical markers on their targets to establish precise connections, is called the chemoaffinity hypothesis.
This hypothesis was first tested in the 1940s by Roger Sperry, at the California Institute of Technology, in an important series of experiments using the retinotectal projection in frogs. The tectum is the amphibian homologue of the mammalian superior colliculus. The tectum receives retinotopically ordered input from the contralateral eye and uses this information to organize movements in response to visual stimulation, such as lunging after a fly passing overhead. Thus, this system can be used to investigate the mechanisms that generate orderly maps in the CNS.
Another advantage of amphibians is that their CNS axons will regenerate after being cut, which is not true for mammals (Box 23.3). Sperry took advantage of this property to investigate how the retinotopic map was established in the tectum. In one experiment, Sperry cut the optic nerve, rotated the eye 180° in the orbit, and then allowed the upside-down nerve to regenerate. Despite the fact that the axons in the optic nerve were now scrambled from where they would occur naturally, the axons grew into the tectum to exactly the same sites that they occupied originally. Now, when a fly passed overhead, these frogs lunged down instead of up because their eyes were providing the brain a mirror image of the world.
Compared with other vertebrates, mammals are fortunate in many ways. We have computing power and behavioral flexibility that our distant aquatic cousins, fish and amphibians, utterly lack. However, in one interesting respect, fish and frogs have a distinct advantage—the growth of axons in the adult CNS after injury. Cut the optic nerve in a frog, and it grows back. Do the same thing in a human, and the person is blind forever. Of course, our CNS axons do grow over long distances early in development. But something happens shortly after birth that makes the CNS, especially the white matter, a hostile environment for axon growth.
When an axon is cut, the distal segment degenerates because it is isolated from the soma. However, the severed tip of the proximal segment initially responds by emitting growth cones. In the adult mammalian CNS, sadly, this growth is aborted. Not in the mammalian PNS, though; if you’ve ever had a deep cut that severed a peripheral nerve, you know that eventually sensations can come back in the denervated skin. This happens because PNS axons are capable of regeneration over long distances.
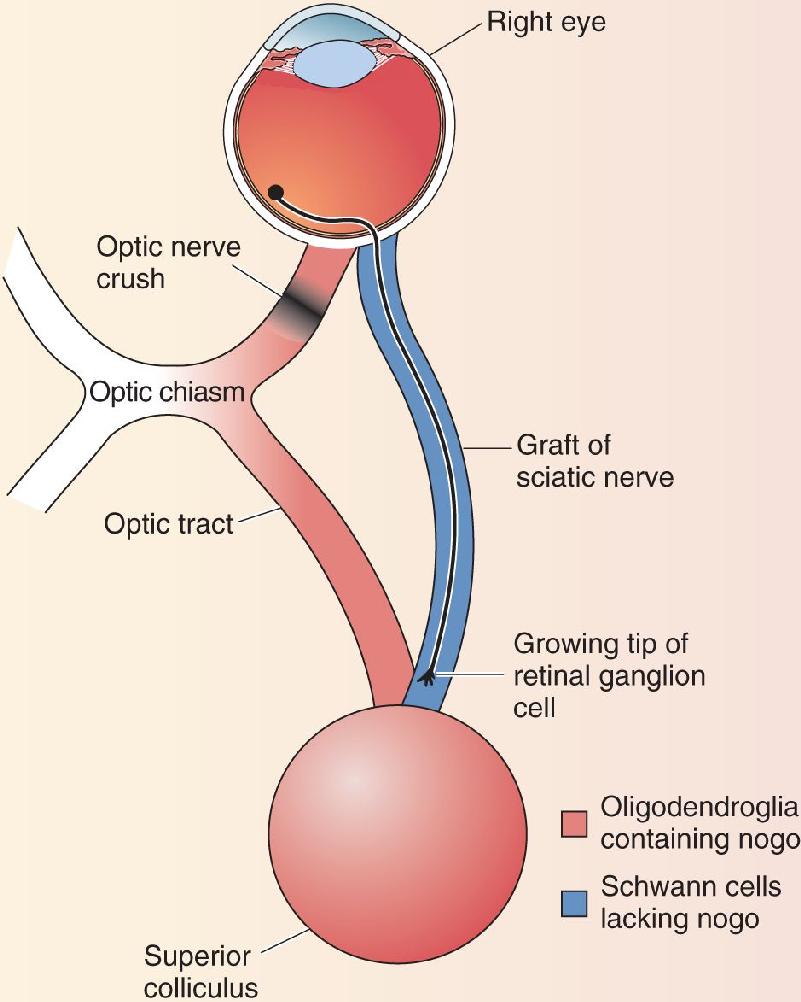
Surprisingly, the critical difference between the mammalian PNS and CNS is not the neurons. A PNS dorsal root ganglion cell axon regenerates in the peripheral nerve, but when it hits the environment of the CNS, in the dorsal horn of the spinal cord, growth ceases. Conversely, if a CNS alpha motor neuron axon is cut in the periphery, it grows back to its target. If it is cut in the CNS, no regeneration occurs. Thus, the critical difference seems to be the different environments of the CNS and PNS. This idea was tested in a very important series of experiments, beginning in the early 1980s, performed on adult rodents by Albert Aguayo and his colleagues at Montreal General Hospital. They showed that crushed optic nerve axons can grow long distances if they are given a peripheral nerve graft to grow along (Figure A). However, as soon as the axon hit the CNS target of the nerve graft, growth ceased.

What is different about peripheral nerves? The type of myelinating glial cell varies: oligodendroglia in the CNS and Schwann cells in the PNS (see Chapter 2). Experiments performed by Martin Schwab of the University of Zurich showed that CNS neurons grown in tissue culture will extend axons along substrates prepared from Schwann cells but not along CNS oligodendroglia and myelin. This finding led to the search for glial factors that inhibit axon growth, and a molecule called nogo was finally identified early in 2000. Nogo is apparently released when oligodendroglia are damaged.
Antibodies raised against nogo neutralize the molecule’s growth-suppressing activity. Schwab and his colleagues have injected the anti-nogo antibody (called IN-1) into adult rats after spinal cord injury. This treatment enabled about 5% of the severed axons to regenerate—a modest effect, perhaps, but sufficient for the animals to show a remarkable functional recovery. The same antibodies have also been used to localize nogo in the nervous system. The protein is made by oligodendroglia in mammals, but not in fish, and it is not found in Schwann cells.
One of the last steps in wiring the mammalian brain is wrapping the young axons in myelin. This has the beneficial effect of speeding action potential conduction, but it comes with a heavy cost—the inhibition of axon growth after injury. The lack of axon regeneration in the adult CNS was accepted by neurologists in the last century as a dismal fact of life. However, our recent understanding of molecules with the power to stimulate or inhibit CNS axon growth offers hope for the twenty-first century that treatments can be devised to promote axon regeneration in the damaged human brain and spinal cord.
What factors control the guidance of retinal axons to the correct part of the tectum? When the axons arrive at the tectum, they must grow along the membranes of tectal cells. The axons from the nasal retina cross the anterior part of the tectum and innervate the neurons in the posterior part. The axons of the temporal retina, in contrast, grow into the anterior tectum and stop there (Figure 23.14a). Why? Experiments have shown that the cell membranes of anterior and posterior tectal neurons differentially express factors that allow the growth of nasal and temporal retinal axons. Nasal axons grow well on the substrate provided by both anterior and posterior tectal membranes (Figure 23.14b). However, temporal axons grow only on anterior tectal membranes; the posterior membranes are repulsive (Figure 23.14c). Research has led to the discovery that proteins called ephrins are one repulsive signal for temporal retinal axons. Specific ephrin molecules are secreted in a gradient across the surface of the tectum, with the highest levels found on posterior tectal cells. An ephrin interacts with a receptor, called eph, on the growing axon. The interaction of ephrin with its receptor inhibits further axonal growth, similar to the slit–robo interaction discussed earlier.

FIGURE 23.14 Establishing retinotopy in the frog retinotectal projection. (a) Retinotopy is established when the nasal retina projects to the posterior tectum and the temporal retina projects to the anterior tectum. (b) To reveal how this retinotopy is established, membranes of cells from anterior and posterior tectum are removed from the frog and deposited in a striped pattern at the bottom of a Petri dish. Experiments show that nasal retinal axons in vitro grow equally well on anterior and posterior membranes. (c) Temporal axons, in contrast, are repelled by membranes from posterior tectum and grow only on anterior tectal membranes. Description
Such gradients in the expression of guidance cues and their axonal receptors can impose considerable topographic order on the wiring of the retina to its targets in the brain. However, as we will see in a moment, the final refinement of connections often requires neural activity.
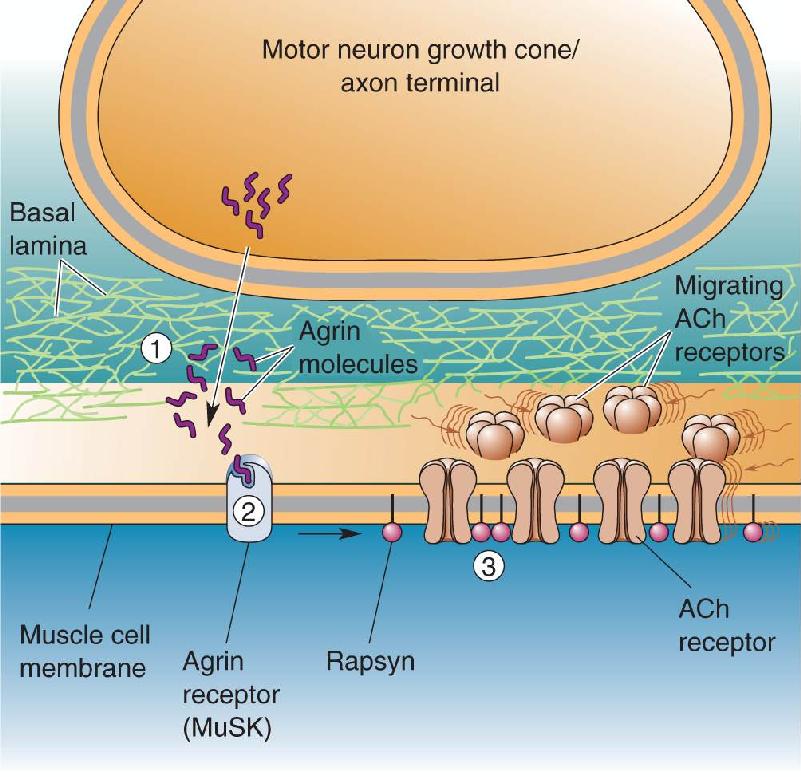
When the growth cone comes in contact with its target, a synapse is formed. Most of what is known about this process comes from studies of the neuromuscular junction. The first step appears to be the induction of a cluster of postsynaptic receptors under the site of nerve–muscle contact. This clustering is triggered by an interaction between proteins secreted by the growth cone and the target membrane. At the neuromuscular junction, one of these proteins, called agrin, is deposited in the extracellular space at the site of contact (Figure 23.15). The layer of proteins in this space is called the basal lamina. Agrin in the basal lamina binds to a receptor in the muscle cell membrane called muscle-specific kinase or MuSK. MuSK communicates with another molecule, called rapsyn, which appears to act like a shepherd to gather the postsynaptic acetylcholine receptors (AChRs) at the synapse. The size of the “flock” of receptors is regulated by another molecule released by the axon, called neuregulin, which stimulates the receptor gene expression in the muscle cell.

FIGURE 23.15 Steps in the formation of a neuromuscular synapse. ① The growing motor neuron secretes the protein agrin into the basal lamina. ② Agrin interacts with MuSK in the muscle cell membrane. This interaction leads to ③ the clustering of ACh receptors in the postsynaptic membrane via the actions of rapsyn. Description
The interaction between axon and target occurs in both directions, and the induction of a presynaptic terminal also appears to involve proteins in the basal lamina. Basal lamina factors provided by the target cell evidently can stimulate Ca2+ entry into the growth cone, which triggers neurotransmitter release. Thus, although the final maturation of synaptic structure may take a matter of weeks, rudimentary synaptic transmission appears very rapidly after contact is made. Besides mobilizing transmitter, Ca2+ entry into the axon also triggers changes in the cytoskeleton that cause it to assume the appearance of a presynaptic terminal and to adhere tightly to its postsynaptic partner.
Similar steps are involved in synapse formation in the CNS, but these may occur in a different order and they definitely use distinct molecules (Figure 23.16). Microscopic imaging of neurons in tissue culture reveals that filopodia are continually being formed and retracted from neuronal dendrites seeking innervation. Synapse formation begins when such a dendritic protrusion reaches out and touches an axon that might be passing by. This interaction appears to cause a preassembled presynaptic active zone to be deposited at the site of contact followed by the recruitment of neurotransmitter receptors to the postsynaptic membrane. In addition, specific adhesion molecules are expressed by both presynaptic and postsynaptic membranes that serve to glue the partners together.

FIGURE 23.16 Steps in the formation of a CNS synapse. ① A dendritic filopodium contacts an axon. ② Contact leads to the recruitment of synaptic vesicles and active zone proteins to the presynaptic membrane. ③ Neurotransmitter receptors accumulate postsynaptically. Description
The mechanisms of pathway formation we’ve discussed are sufficient to establish considerable order in the connections of the fetal brain. For example, in the visual system, these mechanisms ensure that (1) retinal axons reach the LGN, (2) geniculate axons reach layer IV of striate cortex, and (3) both of these sets of axons form synapses in their target structures in proper retinotopic order. But the job of wiring together the nervous system isn’t finished yet. A prolonged period of development follows, from before birth all the way through adolescence, in which these connections are refined. It may come as a surprise that one of the most significant refinements is a large-scale reduction in the numbers of all those newly formed neurons and synapses. The development of proper brain function requires a careful balance between the genesis and elimination of cells and synapses (Box 23.4).
Autism is a developmental disorder in humans characterized by repetitive or stereotyped patterns of behavior and impairments in communication and social interactions. Although affected children appear to be normal at birth, symptoms gradually appear over the course of the first 3 years. Among the signs first noticed by the parents of autistic children are a failure to speak by 16 months of age, poor eye contact, an inability to play with toys, an obsessive attachment to a toy or object, and a failure to smile. Although all individuals with an autism diagnosis will show these traits, the severity varies considerably from one person to the next, as does the association or “comorbidity” with other diagnosable disorders such as intellectual disability and seizures. In recognition of this diversity, clinicians typically use the term “autism spectrum disorder” or ASD to describe this condition. Individuals at one end of the spectrum may never develop language and exhibit severe cognitive impairment. At the other end, individuals may grow up to be socially awkward but intellectually gifted.
ASD is a highly heritable disorder, but the genetics are complex. In some cases, the gene mutations conferring risk for autism occur de novo, meaning that they occur sporadically either in the sperm or egg cells of the parents. One risk factor for such sporadic mutations is advanced parental age, especially of fathers. In other cases, the cause seems to be many small mutations passed on from the parents that only manifest as ASD in offspring that get a “double hit.” Advances in DNA sequencing technology have enabled the discovery of many of the inherited and sporadic mutations in ASD. The affected genes number in the hundreds, suggesting that disruption of many different cellular processes during brain development can manifest as ASD. Thus, as for the other psychiatric disorders discussed in Chapter 22, a diagnosis of ASD alone does not identify the cause, or etiology, of the underlying disease. The diversity of genetic etiologies partly explains why the symptoms vary so much from one person to the next.
Although abnormal behaviors emerge gradually after birth, there is evidence that in some cases, the stage may be set for ASD during fetal development. For example, researchers recently discovered in postmortem brain samples from autistic children that small patches of frontal cortex had disorganized cortical layers which, as we have learned in this chapter, are formed early in development. Furthermore, many genes implicated in ASD are also known to be important for mid-gestational cortical development.
Imaging studies have shown that autistic children also tend to have accelerated growth of the brain, both gray and white matter, after birth. This finding suggests the brains of autistic infants have too many neurons and too many axons, although changes in glia are also possible. Brain growth is controlled by balancing the genesis and destruction of cells, axons, and synapses and the proteins that comprise them. Mutations that bring this process out of balance, by excessive genesis or reduced destruction, could lead to the abnormal brain growth that is ultimately expressed as the impairments in behavior, communication, and social interactions that characterize autism.
Neuroscientists hope that understanding how the brain normally becomes wired together will suggest therapies to correct the altered trajectory of brain growth in children at risk for autism. Studies of a disease called fragile X syndrome (FXS) provide a case in point. FXS, characterized by intellectual disability and ASD, is caused by disruption of the FMR1 gene that encodes a protein called FMRP (introduced in Chapter 2). By knocking this gene out in mice and fruit flies, researchers have been able to identify how brains function differently with this mutation. These studies have shown that FMRP normally serves as a brake on protein synthesis in neurons. In the absence of FMRP, too many proteins are produced. Remarkably, treatments designed to dampen down this excessive protein synthesis have been shown to correct many of the deficits caused by deletion of FMRP in the animal models. These studies have raised the tantalizing possibility that the veil of autism and intellectual disability might be lifted in some cases with appropriate drug therapy.
Entire populations of neurons are eliminated during pathway formation by a process known as programmed cell death. After axons have reached their targets and synapse formation has begun, there is a progressive decline in the number of presynaptic axons and neurons. Cell death reflects competition for trophic factors, life-sustaining substances that are provided in limited quantities by the target cells. This process is believed to produce the proper match in the number of presynaptic and postsynaptic neurons (Figure 23.17).

FIGURE 23.17 Matching inputs with targets by selective cell death. The input neurons are believed to compete with one another for limited quantities of trophic factors produced by the target neurons. Description
A peptide called nerve growth factor (NGF) was the first trophic factor to be identified in the 1940s by Italian biologist Rita Levi-Montalcini. NGF is produced by the targets of axons in the sympathetic division of the ANS. Levi-Montalcini and Stanley Cohen found that the injection of antibodies to NGF into newborn mice resulted in total degeneration of the sympathetic ganglia. NGF, produced and released by the target tissue, is taken up by the sympathetic axons and transported retrogradely, where it acts to promote neuronal survival. Indeed, if axoplasmic transport is disrupted, the neurons will die despite the release of NGF by the target tissue. Their pioneering work earned Levi-Montalcini and Cohen the 1986 Nobel Prize.
NGF is one of a family of related trophic proteins collectively called the neurotrophins. Family members include the proteins NT-3, NT-4, and brain-derived neurotrophic factor (BDNF), which is important for the survival of visual cortical neurons. Neurotrophins act at specific cell surface receptors. Most of the receptors are neurotrophin-activated protein kinases, called trk receptors, that phosphorylate tyrosine residues on their substrate proteins (recall phosphorylation from Chapter 6). This phosphorylation reaction stimulates a second messenger cascade that ultimately alters gene expression in the cell’s nucleus.
The description of cell death during development as “programmed” reflects the fact that it is actually a consequence of genetic instructions to self-destruct. The important discovery of cell death genes by Robert Horvitz at the Massachusetts Institute of Technology was recognized with the 2004 Nobel Prize. It is now understood that neurotrophins save neurons by switching off this genetic program. The expression of cell death genes causes neurons to die by a process called apoptosis, the systematic disassembly of the neuron. Apoptosis differs from necrosis, which is the accidental cell death resulting from injury to cells. Research on neuronal cell death is proceeding at a rapid pace, fueled by the hope that it might be possible to rescue dying neurons in neurodegenerative disorders, such as Alzheimer’s disease (see Box 2.4) and amyotrophic lateral sclerosis (see Box 13.1).
Each neuron can receive on its dendrites and soma a finite number of synapses. This number is the synaptic capacity of the neuron. Throughout the nervous system, synaptic capacity peaks early in development and then declines as the neurons mature. For example, in the striate cortex of all species examined so far, the synaptic capacity of immature neurons exceeds that of adult cells by about 50%. In other words, visual cortical neurons in the infant brain receive one-and-a-half times as many synapses as do the neurons in adults.
When do cortical neurons lose all those synapses? Yale University scientists Jean-Pierre Bourgeois and Pasko Rakic conducted a detailed study to address this question in the striate cortex of the macaque monkey. They discovered that synaptic capacity was remarkably constant in the striate cortex from infancy until the time of puberty. However, during the subsequent adolescent period, synaptic capacity declined sharply—by almost 50% in just over 2 years. A quick calculation revealed the following startling fact: The loss of synapses in the primary visual cortex during adolescence occurs at an average rate of 5000 per second. (No wonder adolescence is such a trying time!)
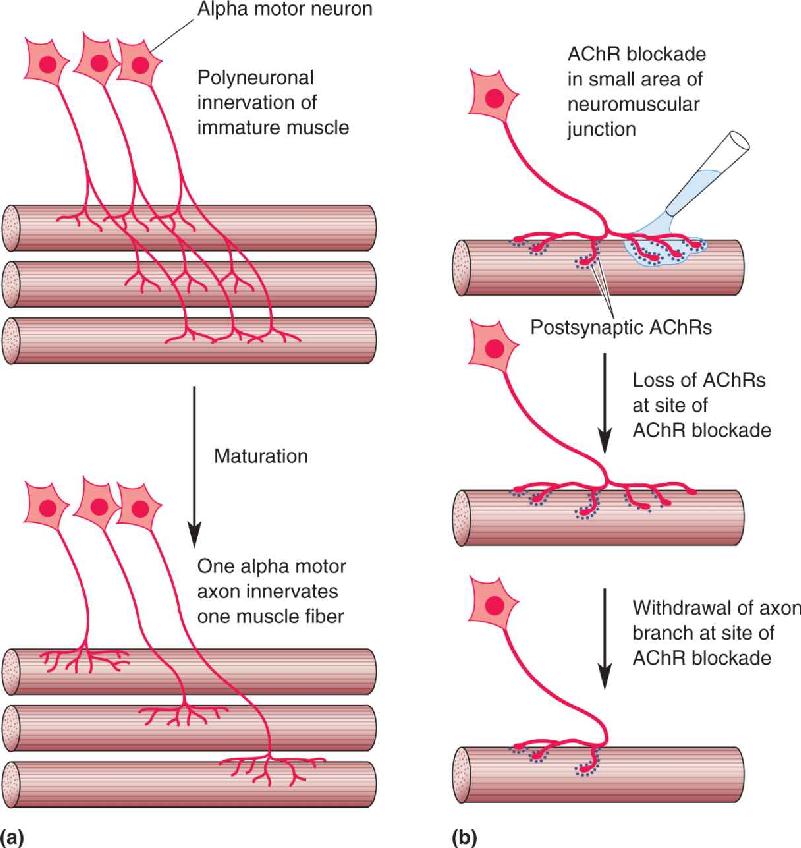
Once again, the neuromuscular junction has provided a useful model for studying synaptic elimination. Initially, a muscle fiber may receive input from several different motor neurons. Eventually, however, this polyneuronal innervation is lost, and each muscle fiber receives synaptic input from a single alpha motor neuron (Figure 23.18a). This process is regulated by electrical activity in the muscle. Silencing the activity of the muscle fiber leads to a retention of polyneuronal innervation, while stimulation of the muscle accelerates the elimination of all but one input.

FIGURE 23.18 Synapse elimination. (a) Initially, each muscle fiber receives inputs from several alpha motor neurons. Over the course of development, all inputs but one are lost. (b) Normally, postsynaptic AChR loss precedes the withdrawal of the axon branch. Simply blocking a subset of receptors with α-bungarotoxin can also stimulate synapse elimination. Description
Careful observations have revealed that the first change during synapse elimination is the loss of postsynaptic AChRs, followed by the disassembly of the presynaptic terminal and retraction of the axon branch. What causes the receptors to disappear? The answer appears to be insufficient receptor activation in an otherwise active muscle. If receptors are partially blocked with α-bungarotoxin (see Box 5.5), they are internalized and the overlying axon terminal withdraws (Figure 23.18b). However, if all the AChRs are blocked, the synapses remain because the muscle is also silent. As we will see in a moment, a similar process appears to occur during the refinement of connections in the CNS.
Imagine a neuron that has a synaptic capacity of six synapses and receives inputs from two presynaptic neurons, A and B (Figure 23.19). One arrangement is that each of the presynaptic neurons provides three synapses. Another arrangement is that neuron A provides one synapse and neuron B provides five. A change from one such pattern of synapses to another is called synaptic rearrangement. There is abundant evidence for widespread synaptic rearrangement in the immature brain.

FIGURE 23.19 Synaptic rearrangement. The target cell receives the same number of synapses in both cases, but the innervation pattern has changed. Description
Synaptic rearrangement is the final step in the process of address selection. Unlike most of the earlier steps of pathway formation, synaptic rearrangement occurs as a consequence of neural activity and synaptic transmission. In the visual system, some of this activity-dependent shaping of connections occurs prior to birth in response to spontaneous neuronal discharges. However, significant activity-dependent development occurs after birth and is influenced profoundly by sensory experience during childhood. Thus, we will find that the ultimate performance of the adult visual system is determined to a significant extent by the quality of the visual environment during the early postnatal period. In a very real sense, we learn to see during a critical period of postnatal development.
The neuroscientists who pioneered this field were none other than David Hubel and Torsten Wiesel who, you’ll recall from Chapter 10, also laid the foundation for our current understanding of the central visual system in the adult brain. In 1981, they shared the Nobel Prize with Roger Sperry. Macaque monkeys and cats were used by Hubel and Wiesel as models for studies of activity-dependent visual system development because, like humans, both of these species have good binocular vision. Recent studies have used rodents because they are better suited for investigation of the underlying molecular mechanisms.
The precision of wiring achieved by chemical attractants and repellents can be impressive. In some circuits, however, the final refinement of synaptic connections appears to require neural activity. A classic example is the segregation of eye-specific inputs in the cat LGN.
Segregation of Retinal Inputs to the LGN. The first axons to reach the LGN are usually those from the contralateral retina, and they spread out to occupy the entire nucleus. Somewhat later, the ipsilateral projection arrives and intermingles with the axons of the contralateral eye. Then the axons from the two eyes segregate into the eye-specific domains that are characteristic of the adult nucleus. Silencing retinal activity with TTX (tetrodotoxin) prevents this process of segregation (recall that TTX blocks action potentials). What is the source of the activity, and how does it orchestrate segregation?
Since segregation occurs in the womb, prior to the development of photoreceptors, the activity cannot be driven by light stimulation. Rather, it appears that ganglion cells are spontaneously active during this period of fetal development. This activity is not random, however. Studies by Carla Shatz and her colleagues at Stanford University indicate that ganglion cells fire in quasisynchronous “waves” that spread across the retina. The origin of the wave and its direction of propagation may be random, but during each wave, the activity in a ganglion cell is highly correlated with the activity of its nearest neighbors. And because these waves are generated independently in the two retinas, the activity patterns arising in the two eyes are not correlated with respect to each other.
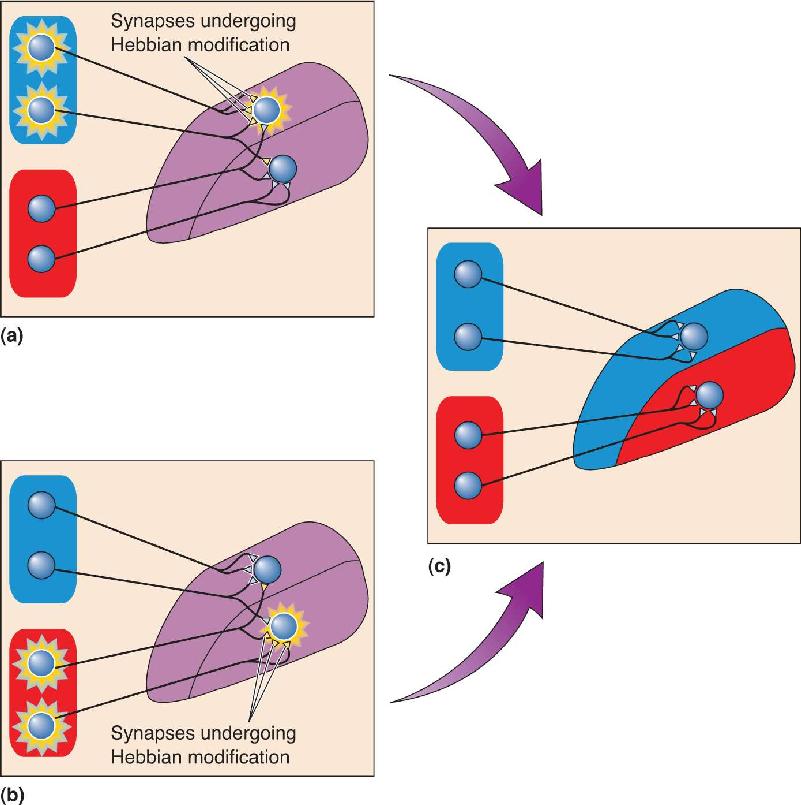
Segregation is thought to depend on a process of synaptic stabilization whereby only retinal terminals that are active at the same time as their postsynaptic LGN target neuron are retained. This hypothetical mechanism of synaptic plasticity was first articulated by Canadian psychologist Donald Hebb in the 1940s. Consequently, synapses that can be modified in this way are called Hebb synapses, and synaptic rearrangements of this sort are called Hebbian modifications. According to this hypothesis, whenever a wave of retinal activity drives a postsynaptic LGN neuron to fire action potentials, the synapses between them are stabilized (Figure 23.20). Because the activity from the two eyes does not occur at the same time, the inputs will compete on a “winner-takes-all” basis until one input is retained and the other is eliminated. Stray retinal inputs in the inappropriate LGN layer are the losers because their activity does not consistently correlate with the strongest postsynaptic response (which is evoked by the activity of the other eye). In a moment, we’ll explore some potential mechanisms for such correlation-based synaptic modification.

FIGURE 23.20 Plasticity at Hebb synapses. Two target neurons in the LGN have inputs from different eyes. Inputs from the two eyes initially overlap and then segregate under the influence of activity. (a) The two input neurons in one eye (top) fire at the same time. This is sufficient to cause the top LGN target neuron to fire but not the bottom one. The active inputs onto the active target undergo Hebbian modification and become more effective. (b) This is the same situation as in part a, except that now the two input neurons in the other eye (bottom) are active simultaneously, causing the bottom target neuron to fire. (c) Over time, neurons that fire together wire together. Notice also that input cells that fire out of sync with the target lose their link. Description
Segregation of LGN Inputs in the Striate Cortex. In visual cortex of monkeys and cats (but not in most other species), the inputs from LGN neurons serving the two eyes are segregated into ocular dominance columns. This segregation occurs before birth and appears to be due to a combination of molecular guidance cues and retinal activity differences (Box 23.5).
Three-Eyed Frogs, Ocular Dominance Columns, and Other Oddities
Ocular dominance columns (stripes, or bands, depending on how they are viewed) are a peculiar feature of some primates, most notably humans and macaque monkeys, and some carnivores, notably cats and ferrets. For many years, researchers believed that inputs from the two eyes initially overlapped in layer IV of visual cortex of these species and that segregation into alternating columns was based on the comparison of activity generated in the retinas. However, this notion was challenged by the observation that eye-specific inputs to the visual cortex of ferrets can be detected even when development proceeds without any retinal activity at all. This finding suggests that molecular guidance mechanisms, rather than activity patterns, cause segregation into ocular dominance stripes.
It is important to recognize, however, that some problems in development can have more than one solution. The branches of the mammalian family tree leading to modern carnivores and primates diverged very early in evolutionary history, about 95 million years ago. Since most other mammals lack ocular dominance columns, evolutionary biologists believe that the columns in carnivores and primates evolved independently, so we must be cautious when generalizing about the mechanisms of ocular dominance formation.
This point is nicely illustrated by studies of three-eyed frogs conducted in the 1980s by Martha Constantine-Paton and her students, then at Princeton University. Frogs don’t have three eyes, of course. Normally they have two eyes, and each retina projects axons exclusively to the contralateral optic tectum. However, by transplanting the eye bud from one embryo into the forebrain area of another, the researchers were able to create a situation where two retinal projections were forced to grow into the same tectum (Figure A, part a). Amazingly, the input segregated into stripes that look very much like the ocular dominance patterns in monkey striate cortex (Figure A, part b). If activity in the retinas was blocked, however, the axons from the two eyes rapidly became intermingled. This experiment proves that differences in activity can indeed be used to segregate inputs, as suggested by Hebbian models of development.
Figure A (a) This frog’s third eye formed from a transplanted embryonic eye bud. (b) Tangential sections through the tectum of a three-eyed frog, illuminated to show the distribution of radioactive axon terminals serving one eye. (Source: Courtesy of Dr. Martha Constantine-Paton.) Description
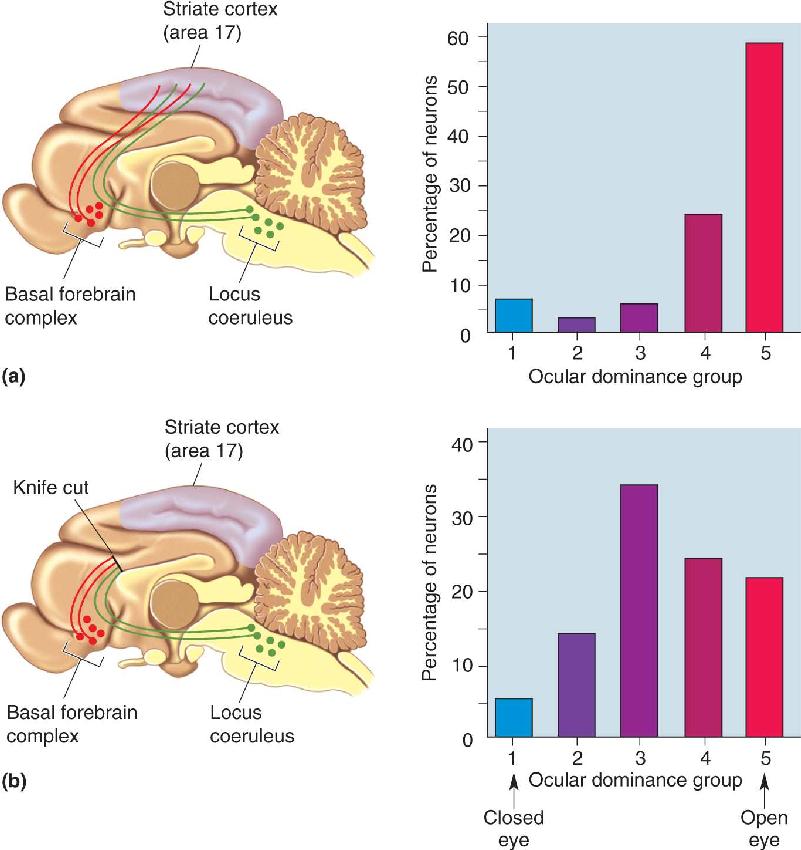
Regardless of how ocular dominance columns form, however, the appearance of segregation does not mean that the axons lose their ability to grow and retract. “Plasticity” of ocular dominance columns in macaques after birth can be dramatically demonstrated by an experimental manipulation used by Wiesel and Hubel, called monocular deprivation, in which one eyelid of a young monkey is sealed closed. If monocular deprivation is begun shortly after birth, the striking result is that the “open-eye” columns expand in width while the “closed-eye” columns shrink (Figure 23.21). Moreover, these effects of monocular deprivation can be reversed simply by closing the previously open eye and opening the previously closed eye. The result of this “reversed-occlusion” manipulation is that the shrunken ocular dominance columns of the formerly closed eye expand, and the expanded columns of the formerly open eye shrink. Thus, LGN axons and their synapses in layer IV are highly dynamic, even after birth. Notice that this type of synaptic rearrangement is not just activity dependent but is also experience dependent because it relies on the quality of the sensory environment.

FIGURE 23.21 Modification of ocular dominance stripes after monocular deprivation. Tangential sections through layer IV of macaque monkey striate cortex illuminated to show the distribution of radioactive LGN terminals serving one eye. (a) A normal monkey. (b) A monkey that had been monocularly deprived for 22 months, starting at 2 weeks of age. The nondeprived eye had been injected, revealing expanded ocular dominance columns in layer IV. (Source: Wiesel, 1982, p. 585.) Description
The plasticity of ocular dominance columns does not occur throughout life, however. Hubel and Wiesel found that if the deprivation is begun later in life, these anatomical effects are not observed in layer IV. Thus, a critical period exists for this type of structural modification. In the macaque monkey, the critical period for anatomical plasticity in layer IV lasts until about 6 weeks of age. After this critical period, the LGN afferents apparently lose their capacity for growth and retraction and, in a sense, are cemented in place.
It is important to appreciate that there are many “critical periods” during development—specific times when developmental fate is influenced by the environment (Box 23.6). In the visual cortex, the end of the critical period for anatomical plasticity in layer IV does not spell the end of the influence of visual experience on cortical development. As we will now see, the synapses in striate cortex remain modifiable by experience until adolescence and beyond.
A critical period of development may be defined as a period of time in which intercellular communication alters a cell’s fate. The concept is usually credited to the experimental embryologist Hans Spemann. Working around the turn of the twentieth century, Spemann showed that transplantation of a piece of early embryo from one location to another often caused the “donor” tissue to take on the characteristics of the “host,” but only if transplantation had taken place during a well-defined time period. Once the transplanted tissue had been induced to change its developmental fate, the outcome could not be reversed. The intercellular communication that altered the physical characteristics (the phenotype) of the transplanted cells was shown to be mediated by both contact and chemical signals.
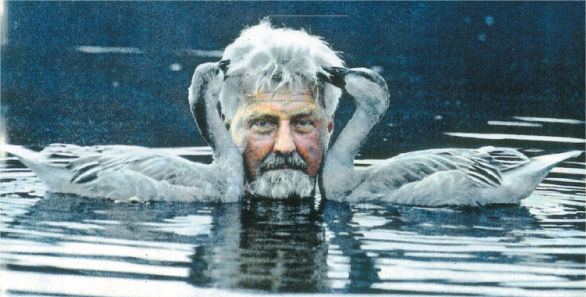
The term took on new significance with respect to brain development as a result of the work of Konrad Lorenz in the mid-1930s. Lorenz was interested in the process by which young graylag geese become socially attached to their mother. He discovered that in the absence of the mother, the young geese formed social attachment to a wide variety of moving objects, including Lorenz himself (Figure A). Once imprinted on an object, the goslings would follow it and behave toward it as if it were their mother. Lorenz used the word “imprinting” to suggest that this first visual image was somehow permanently etched in the young bird’s nervous system. Imprinting was also found to be limited to a finite window of time (the first 2 days after hatching), which Lorenz called the “critical period” for social attachment. Lorenz himself drew the analogy between this process of imprinting the external environment on the nervous system and the induction of tissue to change its developmental fate during critical periods of embryonic development.

Figure A Konrad Lorenz with graylag geese. (Source: Nina Leen/Time Pix.)
This work had a tremendous impact in the field of developmental psychology. The very terms imprinting and critical period suggested that changes in the behavioral phenotype caused by early sensory experience were permanent and irreversible later in life, much like the determination of tissue phenotype during embryonic development. Numerous studies extended the critical period concept to aspects of mammalian psychosocial development. The fascinating implication was that the fate of neurons and neural circuits in the brain depended on the experience of the animal during early postnatal life. It is not difficult to appreciate why research in this area took on social as well as scientific significance.
By necessity, the effects of experience on neuronal fate must be exercised by neural activity generated at the sensory epithelia and communicated by chemical synaptic transmission. The idea that synaptic activity can alter the fate of neuronal connectivity during CNS development first received solid neurobiological support from the study of mammalian visual system development, beginning with the experiments of Hubel and Wiesel. Using anatomical and neurophysiological methods, they found that visual experience (or lack thereof) was an important determinant of the state of connectivity in the central visual pathways, and that this environmental influence was restricted to a finite period of early postnatal life. A great deal of work has been devoted to the analysis of experience-dependent plasticity of connections in the visual system. Thus, the visual system is an excellent model for illustrating the principles of critical periods in nervous system development.
Although the streams of information from the two eyes are initially segregated, eventually they must be combined to make binocular vision possible. The anatomical basis for binocular vision in species with ocular dominance columns is the convergence of inputs from layer IV cells serving the right and left eyes onto cells in layer III. These are among the last connections to be specified during the development of the retinogeniculocortical pathway. Again, experience-dependent synaptic rearrangement plays a major role in this process.
Binocular connections are formed and modified under the influence of the visual environment during infancy and early childhood. Unlike segregation of eye-specific domains, which evidently depends on asynchronous patterns of activity spontaneously generated in the two eyes, the establishment of binocular receptive fields depends on correlated patterns of activity that arise from the two eyes as a consequence of vision. This has been demonstrated clearly by experiments that bring the patterns of activity from the two eyes out of register. For example, monocular deprivation, which replaces patterned activity in one eye with random activity, profoundly disrupts the binocular connections in striate cortex. Neurons that normally have binocular receptive fields instead respond only to stimulation of the nondeprived eye. This change in the binocular organization of the cortex is called an ocular dominance shift (Figure 23.22).

FIGURE 23.22 The ocular dominance shift. These ocular dominance histograms were constructed after electrophysiological recording from neurons in the striate cortex of (b) The same neuron, recorded after reopening the right eye following 17 hours of monocular deprivation. The eye that had been deprived is no longer able to evoke a response. (Source: Adapted from Mioche and Singer, 1989.) Description
These effects of monocular deprivation are not merely a passive reflection of the anatomical changes in layer IV discussed earlier. First, ocular dominance shifts can occur very rapidly, within hours of monocular deprivation, before any gross changes in axonal arbors can be detected (Figure 23.23). Such rapid changes reflect changes in the structure and molecular composition of synapses without a substantial remodeling of axons. Second, ocular dominance shifts can occur at ages well beyond the critical period for changes in LGN axonal arbors. Finally, ocular dominance shifts occur in all mammals that have binocular vision, not just those few species with ocular dominance columns. However, such ocular dominance plasticity also diminishes with age, disappearing in many species by the onset of adolescence (Figure 23.24).

FIGURE 23.23 Rapid shifts in ocular dominance. These histograms show the number of action potentials generated by a single neuron in the visual cortex of a young kitten over time. A visual stimulus was presented at the times indicated by the yellow bars, first to the left eye and then to the right eye. (a) Initial responses, before a period of monocular deprivation. Notice that although there is a slight ocular dominance favoring the right eye, each eye evokes a strong response. (b) The same neuron, recorded after reopening the right eye following 17 hours of monocular deprivation. The eye that had been deprived is no longer able to evoke a response. (Source: Adapted from Mioche and Singer, 1989.) Description

FIGURE 23.24 The critical period for plasticity of binocular connection. These graphs show the sensitivity of binocular connections to monocular deprivation (of the contralateral eye) initiated at different postnatal ages in a kitten. (a) The ocular dominance shifts recorded in kittens in response to 2 days of monocular deprivation. The line graph plots the decline in plasticity as a function of age, and the histograms show the corresponding ocular dominance shifts. (b) An estimate of the developmental decline of plasticity of binocular connections in humans. (Source: Adapted from Mower, 1991.) Description
The critical period of maximal ocular dominance plasticity coincides with the time of greatest growth of the head and eyes. Thus, it is believed that the plasticity of binocular connections is normally required for maintaining good binocular vision throughout this period of rapid growth. The hazard associated with such activity-dependent fine-tuning is that these connections are also highly susceptible to deprivation.
As you well know, a muscle that is not used regularly will atrophy and lose strength, thus the saying “Use it or lose it.” Is the disconnection of activity-deprived synapses simply a consequence of disuse? This does not appear to be the case in striate cortex, because the disconnection of a deprived eye input requires that the open-eye inputs be active. Rather, a process of binocular competition evidently occurs, whereby the inputs from the two eyes actively compete for synaptic control of the postsynaptic neuron. If the activity of the two eyes is correlated and equal in strength, the two inputs will be retained on the same cortical cell. However, if this balance is disrupted by depriving one eye, the more active input will somehow displace the deprived synapses or cause them to be less effective.
Competition in visual cortex is demonstrated by the effects of strabismus, a condition in which the eyes are not perfectly aligned (i.e., they are “cross-eyed” or “wall-eyed”). This common visual disorder in humans can result in the permanent loss of stereoscopic vision. Experimental strabismus is produced by surgically or optically misaligning the two eyes, thereby causing visually evoked patterns of activity from the two eyes to arrive out of sync in the cortex. If you press gently with a finger alongside one eye, you can see the consequences of misalignment of the two eyes. A total loss of binocular receptive fields occurs following a period of strabismus, even though the two eyes retain equal representation in the cortex (Figure 23.25). This is a clear demonstration that the disconnection of inputs from one eye results from competition rather than disuse (the two eyes are equally active, but for each cell, one “winner takes all”). If produced early enough, strabismus can also sharpen the segregation of ocular dominance columns in layer IV.

FIGURE 23.25 The effects of strabismus on cortical binocularity. (a) An ocular dominance histogram from a normal animal like that in Figure 23.22a. (b) In this case, the eyes have been brought out of alignment by cutting one of the eye muscles. After a brief period of strabismus, binocular cells are almost completely absent. The cells in visual cortex are driven by either the right or the left eye but not by both. Description
The changes in ocular dominance and binocularity after deprivation have clear behavioral consequences. An ocular dominance shift after monocular deprivation leaves the animal visually impaired in the deprived eye, and the loss of binocularity associated with strabismus completely eliminates stereoscopic depth perception. However, neither of these effects is irreversible if corrected early enough in the critical period. The clinical lesson is clear: Congenital cataracts or ocular misalignment must be corrected in early childhood, as soon as surgically feasible, to avoid permanent visual disability.
With increasing age, there appear to be additional constraints on the forms of activity that will cause modifications of cortical circuits. Before birth, spontaneously occurring bursts of retinal activity are sufficient to orchestrate aspects of address selection in the LGN and cortex. After birth, an interaction with the visual environment is of critical importance. However, even visually driven retinal activity may be insufficient for modifications of binocularity during this critical period. Increasing experimental evidence indicates that such modifications also require the animal to pay attention to visual stimuli and use vision to guide behavior. For example, modifications of binocularity following monocular stimulation do not occur when an animal is kept anesthetized, even though it is known that cortical neurons respond briskly to visual stimulation under this condition. These and related observations have led to the proposal that synaptic plasticity in the cortex requires the release of “enabling factors” that are linked to behavioral state (level of alertness, for example).
Some progress has been made in identifying the physical basis of these enabling factors. Recall that a number of diffuse modulatory systems innervate the cortex (see Chapter 15). These include the noradrenergic inputs from the locus coeruleus and the cholinergic inputs from the basal forebrain. The effects of monocular deprivation have been studied in animals in which these modulatory inputs to striate cortex were eliminated. This was found to cause a substantial impairment of ocular dominance plasticity, even though transmission in the retinogeniculocortical pathway was unaffected by the lesion (Figure 23.26).

FIGURE 23.26 The dependence of plasticity of binocular connections on modulatory inputs. (a) A midsagittal view of a cat brain, showing the trajectory of two types of modulatory input to striate cortex. One, colored green, arises in the locus coeruleus and uses NE as a transmitter, and the other, colored red, arises in the basal forebrain complex and uses ACh as a transmitter. The activity of both of these inputs is related to levels of attention and alertness. If these systems are intact, monocular deprivation will produce the expected ocular dominance shift, shown in the histogram at the right. (b) The result of depleting the cortex of these modulatory inputs. Monocular deprivation has little effect on the binocular connections in striate cortex. (Source: Adapted from Bear and Singer, 1986.) Description
ELEMENTARY MECHANISMS OF CORTICAL SYNAPTIC PLASTICITY
Synapses form in the absence of any electrical activity. However, as we have seen, the awakening of synaptic transmission during development plays a vital role in the final refinement of connections. Based on the analysis of experience-dependent plasticity in the visual cortex and elsewhere, we can formulate two simple “rules” for synaptic modification:
- When the presynaptic axon is active and, at the same time, the postsynaptic neuron is strongly activated under the influence of other inputs, then the synapse formed by the presynaptic axon is strengthened. This is another way of stating Hebb’s hypothesis, mentioned previously. In other words, neurons that fire together wire together.
- When the presynaptic axon is active and, at the same time, the postsynaptic neuron is weakly activated by other inputs, then the synapse formed by the presynaptic axon is weakened. In other words, neurons that fire out of sync lose their link.
The key appears to be correlation. Remember that in most locations in the CNS, including the visual cortex, a single synapse has little influence on the firing rate of the postsynaptic neuron. To be “heard,” the activity of the synapse must be correlated with the activity of many other inputs converging on the same postsynaptic neuron. When the activity of the synapse consistently correlates with a strong postsynaptic response (and, therefore, with the activity of many other inputs), the synapse is retained and strengthened. When synaptic activity consistently fails to correlate with a strong postsynaptic response, the synapse is weakened and eliminated. In this way, synapses are “validated” based on their ability to participate in the firing of their postsynaptic partner.
What mechanisms underlie such correlation-based synaptic modifications? The answer requires knowledge of the mechanisms of excitatory synaptic transmission in the brain.
Excitatory Synaptic Transmission in the Immature Visual System
Glutamate is the transmitter at all of the modifiable synapses we have discussed (retinogeniculate, geniculocortical, and corticocortical), and it activates several subtypes of postsynaptic receptors. Recall from Chapter 6 that neurotransmitter receptors may be classified into two broad categories: G-protein-coupled, or metabotropic, receptors; and transmitter-gated ion channels (Figure 23.27). Postsynaptic glutamate-gated ion channels allow the passage of positively charged ions into the postsynaptic cell and may be further classified as either AMPA receptors or NMDA receptors. AMPA and NMDA receptors are colocalized at many synapses.

FIGURE 23.27 Glutamate receptors at excitatory synapses. Description
An NMDA receptor has two unusual features that distinguish it from an AMPA receptor (Figure 23.28). First, NMDA receptor conductance is voltage-gated, owing to the action of Mg2+ at the channel. At the resting membrane potential, the inward current through the NMDA receptor is interrupted by the movement of Mg2+ into the channel, where they become lodged. As the membrane is depolarized, however, the Mg2+ block is displaced from the channel, and current is free to pass into the cell. Thus, substantial current through the NMDA receptor channel requires the concurrent release of glutamate by the presynaptic terminal and depolarization of the postsynaptic membrane. The other distinguishing feature of an NMDA receptor is that its channel conducts Ca2+. Therefore, the magnitude of the Ca2+ flux passing through the NMDA receptor channel specifically signals the level of pre- and postsynaptic coactivation.

FIGURE 23.28 NMDA receptors activated by simultaneous presynaptic and postsynaptic activity. (a) Presynaptic activation causes the release of glutamate, which acts on postsynaptic AMPA receptors and NMDA receptors. At the negative resting membrane potential, the NMDA receptors pass little ionic current because they are blocked with Mg2+. (b) If glutamate release coincides with depolarization sufficient to displace the Mg2+, then Ca2+ will enter the postsynaptic neuron via the NMDA receptor. Hebbian modification could be explained if the Ca2+ admitted by the NMDA receptor were to trigger enhanced synaptic effectiveness. Description
Curiously, when a glutamatergic synapse first forms, only NMDA receptors appear in the postsynaptic membrane. As a consequence, released glutamate at a single synapse evokes little response when the postsynaptic membrane is at the resting potential. Such “silent” synapses announce their presence only when enough of them are active at the same time to cause sufficient depolarization to relieve the Mg2+ block of the NMDA receptor channels. In other words, “silent” synapses “speak” only when there is highly correlated activity, the necessary condition for synaptic enhancement during development.
Perhaps NMDA receptors serve as Hebbian detectors of simultaneous presynaptic and postsynaptic activity, and Ca2+ entry through the NMDA receptor channel triggers the biochemical mechanisms that modify synaptic effectiveness. Tests of this hypothesis have been performed by electrically stimulating axons to monitor the strength of synaptic transmission before and after an episode of strong NMDA receptor activation (Figure 23.29a, b). Results consistently indicate that a consequence of strong NMDA receptor activation is a strengthening of synaptic transmission called long-term potentiation (LTP).

FIGURE 23.29 The lasting synaptic effects of strong NMDA receptor activation. (a) An experiment in which presynaptic axons are stimulated electrically to evoke an action potential and microelectrode recordings of the resulting EPSPs are made from the postsynaptic neuron. (b) This graph shows how the strength of synaptic transmission is changed by strong NMDA receptor activation. The conditioning stimulation consists of depolarizing the postsynaptic neuron via current injection through the microelectrode, at the same time that the synapses are repeatedly stimulated. LTP is the resulting enhancement of synaptic transmission. (c) LTP at many synapses is associated with the insertion of AMPA receptors into synapses that previously had none. The circled numbers correspond to the times before and after LTP in part b. Description
What accounts for LTP of the synapse? One consequence of the strong NMDA receptor activation, and the resulting flood of Ca2+ into the postsynaptic dendrite, is the insertion of new AMPA receptors into the synaptic membrane (Figure 23.29c). Such “AMPAfication” of the synapse makes transmission stronger. In addition to this change in the complement of glutamate receptors, recent evidence suggests that the synapses can actually split in half following LTP induction, forming two different sites of synaptic contact.
Cortical neurons grown in a tissue culture form synapses with one another and become electrically active. The immature synapses contain clusters of NMDA receptors but few AMPA receptors. Consistent with the idea that LTP is a mechanism for synaptic maturation, electrically active synapses gain AMPA receptors over the course of development in cell culture. This change fails to occur, however, if NMDA receptors are blocked with an antagonist. Thus, the strong activation of NMDA receptors that occurs when pre- and postsynaptic neurons fire together appears to account, at least in part, for why they wire together during visual system development. (We will discuss LTP and its molecular basis further in Chapter 25.)
Neurons that fire out of sync lose their link. In the case of strabismus, for example, synapses whose activity fails to correlate with that of the postsynaptic cell are weakened and then eliminated. Similarly, during monocular deprivation, the residual activity in the deprived retina fails to correlate with the responses evoked in cortical neurons by the seeing eye, and the deprived-eye synapses are weakened. What mechanism accounts for this form of synaptic plasticity?
In principle, weak coincidences could be signaled by lower levels of NMDA receptor activation and less Ca2+ influx. Indeed, experiments suggest that the lower level of Ca2+ admitted under these conditions triggers an opposite form of synaptic plasticity, long-term depression (LTD), whereby the active synapses are decreased in effectiveness. One consequence of LTD induction is a loss of AMPA receptors from the synapse, and one long-term consequence of LTD is synapse elimination. Recall that at the neuromuscular junction, the loss of postsynaptic receptors also stimulates the physical retraction of the presynaptic axon.
Studies in the visual cortex of rats and mice have confirmed that AMPA receptors are lost from the surface of visual cortical neurons during monocular deprivation. This change, like the loss of visual responsiveness, requires residual activity in the deprived retina and activation of cortical NMDA receptors. Furthermore, selective inhibition of NMDA receptor-dependent AMPA receptor internalization prevents the ocular dominance shift after monocular deprivation. Thus, it is possible to reconstruct, at least in rough outline, what happens when an animal is monocularly deprived by closing one eyelid (Figure 23.30). Eyelid closure prevents proper image formation on the retina; therefore, it replaces well-correlated retinal ganglion cell activity with less-correlated activity that can be considered as static or noise. This activity, presynaptic to neurons in visual cortex, rarely correlates with a strong postsynaptic response and therefore only weakly activates NMDA receptors. The modest entry of Ca2+ through the NMDA receptors initiates a cascade of molecular events that results in the removal of AMPA receptors from the visually deprived synapse. With fewer AMPA receptors, these synapses lose influence over responses of cortical neurons.

FIGURE 23.30 How brief monocular deprivation leads to reduced visual responsiveness. Closing one eye replaces well-correlated presynaptic action potentials (denoted as yellow dots) with less correlated “noise.” In the visual cortex, illustrated here, the noise weakly activates NMDA receptors, and the resulting modest increases in Ca2+ cause internalization of AMPA receptors (left enlargement). On the other hand, the well-correlated activity strongly depolarizes the postsynaptic neurons and stimulates large increases in Ca2+, which stimulate AMPA receptor delivery to the synapse (right enlargement). Description
How are presynaptic and postsynaptic correlations used to refine synaptic connections in the visual system? The data accumulated thus far suggest that the maintenance of some connections formed during development depends on their success in evoking an NMDA receptor-mediated response beyond some threshold level. Failure to achieve this threshold leads to disconnection. Both processes depend on activity originating in the retina, NMDA receptor activation, and postsynaptic Ca2+ entry.
Although plasticity of visual connections persists in the adult brain, the range over which this plasticity occurs constricts with increasing age. Early in development, gross rearrangements of axonal arbors are possible, while in the adult, plasticity appears to be restricted to local changes in synaptic efficacy. In addition, the adequate stimulus for evoking a change also appears to be increasingly constrained as the brain matures. An obvious example is the fact that simply patching one eye will cause a profound alteration in the binocular connections of the superficial layers during infancy, but by adolescence, this type of experience typically fails to cause a lasting alteration in cortical circuitry.
Why do critical periods end? Here are three current hypotheses:
- Plasticity diminishes when axon growth ceases. We’ve seen that there is a period of several weeks when the geniculate arbors can contract and expand within layer IV under the influence of visual experience. Thus, a factor that limits the critical period in layer IV could be a loss of the capability for changes in axon length, which in turn may be due to changes in the extracellular matrix or the myelination of the axons by oligodendroglia.
- Plasticity diminishes when synaptic transmission matures. The end of a critical period may reflect changes in the elementary mechanisms of synaptic plasticity. Evidence indicates that glutamate receptors change during postnatal development. For example, it has been shown that the activation of metabotropic glutamate receptors stimulates very different postsynaptic responses in striate cortex during the critical period when binocular connections are most susceptible to monocular deprivation. In addition, the molecular composition and properties of NMDA receptors change during the course of the critical period. Accordingly, the properties of LTP and LTD vary with age, and at some synapses, they seem to disappear altogether.
- Plasticity diminishes when cortical activation is constrained. As development proceeds, certain types of activity may be filtered by successive synaptic relays to the point where they no longer activate NMDA receptors, or other elementary mechanisms, sufficiently to trigger plasticity. As mentioned previously, ACh and NE facilitate synaptic plasticity in the superficial cortical layers, perhaps simply by enhancing polysynaptic intracortical transmission. A decline in the effectiveness of these neurotransmitters, or a change in the conditions under which they are released, may contribute to the decline in plasticity. Indeed, evidence suggests that supplementing the adult cortex with NE can restore some degree of modifiability.
Evidence also indicates that intrinsic inhibitory circuitry is late to mature in the striate cortex. Consequently, patterns of activity that may have gained access to modifiable synapses in superficial layers early in postnatal development might be tempered by inhibition in the adult. Consistent with the idea that inhibition regulates the duration of the critical period, recent research in mice has shown that genetic manipulations that accelerate the maturation of GABAergic inhibition in visual cortex also shorten the duration of the critical period for ocular dominance plasticity. Conversely, manipulations that slow the development of inhibition can prolong the critical period.
The question of why critical periods end is important. Synaptic modification and rewiring of circuitry provide the capacity for some recovery of function after CNS damage. However, such recovery is disappointingly limited in the adult brain. On the other hand, the recovery of function after brain injury can be nearly 100% in the immature nervous system when synaptic rearrangements are widespread. Thus, an understanding of how plasticity is regulated during normal development may suggest ways to promote recovery from damage later in life.
We have seen that the generation of circuitry during brain development occurs mostly prior to birth and is guided by cell-to-cell communication through physical contact and by diffusible chemical signals. Nonetheless, while most of the “wires” find their proper place before birth, the final refinement of synaptic connections, particularly in the cortex, occurs during infancy and is influenced by the sensory environment. Although we have focused on the visual system, other sensory and motor systems are also readily modified by the environment during critical periods of early childhood. In this way, our brain is a product not only of our genes but also of the world in which we grow up.
The end of developmental critical periods does not signify an end to experience-dependent synaptic plasticity in the brain. Indeed, the environment must modify the brain throughout life, or there would be no basis for memory formation. In the next two chapters, we’ll explore the neurobiology of learning and memory. We will see that the mechanisms of synaptic plasticity proposed to account for learning bear a close resemblance to those believed to play a role in synaptic rearrangement during development.
Elementary Mechanisms of Cortical Synaptic Plasticity
1. What do we mean by saying that the cortex develops “inside out”?
2. Describe the three phases of pathway formation. In which phase (or phases) does neural activity play a role?
3. What are three ways that Ca2+ is thought to contribute to the processes of synapse formation and rearrangement?
4. How are the elimination of polyneuronal innervation of a muscle fiber and the segregation of retinal terminals in the LGN similar? How do these processes differ?
5. Not long ago, when a child was born with strabismus, the defect was usually not corrected until after adolescence. Today, surgical correction is always attempted during early childhood. Why? How does strabismus affect the connections in the brain, and how does it affect vision?
6. Children are often able to learn several languages apparently without effort, while most adults must struggle to master a second language. From what you know about brain development, why would this be true?
7. Neurons that fire out of sync lose their link. How does this occur?
Cooke SF, Bear MF. 2014. How the mechanisms of long-term synaptic potentiation and depression serve experience-dependent plasticity in primary visual cortex. Philosophical Transactions of the Royal Society of London. Series B, Biological sciences 369, 20130284.
Dehay C, Kennedy H. 2007. Cell-cycle control and cortical development. Nature Reviews Neuroscience 8(6):438–450.
Goda Y, Davis GW. 2003. Mechanisms of synapse assembly and disassembly. Neuron 40:243–264.
Katz LC, Crowley JC. 2002. Development of cortical circuits: lessons from ocular dominance columns. Nature Reviews Neuroscience 3(1):34–42.
McLaughlin T, O’Leary DDM. 2005. Molecular gradients and development of retinotopic maps. Annual Reviews of Neuroscience 28:327–355.
Price DJ, Jarman AP, Mason JO, Kind PC 2011. Building Brains: An Introduction to Neural Development. Boston: Wiley-Blackwell.
Wiesel T. 1982. Postnatal development of the visual cortex and the influence of the environment. Nature 299:583–592.
Additional figures