Introduction
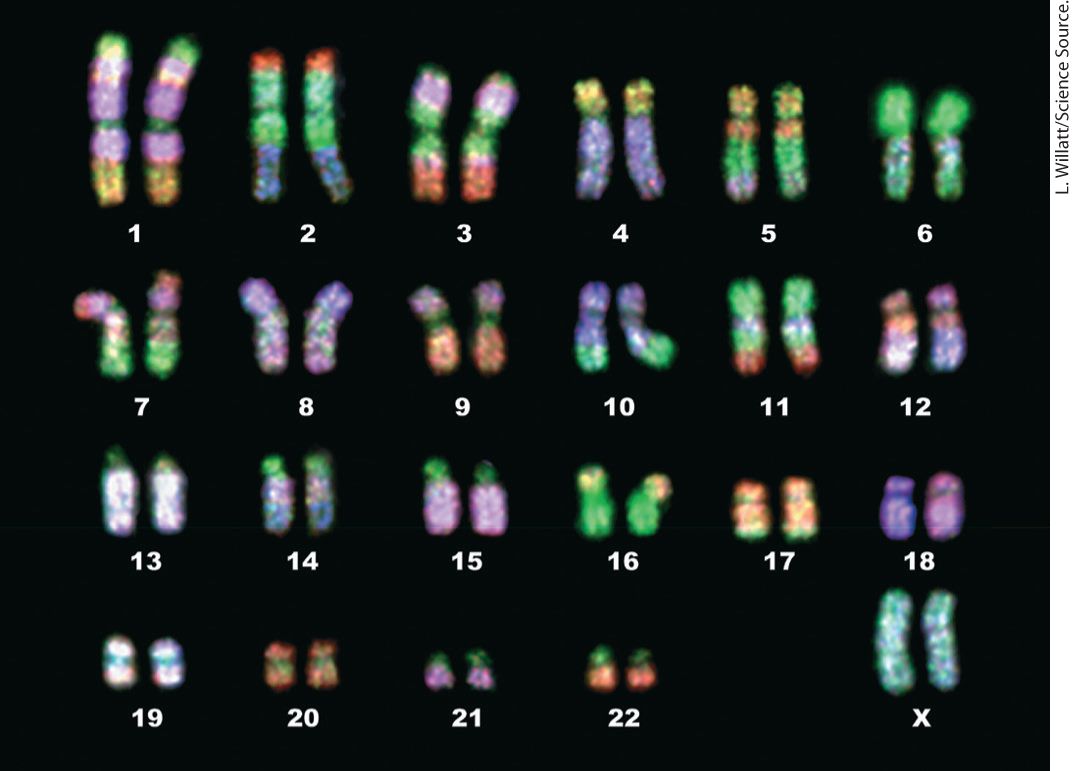
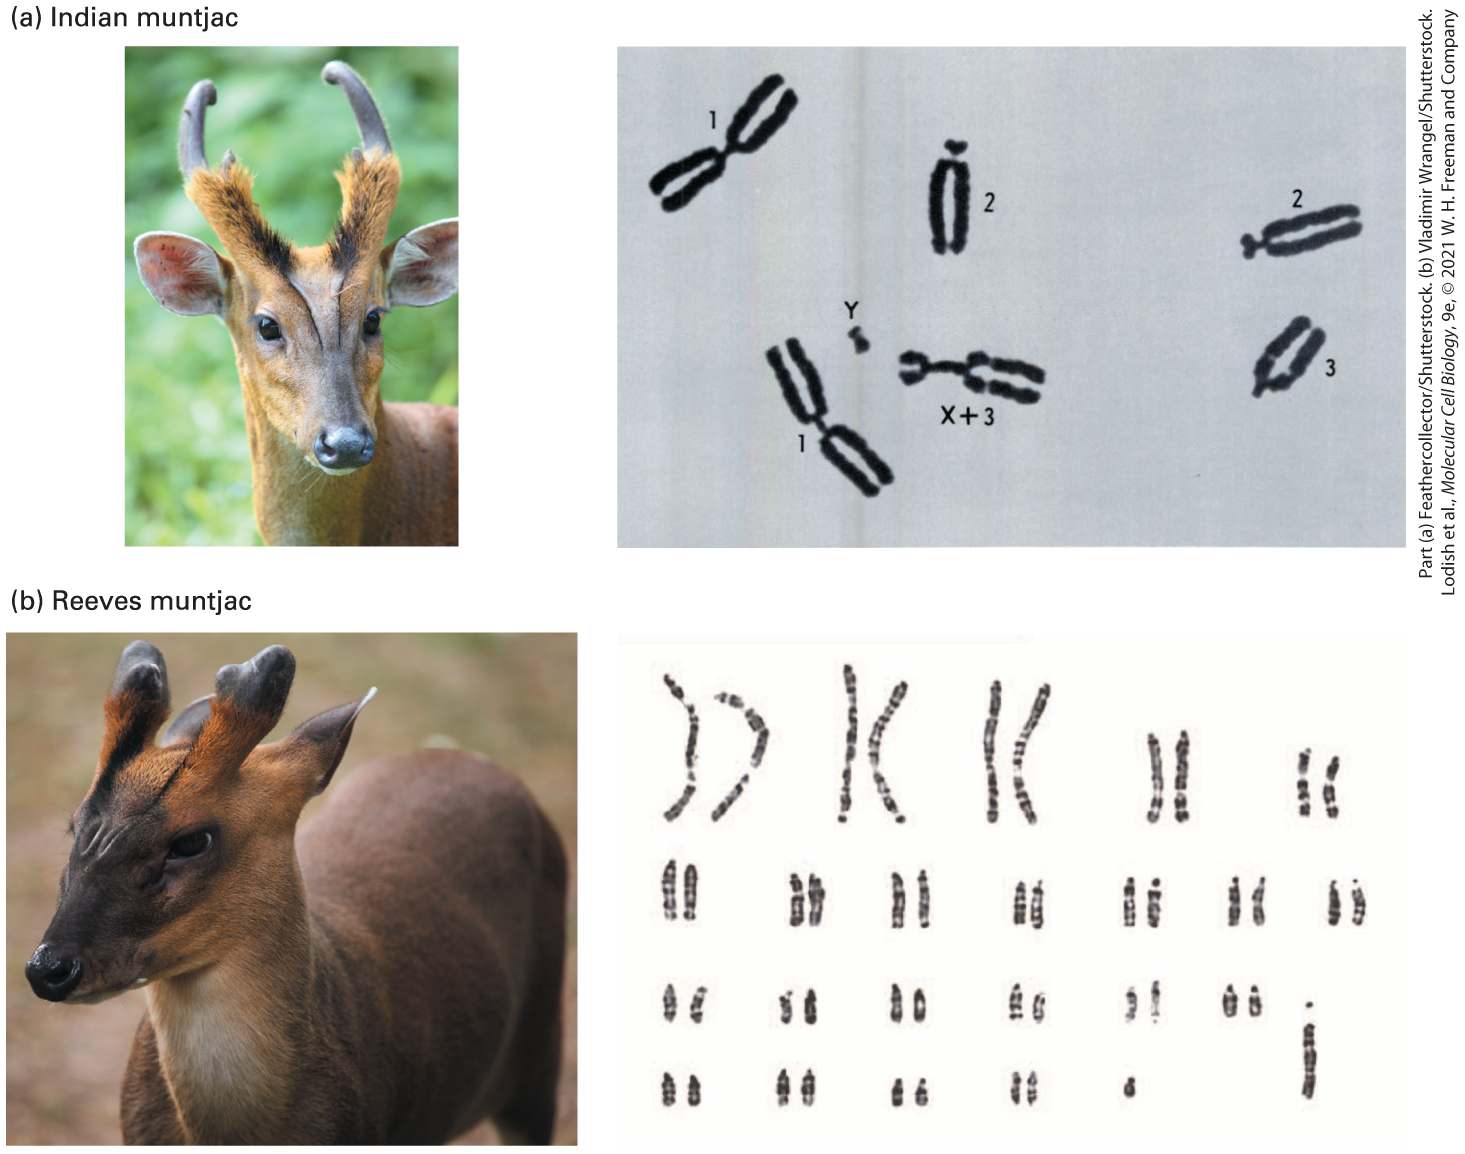
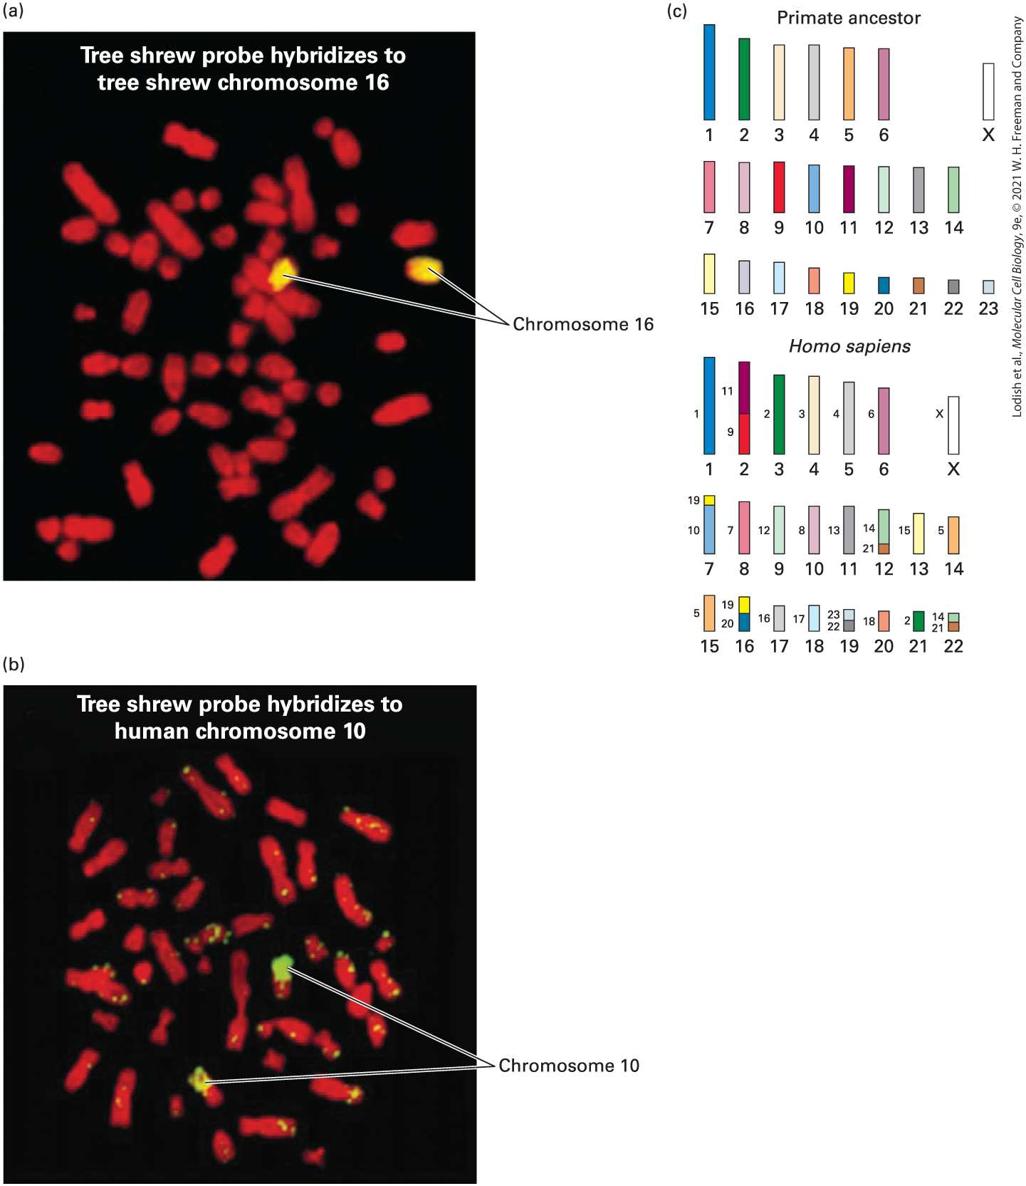
Chapter 7 Genes, Chromatin, and Chromosomes These brightly colored FISH-painted chromosomes are not only beautiful, but also useful in revealing chromosome anomalies and in comparing karyotypes of different species.
7.2 Chromosomal Organization of Genes and Noncoding DNA
7.4 Structural Organization of Eukaryotic Chromatin and Chromosomes
7.5 Morphology and Functional Elements of Eukaryotic Chromosomes In previous chapters, we learned how the structure and composition of proteins allow them to perform a wide variety of cellular functions. We also examined another vital component of cells, nucleic acids, and the process by which information encoded in the sequence of DNA is translated into protein. In this chapter, our focus again is on DNA and proteins as we consider the characteristics of eukaryotic nuclear genomes. The chapter is organized around two major topics: (1) the organization and evolution of genetic information and (2) the structure and function of chromatin and chromosomes; the former being the complex of nuclear DNA and abundant nuclear proteins, and the latter being those structures that condense and become visible by light microscopy during mitosis. By the beginning of the twenty-first century, biologists had complete genome sequences of hundreds of viruses, scores of bacteria, and one unicellular eukaryote, the budding yeast Saccharomyces cerevisiae. Today the vast majority of the genomic sequence is also known for the fission yeast Schizosaccharomyces pombe; many other fungi; the model plant
organism Arabadopsis thaliana; multiple other plants; multicellular animals (metazoans), including the roundworm Caenorhabditis elegans, the fruit fly Drosophila melanogaster, mice, humans, and hundreds of other vertebrates and invertebrates, with at least one representative from each of the 35 or so metazoan phyla. Detailed analysis of these sequencing data has led to insights into evolution, genome organization, and gene function. It has also allowed researchers to identify previously unknown genes and to estimate the total number of protein-coding genes in each of the sequenced genomes. Comparisons among gene sequences often provide insight into possible functions of newly identified genes. It was a surprise to many researchers when genomic sequencing revealed that large portions of the genomes of metazoans and plants do not encode mRNAs or any other RNAs required by the organism. Remarkably, about 98.5 percent of human chromosomal DNA is noncoding DNA! The noncoding DNA includes transcription regulatory sequences recognized and bound by proteins that regulate transcription of genes within tens to hundreds of kb away in the linear DNA sequence. However, the vast majority of noncoding DNA in multicellular organisms includes many regions that do not seem to be involved directly in gene control or DNA replication. A large fraction of noncoding DNA in the genomes of individual organisms (∼50 percent for humans) includes many regions that are similar but not identical in sequence to one another. There is enough variation within this repetitive DNA among individuals that every person can be distinguished by a unique DNA fingerprint based on these sequence variations. Moreover, the location in the genome of some repetitive DNA sequences varies among different individuals of the same
species. At one time, all noncoding DNA was collectively termed junk DNA and was considered to serve no purpose. We now understand the evolutionary basis of this noncoding DNA and its variation in location among individuals. Cellular genomes harbor transposable (mobile) DNA elements that can copy themselves and move to new locations throughout the genome. Although most transposable DNA elements seem to have little function in the life cycle of an individual organism, over evolutionary time they have helped to shape our genomes and contributed to the rapid evolution of multicellular organisms. A eukaryotic genome is made up of very long molecules of DNA. For example, the 46 chromosomes in a human cell contain about 2 m of DNA (which is the height of someone six and a half feet tall). All of this DNA must be contained within a nucleus whose diameter is less than 20 μm; a compaction ratio of greater than 100,000 to 1. Specialized proteins associated with nuclear DNA fold and organize the DNA so that it fits into a nucleus. And yet, at the same time, any given portion of this highly compacted DNA can be accessed readily for transcription, replication, and repair of damage without the long DNA molecules becoming tangled or broken. Furthermore, the integrity of DNA must be maintained during the process of cell division when the entire genome is replicated and partitioned into daughter cells. In eukaryotes, the complex of DNA and the proteins that bind and organize the DNA is called chromatin. During mitosis, chromatin can be visualized by light microscopy as individual chromosomes. As we will see in this and the following chapter, the organization of DNA into chromatin enables mechanisms of gene regulation that are not available in bacteria.
In the first three sections of this chapter, we walk through the landscape of eukaryotic genes and genomes. First we discuss the structure of eukaryotic genes and the complexities that arise in multicellular organisms from processing mRNA precursors into alternatively spliced mRNAs. Next we discuss the main sequence classes of eukaryotic DNA, including the special properties of transposable DNA elements and how they have shaped contemporary genomes. The final two sections of the chapter address how DNA is physically organized in eukaryotic cells. We consider how DNA and histone proteins are packaged into the compact complexes called nucleosomes, we describe the large-scale structure of chromosomes, and we look at the functional elements required for chromosome duplication and segregation. Figure 7-1 provides an overview of these interrelated subjects. The understanding of genes, chromatin, and chromosomes gained in this chapter will prepare you to explore in the following two chapters how the synthesis and amount of each protein and functional RNA in a cell is regulated.
FIGURE 7-1 Overview of the structure of genes and chromosomes. DNA of multicellular eukaryotes consists of both unique and repeated sequences. Each chromosome consists of a single, long molecule of DNA (as long as 280 Mb in humans), organized into nucleosomes that fold and interact to generate various levels of chromatin condensation. This compaction process is carried out by the histone and nonhistone proteins that interact with the DNA molecule. The combination of a DNA molecule, histone proteins, and nonhistone proteins is called chromatin. Each chromosome occupies its own territory in the nucleus (note the blue, purple, and red chromosomes visible in the nucleus). Description A double helical D N A at the bottom extends to form a structure labeled, beads on a string comprising nucleosomes wound by histone H 1. This structure condenses to form a 5 to 24 nanometer chromatin fiber followed by distinct looped structures labeled
topological domains. These undergo further chromatin condensation to form the interphase chromosome which is labeled in the chromosome territory within the nucleus. The major types of D N A sequence are as follows: single-copy genes, gene families, tandemly repeated genes, exons and introns, intergenic D N A, mobile D N A elements, and simple-sequence D N A.
7.1 Eukaryotic Gene Structure and Organization
7.1 Eukaryotic Gene Structure and Organization In molecular terms, a gene is commonly defined as the entire nucleic acid sequence that is necessary for the synthesis of a functional gene product (polypeptide or RNA). According to this definition, a gene includes more than the nucleotides encoding an amino acid sequence or a functional RNA, which is referred to as the coding region. A gene also includes all of the DNA sequences required for synthesis of a particular RNA transcript, no matter where those sequences are located in relation to the coding region. For example, in genes of multicellular animals, transcriptioncontrol regions known as enhancers can lie 50 kb or more from the coding region. As we learned in Chapter 5, other critical noncoding regions in eukaryotic genes include promoters, which determine where transcription initiates on a DNA template; poly(A) sites that specify cleavage and polyadenylation, generating the -end of an mRNA; and splice sites where exons in pre-mRNA molecules are spliced together (see Figure 5-27). Since these noncoding regions control transcription initiation and RNA processing, mutations in these sequences affect the normal expression and function of RNAs, producing distinct phenotypes in mutant organisms, even though the coding regions of the associated genes are normal. We examine these various transcription-control elements and mechanisms regulating post-transcriptional RNA processing in greater detail in Chapters 8 and 9.
Although most well-defined genes are transcribed into mRNAs that encode proteins, some DNA sequences are transcribed into important functional RNAs that do not encode proteins [e.g., tRNAs and rRNAs, described in Chapters 5 and 9; miRNAs and siRNAs that regulate mRNA translation and stability, discussed in Chapter 9; and long noncoding RNAs (lncRNAs) that regulate transcription, discussed in Chapter 8]. Because the DNA sequences that encode these functional RNAs can cause specific phenotypes when they are mutated, these DNA regions also are generally referred to as genes, even though their final products are RNA molecules and not proteins. In this section, we will examine the structure of genes in eukaryotes and how that structure influences gene expression and evolution. The nucleotide sequences within the chromosomal DNA of multicellular organisms can be classified on the basis of their functions and the number of times closely related sequences are found in the genomes of individuals of the same species, as shown in Table 7-1 and described in subsequent sections of the chapter.
TABLE 7-1 • Major Classes of Nuclear Eukaryotic DNA and Their Representation in the Human Genome Class Length Copy Number in Human Genome Fraction of Human Genome (%) Protein-coding genes 0.5– kb ∼19,000 ∼40 (2.0 ) Long noncoding RNA 0.2–50 ∼10,000 ∼15 i ii iii
genes kb (0.9 ) Tandemly repeated genes U2 snRNA 6.1 kb ∼20 rRNAs 43 kb ∼300 0.4 Repetitive DNA Simple-sequence DNA 1–500 bp Variable ∼6 Interspersed repeats (mobile DNA elements) DNA transposons 2–3 kb 300,000 LTR retrotransposons 6–11 kb 440,000 Non-LTR retrotransposons LINEs 6–8 kb 860,000 SINEs 100– 400 bp 1,600,000 Processed pseudogenes Variable ∼12,500 ∼0.4 Intergenic regions Variable n.a. ∼25 The sum of “Fraction of the Human Genome (%)” totals more than 100% because mobile DNA elements are counted twice: once to show the different classes of human mobile DNA iii iv iv i
Most Genes of Multicellular Eukaryotes Contain Introns and Produce mRNAs Encoding Single Proteins
elements; and second as part of the intergenic regions and protein-coding genes where they are located in introns and untranslated regions of terminal exons. Complete transcription units including exons and introns. Total length of all exons. Protein-coding regions total 1.2 percent of the genome. Length of each repeat in a tandemly repeated sequence. SOURCE: Data from International Human Genome Sequencing Consortium, 2001, Nature 409:860 and 2004, Nature 431:931. Most Genes of Multicellular Eukaryotes Contain Introns and Produce mRNAs Encoding Single Proteins Many bacterial mRNAs (e.g., the mRNA encoded by the trp operon) include the coding region for several proteins that function together in a biological process. Such mRNAs are said to be polycistronic. (A cistron is a genetic unit encoding a single polypeptide.) In contrast, most eukaryotic mRNAs are monocistronic; that is, each mRNA molecule encodes a single protein. This difference between polycistronic mRNAs in bacteria and monocistronic mRNAs in eukaryotes correlates with a fundamental difference in their translation mechanisms. Within a bacterial polycistronic mRNA, a ribosome-binding site is located near the start site for each of the protein-coding regions, or cistrons, in the mRNA. Translation initiation can begin at any of these multiple internal sites, ii iii iv
producing alternative proteins from one polycistronic mRNA molecule. In most eukaryotic mRNAs, however, the cap directs ribosome binding, and translation begins at the closest AUG start codon to the cap. As a result, translation of most eukaryotic mRNAs begins only at this site, even if, as for many viral mRNAs, the mRNA molecule contains additional open reading frames beginning with an AUG initiation codon downstream from the first open reading frame that is used in that mRNA. The term primary transcript refers to the initial RNA transcript from a gene before it is modified by RNA splicing or addition of a poly(A) tail. In many cases, the primary transcripts of eukaryotic protein-coding genes are processed into a single type of mRNA, which is translated to give a single type of polypeptide (see Figure 5-27). However, unlike bacterial and yeast genes, which generally lack introns, most genes in multicellular animals and plants contain introns, which are removed during RNA processing in the nucleus before the fully processed mRNA is exported to the cytosoplasm for translation. In many cases, the introns in a gene are considerably longer than the exons. The median intron length in human genes is 3.3 kb. However, some are much longer: the longest known human intron is 17,106 bp and lies within the titin gene, which encodes a very large structural protein in muscle cells (see Chapter 17). In comparison, most exons in human genes contain only 50–200 bp. The typical human gene encoding an average-sized protein is about 50,000 bp long, but more than 95 percent of that sequence consists of introns and flanking noncoding and regions.
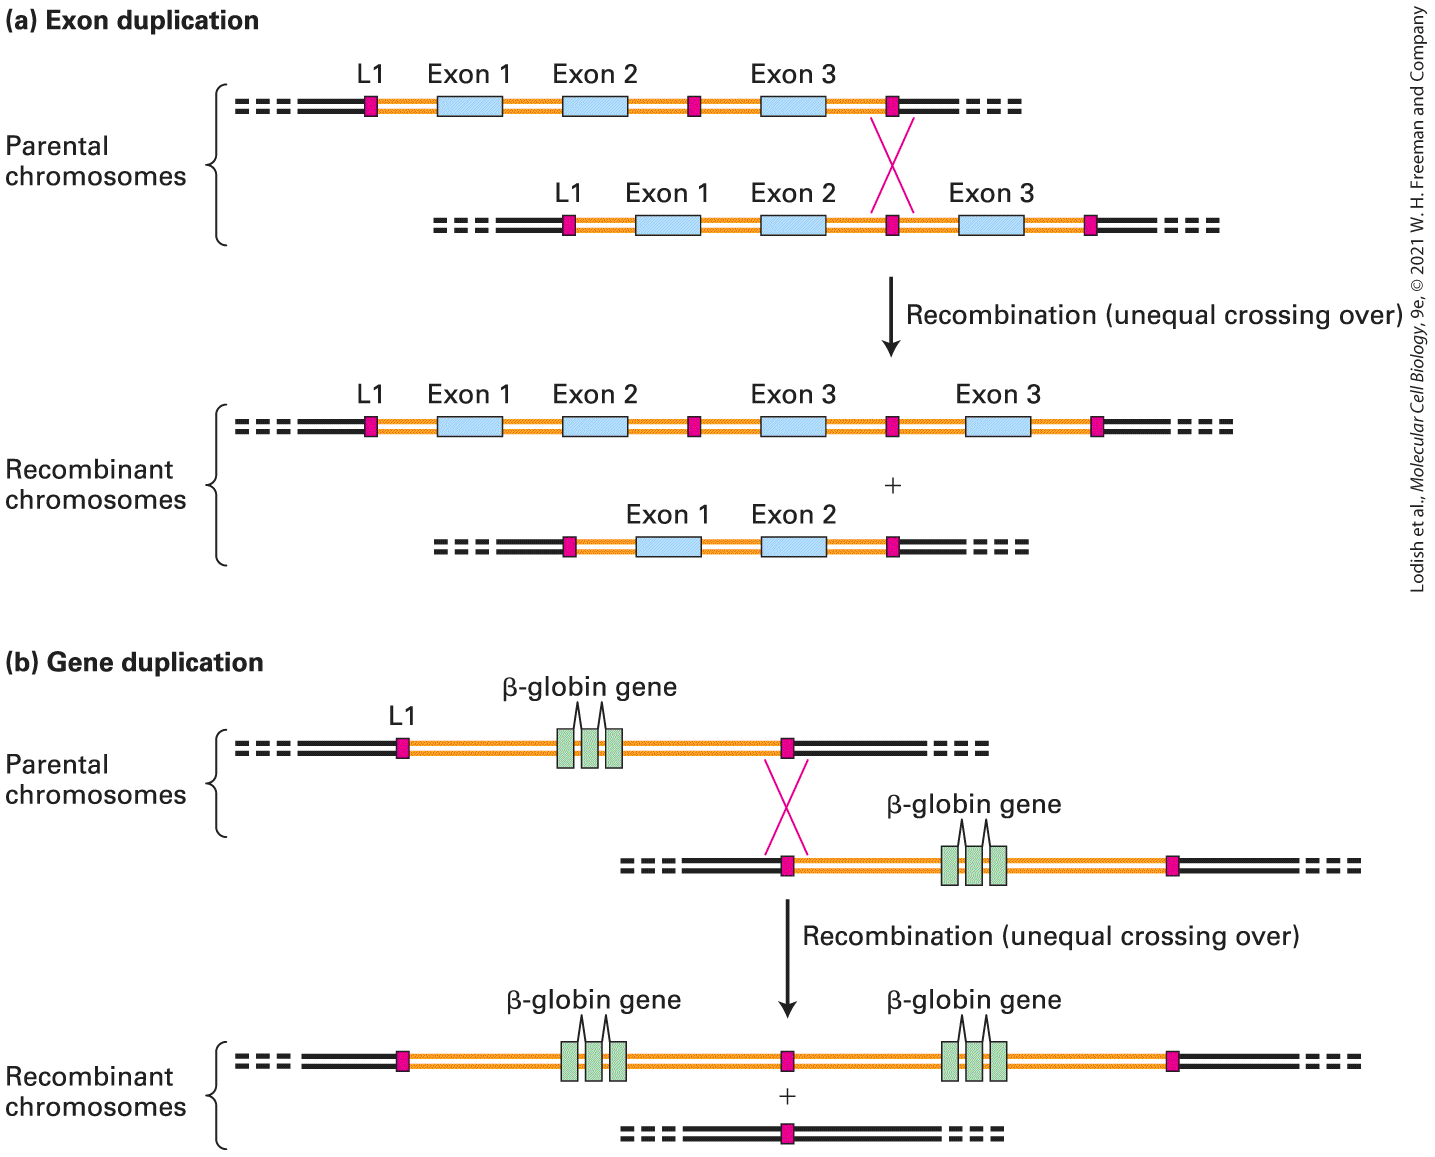
Many large proteins with required functions in multicellular organisms have repeated domains encoded by repeats of similar exons separated by introns of variable length. An example is fibronectin, a component of the extracellular matrix. The fibronectin gene contains multiple copies of five types of exons (see Figure 5-28). Such genes evolved by tandem duplication of the DNA encoding the repeated exon, probably by unequal crossing over during meiosis, as shown in Figure 7-2a.
FIGURE 7-2 Exon and gene duplication. (a) Exon duplication often results from unequal crossing over during meiosis. Each parental chromosome (top) contains one ancestral gene containing three exons (blue) and two introns (orange). Homologous noncoding sequences called L1 long interspersed elements (red) lie and of the gene as well as in the intron
Simple and Complex Transcription Units Are Found in Eukaryotic Genomes
between exons 2 and 3. As we will see later in the chapter, L1 elements have been repeatedly transposed to new sites in the genome over the course of human evolution, so that all chromosomes are peppered with them. The parental chromosomes are shown displaced relative to each other, so that a pair of the L1 elements are aligned. Homologous recombination between these L1 elements as shown would generate one recombinant chromosome in which the gene now has four exons (two copies of exon 3) and one chromosome in which the gene is missing exon 3. (b) The same process can generate duplications of entire genes. Each parental chromosome (top) contains one ancestral β-globin gene. After unequal recombination between L1 elements, subsequent independent mutations in the resulting duplicated genes could lead to slight changes in sequence that might result in slightly different functional properties of the encoded proteins. Unequal crossing over can also result from rare recombinations between unrelated sequences. See D. H. A. Fitch et al., 1991, Proc. Nat’l. Acad. Sci. USA 88:7396. Description In illustration a, parental chromosomes undergo crossing over during meiosis. Genes contain many L 1 long interspersed elements around exons. Unequal crossing over at the L 1 points leads to recombinant genes with repeated or lost exons. In illustration b, genes can be duplicated by unequal crossing over if the L 1 element at the end of the gene is used as the cross point at the start of the gene in the other parental chromosome. Two recombinant chromosomes result; one contains two copies of the gene, whereas, in the other, the gene has been deleted. Simple and Complex Transcription Units Are Found in Eukaryotic Genomes The cluster of genes that form a bacterial operon constitutes a single transcription unit, which is transcribed from a specific promoter in the
DNA sequence to a termination site, producing a single primary transcript. As a consequence, genes and transcription units are often distinguishable in prokaryotes, since a single transcription unit contains several genes when they are part of an operon. In contrast, most eukaryotic genes are expressed from separate transcription units, so that each mRNA is translated into a single protein. Eukaryotic transcription units are classified into two types — simple and complex — depending on the fate of the primary transcript, that is, the newly transcribed RNA before it is subjected to any modifications. A simple transcription unit contains the protein-encoding exons separated by introns, and upstream control regions (Figure 7-3a). The primary transcript produced from a simple transcription unit is processed to yield a single type of mRNA, encoding a single protein (Figure 7-3a). In humans, simple transcription units, such as the one encoding β-globin, are rare. Approximately 95 percent of human transcription units are complex. Complex transcription units produce primary RNA transcripts that can be processed in more than one way, leading to formation of mRNAs containing different combinations of exons (see Figure 7-3b). Each alternative mRNA is translated into a single polypeptide, with translation usually initiating at the first AUG in the mRNA.
FIGURE 7-3 Simple and complex eukaryotic transcription units. (a) A simple transcription unit includes a region that encodes one protein, which extends from the cap site to the poly(A) site, plus the associated control regions. Exons (light blue rectangles) are separated by introns. Introns are removed during processing of the primary transcripts (dashed red lines); thus they do not occur in the functional monocistronic mRNA. (b) Complex transcription units produce primary transcripts that can be processed in alternative ways. (Top) If a primary transcript contains alternative splice sites, it can be processed into mRNAs with the same and exons but different internal exons. (Middle) If a primary transcript has two poly(A) sites, it can be processed into mRNAs with alternative exons. (Bottom) If alternative promoters (f or g) are active in different cell types, , produced in a cell type in which f is activated, has a different first exon (1A) than , which is produced in a cell type in which g is activated (and in which exon 1B is used). Description The illustration labeled a, shows a simple eukaryotic transcription unit. Possible mutation sites are labeled a, b, c, and d. Two control regions are indicated by arrows. Arrows indicate mutation sites a and b in the control regions. The horizontal distance between the two control regions is indicated to be 50 kilobases. Moving from left to right, after the control region, the cap site at the 5 prime end of an exon is labeled exon 1. Exon two, indicated by an arrow as 'c' . The exons are surrounded by introns. A third exon and the poly (A) region are at the 3 prime end of exon 3. The intron between exon 2 and exon 3 is indicated with an arrow as mutation site ’d’. The product of gene transcription, the m R N A, is present below with the introns removed. In illustration labeled b, three examples of complex transcription units are presented. Mutation sites are indicated by arrows and labeled with letters. The first gene has alternative splicing sites. Starting from the 5 prime end (left) to the 3 prime end (right) the gene contains two control regions separated by introns. The control regions are labeled 'a' and 'b'. An intron separates the control site marked b and the cap site of exon 1; an arrow marks exon 1 as 'c'. Exons 2 and 3 follow exon 1 sequentially, separated by introns. An arrow indicates exon 3 as mutation site 'd'. Exon 3 is cross-shaded, indicating that it is an alternative splice site. Separated by introns, exon 4 follows exon 3. At the end of exon 4 is a poly (A) region. Two possible m R N A products are
presented. m R N A 1 is the m R N A containing all exons, whereas m R N A 2 is the product of alternative splicing; exon 3 has been spliced from the gene. The second gene contains two control sites and three exons, all are separated by introns and they are labeled sequentially as 'a', 'b', 'c', 'd', and 'e'. Exons 2 and 3 are shaded and an arrow indicates that each is followed by a poly (A) section. The two possible m R N A products are below; m R N A 1 contains exon 1 and exon 2, whereas m R N A 2 contains exons 1 and 3. A third gene is depicted, labeled from 5 prime (left) to 3 prime (right) with a control region, the box is shaded and indicated by an arrow as 'f',. Exon 1 A, preceded by a cap site, follows the control region and is marked by an arrow as ‘d’. Following exon 1 a, another control region this time marked 'g', is present. Exon 1 B (indicated as 'e') follows, preceded by a cap site. Exons 2 (indicated by an arrow as 'c') and 3 follow. All exons and control regions are surrounded by introns. Exon 3 is followed by a poly (A) site. Two m R N A products are present. m R N A 1, contains exons 1 a, 2, and 3, exon 1. In contrast, m R N A 2 contains exons 1 b, 2, and 3. Multiple mRNAs can arise from one primary transcript in three ways. First, when a primary transcript contains alternative splice sites, the transcript can be processed into mRNAs with the same and exons but different internal exons (Figure 7-3b, top). Second, when a primary transcript has two poly(A) sites, the transcript can be processed into mRNAs with alternative exons (Figure 7-3b, middle). Third, alternative promoters may be present but active in different cell types (Figure 7-3b, bottom), For example, when promoter f is activated in cell type 1, then the first exon in is exon 1A. In cell type 2, where promoter f is inactive but promoter g is activated, begins with exon 1B. It is common for one mRNA to be produced from a complex transcription unit in some cell types, while a different mRNA is made in other cell types. For example, the fibronectin gene (see Figure 5-28) encoding long, linear fibrous proteins is transcribed at high level in both fibroblasts, the
major cell type in connective tissue, and hepatocytes, the principal liver cell type that secretes most of the extracellular proteins in blood. When expressed in fibroblasts, the fibronectin protein includes domains encoded by related exons EIIIA and EIIIB (green) that adhere to specific proteins anchored to the fibroblast cell surface. In contrast, when fibronectin is expressed in hepatocytes, the EIIIA and EIIIB exons are left out of the mRNA so that the hepatocyte isoform of fibronectin does not bind to cell surfaces and is free to circulate in the blood, where it can be incorporated into blood clots when they form through interactions with other fibronectin domains. This type of alternative mRNA splicing occurs for ~95 percent of human genes, greatly expanding the number of proteins encoded in the genomes of multicellular organisms. Mutations in exons, introns, and transcription-control regions may influence expression of the protein encoded by a simple transcription unit. For example, in Figure 7-3a, mutation a or b in the transcription control region might reduce or prevent transcription from occurring, thus little or none of the encoded protein is synthesized. Mutation c within an exon could alter the amino acid sequence so that a stop codon is introduced or an abnormal protein is made. Finally, mutation d is located within an intron. If it introduces a new splice site, that will affect the sequence of the mRNA molecule, resulting in a nonfunctional protein. In complex transcription units, the relationship between a mutation and a gene is not always straightforward. A mutation in the control region or in an exon shared by alternatively spliced mRNAs will affect all of the alternative proteins encoded by a given complex transcription unit. On the
Protein-Coding Genes May Be Solitary or Belong to a Gene Family
other hand, a mutation in an exon present in only one of the alternative mRNAs will affect only the protein encoded by that mRNA. Figure 7-3b shows examples of mutations in various components of a complex transcription unit. As explained in Chapter 6, genetic complementation tests are commonly used to determine if two mutations are in the same or different genes (see
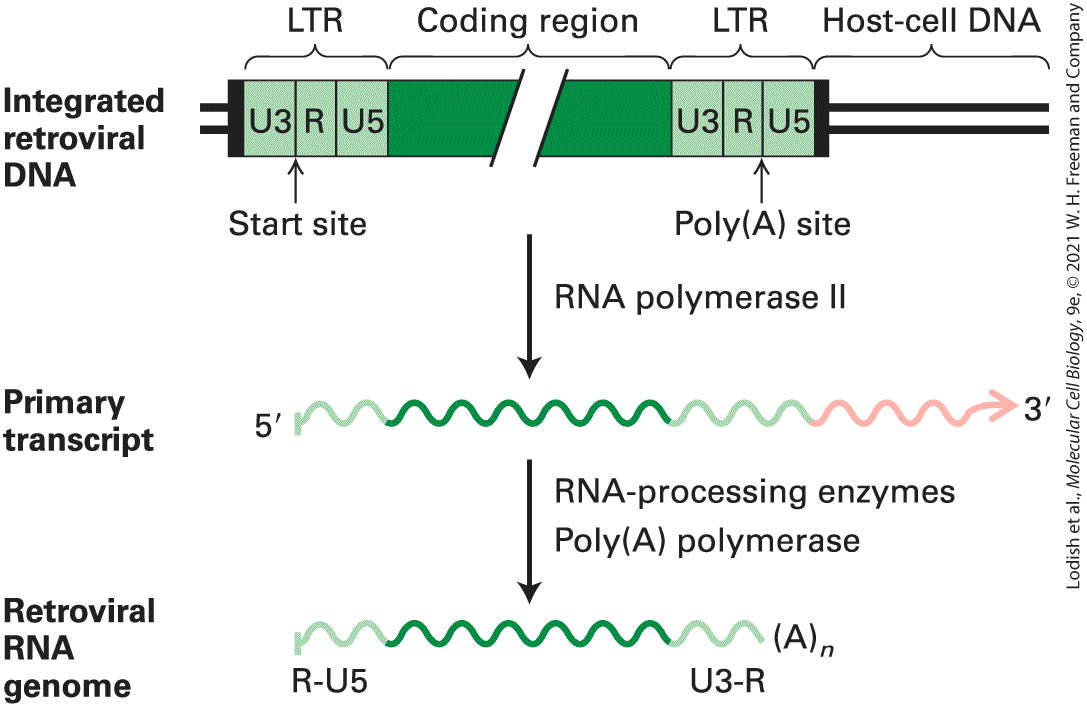
Figure 6-7). However, in the complex transcription unit shown in Figure 73b (middle), mutations d and e would complement each other in a genetic complementation test even though they occur in the same gene, because a chromosome with mutation d can express a normal protein encoded by and a chromosome with mutation e can express a normal protein encoded by . Both mRNAs produced from this gene would be present in a diploid cell carrying both mutations, generating both protein products and hence a wild-type phenotype. However, a chromosome with mutation c in an exon common to both mRNAs would not complement either mutation d or mutation e. In other words, mutation c would be in the same complementation groups as mutations d and e, even though d and e themselves would not be in the same complementation group! Given these complications with the genetic definition of a gene, the molecular definition outlined at the beginning of this section is commonly used. In the case of protein-coding genes, a gene is the DNA sequence transcribed into a pre-mRNA precursor, equivalent to a transcription unit, plus any regulatory elements required for synthesis of the primary transcript.
Protein-Coding Genes May Be Solitary or Belong to a Gene Family The set of all human proteins is encoded by transcription units that comprise approximately 40 percent of the human genome. However, most of this sequence is in introns that average about 3.3 kb in length but vary greatly in size and can be up to ∼17 kb. Compare this with most human exons that are only 50–200 bp long. In multicellular organisms, roughly 25–50 percent of the protein-coding genes are represented only once in the haploid genome and thus are termed solitary genes. A well-studied example of a solitary protein-coding gene is the gene for lysozyme. Lysozyme is an enzyme that cleaves the polysaccharides in bacterial cell walls, causing the bacteria to lyse and die. It is abundant in chicken egg whites and is also found in human tears, where its activity helps to keep the egg and the surface of the eye sterile. The 15-kb DNA sequence encoding chicken lysozyme constitutes a simple transcription unit containing four exons and three introns. The flanking regions, extending about 20 kb upstream and downstream from the transcription unit, do not encode any detectable mRNAs and are thus examples of intergenic regions (i.e., DNA sequences between genes). Duplicated genes constitute the second group of protein-coding genes. These genes have close but nonidentical sequences and are often located within 5–50 kb of one another. A set of duplicated genes that encodes proteins with similar but nonidentical amino acid sequences is called a gene family, and the encoded, closely related, homologous proteins
constitute a protein family. A few protein families, such as protein kinases, vertebrate immunoglobulins, and olfactory receptors, include hundreds of members. Most protein families, however, include from a few to 30 or so members; common examples are cytoskeletal proteins, the myosin heavy chain, and the α-like and β-like globins in vertebrates. The genes encoding the β-like globins are a good example of a gene family. As shown in Figure 7-4a, the β-like globin gene family contains five functional genes, designated HBB (encoding the most abundant adult β-globin), HBD (a minor adult β-globin), HBG1 and HBG2 (fetal β-globins), and HBE1 (embryonic β-globin). Two identical β-like globin polypeptides combine with two identical α-like globin polypeptides (encoded by another gene family expressed during embryonic, fetal, and adult stages of development) and four heme prosthetic groups (see Figure 12-17) to form a hemoglobin molecule. All the hemoglobins formed from the different α-like and β-like globins carry oxygen in the blood, but they exhibit somewhat different properties that are suited to their specific functions in human physiology. For example, hemoglobins containing either the HBG1- or HBG2-encoded polypeptides are expressed only during fetal life. Because these fetal hemoglobins have a higher affinity for oxygen than adult hemoglobins, they can effectively extract oxygen from the maternal circulation in the placenta. The lower oxygen affinity of adult hemoglobins, which are expressed after birth, permits better release of oxygen to the tissues, especially muscles, which have a high demand for oxygen during exercise. The embryonic hemoglobin assembled from polypeptides encoded by the HBE1 gene and the embryonic α-like globin
gene HBZ has an even higher affinity for oxygen than the fetal and adult hemoglobins.
FIGURE 7-4 Comparison of gene density in unicellular and multicellular eukaryotes. (Double black lines represent genomic DNA. Genes diagrammed above these lines are transcribed to the right; genes below are transcribed to the left.) (a) In this diagram of the β-globin gene cluster on human chromosome 11, the green vertical lines represent exons of β-globin–related genes. All of the human β-globin genes are transcribed to the left. The human β-globin gene cluster also contains a pseudogene (orange highlight) that is related to the functional β-globin genes but is not transcribed. Each red arrow indicates the location of an Alu sequence, a roughly 300-bp noncoding repeated sequence discussed in Section 7.3 that is abundant in the human genome. See F. S. Collins and S. M. Weissman, 1984, Prog. Nucl. Acid Res. Mol. Biol. 31:315. (b) Diagram of genes in a randomly chosen 80 kb region of human chromosome 1. RPF1 is transcribed to the right; GNG5 and CTBS are transcribed to the left. Where the -exon is long enough, its end is indicated by an arrowhead. (c) Diagram of yeast genes in an 80 kb region of chromosome III. The green boxes indicate open reading frames. Most of these are functional genes without introns. Note the much higher proportion of noncoding to coding sequences in the human DNA than in the yeast DNA. See S. G. Oliver et al., 1992, Nature 357:28. Description In illustration a, the human beta-globin gene cluster shows many closely associated exons, represented by green boxes, separated by long intron regions on a double
strand. Pseudogene H B B P 1 is highlighted in orange and repeated Alu sequences are also present and labeled with red arrows. In illustration b, human chromosome 1 shows R P F 1 transcribing to the right, G N G 5 and C T B S transcribing to the left. In illustration c, parts of chromosome 3 of baker's yeast containing many open reading frames, are indicated by green boxes. The proportion of functional gene to intron is much greater than in human chromosomes, as indicated by the double-strand entirely covered by green boxes. t R N A is labeled in the center of the double-strand and between two green boxes. The different β-like globin genes arose by duplication of an ancestral gene, most likely as the result of unequal crossing over during meiotic recombination in a developing germ cell (egg or sperm) (see Figure 7-2b). Over evolutionary time, the two copies of the gene that resulted accumulated random mutations, resulting in sequence drift. Beneficial mutations that conferred some refinement in the basic oxygen-carrying function of hemoglobin were retained by natural selection. Repeated gene duplications and subsequent sequence drift and selection are thought to have generated the contemporary β-like globin genes observed in humans and other mammals today. One region in the human β-like globin gene cluster contains a nonfunctional sequence, called a pseudogene, that is similar to the functional β-like globin genes (Figure 7-4a). Sequence analysis shows that this pseudogene has the same apparent exon–intron structure as the functional β-like globin genes, suggesting it arose by duplication of the same ancestral gene. However, there was little selective pressure to
maintain the function of this gene. Consequently, sequence drift during evolution generated sequences that terminate translation and block mRNA processing, rendering this region nonfunctional. Because such pseudogenes are not deleterious, they remain in the genome and mark the location of a gene duplication that occurred in one of our ancestors, followed by sequence drift eliminating the gene function. Duplications of segments of a chromosome (called segmental duplication) occurred fairly often during the evolution of multicellular plants and animals. As a result, a large fraction of the genes in these organisms today have been duplicated, allowing the process of sequence drift to generate gene families and pseudogenes. The extent of sequence divergence between duplicated copies of the genome and characterization of the homologous genomic sequences in related organisms allows us to estimate the time in evolutionary history when the duplication occurred. For example, the human fetal globin genes (HBG1 and HBG2) evolved following the duplication of a 5.5-kb region in the β-globin locus that included the single HBG-globin gene in the common ancestor of catarrhine primates (Old World monkeys, apes, and humans) and platyrrhine primates (New World monkeys) about 50 million years ago. Although members of gene families that arose relatively recently in evolution, such as the genes of the human β-globin family, are often found near one another on the same chromosome, members of gene families may also be found on different chromosomes in the same organism. This is the case for the human α-like globin genes, which were separated from the β-globin genes by an ancient chromosomal translocation. Both the α- and β-
Heavily Used Gene Products Are Encoded by Multiple Copies of Genes
globin genes evolved from a single ancestral globin gene that was duplicated (see Figure 7-2b) to generate the predecessors of the contemporary α- and β-globin genes in mammals. Both the primordial α-and β-globin genes then underwent further duplications to generate the different genes of the α- and β-globin gene clusters found in mammals today. Several different gene families encode the various proteins that make up the cytoskeleton. These proteins are present in varying amounts in almost all cells. In vertebrates, the major cytoskeletal proteins are the actins, tubulins, and intermediate filament proteins such as the keratins, discussed in Chapters 17, 18, and 20. We examined the origin of one such family, the tubulin family, in Section 6.3. The keratins, important for determining the shape and physical properties of epithelial cells that cover tissue surfaces, have expanded into at least 54 functional genes in humans. Although the physiological rationale for the evolution of so many keratins is not as obvious as it is for the globins, the different members of the family probably have similar but subtly different functions suited to the particular type of cell in which they are expressed. Heavily Used Gene Products Are Encoded by Multiple Copies of Genes In vertebrates and invertebrates, the genes encoding ribosomal RNAs and some other nonprotein-coding RNAs, such as those involved in RNA splicing, occur as tandemly repeated arrays. Most often, copies of these
sequences appear one after the other, in a head-to-tail fashion, over a long stretch of DNA. Within a tandem array of rRNA genes, each copy is nearly exactly like all the others. Although the transcribed portions of the genes are the same, the nontranscribed regions between the transcribed regions can vary in length and sequence. These tandemly repeated rRNA genes have evolved to meet the great cellular demand for their transcripts during cell replication. To understand why, consider that a fixed maximal number of rRNA molecules can be produced from a single gene during one cell generation when the gene is fully loaded with RNA polymerase molecules. If more RNA is required than can be transcribed from one gene, multiple copies of the gene are necessary. For example, during early embryonic development in humans, many embryonic cells have a doubling time of about 24 hours and contain 5–10 million ribosomes. To produce enough rRNA to form this many ribosomes, an embryonic human cell needs at least 100 copies of genes encoding the large and small rRNAs, and most of these genes must be close to maximally active for the cell to divide every 24 hours; that is, multiple RNA polymerases must be transcribing each rRNA gene at the same time. Indeed, all eukaryotes, including yeasts, contain 100 or more copies of the 5S rRNA gene as well as similar numbers of the genes encoding the other rRNAs. The genes encoding tRNA and those encoding the histone proteins are also present in multiple copies in eukaryotic cells. As we will see later in this chapter, histones bind and organize nuclear DNA. Just as the cell requires multiple rRNA and tRNA genes to produce sufficient numbers of
Nonprotein-Coding Genes Encode Functional RNAs
ribosomes and tRNAs, multiple copies of the histone genes are required to produce sufficient histone protein to bind the large amount of nuclear DNA produced in each round of cell replication. While tRNA and histone genes often occur in clusters, they generally do not occur in tandem arrays in the human genome. Nonprotein-Coding Genes Encode Functional RNAs In addition to rRNA and tRNA genes, there are thousands of additional genes that are transcribed into nonprotein-coding RNAs, some with various known functions and many whose functions are not yet known. For example, small nuclear RNAs (snRNAs) function in RNA splicing, and small nucleolar RNAs (snoRNAs) function in rRNA processing and base modification in the nucleolus. The RNase P RNA is a ribozyme that functions in tRNA processing, and a large family (∼19,000 in humans) of short micro-RNAs (miRNAs) regulates the translation and stability of specific mRNAs. The functions of these nonprotein-coding RNAs are discussed in Chapter 9. An RNA found in telomerase (see Figure 7-40) maintains the sequence at the ends of chromosomes, and the 7SL RNA is a component of the signal recognition particle that functions in the transport of secreted proteins and most membrane proteins into the endoplasmic reticulum (see Chapter 13). These and other nonprotein-coding RNAs encoded in the human genome, and their functions when known, are listed in Table 7-2. Recent advances in DNA sequencing have led to the discovery of about 10,000 long noncoding RNAs (lncRNAs) in nuclei of
mammalian cells. Some of these have been found to function in regulating the expression of specific protein-coding genes. Pursuing the functions of lncRNAs is currently a highly active area of research.
TABLE 7-2 • Known Nonprotein-Coding RNAs and Their Functions RNA Number of Genes in Human Genome Function rRNAs ∼300 Protein synthesis tRNAs ∼500 Protein synthesis snRNAs ∼40 mRNA splicing U7 snRNA Histone mRNA processing snoRNAs ∼85 Pre-rRNA processing and rRNA modification miRNAs ∼19,000 Regulation of gene expression piRNAs Suppress transposon transpositions in germ cells. Associated with PIWI proteins. Xist X-chromosome inactivation 7SK Transcription control RNase P RNA tRNA processing 7SL RNA Protein secretion (component of signal recognition particle, SRP) RNase
Mrp Rna
Telomerase RNA Template for addition of telomeres Vault RNAs Components of Vault ribonucleoproteins (RNPs). Regulate autophagy. hY1, hY3, hY4, hY5 ∼30 Components of ribonucleoproteins (RNPs), function unknown H19 Unknown Mitochondrial DNA SOURCE: Data from International Human Genome Sequencing Consortium, 2001, Nature 409:860, and P. D. Zamore and B. Haley, 2005, Science 309:1519. KEY CONCEPTS OF SECTION 7.1 Eukaryotic Gene Structure and Organization In molecular terms, a gene is the entire DNA sequence required for synthesis of a functional protein or RNA molecule. In addition to the coding regions (exons), a gene includes control regions, and in multicellular animals and plants most genes include introns. A simple eukaryotic transcription unit produces a single monocistronic mRNA, which is translated into a single polypeptide. A complex eukaryotic transcription unit is transcribed into a primary transcript that can be processed into two or more different monocistronic mRNAs depending on the choice of splice sites or polyadenylation sites. A complex transcription unit with alternative promoters generates two or more different mRNAs, often in different cell types (see Figure 7-3b). Many complex transcription units (e.g., the fibronectin gene) express one mRNA in one cell type and an alternative mRNA in a different cell type. About half the protein-coding genes in vertebrate genomic DNA are solitary genes, each occurring only once in the haploid genome. The remaining are duplicated genes, which arose by duplication of an ancestral gene and subsequent independent mutations (see Figure 7-2b). The proteins encoded by a gene family have i
homologous but nonidentical amino acid sequences and exhibit similar but slightly different properties that are optimal for the cell type in which they are expressed. In invertebrates and vertebrates, rRNAs are encoded by multiple copies of genes located in tandem arrays in genomic DNA. Multiple copies of tRNA, snRNA, and histone genes also occur, often in clusters, but not generally in tandem arrays in humans. Many genes also encode functional RNAs that are not translated into proteins but nonetheless perform significant functions, such as rRNA, tRNA, and snRNA. Among these are micro-RNAs, whose biological significance in regulating gene expression has most recently been appreciated. Understanding the function of many short noncoding RNAs and thousands of newly discovered nuclear long noncoding RNAs (lncRNAs) is currently an intense area of research.
Genomes of Many Organisms Contain a Large Fraction of Noncoding DNA
7.2 Chromosomal Organization of Genes and Noncoding DNA Having reviewed the relationship between transcription units and genes, we now consider the organization of genes on chromosomes and of noncoding DNA that is not expressed as coding sequences in exons of mRNAs or as stable functional RNAs such as tRNAs, miRNAs, and lncRNAs. Genomes of Many Organisms Contain a Large Fraction of Noncoding DNA Comparisons of the total chromosomal DNA per cell in various species first suggested that much of the DNA in certain organisms does not encode proteins or functional RNA or have any apparent regulatory function. For example, yeasts, fruit flies, chickens, and humans have successively more DNA in their haploid chromosome sets (11.9, 137, 1043, and 2968 Mb, respectively), in keeping with what we perceive to be the increasing complexity of these organisms. Yet the vertebrates with the greatest amount of DNA per cell are amphibians, which are surely less complex than humans in their structure and behavior. Even more surprising, the unicellular protozoan Amoeba dubia has 200 times more DNA per cell than humans. Many plant species also have considerably more DNA per cell than humans have. Tulips, for example, have 10 times as much DNA
per cell as humans. The DNA content per cell also varies considerably between closely related species. All insects or all amphibians would appear to be similarly complex, but the amount of haploid DNA in species within each of these phylogenetic classes varies by a factor of 100. Sequencing and identification of exons in chromosomal DNA have provided direct evidence that the genomes of multicellular eukaryotes contain large amounts of noncoding DNA. For instance, only a small portion of the β-globin gene cluster of humans, which is about 80 kb long, encodes protein (see Figure 7-4a). Similarly, a randomly chosen 80-kb region from chromosome 1 includes only the nine short exons of the RFP1 gene, the four exons of the GNG5 gene, and the seven exons of the CTBS gene. The total length of sequence encoding mRNA in this 80-kb region is only 9325 base pairs, or ∼12 percent. In contrast, a typical 80-kb stretch of DNA from the yeast S. cerevisiae contains many closely spaced proteincoding sequences, few introns, and little noncoding DNA (see Figure 74c). The density of genes varies among regions of human chromosomal DNA, from gene-rich regions, where a few hundred base pairs separate transcription units, to large gene deserts, where intergenic regions are a few million base pairs long. Of the 96 percent of human genomic DNA that has been sequenced, only about 2.9 percent is exons, and only about 1.5 percent encodes proteins. (The fraction of the genome that corresponds to exons is much larger than the fraction that encodes proteins because many protein-coding genes include exons for long untranslated regions and because there are many exons in nonprotein-coding lncRNAs; see
Chapter 9.) We learned in the previous section that the intron sequences of most human genes are significantly longer than the exon sequences. Approximately 55 percent of human genomic DNA is thought to be transcribed into pre-mRNAs, pre-lncRNAs, or other nonprotein-coding RNAs in one cell type or another, but some 95 percent of this sequence is intronic and is thus removed by RNA splicing. The remaining 45 percent of human DNA constitutes noncoding DNA between genes (intergenic regions) as well as the regions of repeated DNA sequences that make up the centromeres and telomeres of the human chromosomes. Consequently, about 97 percent of human DNA does not encode proteins, functional noncoding RNAs, or potentially functional lncRNAs. Different selective pressures may account, at least in part, for the remarkable difference in the amount of nonfunctional DNA in different organisms. For example, many microorganisms must compete with other species of microorganisms in the same environment for limited amounts of available nutrients, and metabolic economy is thus a critical characteristic for these organisms. Because synthesis of nonfunctional (i.e., noncoding) DNA requires time, nutrients, and energy, presumably there was selective pressure to lose nonfunctional DNA during the evolution of rapidly growing microorganisms such as the yeast S. cerevisiae. On the other hand, natural selection in vertebrates depends largely on their behavior. The energy invested in DNA synthesis is trivial compared with the metabolic energy required for the movement of muscles and the function of the nervous system; thus there may have been little selective pressure on vertebrates to eliminate nonfunctional DNA. Furthermore, the replication time of cells in most vertebrates and plants is
Most Simple-Sequence DNAs Are Concentrated in Specific Chromosomal Locations
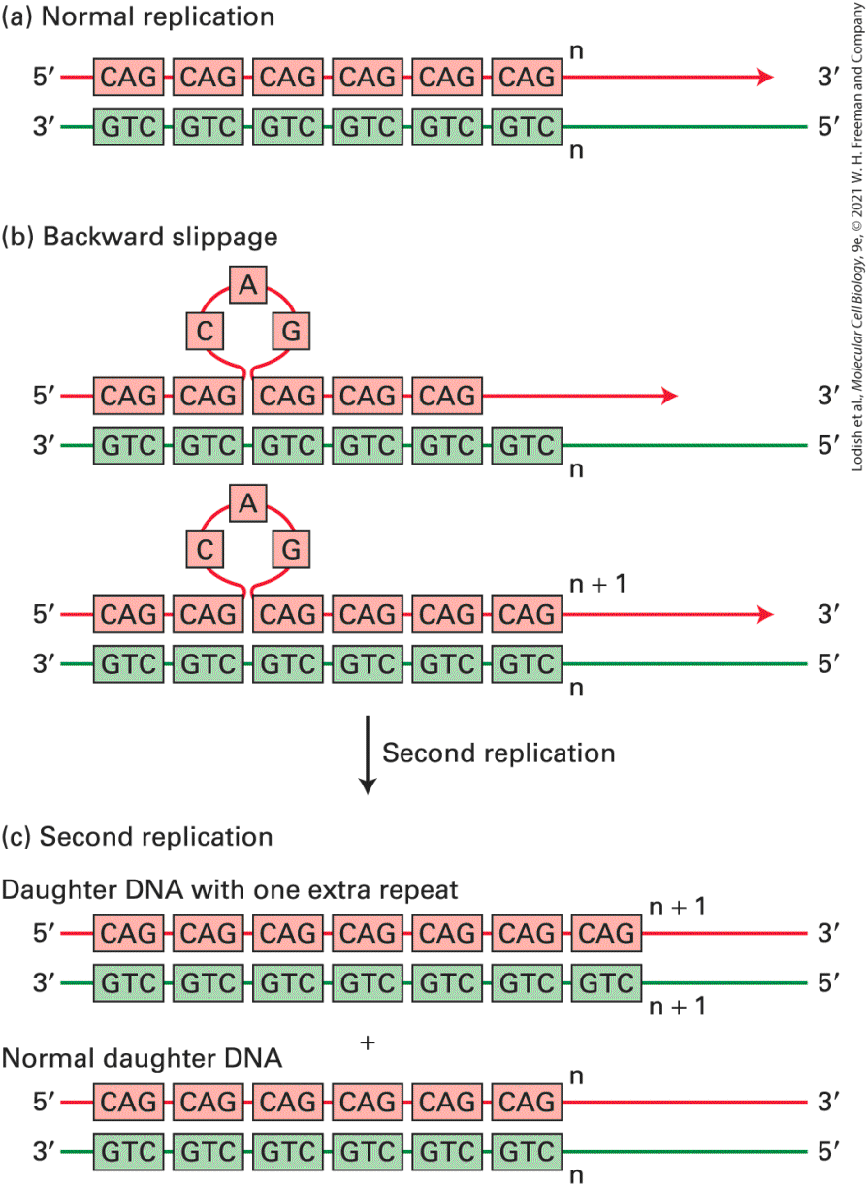
much longer than in rapidly growing microorganisms, so there may have been little selective pressure to eliminate nonfunctional DNA in order to permit rapid cellular replication. Most Simple-Sequence DNAs Are Concentrated in Specific Chromosomal Locations The most abundant class of nuclear DNA found in human cells is repetitive DNA (see Table 7-1). There are two types of repetitive DNA: simple-sequence DNA and interspersed repeats (also called mobile DNA elements). Interspersed repeats are discussed in Section 7.3. Here we discuss simple-sequence DNA. Simple-sequence DNA or satellite DNA, which constitutes about 6 percent of the human genome, is composed of perfect or nearly perfect repeats of relatively short sequences. The length of each repeat in simplesequence DNA can range from 1 to 500 base pairs. DNA sequences in which the repeats each contain 1–13 bp are often called microsatellites. Most microsatellite DNA has a repeat length of 1–4 bp, and the repeats usually occur in tandem sequences of 150 repeats or fewer. Microsatellites are thought to have originated by backward slippage of a daughter strand on its template strand during DNA replication so that the same short sequence was copied twice (Figure 7-5). Also, for triplet repeats that are self-complementary and include a G (e.g., CAG), excision repair of an oxidized G, the most frequent type of spontaneous DNA damage in
humans, can lead to displacement of a strand with the trinucleotide repeat. This displaced region can fold back into a hairpin that is incorporated into the repair patch. Further repair of the single-stranded loop by additional DNA repair enzymes results in an expansion of the number of repeats.
FIGURE 7-5 Generation of microsatellite repeats by backward slippage of the nascent daughter strand during DNA replication. (a) Normal replication. Daughter strand is red and template strand is green. (b) If the nascent daughter strand “slips” backward relative to the template strand by one repeat, one new copy of the repeat is added to the daughter strand when DNA replication continues. An extra copy of the repeat forms a single-stranded loop in the daughter strand of the daughter duplex DNA molecule. (c) If this single-stranded loop is not removed by DNA repair proteins before the next round of DNA replication, the extra copy of the repeat is added to one of the double-stranded daughter DNA molecules. Description The illustration labeled a, shows normal replication with paired parent and daughter D N A strands. In illustration b, backward slippage of the daughter strand occurs and creates a single-stranded loop in the daughter strand; an extra repeat is depicted as a loop of 3 pink boxes. In illustration c, the result of the second replication of the daughter strand shows the normal daughter D N A under the daughter D N A with one extra repeat. Microsatellites occasionally occur within transcription units. Some individuals are born with a larger number of repeats in specific genes than is observed in the general population, presumably because of daughterstrand slippage during DNA replication or repair of DNA damage in a region of triplet repeats in the germ cells from which they and their forebears developed. Such expanded microsatellites have been found to cause at least 14 different types of neuromuscular diseases. In some cases, expanded microsatellites behave like a recessive mutation because they interfere only with the function or expression of the gene in which they occur. But more commonly, expanded microsatellites behave like dominant mutations. In Huntington’s disease, triplet repeats occur within a coding region, resulting in the formation of long polymers of a single
amino acid that may aggregate over time in long-lived neuronal cells, eventually interfering with normal cellular function. For example, expansion of a CAG repeat in the first exon of the gene involved in Huntington’s disease leads to synthesis of long stretches of polyglutamine, which over several decades form toxic aggregates resulting in neuronal cell death in patients with the disease. Pathogenic expanded repeats can also occur in the noncoding regions of some genes, where they are thought to function as dominant mutations because they interfere with the processing of a subset of mRNAs in the muscle cells and neurons where the affected genes are expressed. For example, in patients with myotonic dystrophy type 1, transcripts of the DMPK gene contain between 50 and 1500 repeats of the sequence CUG in the untranslated region, compared with 5–34 repeats in unaffected individuals. The extended stretch of CUG repeats in affected individuals is thought to form a long RNA hairpin. This RNA molecule binds and sequesters nuclear RNA-binding proteins that normally regulate alternative RNA splicing of certain pre-mRNAs essential for muscle and nerve cell function. As opposed to microsatellite DNA composed of repeats of 1 to 13 base pairs, simple-sequence DNA is composed of repeats of 14–500 bp in tandem arrays that are 20–100 kb long. In situ hybridization studies with metaphase chromosomes have localized much of the simple-sequence DNA to the centromeres, the discrete chromosomal regions that attach to spindle microtubules during mitosis and meiosis (Figure 7-6). Experiments in the fission yeast S. pombe indicate that these sequences are
required to form a specialized chromatin structure called centromeric heterochromatin, which is necessary for the proper segregation of chromosomes to daughter cells during mitosis. Simple-sequence DNA is also found in long tandem repeats at the ends of chromosomes, known as the telomeres. Here the repeat sequences prevent chromosome shortening during DNA replication, a topic we discuss further in Section 7.5. EXPERIMENTAL FIGURE 7-6 Simple-sequence DNA is localized at the centromere in mouse chromosomes. Purified simple-sequence DNA from mouse cells was copied in vitro
DNA Fingerprinting Depends on Differences in Length of Simple-Sequence DNAs
using E. coli DNA polymerase I and fluorescently labeled dNTPs to generate a fluorescently labeled DNA probe for mouse simple-sequence DNA. Chromosomes from cultured mouse cells were fixed and denatured on a microscope slide, and the chromosomal DNA was then hybridized in situ to the labeled probe (light blue). The slide was also stained with DAPI, a DNA-binding dye, to visualize the full length of the chromosomes (dark blue). Fluorescence microscopy shows that the simple-sequence probe hybridizes primarily to one end of the telocentric mouse chromosomes (i.e., chromosomes in which the centromeres are located at one end). DNA Fingerprinting Depends on Differences in Length of SimpleSequence DNAs The nucleotide sequences of the repeat units in a simple-sequence DNA tandem array are highly conserved among individuals within a species. In contrast, the number of repeats, and thus the length of simple-sequence tandem arrays containing the same repeat unit, is quite variable among individuals. These differences in length are thought to result from unequal crossing over within regions of simple-sequence DNA during meiosis. As a consequence of this unequal crossing over, the lengths of some tandem arrays are unique in each individual. In humans and other mammals, some simple-sequence DNA exists in relatively short 1–5-kb regions made up of 20–50 repeat units, each containing 14–100 bp. These regions are called minisatellites, in contrast to microsatellites made up of 1–13-bp tandem repeats. Even slight differences in the total length of various minisatellites from different
individuals can be detected by Southern blotting. This technique was exploited in the first application of DNA fingerprinting, which was developed to detect DNA polymorphisms (i.e., differences in sequence between individuals of the same species) (Figure 7-7).
FIGURE 7-7 Distinguishing individuals by DNA fingerprinting. (a) In this analysis of paternity, several minisatellite repeat lengths were determined by Southern blot analysis of restriction enzyme–digested genomic DNA and hybridization with a probe for a minisatellite sequence repeated at several different positions in the genome. This method generated hypervariable multiband patterns for each individual called “DNA fingerprints.” Lane M shows the pattern of restriction fragment bands using the mother’s DNA; C, using the child’s DNA; and F1 and F2 using DNA from two potential fathers. The child has minisatellite repeat lengths inherited from either the mother or F1, demonstrating that F1 is the father. Arrows indicate restriction fragments from F1, but not F2, found in the child’s DNA. (b) In these DNA fingerprints of a specimen isolated from a victim and three people suspected of the crime, it is clear that minisatellite repeat lengths in the specimen match those of suspect 1. The victim’s DNA was included in the analysis to ensure that the specimen DNA was not contaminated with DNA from the victim. Description Illustration labeled a, shows paternity determination using D N A fingerprint. The box has 4 columns of D N A bands, labeled from the left: M, C, F 1, and F 2. Arrows point to 6 areas where paternity clues are present. Illustration labeled b shows criminal identification using D N A fingerprint. The box has 5 columns. The first column on the left is labeled victim. The second column from the left is labeled specimen. The last 3 columns are grouped together under the label suspects 1, 2, 3. The bands under suspect 1 match the bands under the specimen. Today the far more sensitive polymerase chain reaction (PCR) technique (see Figure 6-18) is generally used in forensic genetic testing. Microsatellites consisting of 4-bp tandem repeats in 30–50 copies are usually analyzed today. The exact number of repeats at a specific location in the genome generally varies between the two homologous chromosomes of an individual (one inherited from the mother and one from the father) and between the Y chromosomes of different males. A mixture of pairs of
Unclassified Intergenic DNA Occupies a Significant Portion of the Genome
PCR primers that hybridize to unique sequences flanking 13 of these short tandem repeats and a Y-chromosome short tandem repeat are used to amplify DNA in a sample from one individual. The resulting mixture of PCR product lengths is unique in the human population, except for identical twins. The use of PCR allows analysis of minute amounts of DNA, and individuals can be distinguished more precisely and reliably than by conventional fingerprinting. Unclassified Intergenic DNA Occupies a Significant Portion of the Genome About 45 percent of human DNA lies between transcription units. Much of this sequence is not repeated anywhere else in the genome. Enhancers on the order of 50–200 bp in length that help to regulate transcription at distant promoters occur in these long stretches of intergenic DNA, as well as in introns. These enhancers (discussed in Chapter 8) are often conserved during evolution, while the neighboring intergenic sequences are not conserved. Other conserved intergenic regions may perform significant functions that are not yet understood. For example, they may contribute to the structures of chromosomes discussed in Section 7.5. KEY CONCEPTS OF SECTION 7.2 Chromosomal Organization of Genes and Noncoding DNA In the genomes of prokaryotes and most lower eukaryotes, which contain few nonfunctional sequences, coding regions are densely arrayed along the genomic DNA.
Genomes of multicellular animals and plants contain many sequences that do not apparently code for functional RNAs or have any regulatory function. Much of this nonfunctional DNA is composed of repeated sequences. In humans, only about 2.9 percent of total DNA (the exons) actually encodes proteins or functional RNAs. Variation in the amount of nonfunctional DNA in the genomes of different species is largely responsible for the lack of a consistent relationship between the amount of DNA in the haploid chromosomes of an animal or plant and its phylogenetic complexity. Simple-sequence DNA, consisting of short sequences repeated in long tandem arrays, is preferentially located in centromeres and telomeres. The length of a particular simple-sequence tandem array is quite variable between individuals in a species, probably because of unequal crossing over during meiosis. Differences in the lengths of some simple-sequence tandem arrays form the basis for DNA fingerprinting (see Figure 7-7).
7.3 Transposable (Mobile) DNA Elements
7.3 Transposable (Mobile) DNA Elements The second type of repetitive DNA in eukaryotic genomes, interspersed repeats, is composed of a very large number of copies of relatively few sequence families (see Table 7-1). Also known as moderately repeated DNA, or intermediate-repeat DNA, these sequences are found throughout mammalian genomes and make up 25–50 percent of mammalian DNA (∼45 percent of human DNA). Because interspersed repeats have the unique ability to move within the genome, they are collectively referred to as transposable DNA elements or mobile DNA elements (we use these terms interchangeably). Barbara McClintock discovered the first mobile DNA elements while doing classical genetic experiments in maize (corn) during the 1940s. She characterized genetic entities that could move into and back out of genes, changing the phenotypes of corn kernels. Her theories were controversial until similar mobile elements were discovered in bacteria, where they were characterized as specific DNA sequences, and the molecular basis of their transposition was deciphered. Although transposable DNA elements were originally discovered in eukaryotes, they are also found in prokaryotes, although less frequently. Transposable DNA elements are essentially molecular symbionts that in most cases appear to have no specific function in the biology of their host organisms, but exist only to
maintain themselves. For this reason, Francis Crick referred to them as “selfish DNA.” The process by which these sequences are copied and inserted into a new site in the genome is called transposition. When transposition occurs in germ cells, the transposed sequences at their new sites are passed on to succeeding generations. In this way, mobile elements have accumulated in eukaryotic genomes over evolutionary time. Since mobile elements are eliminated very slowly from eukaryotic genomes, they now constitute a significant portion of the genomes of many eukaryotes. Not only are mobile elements the source for much of the DNA in our genomes, but they also provide a mechanism for greatly increasing genome rearrangements by dispersing homologous sequences throughout the genome where meiotic recombination may occur (see Figure 7-2). Any one transposon transposes very rarely. However, since there are about 3.2 million transposons in the human genome (see Table 7-1), even with this very low frequency of transposition for each transposon (once in multiple generations), in humans there is about one new germ-line transposition for every eight individuals. Over time, transposon transpositions in germ cells have played an essential part in the evolution of genes that have multiple exons and of transcription-control regions that regulate transcription of genes in specific cell types and developmental periods (discussed in
Chapter 8). In other words, although transposable elements probably evolved as molecular symbionts, they have had an important function in the evolution of complex multicellular organisms. We will return to this topic at the end of this section.
Movement of Mobile Elements Involves a DNA or an RNA Intermediate
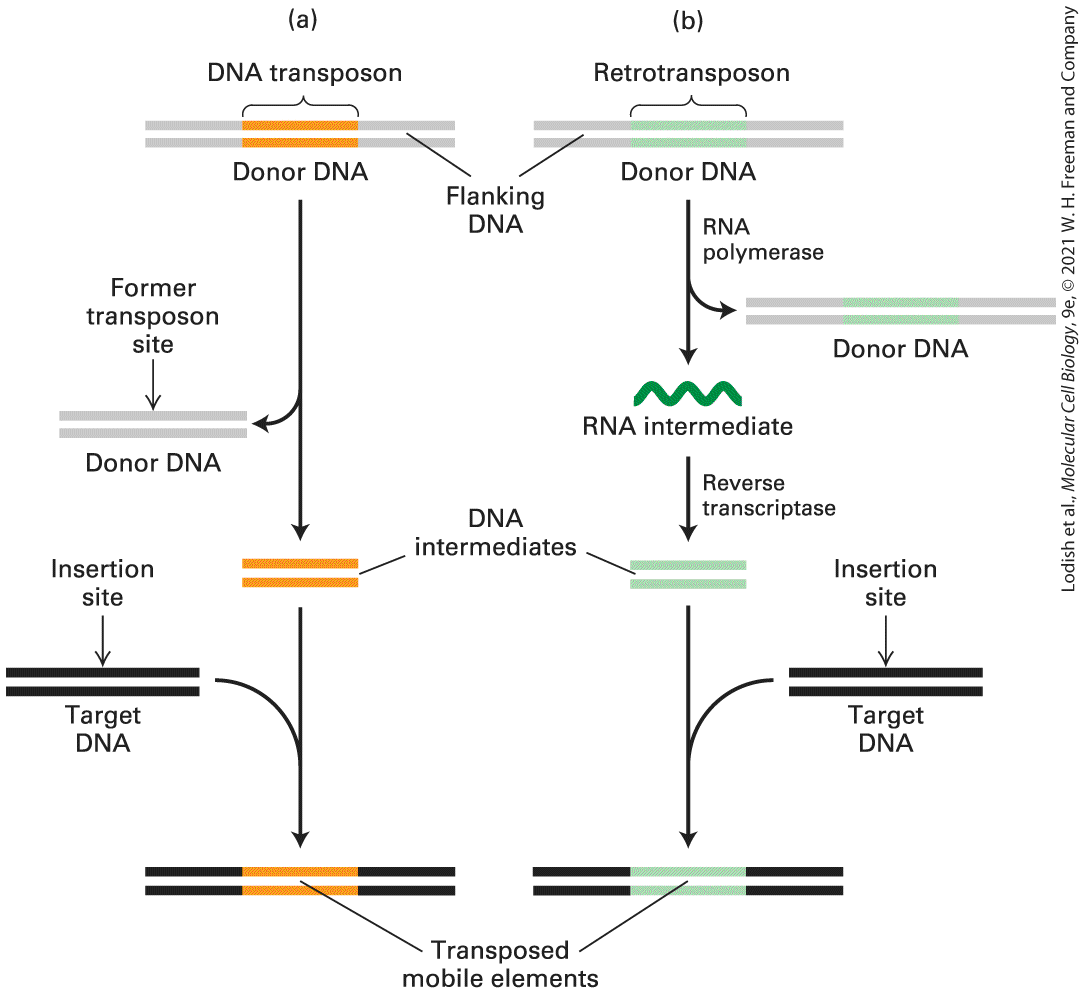
Transposition also occurs within somatic cells. In this case, the transposed sequence is transmitted only to the daughter cells derived from that cell. In rare cases, somatic-cell transposition may lead to a mutation with detrimental phenotypic effects, such as the inactivation of a tumorsuppressor gene (see Chapter 25). In this section, we first describe the structure and transposition mechanisms of the major types of transposable DNA elements and then consider their likely role in evolution. Movement of Mobile Elements Involves a DNA or an RNA Intermediate The transposition of mobile elements occurs in two different ways: (1) transposition directly as DNA or (2) via an RNA intermediate transcribed from the mobile element by an RNA polymerase and then converted back into double-stranded DNA by a reverse transcriptase (Figure 7-8). Mobile elements that transpose directly as DNA are generally referred to as DNA transposons, or simply transposons. Eukaryotic DNA transposons excise themselves from one place in the genome, leaving that site and moving to another. Mobile elements that transpose to new sites in the genome via an RNA intermediate are called retrotransposons. Retrotransposons make an RNA copy of themselves, convert that to double-stranded DNA, and introduce this new copy into another site in the genome, while also remaining at their original location. The movement of retrotransposons is analogous to the infectious process of retroviruses (see
Figure 5-43). Indeed, retroviruses can be thought of as retrotransposons
with genes encoding viral coats that allow them to transpose between cells. Retrotransposons can be further classified on the basis of their specific mechanism of transposition. To summarize, DNA transposons can be thought of as transposing by a cut-and-paste mechanism, while retrotransposons move by a copy-and-paste mechanism in which the copy is an RNA intermediate.
FIGURE 7-8 Two major classes of mobile elements. (a) Eukaryotic DNA transposons (orange) move via a DNA intermediate, which is excised from the donor site. (b) Retrotransposons (green) are first transcribed into an RNA molecule, which is then reverse-
Most Mobile Elements in Bacteria Are DNA Transposons Known as Insertion Sequences
transcribed into double-stranded DNA. In both cases, the double-stranded DNA intermediate is integrated into the target-site DNA to complete movement. Thus DNA transposons move by a cut-and-paste mechanism, whereas retrotransposons move by a copy-and-paste mechanism. Description (a) The first drawing shows an orange section labeled donor D N A in the double strand. The donor part is being cut off the rest of the D N A and a target D N A in black bands is moved into line. The orange donor D N A is now inside the black target D N A and is labeled Transposed mobile elements. (b) Retrotransposon. A green section in the double strand is labeled donor D N A. A downward arrow labeled R N A polymerase points to a copy of the same D N A strand. Next the R N A intermediate has another downward arrow labeled reverse transcriptase which points to a green donor D N A. Next to that is a black target D with an insertion site. The D N A intermediate and the target D N A point to a black D N A strand with the green donor section in it. Most Mobile Elements in Bacteria Are DNA Transposons Known as Insertion Sequences Our first molecular understanding of mobile elements came from the study of Escherichia coli mutations caused by the insertion of a 1–2-kb DNA sequence into the middle of a gene. The inserted DNA is called an insertion sequence, or IS element. More than 1000 different IS elements have been found in E. coli and other bacteria.
Transposition of a bacterial IS element is a rare event, occurring in only one in cells per generation. Since only a small fraction of bacterial DNA is noncoding or comprises promoters and operators involved in transcription control, when a transposition occurs in a bacterial cell, it may inactivate an essential gene, killing the host cell and the IS elements it carries. Consequently, the low rate of transposition of IS elements in bacteria may have evolved because higher rates of transposition would probably result in too great a mutation rate for the host species to survive. However, since IS elements transpose more or less randomly, some transposed sequences insert into nonessential regions of the host genome (e.g., regions between genes), allowing the host cell to survive. In this way, the number of transposons in a strain of a bacteria reaches an equilibrium at a relatively low number (usually less than 20). IS elements can also insert themselves into plasmids or lysogenic viruses and can thus be transferred to other cells. In this way, IS elements can transpose into the chromosomes of new host cells. The general structure of an IS element is diagrammed in Figure 7-9. An inverted repeat of 10–40 bp is invariably present at each end of an IS element. In an inverted repeat, the sequence on one strand is repeated on the other strand, such as
Description The complementary strand contains the same sequence in the repeat unit. An arrow at the top indicates moving left to right, and an arrow at the bottom indicates moving from right to left
FIGURE 7-9 General structure of bacterial IS elements. The relatively large central region of an IS element, which encodes one or two enzymes required for transposition, is flanked by an inverted repeat at each end. The sequences of the inverted repeats are represented by the red regions, with white arrows indicating the direction of the sequence from to . They are nearly identical, but are oriented in opposite directions. The sequence of the inverted repeat is characteristic of a particular type of IS element. The and short direct repeats (as opposed to the inverted repeats) are represented by black regions with a white arrow indicating the direction of the sequence to ). These short direct repeats are not transposed with the insertion element; rather, they are insertion-site sequences that become duplicated, with one copy at each end, during insertion of a mobile element. The length of the direct repeats is constant for a given IS element, but their
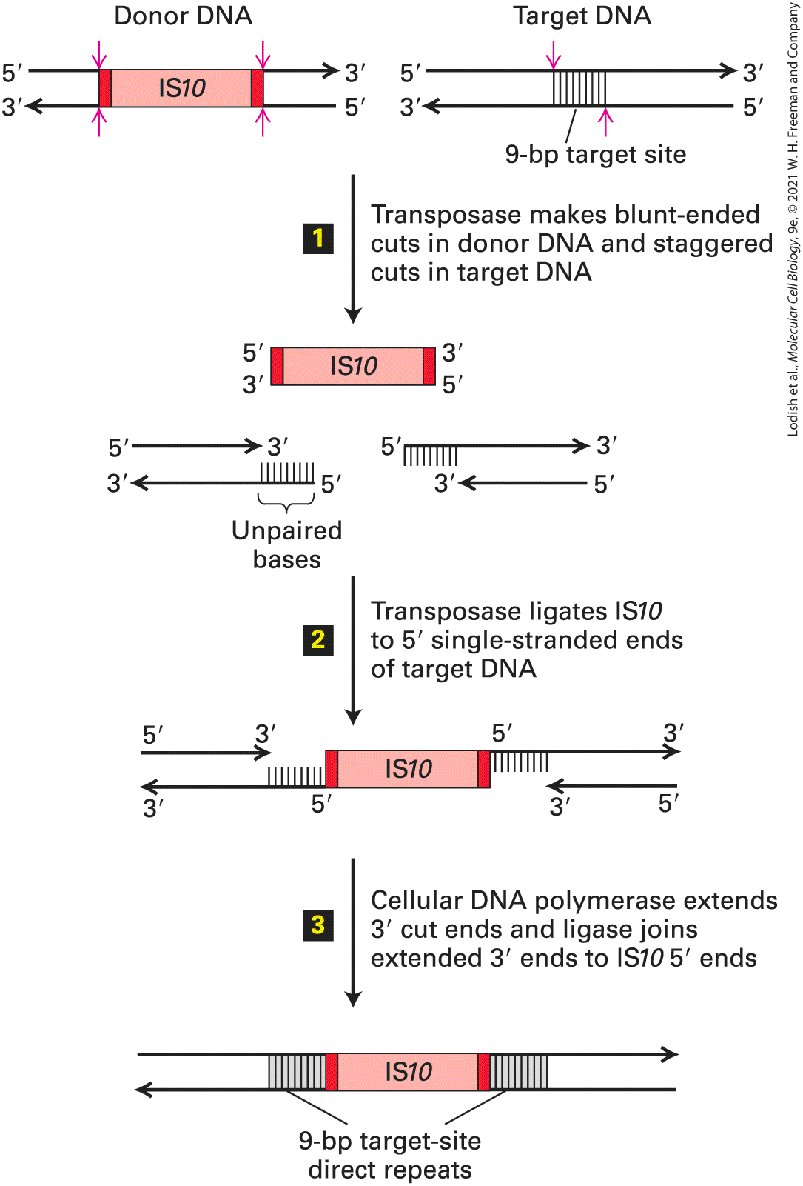
sequence depends on the site of insertion and therefore varies with each transposition of the IS element. The regions in this diagram are not to scale; the coding region makes up most of the length of an IS element. Description A bar shaped D N A strand shows a black section with a rightward white arrow, followed by a red section with a rightward white arrow labeled inserted repeat (approximately 50 base pairs). Next is a longer pink area labeled protein-coding region, a second red section is unlabeled but has a leftward arrow. At the end, there is a small black bar with a rightward arrow labeled, Target-site direct repeat (5 to 11 base pairs). Between the inverted repeats in an IS element is a region that encodes a transposase, an enzyme required for transposition of the IS element to a new site. The transposase is rarely expressed, accounting for the low frequency of transposition. A hallmark of IS elements is the presence of a 5–11-bp direct repeat sequence immediately adjacent to the ends of the inserted element. The length of the direct repeat is characteristic of each type of IS element, but its sequence depends on the target site where a particular copy of the IS element inserted. When the sequence of a mutated gene containing an IS element is compared with the wild-type gene sequence, only one copy of the direct repeat is found in the wild-type gene. Duplication of this target-site sequence to create the second direct repeat adjacent to an IS element occurs during the insertion process. As depicted in Figure 7-10, transposition of an IS element occurs by a cutand-paste mechanism. Transposase performs three functions in this process: it (1) precisely excises the IS element from the donor DNA (Figure 7-10, step 1 ), (2) makes staggered cuts in a short sequence in the
target DNA (Figure 7-10, step 1 ), and (3) ligates the termini of the IS element to the ends of the cut donor DNA (Figure 7-10, step 2 ). Finally, a host-cell DNA polymerase fills in the single-stranded gaps, generating the short direct repeats that flank IS elements, and DNA ligase joins the free ends (Figure 7-10, step 3 ).
Eukaryotic DNA Transposons Move Using a Cut-and-Paste Process
FIGURE 7-10 Model for transposition of bacterial insertion sequences. Step 1 : Transposase, which is encoded by the IS element (IS10 in this example), cleaves both strands of the donor DNA containing the IS element (top left) next to the inverted repeats (dark red, see Figure 7-9 where the inverted repeats are also diagrammed in dark red), excising the IS10 element. At a largely random target site, transposase makes staggered cuts in the target DNA (top right). In the case of IS10, the two cuts are 9 bp apart. Thin red vertical arrows indicate the phosphodiester bonds cut by the transposase. Step 2 : Ligation of the ends of the excised IS element to the ends in target site DNA left by the staggered cut in the target DNA is also catalyzed by transposase. Step 3 : The 9-bp gaps of single-stranded DNA left in the resulting intermediate are filled in by a cellular DNA polymerase. Finally, cellular DNA ligase forms the phosphodiester bonds between the ends of the extended target DNA strands and the ends of the IS10 strands. This process results in duplication of the target-site sequence on each side of the inserted IS element. Note that the lengths of the target site and IS10 are not to scale. See H. W. Benjamin and N. Kleckner, 1989, Cell 59:373; and 1992, Proc. Nat’l. Acad. Sci. USA 89:4648. Description The illustration shows two bar shaped D N A segments. The first shows a pink bar labeled Donor D N A on the left and the second shows a gray bar labeled Target DNA on the right. The target site is labeled at the center of the gray bar. A downward arrow has the label: (1) Transposase makes blunt ended cuts in donor D N A and staggered cuts in target D N A. The next double strand is labeled I S 10. Below the pink I S 10 strand is the gray strand cut in pieces. (2) A downward arrow is labeled, Transposase ligates I S 10 to 5 prime single stranded ends of target D N A. This is presented with the gray bars joined to the sides of the pink I S 10 bar. (3) A third downward arrow labeled cellular D N A polymerase extends 3 prime cut ends and ligase joins extended 3 prime ends to I S 10 5 prime ends. The double bar at the bottom has the I S 10 region labeled and the 9 b p target site direct repeats on its either sides.
Eukaryotic DNA Transposons Move Using a Cut-and-Paste Process McClintock’s original discovery of mobile elements came from her observation of spontaneous mutations in maize that affect the production of enzymes required to make anthocyanin, a purple pigment in maize kernels. Mutant kernels are white and wild-type kernels are purple. One class of these mutations is revertible at high frequency, whereas a second class does not revert unless the mutations occur in the presence of the first class of mutations. McClintock called the agents responsible for the first class of mutations activator (Ac) elements and those responsible for the second class dissociation (Ds) elements because they also tended to be associated with chromosome breaks. Many years after McClintock’s pioneering discoveries, cloning and sequencing revealed that Ac elements are equivalent to bacterial IS elements. Like IS elements, they contain inverted terminal repeat sequences that flank a region encoding a transposase, which recognizes the terminal repeats and catalyzes transposition to a new site in the host DNA. Ds elements are deleted forms of Ac elements in which a portion of the sequence encoding transposase is missing. Because it does not encode a functional transposase, a Ds element cannot move by itself. However, in plants that carry Ac elements and thus express a functional transposase, Ds elements can be transposed because they retain the inverted terminal repeats recognized by the transposase.
Since McClintock’s early work on mobile elements in corn, DNA transposons have been identified in other eukaryotes. For instance, Drosophila possess a DNA transposon known as a P element, which moves by a mechanism similar to that used by bacterial insertion sequences. Current methods for constructing transgenic Drosophila depend on engineered, high-level expression of the P-element transposase and use of the P-element inverted terminal repeats as targets for transposition. DNA transposition by the cut-and-paste mechanism can result in an increase in the copy number of a transposon if it occurs during S phase of the cell cycle (see Figure 1-22), when DNA synthesis occurs. Transposon copy number increases when the donor DNA is in one of the two daughter DNA molecules in a region of a chromosome that has replicated but the target DNA is in a region that has not yet replicated. When DNA replication is complete at the end of S phase, the transposon DNA in its new location has also been replicated, resulting in a net increase in the total number of transposon copies in the cell (Figure 7-11). When such a transposition occurs during S phase preceding meiosis, one of the four germ cells produced contains the extra copy of the transposon. Repetition of this process over evolutionary time has resulted in the accumulation of large numbers of DNA transposons in the genomes of some organisms. Human DNA contains about 300,000 copies of full-length and deleted DNA transposons, amounting to about 3 percent of human DNA. As we will see shortly, this mechanism can lead to the transposition of genomic DNA as well as the transposon itself.
FIGURE 7-11 Mechanism for increasing DNA-transposon copy number. If a DNA transposon, which transposes by a cut-and-paste mechanism (see Figure 7-10), transposes during S phase from a region of the chromosome that has replicated to a region that has not yet replicated, then when chromosomal replication is completed, one of the two daughter chromosomes will have a net increase of one copy of the transposon. Description The illustration shows a D N A double strand with the transposon copy highlighted in orange. In the second step, a Y-shape is present in which one orange segment splits from the double strand and another orange copy is present in the strand. The transposon copy is cut out of one the daughter strands and inserted into the parent D N A ahead of the replication fork. After the replication fork has passed the location of the inserted transposon, one of the daughter D N A strands contains two DNA transposons.
LTR Retrotransposons Behave Like Intracellular Retroviruses
LTR Retrotransposons Behave Like Intracellular Retroviruses The genomes of all eukaryotes studied, from yeast to humans, contain retrotransposons, mobile DNA elements that transpose through an RNA intermediate using a reverse transcriptase (see Figure 7-8b). These mobile elements are divided into two major categories: those containing and those lacking long terminal repeats (LTRs). LTR retrotransposons, which we discuss here, are common in yeast (e.g., Ty elements) and in Drosophila (e.g., copia elements). In humans, LTR retrotransposons constitute about 8 percent of the genomic DNA. Non-LTR retrotransposons are the most common type of mobile element in mammals; these retrotransposons are described in the next section. The general structure of LTR retrotransposons found in eukaryotes is depicted in Figure 7-12. In addition to the short direct repeats that are typical of all transposons, these retrotransposons are marked by the presence of LTRs flanking the central protein-coding region. The LTRs in LTR retrotransposons are 250–600 bp long. Unlike the inverted repeats that flank IS elements and DNA transposons, LTRs are direct repeats.
FIGURE 7-12 General structure of eukaryotic LTR retrotransposons. The central protein-coding region is flanked by two long terminal repeats (LTRs), which are elementspecific direct repeats. Like other mobile elements, integrated retrotransposons have short target-site direct repeats at each end. Note that the different regions are not drawn to scale. The protein-coding region constitutes 80 percent or more of a retrotransposon and encodes reverse transcriptase, integrase, and other proteins required for transposition. LTR retrotransposons and infectious retroviruses have much in common. The LTRs in retrotransposons are characteristic of integrated retroviral DNA and are critical to the life cycle of retroviruses and retrotransposons. In addition to sharing LTRs with retroviruses, LTR retrotransposons encode all the proteins of the most common type of retroviruses, except for the envelope proteins. Lacking these envelope proteins, LTR retrotransposons cannot bud from their host cell and infect other cells; however, they can transpose to new sites in the DNA of their host cell. Because of their clear relationship with retroviruses, LTR retrotransposons are often called retrovirus-like elements. A key step in the retroviral life cycle is the formation of retroviral genomic RNA from integrated retroviral DNA (see Figure 5-43). We describe this process in some detail here because it serves as a model for the generation of the RNA intermediate during the transposition of LTR retrotransposons. As depicted in Figure 7-13, the leftward retroviral LTR functions as a promoter that directs host-cell RNA polymerase to initiate transcription at the nucleotide of the roughly 20-base R sequence that is repeated at each end of the retroviral RNA. After the entire downstream retroviral DNA has been transcribed, the RNA sequence corresponding to
the rightward LTR directs host-cell RNA-processing enzymes to cleave the primary transcript and add a poly(A) tail at the end of the R sequence. The resulting retroviral RNA genome, which lacks a complete LTR, exits the nucleus and is packaged into a virion that buds from the host cell.
FIGURE 7-13 Generation of retroviral genomic RNA from integrated retroviral DNA. The left LTR of the integrated provirus DNA functions as a promoter, and the right LTR sequence functions as a poly(A) site. (See text.) R represents an ∼20 base sequence that is precisely repeated at each end of the viral genomic RNA (bottom). U5 and U3 refer to sequences immediately adjacent to the R sequence at the - and -ends of the genomic RNA, respectively. While U5 and U3 become repeated in the sequence of the integrated provirus DNA (see Figure 7-14), they are not repeated in the genomic retroviral RNA (hence the names U5 and U3 where “U” indicates a unique sequence in the viral RNA). Short direct repeat sequences (black) flanking the integrated provirus are generated during integration of the retroviral DNA into the host-cell genome. A similar mechanism is thought to generate the RNA intermediate during transposition of LTR retrotransposons.
Description The illustration shows a D N A strand labeled Integrated retroviral D N A at the top. The strand starts with a light green section labeled L T R comprising U 3, R, and U 5 segments. The start site is labeled between the U 3 and the R segment. The region that follows is the coding region. There is another L T R segment next to the coding region in which the poly (A) site is labeled. The host-cell D N A is labeled at the right end of the Integrated retroviral D N A. A downward arrow from the Integrated retroviral D N A labeled R N A polymerase 2 points to a primary transcript. A downward arrow labeled R N A-processing enzymes, poly (A) polymerase points to a retroviral R N A genome, the left side of which is labeled R-US and the right side labeled U 3-R and (A)n. After a retrovirus infects a cell, reverse transcription of its RNA genome by the retrovirus-encoded reverse transcriptase yields a double-stranded DNA containing complete LTRs (Figure 7-14). This DNA synthesis takes place in the cytosol. The double-stranded DNA, with an LTR at each end, is then transported into the nucleus in a complex with integrase, another enzyme encoded by retroviruses and retrotransposons. Retroviral integrases are closely related to the transposases encoded by DNA transposons and use a similar mechanism to insert the double-stranded retroviral DNA into the host-cell genome (see Figure 7-10), generating short direct repeats of the target-site sequence at either end of the inserted viral DNA sequence. This complex mechanism of reverse transcription is a critical aspect of the retrovirus life cycle because it generates the complete LTR that functions as a promoter for initiation of transcription precisely at the nucleotide of the R sequence (Figure 7-13), and the complete LTR that functions as a poly(A) site leading to polyadenylation precisely at the nucleotide of the R sequence.
Consequently, no nucleotides are lost from an LTR retrotransposon as it undergoes successive rounds of insertion, transcription, reverse transcription, and reinsertion at a new site.
FIGURE 7-14 Model for reverse transcription of retroviral genomic RNA into DNA. (Figure caption is on the facing page.) In this model, a complicated series of nine events generates a double-stranded DNA copy of the single-stranded RNA genome of a retrovirus.
The genomic RNA is packaged in the virion with a retrovirus-specific cellular tRNA hybridized to a complementary sequence near its end, called the primer-binding site (PBS). The retroviral RNA has a short direct repeat terminal sequence (R) at each end. The overall reaction is carried out by reverse transcriptase, which catalyzes polymerization of deoxyribonucleotides. RNase H, also encoded in the viral RNA and packaged into the virion particle, digests the RNA strand in a DNA-RNA hybrid. The entire process yields a double-stranded DNA molecule that is longer than the template RNA and has a long terminal repeat (LTR) at each end. The different regions are not shown to scale. The PBS and R regions are actually much shorter than the U5 and U3 regions, and the central coding region is very much longer than the other regions. See E. Gilboa et al., 1979, Cell 18:93. Description The following sequence summarizes this process. 1. The retroviral R N A interacts with t R N A, and the t R N A is extended, forming D N A at the L T R at the 5 prime end of the retroviral R N A. 2. The R N A portion associated with the extended D N A is digested. 3. The t R N A and associated D N A jumps to the 3 prime end of the R N A sequence, and the complementary R sections are associated. 4. The D N A extends from the 3 prime to 5 prime ends of the retroviral R N A. 5. Most of the R N A in the R N A-D N A hybrid is digested. 6. A new 3 prime end of a complementary D N A strand is extended, forming a D N A copy of the L T R. 7. The t R N A in D N A- R N A hybrid is digested. 8. The D N A L T R just formed jumps to the 3 prime end of the first D N A strand. 9. The remaining portion of the D N A is extended from the 3 prime ends. Consequently, retroviral D N A is formed. As noted above, LTR retrotransposons encode reverse transcriptase and integrase. By analogy with retroviruses, these mobile elements move by a copy-and-paste mechanism whereby reverse transcriptase converts an RNA copy of a donor element into DNA, which is inserted into a target site by integrase. The experiments depicted in Figure 7-15 provided strong evidence for the role of an RNA intermediate in the transposition of Ty LTR retrotransposons in yeast. When yeast cells are transformed with a
Ty-containing plasmid, the Ty element can transpose to new sites, although normally this occurs at a low rate. Using the elements diagrammed at the top of the figure, researchers engineered two different recombinant plasmid vectors containing recombinant Ty elements adjacent to a strong galactose-activated promoter. Yeast cells transformed with these plasmids were grown in a galactose-containing medium to induce transcription of the Ty element, or in a galactose-free medium where Ty transcription is not induced. In experiment 1, growth of cells in galactose-containing medium resulted in many more transpositions than in galactose-free medium, indicating that transcription into an mRNA intermediate is required for Ty transposition. In experiment 2, an intron from an unrelated yeast gene was inserted into the putative protein-coding region of the recombinant galactose-responsive Ty element. This intron sequence was lost from Ty elements transposed to new sites. This absence of the intron in transposed Ty elements was strong evidence that transposition involves an mRNA intermediate from which the intron was removed by RNA splicing, as depicted in the box on the right. In contrast, eukaryotic DNA transposons, such as the Ac element of maize, contain introns within the transposase gene, indicating that they do not transpose via an RNA intermediate.
EXPERIMENTAL FIGURE 7-15 The yeast Ty element transposes through an RNA intermediate. Ty transcription from a plasmid was experimentally manipulated by fusing the Ty element to a GAL1 transcription control region. When transcription was increased by culturing the cells in medium with galactose (experiment 1), the frequency of Ty transposition was greatly increased. When an intron from another yeast gene was inserted into the middle of the Ty sequence in this plasmid (experiment 2), addition of galactose to the media stimulated transposition of Ty elements lacking the intron. This indicates that transposition likely involves an RNA intermediate from which the intron was removed by RNA splicing, as depicted in the box on the right. See J. Boeke et al., 1985, Cell 40:491. Description A box at the top depicts the following components: The T y element is represented by a horizontal bar with the coding region labeled between two L T R segments. The T y m R N A is represented by a wavy red arrow, the galactose-sensitive promoter and the intron from another gene are represented by different colored segments. The box points to experiment 1 and experiment 2. The information presented is as follows: Experiment 1: A Gal-responsive T y results in galactose-containing medium. Text reads, transform yeast cells; grow in galactose and nongalactose-containing media. 1. T y m R N A synthesis increased; 2. Transposition of T y elements increased. A schematic shows a T y m R N A undergoing reverse transcription to form a transposed T y. Experiment 2: A Gal-responsive T y with unrelated added intron results in galactose containing medium. Text reads, transform yeast cells; grow in galactose-and nongalactose-containing media. 1. T y m R N As lack intron. 2. Transposed T y elements lack intron. A schematic shows a primary transcript which undergoes R N A splicing to form T y m R N A. T y m R N A undergoes reverse transcription to form a transposed T y. The most common LTR retrotransposons in humans are called ERVs, for endogenous retroviruses. Most of the 443,000 ERV-related DNA sequences in the human genome consist only of isolated LTRs. These sequences are
Non-LTR Retrotransposons Transpose by a Distinct Mechanism
derived from full-length proviral DNA by homologous recombination between two LTRs, resulting in deletion of the internal retroviral sequences. Isolated LTRs such as these cannot be transposed to a new position in the genome, but recombination between homologous LTRs at different positions in the genome has probably contributed to the chromosomal DNA rearrangements leading to gene and exon duplications, the evolution of proteins with new combinations of exons, and, as we will see in Chapter 8, the evolution of complex control of gene expression. Non-LTR Retrotransposons Transpose by a Distinct Mechanism The most abundant mobile elements in mammals are retrotransposons that lack LTRs, sometimes called nonviral retrotransposons. These moderately repeated DNA sequences form two classes in mammalian genomes: long interspersed elements (LINEs) and short interspersed elements (SINEs). In humans, full-length LINEs are about 6 kb long, and SINEs are about 300 bp long (see Table 7-1). Repeated sequences with the characteristics of LINEs have been observed in protozoans, insects, and plants, but for unknown reasons, they are particularly abundant in the genomes of mammals. SINEs too are found primarily in mammalian DNA. Large numbers of LINEs and SINEs have accumulated in mammalian genomes over evolutionary time by repeated copying of sequences at a few positions in the genome and insertion of the copies into new positions.
LINEs Human DNA contains three major families of LINEs, L1, L2, and L3, that are similar in their mechanism of transposition but differ in their sequences. Only members of the L1 family transpose in the contemporary human genome; apparently there are no remaining functional copies of L2 or L3 to provide the proteins required for their transposition. LINE sequences are present at roughly 900,000 sites in the human genome, accounting for a staggering 21 percent of total human DNA. The general structure of a complete LINE is diagrammed in Figure 7-16. LINEs are usually flanked by short direct repeats, the hallmark of mobile elements, and contain two long open reading frames (ORFs, which are proteincoding regions; see Section 6.3). ORF1, about 1 kb long, encodes an RNAbinding protein. ORF2, about 4 kb long, encodes a protein that has a long region of homology with the reverse transcriptases of retroviruses and LTR retrotransposons, but also exhibits DNA endonuclease activity.
FIGURE 7-16 General structure of a LINE. The length of the target-site direct repeats varies among the copies of a LINE at different sites in the genome. Although the full-length LINE element is about 6 kb long, variable amounts of the left end are absent at over 90 percent of the sites where this mobile element is found. The shorter open reading frame (ORF1), about 1 kb in length, encodes an RNA-binding protein. The longer ORF2, about 4 kb in length, encodes a bifunctional protein with reverse transcriptase and DNA
endonuclease activity. Note that LINEs lack the long terminal repeats found in LTR retrotransposons. Evidence for the mobility of L1 elements first came from analysis of DNA cloned from patients with certain genetic diseases such as hemophilia and myotonic dystrophy. DNA from these patients was found to carry mutations resulting from insertion of an L1 element into a gene, whereas no such element occurred within that gene in either parent. About 1 in 600 mutations that cause significant disease in humans are due to L1 transpositions or SINE transpositions that are catalyzed by L1-encoded proteins. Later experiments similar to those just described with yeast Ty elements (see Figure 7-15) confirmed that L1 elements transpose through an RNA intermediate. In these experiments, an intron was introduced into a cloned mouse L1 element and the recombinant L1 element was stably transfected into cultured hamster cells. After several cell doublings, a DNA fragment corresponding to the L1 element but lacking the inserted intron was detected in the cells. This finding strongly suggests that, over time, the recombinant L1 element containing the inserted intron had transposed to new sites in the hamster genome through an RNA intermediate that underwent RNA splicing to remove the intron. Since LINEs do not contain LTRs, their mechanism of transposition through an RNA intermediate differs from that of LTR retrotransposons. In vitro studies indicate that transcription by RNA polymerase is directed by promoter sequences at the left end of integrated LINE DNA. LINE RNA is polyadenylated by the same post-transcriptional mechanism that
polyadenylates other mRNAs. The LINE RNA is then exported into the cytosol, where it is translated into ORF1 and ORF2 proteins. Multiple copies of ORF1 protein bind to the LINE RNA, and ORF2 protein binds to the poly(A) tail. The LINE RNA is then transported back into the nucleus as a complex with ORF1 and ORF2 proteins, where it is reversetranscribed into LINE DNA by ORF2. The mechanism involves staggered cleavage of cellular DNA at the insertion site, followed by priming of reverse transcription by the resulting cleaved cellular DNA, as detailed in
Figure 7-17. The complete process results in insertion of a copy of the original LINE retrotransposon into a new site in chromosomal DNA. A short direct repeat is generated at the insertion site because of the initial staggered cleavage of the two chromosomal DNA strands.
FIGURE 7-17 Proposed mechanism of LINE reverse transcription and integration. Only ORF2 protein is represented here. Newly synthesized LINE DNA is shown in black. ORF1 and ORF2 proteins, produced by translation of LINE RNA in the cytoplasm, bind to LINE RNA and transport it into the nucleus. Step 1 : In the nucleus, ORF2 makes staggered cuts in AT-rich target-site DNA, generating the DNA -OH ends indicated by blue arrowheads. Step 2 : The end of the T-rich DNA strand hybridizes to the poly(A) tail of the LINE RNA and primes DNA synthesis by ORF2. Step 3 : ORF2 extends the DNA strand using the LINE RNA as a template. Steps 4 and 5 : When synthesis of the LINE DNA bottom strand reaches the end of the LINE RNA template, ORF2 extends the newly synthesized LINE DNA using as a template the top-strand cellular DNA generated by the initial ORF2 staggered cleavage. Step 6 : A cellular DNA polymerase extends the end of the top strand generated by the initial ORF2 staggered cut, using the newly synthesized bottom-strand LINE DNA as a template. The LINE RNA is digested as the DNA polymerase extends the upper-strand DNA (this also occurs during removal of lagging-strand primer RNA during cellular DNA synthesis; see Figure 5-11). The ends of the newly synthesized DNA strands are ligated to the ends of the cellular DNA strands as in lagging-strand cellular DNA synthesis. See D. D. Luan et al., 1993, Cell 72:595. Description The steps involved in the mechanism of LINE reverse transcription and integration are as follows: 1- Cutting; 2- Priming of reverse transcription by chromosomal D N A; 3- Reverse transcription of LINE by O R F 2. 4 and 5- Copying of chromosomal D N A by O R F 2; 6 and 7- Insertion completed by cellular enzymes. The final product shows two direct repeat sequences on either sides of the LINE D N A. As noted already, the DNA form of an LTR retrotransposon is synthesized from its RNA form in the cytosol using a cellular tRNA as a primer for reverse transcription of the first strand of DNA (see Figure 7-14). The resulting double-stranded DNA with long terminal repeats is then transported into the nucleus, where it is integrated into chromosomal DNA
by a retrotransposon-encoded integrase. In contrast, the DNA form of a non-LTR retrotransposon is synthesized in the nucleus. The synthesis of the first strand of the non-LTR retroviral DNA by ORF2, a reverse transcriptase, is primed by the end of cleaved chromosomal DNA, which base-pairs with the poly(A) tail of the non-LTR RNA (Figure 7-17, step 1 ). Since its synthesis is primed by the cut end of a cleaved chromosome, and since synthesis of the other strand of the non-LTR retrotransposon DNA is primed by the end of chromosomal DNA on the other side of the initial cut (step 6 ), the mechanism of synthesis results in integration of the non-LTR retrotransposon DNA. There is no need for an integrase to insert the non-LTR retrotransposon DNA. Because its synthesis begins with reverse transcription of a poly(A) tail on the LINE RNA, one end of a non-LTR retrotransposon is AT-rich. The vast majority of LINEs in the human genome are truncated at their end, suggesting that reverse transcription was terminated before completion and that the resulting fragments, extending variable distances from the poly(A) tail, were inserted. Because of this shortening, the average size of LINE elements is only about 900 bp, even though the fulllength sequence is about 6 kb long. Truncated LINE elements, once formed, probably are not further transposed because they lack a promoter for transcription of the RNA intermediate. In addition to the fact that most L1 insertions are truncated, nearly all the full-length elements contain stop codons and frameshift mutations in ORF1 and ORF2; these mutations have probably accumulated in most LINE sequences over evolutionary time. As a result, only about 0.01 percent of the LINE sequences in the human
genome, or about 60 in total number, are full-length, with intact open reading frames for ORF1 and ORF2. SINEs The most abundant class of mobile elements in the human genome, SINEs constitute about 13 percent of total human DNA. Varying in length from about 100 to 400 base pairs, these retrotransposons do not encode protein, but most contain a AT-rich sequence similar to that in LINEs. SINEs are transcribed by RNA polymerase III, the same nuclear RNA polymerase that transcribes genes encoding tRNAs, 5S rRNAs, and other small stable RNAs. Most likely, the ORF1 and ORF2 proteins expressed from fulllength LINEs mediate reverse transcription and integration of SINEs by the mechanism depicted in Figure 7-17. Consequently, SINEs can be viewed as parasites of the LINE symbionts, competing with LINE RNAs for binding, reverse transcription, and integration by LINE-encoded ORF1 and ORF2. SINEs occur at about 1.6 million sites in the human genome. Of these, about 1.1 million are Alu elements, so named because they contain a single recognition site for the restriction enzyme AluI. Alu elements exhibit considerable sequence homology with, and probably evolved from, 7SL RNA, a cytosolic RNA in a ribonucleoprotein complex called the signal recognition particle. This abundant cytosolic ribonucleoprotein particle aids in targeting certain polypeptides to the membranes of the endoplasmic reticulum (see Chapter 13). Alu elements are scattered throughout the human genome at sites where their insertion has not
Other Retroposed RNAs Are Found in Genomic DNA
disrupted gene expression: between genes, within introns, and in untranslated regions. For instance, nine Alu elements are located within the 80-kb human β-globin gene cluster (see Figure 7-4a). Of the new germ-line non-LTR retrotranspositions that are estimated to occur about once in every eight individuals, about 40 percent involve L1 elements and 60 percent involve SINEs, of which about 90 percent of the latter are Alu elements. Like other mobile elements, most SINEs have accumulated mutations from the time of their insertion in the germ line of an ancient ancestor of modern humans. Like LINEs, many SINEs are truncated at their ends. Other Retroposed RNAs Are Found in Genomic DNA In addition to the mobile elements listed in Table 7-1, DNA copies of a wide variety of mRNAs appear to have become integrated into chromosomal DNA. Since these sequences lack introns and do not have flanking sequences similar to those of functional gene copies, they clearly are not simply duplicated genes that have drifted into nonfunctionality and become pseudogenes, as discussed earlier (see Figure 7-4a). Instead, these DNA segments appear to be retrotransposed copies of spliced and polyadenylated mRNA. Compared with normal genes encoding mRNAs, these inserted segments generally contain multiple mutations, which are thought to have accumulated since they were first reverse-transcribed and randomly integrated into the genome of a germ cell in an ancient ancestor. These nonfunctional genomic copies of mRNAs are referred to as
Mobile DNA Elements Have Significantly Influenced Evolution
processed pseudogenes. Most processed pseudogenes are flanked by short direct repeats, supporting the hypothesis that they were generated by rare retrotransposition events involving cellular mRNAs. Other interspersed repeats representing partial or mutant copies of genes encoding small nuclear RNAs (snRNAs) and tRNAs are found in mammalian genomes. Like processed pseudogenes derived from mRNAs, these nonfunctional copies of small RNA genes are flanked by short direct repeats and most likely result from rare retrotransposition events that have accumulated through the course of evolution. Enzymes expressed from a LINE are thought to have carried out these retrotransposition events involving mRNAs, snRNAs, and tRNAs. Mobile DNA Elements Have Significantly Influenced Evolution Although most mobile DNA elements appear to have no direct function other than to maintain their own existence, their presence has had a profound effect on the evolution of modern-day organisms. About half the spontaneous mutations in Drosophila result from insertion of a mobile DNA element into or near a transcription unit. In mammals, mobile elements cause a much smaller proportion of spontaneous mutations: about 10 percent in mice and 0.1–0.2 percent in humans. Still, mobile elements have been found in mutant alleles associated with several human genetic diseases. For example, insertions into the clotting factor IX gene cause hemophilia, and insertions into the gene encoding the muscle
protein dystrophin lead to Duchenne muscular dystrophy. The genes encoding clotting factor IX and dystrophin are both on the X chromosome. Consequently, disease resulting from a transposition into these genes occurs primarily in males, in which there is no second copy of the normal gene to complement the resulting mutation. In lineages leading to multicellular eukaryotes, homologous recombination between mobile DNA elements dispersed throughout ancestral genomes may have generated gene duplications and other DNA rearrangements during evolution (see Figure 7-2b). For instance, cloning and sequencing of the β-globin gene clusters from various primate species has provided strong evidence that the human HGB1 and HGB2 genes encoding fetal β-globins arose from an unequal homologous crossover between two L1 elements flanking an ancestral globin gene. Subsequent divergence of the duplicated genes led to the acquisition of distinct, beneficial functions by each duplicated gene. Unequal crossing over between mobile elements located within introns of a particular gene could lead to the duplication of exons within that gene (see Figure 7-2a). This process most likely influenced the evolution of genes that contain multiple copies of similar exons encoding similar protein domains, such as the fibronectin gene (see Figure 5-28). Some evidence suggests that during the evolution of multicellular eukaryotes, recombination between mobile DNA elements (e.g., Alu elements) in introns of two separate genes also occurred, generating new genes made from novel combinations of preexisting exons (Figure 7-18). This evolutionary process, termed exon shuffling, may have occurred
during the evolution of the genes encoding tissue plasminogen activator, the Neu receptor, and epidermal growth factor, all of which contain an EGF domain (see Figure 3-11). In this case, exon shuffling presumably resulted in the insertion of an EGF domain–encoding exon into an intron of the ancestral form of each of these genes.
FIGURE 7-18 Exon shuffling via recombination between homologous interspersed repeats. Recombination between interspersed repeats in the introns of separate genes produces transcription units with new combinations of exons. In the example shown here, a double crossover between two sets of Alu repeats results in an exchange of exons between two genes. Description This illustration shows two gene strands. Gene 1 at the top has blue rectangles and two A l u sections in pink. Gene 2 has green rectangles at different places, and shows two Alu sections. The A l u sections are each connected by 2 crossed pink lines. A downward arrow is labeled Double crossover between A l u elements. The two genes are depicted in their new order with the pink sections having changed positions with each other.
Both DNA transposons and LINE retrotransposons have been shown to occasionally carry unrelated flanking sequences — including exons — when they transpose to new sites by the mechanisms diagrammed in
Figure 7-19. This occasional transposition of flanking DNA sequences probably also contributed to exon shuffling during the evolution of contemporary genes.
FIGURE 7-19 Exon shuffling by transposition. (a) Transposition of an exon flanked by homologous DNA transposons into an intron on a second gene. As we saw in Figure 7-10, step 1 , transposase can recognize and cleave the DNA at the ends of the transposon inverted repeats. In gene 1, if the transposase cleaves at the left end of the transposon on the left and at the right end of the transposon on the right, it can transpose all the intervening DNA, including the exon from gene 1, to a new site in an intron of gene 2. The net result is an insertion of the exon from gene 1 into gene 2. (b) Integration of an exon into another gene via LINE transposition. Some LINEs have weak poly(A) signals. If such a LINE is in the -most intron of gene 1, during transposition its transcription may continue beyond its own poly(A) signals and extend into the exon, transcribing the cleavage and polyadenylation signals of gene 1 itself. This RNA can then be reverse-transcribed and integrated by the LINE ORF2 protein (see Figure 7-17) into an intron on gene 2, introducing a new exon (from gene 1) into gene 2. Description In illustration a, Gene 1 is a gray bar with two pink D N A transposons surrounding an exon situated in the middle of the strand. A downward arrow is labeled Transposase excision from gene 1. Gene 2 is a gray bar with green rectangles, and at the center is a light blue label showing insertion site. Under this the new gene 2 has the pink and blue transposon/exon series inserted. In illustration b, Gene 1 is a gray bar with a yellow section labeled LINE with a weak poly (A) signal at the right end. On the same gene is a blue rectangle with a label that reads, Gene's poly (A) signal at the right end. A downward arrow labeled Transcription and polyadenylation at the downstream exon points to a wavy red arrow. Gene 2 has the insertion site labeled at the center. Another downward arrow labeled O R F 2 reverse transcription and insertion points to a double strand at the bottom, with a yellow LINE inserted in it. In addition to causing changes in coding sequences, recombination between mobile elements and transposition of DNA adjacent to mobile elements probably played a significant role in the evolution of regulatory
sequences that control gene expression. As noted earlier, eukaryotic genes have transcription-control regions called enhancers that can operate over distances of tens of thousands of base pairs. The transcription of many genes is controlled through the combined effects of several enhancer elements. Insertion of mobile elements near such transcription-control regions probably contributed to the evolution of new combinations of enhancer sequences. These combinations, in turn, control which specific genes are expressed in particular cell types and the amount of the encoded protein produced in modern organisms, as we discuss in the next chapter. These considerations suggest that the early view of mobile DNA elements as completely selfish molecular parasites misses the mark. Rather, these elements have contributed profoundly to the evolution of multicellular organisms by promoting (1) the generation of gene families via gene duplication, (2) the creation of new genes via shuffling of preexisting exons, and (3) the formation of more complex regulatory regions that provide multifaceted control of gene expression. Today researchers are attempting to harness transposition mechanisms to insert therapeutic genes into patients as a form of gene therapy. A process analogous to that shown in Figure 7-19a is largely responsible for the rapid spread of antibiotic resistance among pathogenic bacteria, a major problem in modern medicine. Bacterial genes encoding enzymes that inactivate antibiotics (drug resistance genes) have become flanked by insertion sequences, generating drug resistance transposons. The widespread use of antibiotics in medicine and agriculture has led to
positive selection on drug resistance transposons. These transposons are often found incorporated into conjugating plasmids. Conjugating plasmids encode proteins that result in their replication and transfer to other bacterial cells — even cells of other related bacterial species — through a complex macromolecular tube called a pilus. These plasmids, called R factors (for drug resistance), can carry multiple drug resistance genes introduced by transposition and selected in environments, such as hospitals, where antibiotic-laced cleaning solutions are used to sterilize surfaces. R factors have led to the rapid spread of resistance to multiple antibiotics among pathogenic bacteria. Coping with the spread of R factors is a major challenge for modern medicine. KEY CONCEPTS OF SECTION 7.3 Transposable (Mobile) DNA Elements Transposable DNA elements are moderately repeated sequences interspersed at multiple sites throughout the genomes of multicellular eukaryotes. They are present less frequently in unicellular eukaryotic and prokaryotic genomes. DNA transposons move to new sites directly as DNA; retrotransposons are first transcribed into an RNA copy of the element, which is then reverse-transcribed into DNA (see Figure 7-8). A common feature of all mobile elements is the presence of short direct repeats flanking the element, generated as the result of staggered cuts in the target-site DNA that are filled in by a DNA polymerase during transposition (see Figure 7-10). Enzymes called transposases encoded by transposons themselves catalyze insertion of these sequences at new sites in genomic DNA. Although DNA transposons, similar in structure to bacterial IS elements, occur in eukaryotes (e.g., the Drosophila P element), retrotransposons are generally much more abundant, especially in vertebrates. LTR retrotransposons are flanked by long terminal repeats (LTRs) similar to those in retrovirus proviral DNA; like retroviruses, they encode reverse transcriptase and integrase. They move in the genome by being transcribed into RNA, which then
undergoes reverse transcription in the cytosol, nuclear import of the resulting DNA with LTRs, and integration into a host-cell chromosome (see Figure 7-14). Non-LTR retrotransposons, including long interspersed elements (LINEs) and short interspersed elements (SINEs), lack LTRs and have an AT-rich stretch at one end. They are thought to move by a nonviral retrotransposition mechanism mediated by LINE-encoded proteins involving priming of reverse transcription by chromosomal DNA (see Figure 7-17). SINE sequences exhibit extensive homology with 7SL small cellular RNA and are transcribed by RNA polymerase III. Alu elements, the most common SINEs in humans, are sequences of about 300 bp found scattered throughout the human genome at about 1.6 million sites (see Figure 7-4a). Some interspersed repeats are derived from cellular RNAs that were reversetranscribed and inserted into genomic DNA at some time in evolutionary history. Processed pseudogenes derived from mRNAs lack introns, a feature that distinguishes them from pseudogenes, which arose by sequence drift of duplicated genes. Mobile DNA elements most likely influenced evolution significantly by serving as sites for homologous recombination during unequal crossing over, leading to gene and exon duplication (see Figure 7-2) and exon shuffling (see Figure 7-18), and by mobilizing adjacent DNA sequences (see Figure 7-19).
Chromatin Structure
7.4 Structural Organization of Eukaryotic Chromatin and Chromosomes Now that we have examined the various types of DNA sequences found in eukaryotic genomes and how they are organized within the single, extremely long DNA molecules contained in each chromosome, we turn to the question of how DNA molecules of this length are organized within eukaryotic cells. Because the total length of cellular DNA (∼2 meters in humans) is roughly 100,000 times the diameter of the nucleus (∼20 μm for most human cells), the packing of DNA is crucial to cell architecture. It is also essential to prevent the long DNA molecules from getting knotted or tangled with each other during cell division, when they must be precisely segregated to daughter cells. Packing chromosomal DNA into the nucleus requires a number of proteins, in particular, histones. In this section, we consider the structural organization of histones and DNA to form chromosomes. We also examine the dynamic nature of these structures as they respond to gene expression signals and the changes that occur throughout the cell cycle. Chromatin Is Made of Nucleosomes
The key molecular structure that allows chromosomal DNA to undergo this incredible compaction is the nucleosome (Figure 7-20), which consists of 145–147 base pairs of DNA wrapped tightly ∼1 2/3 turns around a symmetrical, roughly globular protein complex called the histone octamer. The histone octamer is made of two copies each of four small (∼15 kDa), basic proteins. There are five major types of histone proteins in eukaryotes termed H2A, H2B, H3, and H4, for the four histones that make up the histone octamer (Figure 7-20), and histone H1, a linker histone. One copy of H1 binds linker DNA at the entry and exit sites of the 1 2/3 DNA wraps of 145–147 base pairs around the histone octamer core of the nucleosome (Figures 7-20 and 7-21). The histones are rich in positively charged basic amino acids, which interact with the negatively charged phosphate groups in DNA. The complex of DNA plus histones and other less abundant proteins is called chromatin.
FIGURE 7-20 Structure of the nucleosome based on x-ray crystallography. Nucleosome shown from the top (left) and from the side (right, rotated clockwise 90°). DNA is shown as a gray ribbon diagram. Histones are shown as space-filling models with H2A subunits in yellow; H2Bs in red; H3s in blue; and H4s in green. One H2A, H2B heterodimer projects out of the page on the lower right of the side view, while the other H2A, H2B heterodimer projects into the page, on the lower left of the side view. Only one H2A, H2B heterodimer is visible in the top view. The other H2A, H2B dimer is not visible in this view because it is behind the H3, H4 tetramer on the upper right. (See also the ribbon diagram of the histone polypeptide chains in Figure 7-26a, in which an H2A, H2B heterodimer is clearly visible on the lower left of the top view of the nucleosome.) [Data from K. Luger et al., 1997, Nature 389:251, PDB ID 1aoi.]
FIGURE 7-21 Structure of histone H1 interacting with both a nucleosome and linker DNA. Histones H2A, H2B, H3, and H4 are colored as in Figure 7-20. Histone H1 is purple. [Republished with permission of Nature Publishing Group, from K. Zhou, G. Gaullier, and K. Luger, 2019, Nat. Struct. Mol. Biol. 26: 3–13; permission conveyed through Copyright Clearance Center, Inc.] Examination of isolated chromatin by standard electron microscopy using staining with heavy metals revealed a “beads-on-a-string” organization of nucleosomes separated by a variable length of DNA of ∼50–150 bp called linker DNA (Figure 7-22). Until recently, it has not been possible to trace the path of a chromatin fiber in electron micrographs of nuclei of fixed cells because chromatin fibers could not be distinguished from other nuclear macromolecules of similar electron density after staining with standard EM methods. However, a recently developed technique, called ChromEMT, has now made this possible. ChromEMT specifically labels DNA in thin sections of fixed cells with the electron opaque compound . The resolution is sufficient to reveal chains of nucleosomes that can be traced through EM thin sections (Figure 7-23). Nearly all nuclear DNA was found to be associated with nucleosomes connected by flexible linker DNA. In regions visualized as euchromatin in standard electron micrographs, where most expressed genes are located, the linker DNA is extended between nucleosomes (Figure 7-23a) compared to more condensed regions of chromatin, known as heterochromatin, where few genes are transcribed. In heterochromatin, the linker DNA is curved and bent so that the nucleosomes are much closer together than in euchromatin (Figure 7-23a). The regions in the nucleus between nucleosomes in Figure
7-23a that were not stained are not empty but contain RNA as well as thousands of different nuclear proteins that are not stained by ChromEMT. As discussed below, some of these nuclear proteins are thought to control the density of chromatin fibers and the distance between nucleosomes in different regions of the nucleus.
FIGURE 7-22 “Beads-on-a-string” arrangement of nucleosomes in extracted chromatin. (a) Electron micrograph of chromatin extracted from isolated nuclei in a low ionic-strength buffer. The “beads” are nucleosomes (10 nm in diameter) and the “string” is connecting (linker) DNA. (b) A diagram of the beads-on-a-string configuration. Description An electron micrograph labeled a, shows bead like structures on a string. Linker D N A and Nucleosomes are labeled. The illustration labeled b, shows a close up of the "beads on a string" arrangement. A D N A helix moves into a close up view of the beads labeled Nucleosome, Histone octamer and Histone H 1. The linker D N A connects the beads.
FIGURE 7-23 Heterogeneity in nucleosome interactions and compaction. (a) Human small airway epithelial cells were fixed with glutaraldehyde, stained with ChromEMT (see text), and an EM tomogram was constructed. Scale bar = 100 nm. Arrow indicates the outer nuclear membrane. Regions of euchromatin and heterochromatin are indicated. (b)–(d) DNA and nucleosomes form disordered chromatin chains that have different nucleosome arrangements, conformations, and densities. Three categories of conformations are shown: stack, helical, and loop. Scale bar = 20 nm. (e), (f) Regions of the nucleus from interphase cells (e), and mitotic cells (f). Scale bar = 40 nm. [Republished with permission from American Association for the Advancement of Science, from H. D. Ou et al., 2017, “ChromEMT: Visualizing 3D Chromatin Structure and Compaction in Interphase and Mitotic Cells,” Science 357(6349):eaag0025; https://doi.org/10.1126/science.aag0025; permission conveyed through Copyright Clearance Center, Inc.] Description The micrograph labeled a, shows an epithelial tissue with two highlighted areas. At the top right, a circle is labeled heterochromatin, and at the bottom edge, a circle is labeled euchromatin. Micrographs labeled b, c, and d show stack, helical, and loop
Chromatin Structure Is Conserved Among Eukaryotes
conformations, respectively. Micrographs labeled e and f show interphase and mitotic cells. Chromatin is dispersed throughout much of the nucleus in interphase cells (those that are not undergoing mitosis). Further compaction of chromatin during mitosis (see Figure 6-3) produces the visible metaphase chromosomes whose morphology and staining characteristics were detailed by early cytogeneticists. ChromEMT of cells in mitosis reveals that the chromatin fibers are closely packed, making it difficult to trace the chromatin fiber (Figure 7-23f). Although every eukaryotic chromosome includes millions of individual protein molecules, each chromosome contains just one, extremely long, linear DNA molecule. The longest DNA molecules in human chromosomes, for instance, are or almost 10 cm in length. The structural organization of chromatin allows this vast length of DNA to be compacted into the microscopic constraints of a cell nucleus (see Figure 7-1). Despite this degree of compaction, chromatin is organized in such a way that specific DNA sequences within the chromatin are available for cellular processes such as transcription, replication, repair, and recombination. Chromatin Structure Is Conserved Among Eukaryotes The general structure of chromatin is remarkably similar in the cells of all eukaryotes, including fungi, plants, and animals, indicating that the structure of chromatin was optimized early in the evolution of eukaryotic
cells. The amino acid sequences for the four core histones that make up the nucleosome core (H2A, H2B, H3, and H4) are highly conserved among distantly related species. For example, the sequences of histone H3 from sea urchin and human tissue differ by only three amino acids, and H3 from the garden pea and human differ by only two amino acids. Apparently, significant deviations from the histone amino acid sequences were selected against during evolution. The similarity in sequence among histones from all eukaryotes indicates that they fold into very similar three-dimensional conformations. The amino acid sequence of H1, however, varies more from organism to organism than do the sequences of the other major histones. Minor histone variants encoded by genes that differ from the highly conserved major types also exist, particularly in vertebrates. For example, a special form of H2A, designated H2AX, is incorporated in place of H2A in a small fraction of nucleosomes throughout chromatin. At sites of double-stranded breaks in chromosomal DNA, H2AX becomes phosphorylated and participates in the chromosome repair process, probably by functioning as a binding site for repair proteins. In the nucleosomes within centromeres, H3 is replaced by a variant histone called CENP-A, which anchors the proteins that bind spindle microtubules during mitosis. Another histone variant, known as H3.3, replaces histone H3 in regions of DNA undergoing transcription. The replacement probably occurs when the histone octamer must be moved out of the way by histone chaperones as RNA polymerase is transcribing DNA. These and other minor histone variants differ only slightly in sequence from the major histones. These slight changes in histone sequence may influence the
Chromatin Is a Disordered Chain of Nucleosomes Packed Together at Different Concentration Densities in the Nucleus
interactions of nucleosomes with other nuclear proteins, the stability of the nucleosome, and the tendency of chromatin fibers containing the variant histone to condense. Chromatin Is a Disordered Chain of Nucleosomes Packed Together at Different Concentration Densities in the Nucleus As mentioned previously, the ChromEMT technique has made it possible to trace chains of nucleosomes separated by linker DNA in thin sections of fixed cells (Figure 7-23). A model for the organization of nucleosomes in a chromatin fiber derived from ChromEMT images of an interphase human cell is shown in Figure 7-24a. These chains of nucleosomes appear to range in diameter from 5 to 24 nm. The narrower dimension is thought to result from a projection of the fiber that shows primarily linker DNA, and the larger dimension from a projection that includes more than one nucleosome. Nucleosomes often contact each other; sometimes appearing to stack on each other (Figure 7-23b), sometimes packing in a helical conformation (Figure 7-23c), and sometimes forming a chain that loops back on itself (Figure 7-23d). Nucleosomes appear to interact with multiple alternative orientations and interacting surfaces. In darker staining regions of heterochromatin adjacent to the inner nuclear membrane (Figure 7-23a, arrow), the 5–24 nm chromatin fibers loop back on themselves frequently and are closer together than in euchromatin.
Figures 7-24b, c show models of heterochromatin and euchromatin based on the ChromEMT images.
FIGURE 7-24 Chromatin is composed of structurally disordered 5- to 24-nm-diameter chains that are packed together at different densities in euchromatic and heterochromatic regions. (a) Model of the chromatin fiber based on ChromEMT of small airway epithelial cells. Histone octamers are represented as orange discs and DNA as a blue tube. Large rectangle frames a region visualized as 24 nm in diameter. Small rectangle frames a region of 5-nm diameter. (b) and (c) Representation of the density of chromatin fibers in euchromatin and heterochromatin, respectively. [Part (a) republished with permission from American Association for the Advancement of Science, from H. D. Ou et al., 2017, “ChromEMT: Visualizing 3D Chromatin Structure and Compaction in Interphase and Mitotic Cells,” Science 357(6349):eaag0025; https://doi.org/10.1126/science.aag0025; permission conveyed through Copyright Clearance Center, Inc. Parts (b) and (c) republished with permission from American Association for the Advancement of Science, from Daniel R. Larson and Tom Mistel, 2017, “The Genome — Seeing It Clearly Now,” Science 357(6349):354–355; https://doi.org/10.1126/science.aao1893; permission conveyed through Copyright Clearance Center, Inc.]
Description The illustration labeled a shows a beads-on-a-string drawing of a D N A strand, highlighting a set of nucleosomes measuring 24 nanometers across and a section of Linker D N A measuring 5 nanometers across. A micrograph labeled b shows long chains of beads on strings, representing loosely packed groups of heterochromatin. A micrograph labeled c shows a more densely packed representation of euchromatin. Condensed metaphase chromosomes appear to have a chromatin structure similar to heterochromatin. In addition, in the condensed metaphase chromosome the chromatin fiber loops back on itself frequently compared to euchromatin and there are more interactions between nucleosomes, resulting in a high density of closely packed chromatin chains (Figure 723e, f, and Figure 7-24b, c). Scaffolding proteins are thought to constrain and compact the flexible chromatin chains into the mitotic chromosome architecture. One family of these chromatin scaffolding proteins is called structural maintenance of chromosome (SMC) proteins (Figure 7-25). Significantly, using the ChromEMT technique, higher order folding of regular helical structures of ∼30 nm, once thought to account for chromatin condensation in heterochromatin and during mitosis, was not observed.
FIGURE 7-25 Model of SMC complexes bound to chromatin. (a) Model of an SMC protein complex. (b) Model of SMC complex topologically linking two chromatin fibers. (c) Model for chromosome condensation by SMC complexes. See K. Nasmyth and C. H. Haering, 2005, Ann. Rev. Biochem. 74:595. Description The illustration a, shows the structure of a looped protein complex (S M C). The base is labeled as the head domain, the loop as the coiled-coil domain, and the top of the loop structure as the hinge complex. The two halves of the loop are labeled s m c 2 and s m c 4. The loop is joined at the base by kleisin protein. The head domain of the s m c 4
chain is linked to the C terminal of the kleisin protein, and the s m c 2 head domain is linked to the N terminal. The illustration b shows an S M C protein loop surrounding the two-chromatin fibers. In illustration c, a loop of chromatin is held in a topological knot by five S M C loops. Ringlike Structure of SMC Protein Complexes SMC proteins are critical for maintaining the structure of condensed chromosomes during mitosis. In extracts prepared from the large nuclei of Xenopus laevis (African frog) eggs, chromosomes can be induced to condense as they do in intact cells as they enter prophase of mitosis. This condensation fails to occur when one type of SMC protein called condensin is depleted from the extract with specific antibodies. Yeast with mutations in a related SMC protein called cohesin fail to properly associate sister chromatids following DNA replication in the S phase. As a result, chromosomes do not properly segregate to daughter cells during mitosis (see Chapter 19). Structurally related SMC proteins are required for proper segregation of chromosomes in bacteria and archaea, indicating that SMCs are an ancient class of proteins vital to chromosome structure and segregation in all domains of life. In the general structure of SMC proteins, each SMC monomer contains a hinge region where the polypeptide folds back on itself, forming a very long coiled-coil region and bringing the N- and C-termini together so they can interact to form a globular head domain (Figure 7-25a). The hinge domain of one monomer (blue in Figure 7-25) binds to the hinge domain
Modifications of Histone Tails Control Chromatin Condensation and Function
of a second monomer (red), forming a roughly U-shaped dimeric complex. The head domains of the monomers have ATPase activity and are linked by members of another small protein family called kleisins. The overall SMC complex is a ring with a diameter large enough to accommodate two chromatin fibers (Figure 7-25b) and is capable of linking two circular DNA molecules in vitro. Rings of SMC proteins are proposed to fold the chromatin fiber into loops, as diagrammed in Figure 7-25c. This model can explain why cleavage of the DNA at a relatively small number of sites leads to rapid dissolution of condensed metaphase chromosome structure, whereas protease cleavage of proteins has only a minor effect on chromosome structure until most of the protein is digested. When the DNA is cut anywhere in a long region of chromatin containing several chromatin loops, the broken ends can slip through the SMC protein rings, untying the topological knots that constrain the loops of chromatin. In contrast, a protease must cut most of the individual rings of SMC proteins before the topological constraints forming the loops are released completely. Modifications of Histone Tails Control Chromatin Condensation and Function Each of the histone proteins making up the nucleosome core contains an intrinsically disordered, flexible N-terminus of 19–39 residues extending from the globular structure of the nucleosome (Figure 7-26a). The H2A and H2B proteins also contain a flexible C-terminus extending from the
globular histone octamer core. These termini, called histone tails, are represented as dashed lines in Figure 7-26a in order to represent their lengths relative to the rest of the nucleosome.
FIGURE 7-26 Post-translational modifications observed on human histones. (a) Model of a nucleosome viewed from the top with histones shown as ribbon diagrams. This model depicts the lengths of the histone tails (dotted lines), which are not visible in the crystal structure (see Figure 7-20). The H2A N-terminal tails are at the bottom, and the H2A C-terminal tails are at the top. The H2B N-terminal tails are toward the bottom on the right and left, and the H2B C-terminal tails are at the bottom center. The H3 N-terminal tails extend between the gyres of DNA near the entry and exit point of DNA wrapping around the histone octamer core, and the H4 N-terminal tails extend downward and upward from the roughly disc-shaped nucleosome. Histones H3 and H4 have short C-terminal tails that are not modified. (b) Summary of post-translational modifications observed in human histones. Histone-tail sequences are shown in the one-letter amino acid code, numbered beginning with 1 at the N-terminus (see Figure 2-14). The main portion of each histone that is part of the histone octamer core is depicted as an oval. These modifications do not all occur simultaneously on a single histone molecule. Rather, specific combinations of a few of these modifications are observed on any one histone. See K. Luger and T. J. Richmond, 1998, Curr. Opin. Genet. Devel. 8:140.
[Part (a) Data from K. Luger et al., 1997, Nature 389:251, PDB ID 1aoi. Part (b) Data from R. Margueron et al., 2005, Curr. Opin. Genet. Devel. 15:163.] Description In illustration a, A 3-D ribbon model of the D N A-histone complex shows the histone tails and the sites for post-translational modifications. The illustration labeled b shows the amino acid sequence for the tails of H 2 A, H 2 B, H 3, H 4, and H 1 B histone units. Possible post-translational modifications include phosphorylation, methylation, acetylation, and ubiquitinylation. In the H 2 A tail, phosphorylation at serine (S), and threonine (T) residues and ubiquitinylation at lysine (K) are possible. In H 2 B, ubiquitinylation and acetylation at lysine and phosphorylation at serine can occur. In H 3, phosphorylation at threonine and serine residues, methylation at arginine and lysine residues, and acetylation at lysine residues are possible. In H 4, phosphorylation at serine and histidine, acetylation at lysine, and methylation at arginine and lysine residues can occur. In H 1 B, methylation and acetylation at lysine can occur. Histone-tail–amino acid residue side chains are subject to multiple types of reversible, post-translational covalent modifications such as acetylation, methylation, phosphorylation, and ubiquitinylation. Figure 726b summarizes the most common types of post-translational modifications observed in human histones. A particular histone protein never has all of these modifications simultaneously, but the histones in a single nucleosome may contain several of these modifications simultaneously. The particular combinations of histone-tail posttranscriptional modifications found in different regions of chromatin constitute a histone code that influences chromatin function by creating or removing binding sites for chromatin-associated proteins depending on the specific combinations of the modifications present. Here we describe the
most abundant kinds of modifications found in histone tails and the association of these modifications with chromatin condensation and function. We end with a discussion of a special case of chromatin condensation, the inactivation of X chromosomes in female mammals. Histone Acetylation Histone-tail lysines in the amino termini undergo reversible acetylation and deacetylation. In the acetylated form, the positive charge of the lysine ε-amino group is neutralized. Histone acetylation correlates with increased sensitivity of chromatin DNA to nuclease digestion — an observation indicating that histone acetylation is associated with a more open form of chromatin. This correlation can be demonstrated by conducting experiments in which isolated nuclei are digested with DNase I. Next the DNA is separated from chromatin protein, digested with a restriction enzyme, and analyzed by Southern blotting. An intact gene treated with a restriction enzyme yields fragments of characteristic sizes. But when the DNA is exposed first to DNase I, there are two possible results seen in the Southern blot. One, the gene is cleaved by DNase I at random sites within the boundaries of the restriction enzyme cut sites. Consequently, any Southern blot bands normally seen with that gene will be lost. Two, the gene is hidden within the chromatin so that DNase I molecules could not access it and cut it up. In that case, the Southern blot would show the characteristic banding pattern for that gene. This method was first used to compare the structure of chromatin in the region of the chicken β-globin gene in cells in which the gene is not transcribed and cells in which the gene is actively transcribed (Figure 7-27). The β-globin gene is
transcriptionally inactive in non-erythroid cells (MSB cells), but is actively transcribed in erythroid progenitor cells (erythroblasts). In nonerythroid cells, the histones around the β-globin gene have relatively low levels of acetylation, and the chromatin that contains the β-globin gene is resistant to DNase I. In contrast, in erythroid progenitor cells, the histones around the β-globin gene are acetylated, and the chromatin that contains the β-globin gene is sensitive to DNase I (Figure 7-27). These results indicate that the chromatin structure of non-transcribed DNA in hypoacetylated chromatin makes the DNA less accessible to DNase I than it is in transcribed, hyperacetylated chromatin. The proposed model is that in non-erythroid cells, chromatin containing the β-globin gene is folded into condensed structures with closely spaced nucleosomes that sterically inhibit access to the associated DNA by the nuclease, as for the region of heterochromatin near the nuclear envelope indicated in Figure 7-23a. In contrast, the transcribed gene is associated with a more unfolded form of chromatin, which allows the nuclease better access to the associated DNA, as in the regions designated euchromatin in Figure 7-23a. More generally, it is presumed that the condensed chromatin structure around the β-globin gene in non-erythroid cells sterically inhibits the proteins involved in transcription from accessing the β-globin promoter and other transcription control sequences in the DNA. Thus histone acetylation and deacetylation appear to be one means of regulating transcription (see Chapter 8).
EXPERIMENTAL FIGURE 7-27 Nontranscribed genes are less susceptible to DNase I digestion than active genes. Chick embryo erythroblasts at 14 days actively synthesize
globin, whereas undifferentiated chicken lymphoblastic leukemia (MSB) cells do not. (a) Nuclei from each type of cell were isolated and exposed to increasing concentrations of DNase I. The nuclear DNA was then extracted and treated with the restriction enzyme BamHI, which cleaves the DNA around the globin sequence and normally releases a 4.6-kb globin DNA fragment. (b) The DNase I- and BamHI-digested DNA was subjected to Southern blot analysis with a probe of labeled cloned adult globin DNA, which hybridizes to the 4.6-kb BamHI fragment. If the globin gene is susceptible to the initial DNase digestion, it should be cleaved repeatedly and would not be expected to show this fragment. As seen in the Southern blot, the transcriptionally active DNA from the 14-day globinsynthesizing cells was sensitive to DNase I digestion, indicated by the absence of the 4.6-kb band at high nuclease concentrations. In contrast, the inactive DNA from MSB cells was resistant to digestion. These results suggest that the inactive DNA is in a more condensed form of chromatin in which the globin gene is shielded from DNase digestion. See J. Stalder et al., 1980, Cell 19:973. [Part (b) Republished with permission of Elsevier, from J. Stalder et al., 1980, “Hb Switching in Chickens,” Cell 19(4):973–980; permission conveyed through Copyright Clearance Center, Inc.] Description The illustration labeled a on the left shows a group of 5 chromatin shapes labeled decondensed chromatin. Below that is a D N A strand highlighting the Globin segment. A row of 4 pink arrows represents D N ase acting on the globin. Two arrows on either side of the globin segment correspond to Bam H I. This diagram has the label 14-day erythroblast. On the right, 15 shapes of chromatin are tightly packed together. Below that is a D N A strand highlighting the Globin portion, the pink arrows have X X X X on them, indicating that the DNase is not acting. In illustration b, the southern blot analysis shows bars of D N A. The readings corresponding to the column headers on top range from 0 to 1.5 D Nase (micrograms per milliliter). A brace corresponding to 0 to 1.5 reads, D N A from 14 day erythroblasts and 1.5 corresponds to D N A from M S B. An arrow pointing to a blot under the last column reads, 4.6 kilobases.
Genetic studies in yeast indicated that histone acetyl transferases (HATs), the enzymes that acetylate specific lysine residues in histones, are required for activation of transcription of a number of genes. These enzymes are now known to have other substrates that influence gene expression in addition to histones. Consequently, they are more generally known as nuclear lysine acetyl transferases, or KATs, because K represents lysine in the single-letter code for amino acids (see Figure 2-14). Conversely, early genetic studies in yeast indicated that complete repression of many yeast genes requires the action of histone deacetylases (HDACs) that remove acetyl groups of acetylated lysines from histone tails, as discussed further in Chapter 8. Other Specific Histone-Tail Post-Translational Modifications Histone tails in chromatin undergo a variety of other covalent modifications at specific amino acids in addition to lysine acetylation (see
Figure 7-26b). Lysine ε-amino groups can be methylated, a process that prevents acetylation, thus maintaining their positive charge. Moreover, the nitrogen of lysine ε-amino groups can be methylated once, twice, or three times. Arginine side chains can also be methylated. The oxygen in hydroxyl groups of serine and threonine side chains can be reversibly phosphorylated, introducing two negative charges. Each of these posttranslational modifications contributes to the binding of chromatinassociated proteins that participate in the control of chromatin condensation and the ability of DNA and RNA polymerases to replicate or
transcribe the associated DNA. The last of the most common posttranslational modifications of histone tails is monoubiquitinylation. In this process, a single 76–amino acid ubiquitin molecule can be reversibly added to a lysine in the C-terminal tails of H2A and H2B. Recall that addition of multiple, linked ubiquitin molecules to a protein can mark it for degradation by the proteasome (see Figure 3-32). In this case, however, the addition of a single ubiquitin molecule does not greatly affect the stability of a histone, although it does influence chromatin compaction. Heterochromatin does not fully decondense following mitosis, remaining in a compacted state during interphase and usually associating with the nuclear envelope, nucleoli, and additional distinct foci (Figure 7-28a). Heterochromatin includes centromeres and telomeres of chromosomes as well as transcriptionally inactive genes. Heterochromatin usually contains histone H3 modified by methylation of lysine 9. In contrast, euchromatin generally contains histone H3 extensively acetylated on lysines 9, 18, and 27, especially at promoters and enhancers where there is also phosphorylation of H3 serine 10 (Figures 7-26b and 7-28b). Methylation of H3 lysine 4 is observed at transcription start sites of most metazoan genes.
FIGURE 7-28 Histone-tail post-translational modifications in heterochromatin versus euchromatin. (a) In this electron micrograph of a bone marrow stem cell, the dark-staining areas in the nucleus outside the nucleolus are heterochromatin. The light-staining, whitish areas are euchromatin. (b) The modifications of histone N-terminal tails in heterochromatin and euchromatin differ, as illustrated here for histone H3. Note in particular that histone tails are generally much more extensively acetylated in euchromatin than in heterochromatin. Heterochromatin is much more condensed (thus less accessible to proteins) and is much less transcriptionally active than is euchromatin. (c) HP1 contributes to the condensation of heterochromatin by binding to histone H3 N-terminal tails trimethylated at lysine 9, then associating with other histone-bound HP1 molecules. (d) Heterochromatin condensation can
spread along a chromosome because HP1 binds the histone methyltransferase (HMT) that methylates lysine 9 of histone H3. This creates a binding site for HP1 on the neighboring nucleosome. The spreading process continues until a boundary element is encountered. See G. Thiel et al., 2004, Eur. J. Biochem. 271:2855, and A. J. Bannister et al., 2001, Nature 410:120. [Part (b) Data from T. Jenuwein and C. D. Allis, 2001, Science 293:1074.] Description The illustration labeled a, shows an electron micrograph of a nucleus with Euchromatin, nucleolus, and heterochromatin. The illustration labeled b shows peptide sequences in inactive, condensed chromatin (heterochromatin) and active, open chromatin (euchromatin) showing greater degree of modification to histone tails in euchromatin. The illustration labeled c, shows the formation of heterochromatin by methylation of lysine 9 and association with H P 1. The formation of heterochromatin is depicted in several steps. 1. The histone tail of H 3 is trimethylated at lysine 9 by histone H 3 K 9 methyl transferase. 2. H P 1 binds via its chromodomain to the histone tail. 3. The presence of H P 1 induces aggregation with other H P 1-bound nucleosomes, leading to the dense structure of heterochromatin. The illustration labeled d, shows a row of chromatin, starting at left with two active chromatin labeled A c A c, attached to this is a yellow rectangle labeled boundary element. At the right of the boundary element is 4 heterochromatin each labeled H P 1 M e 3, and text below reads, spreading of silenced and H P 1 coated heterochromatin. Reading the Histone Code The histone code of modified amino acids is read by proteins that bind to the modified histone tails and promote condensation or decondensation of chromatin. For example, eukaryotes express a number of proteins containing a domain called a chromodomain that binds to histone tails when they are methylated at specific lysines. One example of such a
protein is heterochromatin protein 1 (HP1). The chromodomain of HP1 binds the H3 N-terminal tail only when it is di- or trimethylated at lysine 9 (see Figure 7-28b). HP1 also contains a second domain called a chromoshadow domain because it is frequently found in proteins that contain a chromodomain. The chromoshadow domain binds to chromoshadow domains in other proteins. Consequently, chromatin containing H3 di- and trimethylated at lysine is assembled into a condensed chromatin structure by HP1 (see Figure 7-28c, bottom), although the structure of this chromatin is as yet not well understood. In addition to binding to itself, the chromoshadow domain of HP1 also binds the enzyme that methylates H3 lysine 9, an H3K9 histone methyl transferase (HMT) (see Figure 7-28d). As a consequence, nucleosomes adjacent to a region of HP1-containing heterochromatin become methylated at lysine 9 (see Figure 7-28d). This methylation creates a binding site for another HP1 that can bind the H3K9 HMT; so in this way, the heterochromatin structure spreads along the chromosome until a boundary element is encountered that blocks further spreading. Boundary elements are regions in chromatin where several nonhistone proteins bind to DNA, possibly blocking histone methylation on the other side of the boundary. Epigenetic Memory The model of heterochromatin formation in Figure 7-28d provides an explanation for how heterochromatic regions of a chromosome are reestablished following DNA replication during S phase of the cell cycle.
When DNA in heterochromatin is replicated, the histone octamers that are di- or trimethylated at H3 lysine 9 are distributed to both daughter chromosomes along with an equal number of newly assembled histone octamers. The H3K9 HMT associated with the H3K9 di- and trimethylated nucleosomes methylates lysine 9 of the newly assembled, neighboring nucleosomes, regenerating the heterochromatin covering the same DNA sequence in both daughter chromosomes. Consequently, heterochromatin is marked with an epigenetic code that maintains the repression of associated genes in replicated daughter cells. It is referred to as “epi-” genetic because it is not determined by DNA sequence, but rather by the post-translational modifications on the histone tails of the parental chromatin. There are other protein domains that associate with histone-tail modifications typical of euchromatin. Several proteins involved in stimulating gene transcription, such as the largest subunit of TFIID, contain protein domains of ∼62 amino acids called bromodomains (see
Chapter 8). A bromodomain binds to acetylated histone tails and therefore is associated with transcriptionally active chromatin. TFIID and other bromodomain-containing proteins also have histone acetylase activity, which helps to maintain the chromatin in a hyperacetylated state that is conducive to transcription. Thus we see that an epigenetic code associated with histone posttranslational modifications helps to maintain the transcriptional activity of genes in euchromatin and the repression of genes in heterochromatin through successive cell divisions. These epigenetic codes for
heterochromatin and euchromatin are essential during early embryonic development when they maintain the patterns of gene expression established in different cell types as these differentiated cells undergo multiple rounds of cell division. Abnormal alterations in these epigenetic codes have been found to contribute to the pathogenic replication and behavior of cancer cells (see Chapter 25). In summary, multiple types of covalent modifications to histone tails influence chromatin structure by altering nucleosome–nucleosome interactions and interactions with additional proteins that participate in or regulate processes such as transcription and DNA replication. The mechanisms and molecular processes governing chromatin modifications that regulate transcription are discussed in greater detail in the next chapter. Interphase Chromosome Territories Individual interphase chromosomes are less condensed than metaphase chromosomes (see Figure 7-23e, f). Nonetheless, interphase chromatin is not spread throughout the entire nucleus. In situ hybridization of interphase nuclei with chromosome-specific fluorescently labeled probes (called chromosome paint probes) has shown that the DNA of each interphase chromosome is localized within a region of the nucleus (Figure 7-29a). These localized regions are called chromosome territories. Note in
Figure 7-29b how little overlap there is between chromosomes in an interphase nucleus. The precise position of each chromosome is not the same in different cells, although large chromosomes tend to lie at the
periphery of the nucleus and small chromosomes toward the center. Also, repeats of rRNA transcription units on chromosomes 13, 14, 15, 21, and 22, known as nucleolar organizers, associate with nucleoli found near the center of the nucleus. EXPERIMENTAL FIGURE 7-29 During interphase, human chromosomes remain in non-overlapping territories in the nucleus. (a) Fixed interphase human fibroblasts were hybridized in situ to fluorescently labeled probes specific for sequences along the full length of human chromosomes 7 (cyan) and 8 (purple). DNA is stained blue with DAPI. In the diploid cell, each of the two chromosome 7s and two chromosome 8s is restricted to a territory or domain within the nucleus, rather than stretching throughout the entire nucleus. (b) This image from a fixed interphase fibroblast from a human male was made with a method similar to that used in (a), except that chromosome paint probes specific for each chromosome were hybridized to the cell to reveal the locations of nearly all the chromosomes. Some of the chromosomes are not observed in this confocal slice through the nucleus. [Part (b) From A. Bolzer et al., 2005, “Three-Dimensional Maps of All Chromosomes in Human Male Fibroblast Nuclei and Prometaphase Rosettes,” PLoS Biol. 3:826.] Description
The illustration labeled a, shows an egg shaped fluorescent blue nucleus with green (chromosome 7) and pink (chromosome 8) patches in separate areas. The illustration labeled b, shows a multicolored oval shaped structure with different human chromosomes, labeled by their numbers and the X and Y genes. Each color is in a separate area of the egg shape. X-Chromosome Inactivation in Mammalian Females An important example of epigenetic repression of gene expression is the random inactivation and condensation of one X chromosome in female mammalian cells. Each female mammal has two X chromosomes, one contributed by the egg and one contributed by the sperm . Early during embryonic development, random inactivation of either or occurs in each somatic cell. From that point forward during embryonic development and in adults, every daughter cell generated by cell division maintains the same inactive X chromosome as its parent cell. As a result, the adult female is a mosaic of clones, about half expressing the genes from and the rest expressing the genes from Inactivation of one X chromosome is the mechanism of dosage compensation in female mammals, a process that ensures that cells of females express proteins encoded on the X chromosome at the same levels as the cells of males, which have only one X chromosome. Histones associated with an inactive X chromosome have posttranslational modifications characteristic of other regions of heterochromatin: hypoacetylation of lysines, di- and trimethylation of
histone H3 lysine 9, and H3 lysine 27, and a lack of methylation at histone H3 lysine 4 (see Figure 7-28b). X-chromosome inactivation is controlled by the X-inactivation center, a complex locus containing two transcription units on the X chromosome that determines which of the two X chromosomes will be inactivated in each cell. The X-inactivation center includes the XIST gene, which encodes a remarkable, long nonproteincoding RNA that associates with multiple regions of the X chromosome from which it was transcribed, maintaining silencing of that chromosome. Although the mechanism of X-chromosome inactivation is not fully understood, it involves several processes, including the action of Polycomb protein complexes, which are discussed further in Chapter 8. One subunit of the Polycomb complex contains a chromodomain that binds to histone H3 tails when they are trimethylated at lysine 27. The Polycomb complex also contains a histone methyl transferase specific for H3 lysine 27. This finding helps to explain how the X-inactivation process spreads along large regions of the X chromosome and how it is maintained through DNA replication, apparently in a manner similar to heterochromatization by the binding of HP1 to histone H3 tails methylated at lysine 9 (see Figure 7-28c, d). The mechanism of X-chromosome inactivation is another example of an epigenetic process; that is, a process that affects the expression of specific genes and is inherited by daughter cells, but is not the result of a change in DNA sequence. In other words, the activity of genes on the X chromosome in female mammals is controlled by chromatin structure, rather than by the nucleotide sequence of the underlying DNA. And the inactivated X
chromosome (either or ) is maintained as the inactive chromosome in the progeny of all future cell divisions because the histones are modified in a specific, repressing manner that is faithfully inherited through each cell division. Topological Domains Within Chromosome Territories It is now possible to gain information about the three-dimensional spatial organization of chromatin within nuclei of interphase cells using a group of related methods referred to as chromosome conformation capture methods. These methods utilize massively parallel DNA sequencing and the ability to sequence tens of millions of 50–100-bp DNA fragments (see
Chapter 6). The general strategy of chromosome conformation capture is illustrated in Figure 7-30, where protein-dependent associations between distant regions of chromatin are represented in (a), and regions of chromatin not specifically associated with another region are shown in (b). Step 1 : Intact cells are treated with chemical cross-linkers such as formaldehyde that diffuse through cell membranes and covalently crosslink protein to protein and protein to DNA. Step 2 : The cross-linked chromatin is isolated and either digested with a restriction enzyme or subjected to intense sonication to mechanically shear the DNA into fragments of 200–600 bp. Step 3 : Short oligonucleotide linkers are then ligated to the ends of the DNA fragments. These linkers contain a cytosine linked to a biotin at the C-5 position (see Figure 2-17). Step 4 :After removal of excess linker, the preparation is diluted considerably and
subjected to treatment with DNA ligase. Because the preparation is diluted, ligations occur preferentially between the ends of fragments held in close proximity by cross-links. Step 5 : After ligation, the proteinDNA cross-linking reaction is reversed, the protein is digested with proteases, and the DNA is isolated and further sonicated. Ligated fragments are separated from other fragments using streptavidin, which binds the biotin in the linkers added in step 3 .
FIGURE 7-30 Chromosome conformation capture. (a, b) Strategy of chromatin conformation capture methods. See text for explanation. Gray and blue tubes represent regions of DNA separated by in the genome sequence. Biotin is represented by red flags. Data from E. Lieberman-Aiden, 2009, Science 326:289. (c) Heat map of
chromosome conformation capture data for a region of chromosome 6 in mouse embryonic stem cells. The sequence from 49 to 54 Mb from the left end of chromosome 6 is represented on both axes. A value of 100 (dark red) indicates that a sequence anywhere within the 10-kb region on the x axis was found ligated to a sequence from anywhere in the 10-kb region on the y axis 100 times. Since the probability that two ends generated by sonication will be ligated together is higher for ends that are close together than for ends that are far apart, the intensity of the red color in any pixel indicates the relative proximity of the sequences in the two 10-kb intervals in the nuclei at the time of cross-linking. Inset shows a model of chromatin folding that is consistent with these results. [Part (c) Data from J. R. Dixon, 2012, Nature 485:376.] Description The illustration a, shows a 6 step path for chromosome conformation capture. The steps read as follows: 1. Cross-link protein to protein and protein to D N A; 2. Shear D N A to 200 to 600 base pairs; 3. Ligate on linkers marked with biotin; 4. Dilute and ligate; 5. Purify, shear D N A; pull down biotin; and 6. Sequence. The illustration labeled b shows a 6 step path in a more simplified form showing just the bands of D N A as they form a ring and then are cut apart. The heat map labeled c is a square plot. Both axis are labeled Megabases on chromosome 6. The color key moves from white to red, corresponding to 0 to 100. The color scale is labeled normalized interacting counts. The scale ranges from 49 to 54. A left-to-right downward diagonal shows the topological domains clustered together. Two topological domains, labeled "a" and "b" are indicated. A small inset image shows a model of chromatin showing two tightly knotted regions, the topological domains a and b, separated by a chain, the boundary element. The purified, ligated fragments are then sequenced (step 6 ). Ligation points are marked by the duplicated sequence of the oligonucleotide linker (step 4 ). Sequences on each side of the ligation point are mapped to the genome. In cases in which the two ends of a single fragment were linked
together (Figure 7-30b), the sequences on either side of the oligonucleotide linker sequence will map within a few hundred bases of each other on the genome, since the ligated fragments were only a few hundred bases long. But in cases in which fragments that are distant in the genomic sequence were ligated together because they were cross-linked to proteins holding them together (Figure 7-30a), the sequences will map far apart. The observation of distant (>10 kb) sequences repeatedly ligated to each other implies that their respective regions of chromatin were associated with each other in vivo. The data from a chromatin conformation capture assay can be plotted on a two-dimensional heat map (Figure 7-30c). In this plot, the sequence of the same portion of the genome is plotted on both the x and y axes, with each pixel equivalent to 10 kb. The pixel at coordinates x, y is colored red where a sequence at coordinate x was ligated to a sequence at coordinate y. The intensity of the red color is proportional to the numbers of ligation events observed that linked a sequence in the 10-kb interval x with a sequence in the 10-kb interval y.
Figure 7-30c shows the plot generated for a roughly 5.5-Mb region of chromosome 6 in mouse embryonic stem cells. It is immediately apparent that the genome is divided into regions called topological domains, in which a chromosomal region is far more likely to be ligated to another sequence within the same topological domain than it is to be ligated to a sequence in another topological domain. These topological domains are on the order of 200 kb to 1.5 Mb in length, with a median size of 880 kb. For example, sequences in the interval of chromosome 6 between 50.9 Mb and
51.3 Mb (Figure 7-30c, topological domain A) are much more likely to be ligated to each other than to sequences in the interval from 51.3 Mb to
52.2 Mb (topological domain B) or to sequences from any of the other topological domains. In situ hybridization studies showed that sequences within a topological domain lie much closer to each other in the fixed cell nucleus than to sequences the same distance away in base pairs, but in a neighboring topological domain. These results have been interpreted to indicate that the chromatin fiber is folded into topological domains, as represented in the inset of Figure 7-30c. The topological domains are separated by shorter regions of chromatin, called boundary elements, that do not interact with distant regions of chromatin. Boundary elements such as this were discussed earlier where they were observed to block spreading of histone H3 lysine 9 tri-methylation and HP1-binding along chromatin tri-methylated on lysine 9 (see Figure 7-28d). Topological domains are long enough to contain several average-sized genes. One area of current research is exploring what protein-DNA interactions might be responsible for establishing boundary elements between topological domains. As we will see in Chapter 8, related chromosome conformation capture techniques have provided strong evidence that proteins bound to enhancers interact with proteins bound to promoters many kilobases away. Metaphase Chromosome Structure Condensation of chromosomes during prophase (see Figure 18-38) appears to involve the formation of many more loops of chromatin (as diagrammed for heterochromatin (see Figure 7-25c), so that the length of each loop is greatly reduced compared with chromatin loops in interphase
cells. As a result, chromosomes condense into structures of much greater width than interphase chromosomes and decrease in length several-fold, generating the rod-shaped condensed chromosomes observed during metaphase (Figure 7-31).
Additional Nonhistone Proteins Regulate Transcription and Replication
FIGURE 7-31 Typical metaphase chromosome. As seen in this scanning electron micrograph, the chromosome has replicated and comprises two chromatids, each containing one of two identical DNA molecules. The centromere, where the chromatids are attached at a constriction, is required for their separation late in mitosis. Special telomere sequences at the ends function in preventing chromosome shortening. Experiments with frog egg extracts have shown that a protein complex called condensin, composed of SMC subunits (see Figure 7-25 and
Chapter 19), contributes to chromosome condensation using energy from ATP hydrolysis. Ultimately, the full lengths of the two associated daughter chromosomes generated by DNA replication during the previous S phase of the cell cycle (see Figure 1-22) condense into bar-shaped structures (chromatids) that in most eukaryotes are linked at the central constriction called the centromere (Figure 7-31). Additional Nonhistone Proteins Regulate Transcription and Replication The total mass of the histones associated with DNA in chromatin is about equal to that of the DNA. Interphase chromatin and metaphase chromosomes also contain many other proteins in addition to histones. For instance, thousands of different transcription factors are associated with interphase chromatin. The structure and function of these proteins, which regulate transcription, are examined in Chapter 8. Other low-abundance
nonhistone proteins associated with chromatin regulate DNA replication during the eukaryotic cell cycle (see Chapter 19). A few other nonhistone DNA-binding proteins are present in much larger amounts than the transcription or replication factors. Some of these proteins exhibit high mobility during electrophoretic separation and thus have been designated HMG (high-mobility group) proteins. When genes encoding the most abundant HMG proteins are deleted from yeast cells, normal transcription is disturbed in most genes examined. Some HMG proteins have been found to assist in the cooperative binding of several transcription factors to specific DNA sequences that are close to each other, stabilizing multiprotein complexes that regulate transcription of a neighboring gene, as discussed in Chapter 8. KEY CONCEPTS OF SECTION 7.4 Structural Organization of Eukaryotic Chromosomes and Chromatin Each eukaryotic chromosome contains a single extremely long DNA molecule associated with about an equal mass of proteins called histones, as well as less abundant amounts of thousands of different chromatin-associated proteins, forming a DNA-protein complex called chromatin. The key structural element of chromatin is the nucleosome formed from two copies each of four core histones (H2A, H2B, H3, and H4) that form a globular protein domain around which 147–149 base pairs of DNA are tightly wrapped (see Figure 720). Nucleosomes are strung together by a variable length (∼50–150 base pairs) of linker DNA between them (see Figure 7-22). Using a recently developed method called ChromEMT which stains DNA with the electron opaque compound , chromatin in fixed cells is observed in the electron microscope as a disordered 5- to 24-nm-diameter granular chain of nucleosomes and linker DNA that is folded into different concentration densities in different regions of the nucleus (see Figures 7-23 and 7-24).
The chromatin in transcriptionally active regions of DNA, called euchromatin, exists in a more extended form than the chromatin in regions called heterochromatin where nucleosomes are more densely packed. Most genes in heterochromatin are transcriptionally repressed. In heterochromatin the chromatin chain folds back on itself at short intervals (see Figure 7-23e, f and Figure 7-24b, c), and nucleosomes associate with each other through many alternative surfaces (Figure 7-23b–d) to a much greater extent than in interphase chromosomes. This results in a large increase in nucleosome density in heterochromatin compared to euchromatin (see Figure 723e, f). Flexible, intrinsically disordered N-terminal tails of 16–39 amino acids extend from the globular region of the histone octamer core (see Figure 7-26a). Histones H2A and H2B also have shorter, intrinsically disordered regions at their C-termini. Amino acid side chains in these histone tails are reversibly modified by acetylation, methylation, phosphorylation, and monoubiquitinylation (see Figure 7-26b), as well as other, less abundant post-translational modifications. These modifications influence chromatin structure by regulating the binding of histone tails to other, less abundant chromatinassociated proteins that control chromatin compaction, transcription, and DNA replication. Proteins involved in transcription, replication, and repair, and enzymes such as DNase I, can more easily access the DNA in euchromatin with hyperacetylated histone tails than in chromatin with hypoacetylated histone tails, as in heterochromatin. An abundant protein associated with heterochromatin, heterochromatin protein 1 (HP1) uses a chromodomain to bind to histone H3 trimethylated at lysine 9. The chromoshadow domain of HP1 associates with itself and with the histone methyl transferase that methylates H3 lysine 9. These interactions cause condensation of the chromatin fiber and spreading of the heterochromatic structure along the chromosome until a boundary element is encountered (see Figure 7-28c, d). One X chromosome in nearly every cell of mammalian females consists of highly condensed heterochromatin, resulting in repression of nearly all genes on that chromosome. This X chromosome inactivation is the dosage compensation mechanism used in mammals so that genes on the X chromosome are expressed at the same level in both males and females. In interphase cells, chromosomes are localized to largely non-overlapping territories in the nucleus (see Figure 7-29b). The results of chromosome conformation capture experiments indicate that chromatin is organized into topological domains of about 200 kb to 1.5 Mb separated by boundary elements (see Figure 7-30c). Chromatin within a topological domain is more densely packed than the chromatin between topological domains in boundary elements. As a result, the chromatin in a topological domain is much more likely to
interact with another region of chromatin in the same topological domain than with a region of chromatin in another topological domain (see Figure 7-30c). During mitosis, chromosomes condense greatly, decreasing their lengths and increasing their diameters to generate metaphase chromosomes visible by light microscopy. Recent observations using ChromEMT indicate that chromatin fibers in condensed mitotic chromosomes fold back on themselves at shorter intervals than in euchromatin, and that nucleosomes associate with each other with multiple possible orientations and surfaces much more frequently in mitotic chromosomes compared to interphase chromosomes (see Figure 7-23b–d) resulting in the much higher density of nucleosomes in mitotic chromosomes.
Chromosome Number, Size, and Shape at Metaphase Are Species-Specific
7.5 Morphology and Functional Elements of Eukaryotic Chromosomes Having examined the detailed structural organization of chromosomes in the previous section, we now view them from a more global perspective. Early microscopic observations on the number and size of chromosomes and their staining patterns led to the discovery of many important general characteristics of chromosome structure. Researchers subsequently identified specific regions of chromosomes that are critical to their replication and segregation into daughter cells during cell division. In this section, we discuss these functional elements of chromosomes and consider how chromosomes evolved through rare rearrangements of ancestral chromosomes. Chromosome Number, Size, and Shape at Metaphase Are SpeciesSpecific In interphase cells, as noted previously, chromosome territories can be visualized with fluorescently labeled hybridization probes (see Figure 729). Because chromosomes condense during mitosis and meiosis (see
Figure 7-23e, f) and become visible in the light microscope (see Figure 7-
31), almost all cytogenetic work (i.e., studies of chromosome morphology) has been done with condensed metaphase chromosomes obtained from dividing cells — either somatic cells in mitosis or dividing gametes during meiosis. At the time of mitosis and meiosis, cells have already progressed through the S phase of the cell cycle and have replicated their DNA (see Chapter 19). Consequently, the chromosomes that become visible during metaphase are duplicated structures. Each metaphase chromosome consists of two sister chromatids, which are linked at a constricted region, the centromere (see Figure 7-31). The number, sizes, and shapes of the metaphase chromosomes constitute the karyotype, which is distinctive for each species. While somatic cells from one species generally have the same karyotype, species that appear quite similar can have very different karyotypes. Distinct karyotypes among closely related species indicate that similar genetic potential can be organized on chromosomes in very different ways. For example, two species of small deer — the Indian muntjac and Reeves muntjac — contain about the same total amount of genomic DNA. The Indian muntjac contains the smallest number of chromosomes of any mammal, only three pairs of autosomes; one sex chromosome is physically separate, but the other is joined to the end of one autosome (Figure 7-32a). In the Reeves muntjac, however, this DNA is organized into 22 pairs of homologous autosomes and two physically separate sex chromosomes (Figure 7-32b).
FIGURE 7-32 Karyotypes of the Indian muntjac and the Reeves muntjac. These two species of small deer are quite similar, but do not interbreed. Despite the difference in the number of chromosomes in these animals, the two genomes contain about the same total amount of DNA. (The chromosomes of males of both species are shown at the same magnification.) Republished with permission by SAGE Publications, from A. V. Carrano et al., 1976, “Purification of the Chromosomes of the Indian Muntjac by Flow Sorting,” J. Histochem. Cytochem. 24(1), 348–354; https://doi.org/10.1177/24.1.1254929; permission conveyed through Copyright Clearance Center, Inc. Republished with permission by Karger Publishers, from J, Fu B, Nie W, Wang J, Graphodatsky A, S, Yang F: New insights into the karyotypic relationships of Chinese muntjac (Muntiacus reevesi), forest musk deer (Moschus berezovskii) and gayal (Bos frontalis). Cytogenet Genome Res 2005; 108:310– 316. doi: 10.1159/000081520]
During Metaphase, Chromosomes Can Be Distinguished by Banding Patterns and Chromosome Painting
Description The illustration a shows a photo of an Indian muntjac on the left and its karyotype on the right. The karyotype shows 3 pairs of chromosomes, labeled 1, 2 and 3 with X plus 3. The illustration b shows a photo of a Reeves muntjac on the left and its karyotype on the right. The karyotype has 24 pairs of chromosomes not labeled, but are paired up. During Metaphase, Chromosomes Can Be Distinguished by Banding Patterns and Chromosome Painting Certain dyes selectively stain some regions of metaphase chromosomes more intensely than other regions, producing characteristic banding patterns that are specific for individual chromosomes. The regularity of chromosome bands provides useful visible landmarks along the length of each chromosome and can help to distinguish chromosomes of similar size and shape. Today the method of chromosome painting greatly simplifies the identification and differentiation of individual chromosomes within a karyotype, many of which have similar sizes and shapes. This technique, a variation of fluorescence in situ hybridization (FISH), makes use of probes specific for sites scattered along the length of each chromosome. The probes are labeled with several different fluorescent dyes with distinct excitation and emission wavelengths. Probes specific for each chromosome are labeled with a predetermined fraction of each of the dyes.
After the probes are hybridized to chromosomes and the excess removed, the sample is observed with a fluorescence microscope in which a detector determines the fraction of each dye present at each fluorescing position in the microscopic field. This information is conveyed to a computer, and a special program assigns a false-color image to each type of chromosome (Figure 7-33a). Computer graphics allows the two homologs of each chromosome to be placed next to each other and numbered according to their decreasing size. Such an image clearly displays the cell’s karyotype (Figure 7-33b). EXPERIMENTAL FIGURE 7-33 Human chromosomes are readily identified by chromosome painting. (a) Image of human chromosomes from a male cell in mitosis made by fluorescence in situ hybridization (FISH) using chromosome paint probes. (b) Alignment of these painted chromosomes by computer graphics to reveal the normal human male karyotype. Chromosome painting is a powerful method for detecting an abnormal number of chromosomes, such as chromosome 21 trisomy in patients with
Down syndrome, or chromosomal translocations that occur in rare individuals and in cancer cells (Figure 7-34). The use of probes with different ratios of fluorescent dyes that hybridize to distinct positions along each normal human chromosome allows finer structural analysis of the chromosomes that can more readily reveal deletions or duplications of chromosomal regions. The chapter-opening figure illustrates the use of such multicolor FISH in analysis of the karyotype of a normal human female. EXPERIMENTAL FIGURE 7-34 Chromosomal translocations can be analyzed using chromosome painting. Characteristic chromosomal translocations are associated with certain genetic disorders and specific types of cancers. For example, in nearly all patients with chronic myelogenous leukemia, the leukemic cells contain the Philadelphia chromosome, a shortened chromosome 22 [der (22)], and an abnormally long chromosome 9 [der (9)] (“der” stands for derivative). These forms result from a translocation between normal chromosomes 9 and 22. This translocation can be detected (a) by classical banding analysis or (b) by chromosome painting. Description In illustration a, the classical banding analysis shows chromosomes 9 and 22. On the left is a normal 9 and a normal 22. On the right is chromosome 9 with a part of chromosome 22 at the bottom, and chromosome 22 with a part of chromosome 9 at the
Chromosome Painting and DNA Sequencing Reveal the Evolution of Chromosomes
bottom. In illustration b, the chromosome painting has the following labels: der (9), Normal chromosome 22, Philadelphia chromosome d e r (22), and a Normal chromosome 9. Chromosome Painting and DNA Sequencing Reveal the Evolution of Chromosomes Analysis of chromosomes from different species has provided considerable insight into how chromosomes evolved. For example, hybridization of chromosome paint probes for chromosome 16 of the tree shrew (Tupaia belangeri) to tree shrew metaphase chromosomes revealed the two copies of chromosome 16, as expected (Figure 7-35a). However, when the same chromosome paint probes were hybridized to human metaphase chromosomes, most of the probes hybridized to the long arm of chromosome 10 (Figure 7-35b). Further, when multiple probes for the long arm of human chromosome 10 with different fluorescent dye labels were hybridized to tree shrew metaphase chromosomes, these probes bound to sequences along tree shrew chromosome 16 in the same order in which they bind to human chromosome 10.
FIGURE 7-35 Evolution of primate chromosomes. (a) Chromosome paint probes (yellow) for chromosome 16 of the tree shrew (T. belangeri, distantly related to humans) hybridized to tree shrew metaphase chromosomes (red). (b) The same tree shrew chromosome 16 paint probes (green) hybridized to human metaphase chromosomes (red). (c) Proposed evolution of human chromosomes (bottom) from the chromosomes of the common ancestor of all primates (top). The proposed common primate ancestor
chromosomes are numbered according to their sizes, with each chromosome represented by a different color. The human chromosomes are also numbered according to their relative sizes and labeled with colors taken from the colors of the proposed common primate ancestor chromosomes from which they were derived. Small numbers to the left of the colored regions of the human chromosomes indicate the number of the ancestral chromosome from which the region was derived. [Parts (a) and (b) Republished with permission of Springer, from S. Muller et al., 1999, “Defining the Ancestral Karyotype of all Primates by Multidirectional Chromosome Painting Between Tree Shrews, Lemurs and Humans,” Chromosoma 108(6):393–400; permission conveyed through Copyright Clearance Center, Inc. Part (c) Data from L. Froenicke, 2005, Cytogenet. Genome Res. 108:122.] Description A fluorescent micrograph labeled a, shows two copies of chromosome 16 in yellow amidst red chromosomes. A fluorescent micrograph labeled b shows the long arm of chromosome 10 in yellow-green. In illustration c, a karyotype with bar shaped drawings shows the chromosomes of a proposed primate ancestor matched with that of the humans. The human chromosomes are colored in correspondence with the chromosomes from the primate ancestor. Humans and tree shrews had a common ancestor that lived as recently as 85 million years ago. These results indicate that during the evolutionary process of divergence, a long, continuous DNA sequence on one of the ancestral chromosomes became chromosome 16 in tree shrews but evolved into the long arm of chromosome 10 in humans. The phenomenon of genes occurring in the same order on a chromosome in two different species is referred to as conserved synteny (derived from Latin for “on the same ribbon”). The presence of two or more genes in a common chromosomal region in two or more species indicates a conserved syntenic segment.
The relationships between the chromosomes of many primates have also been determined by cross-species application of chromosome paint probes. Using these relationships and higher resolution analyses of syntenic regions by DNA sequencing and other methods, it has been possible to propose the karyotype of the common ancestor of all primates. This karyotype is based on the minimum number of chromosomal rearrangements necessary to generate the regions of synteny in chromosomes of contemporary primates (Figure 7-35c). Human chromosomes are thought to have been derived by several different mechanisms from a common primate ancestor with 23 autosomes plus the X and Y sex chromosomes (Figure 7-35c). Some human chromosomes were derived without large-scale rearrangements of chromosome structure in the primate ancestor (e.g., human chromosome 1). Others are thought to have evolved by breakage of an ancestral chromosome into two chromosomes (e.g., human chromosomes 14 and 15 by breakage of ancestral chromosome 5) or, conversely, by fusion of two ancestral chromosomes (e.g., human chromosome 2 by fusion of ancestral chromosomes 9 and 11). Still other human chromosomes appear to have been generated by exchanges of parts of the arms of distinct chromosomes, that is, by reciprocal translocation involving two ancestral chromosomes (e.g., a reciprocal translocation between ancestral chromosomes 14 and 21 generated human chromosomes 12 and 22). Analysis of regions of conserved synteny between the chromosomes of many mammals indicates that chromosomal rearrangements by breakage, fusion, and translocation occurred rarely in mammalian evolution, about once every 5 million years. When such chromosomal rearrangements did
Interphase Polytene Chromosomes Arise by DNA Amplification
occur, they very likely contributed to the evolution of new species that could not interbreed with the species from which they evolved. Chromosomal rearrangements similar to those inferred for the primate lineage have been inferred for other groups of related organisms, including invertebrate, plant, and fungal lineages. There is excellent agreement between predictions of evolutionary relationships based on analysis of syntenic regions of chromosomes from organisms with related morphology (e.g., among mammals, or among insects with similar body organization) and evolutionary relationships based on the fossil record and on the extent of divergence of DNA sequences for homologous genes. This is a strong argument for the validity of evolution as the process that generated the diversity of contemporary organisms. Interphase Polytene Chromosomes Arise by DNA Amplification The larval salivary glands of Drosophila species and other dipteran insects contain enlarged interphase chromosomes that are visible in the light microscope. When fixed and stained with a dye that stains DNA, these polytene chromosomes are characterized by a large number of reproducible, well-demarcated bands (Figure 7-36a), which have been assigned standardized numbers. The densely staining bands represent regions where the chromatin is more condensed, and the light interband areas are regions where the chromatin is less condensed. This highly reproducible banding pattern seen in Drosophila salivary gland
chromosomes provides an extremely powerful method for locating specific DNA sequences along the chromosomes of this species. Chromosomal translocations and inversions are readily detectable by changes in the banding pattern of polytene chromosomes. Also, DNA sequences can be localized along the length of polytene chromosomes by in situ hybridization (see Figure 7-36c). Insect polytene chromosomes offer one of the only experimental systems in all of nature in which high resolution microscopic localization studies on decondensed interphase chromosomes are possible. EXPERIMENTAL FIGURE 7-36 Banding on Drosophila polytene salivary gland chromosomes. (a) In this light micrograph of Drosophila melanogaster larval salivary gland chromosomes, four chromosomes can be observed (X, 2, 3, and 4), with a total of
approximately 5000 distinguishable bands. The banding pattern of light and dark bands results from reproducible differences in the extent of chromatin condensation (from euchromatin-like to heterochromatin-like condensation (see Figure 7-23a) along the length of each of the ∼1000 aligned chromosomes in a polytene chromosome. Dark bands are regions of more highly compacted chromatin; light bands, regions of more extended chromatin. The centromeres of all four chromosomes often appear fused at the chromocenter. The telomeres of chromosomes 2 and 3 are labeled (L = left arm; R = right arm), as is the telomere of the X chromosome. (b) The pattern of amplification of chromosome 4 during five replications. Double-stranded DNA is represented by a single line. Telomere and centromere DNA are not amplified. In salivary gland polytene chromosomes, each parental chromosome undergoes about 10 replications . (c) Detection of specific DNA sequences by in situ hybridization of fluorescently labeled probes. The left panel shows chromatin conformation (3C) assay data for a region near the telomere of chromosome 2L, with one topological domain at the center of the plot. The position of a fluorescently labeled DNA probe to a region near the center of the topological domain is indicated by a red diamond, and location of probes from the borders of the topological domain, in or near the neighboring boundary elements, are shown in cyan. The right two panels are micrographs of the left end of chromosome 2 in polytene chromosomes hybridized to the fluorescent probes from the borders of the topological domain (cyan) and the fluorescent probe from the middle of the topological domain (red), and stained with DAPI for DNA (blue). The white arrowhead indicates a small interband between bands 22A1-2 and 22A3 in the standardized Drosophila polytene chromosome map where the probe from the center of the topological domain hybridizes. Scale bar = 2 µm. See C. D. Laird et al., 1973, Cold Spring Harbor Symp. Quant. Biol. 38:311. [Part (c) Republished with permission of Elsevier, from K. P. Eagen et al., 2015, “Stable Chromosome Condensation Revealed by Chromosome Conformation Capture,” Cell 163(4):934–46; https://doi.org/10.1016/j.cell.2015.10.026; permission conveyed through Copyright Clearance Center, Inc.] Description A micrograph labeled a, shows chromatin as long curled lines with black, gray and white stripes. The chromocenter is labeled. The illustration labeled b shows 8 light blue bar shaped D N A. A centromere is labeled on the left, and the telomere is labeled on
Three Functional Elements Are Required for Replication and Stable Inheritance of Chromosomes
both sides. In micrographs labeled c, the first micrograph shows a pink and white graph with a dark pink line going from bottom left to top right. Labels within this box are boundary probe 1 and 2 and topological domain probe. The second micrograph shows the banding pattern of the chromosomes of a TAD border fish highlighting the T A D border. The third micrograph shows the banding pattern of the chromosomes a combined F I S H with a pink strip between the T A D borders labeled, 22 A 1-2. A generalized amplification of DNA gives rise to the polytene chromosomes found in the salivary glands of Drosophila. This process, termed polytenization, occurs when the DNA repeatedly replicates everywhere except at the telomeres and centromere, but the daughter chromosomes do not separate. The result is an enlarged chromosome composed of many parallel copies of itself, such as 1024 copies resulting from 10 such replications in Drosophila melanogaster salivary glands (see
Figure 7-36b). The amplification of chromosomal DNA greatly increases gene copy number, presumably to supply sufficient mRNA for protein synthesis in the massive salivary gland cells. In situ hybridization studies (see Figure 7-36c) indicate that the dark bands in polytene chromosomes are due to the alignment in the 1024 chromosomes of topological domains observed by chromatin conformation assays, and that the light bands correspond to alignment of boundary elements. Three Functional Elements Are Required for Replication and Stable Inheritance of Chromosomes
Although eukaryotic chromosomes differ in length and number among species, cytogenetic studies have shown that they all behave similarly at the time of cell division. Moreover, any eukaryotic chromosome must contain three functional elements in order to replicate and segregate correctly: (1) replication origins at which DNA polymerases and other proteins initiate synthesis of DNA (see Figures 5-12 and 5-13); (2) the centromere, the constricted region required for proper segregation of daughter chromosomes (see Figure 7-31); and (3) the two ends, or telomeres. The yeast transformation studies depicted in Figure 7-37 demonstrated the functions of these three chromosomal elements and established their importance for chromosome function.
EXPERIMENTAL FIGURE 7-37 Yeast transformation experiments were used to identify the functional chromosomal elements necessary for normal chromosome replication and segregation. In these experiments, plasmids containing the LEU gene from normal yeast cells are constructed and introduced into cells by transfection. If the plasmid is maintained in the cells, they are transformed to cells by the LEU gene on the plasmid and can form colonies on medium lacking leucine. (a) Sequences that allow autonomous replication (ARS) of a plasmid were identified because their insertion into a plasmid vector containing a cloned LEU gene resulted in a high frequency of transformation to . However, even plasmids with an ARS exhibit poor segregation during mitosis and therefore do not appear in each of the daughter cells. (b) When randomly broken pieces of yeast DNA are inserted into plasmids containing ARS and LEU, some of the subsequently transfected cells produce large colonies, indicating that a high rate of mitotic segregation among their plasmids is facilitating the continuous growth of daughter cells. The DNA recovered from plasmids in these large colonies contains yeast centromere (CEN) sequences. (c) When yeast cells are transfected with linearized plasmids containing LEU, ARS, and CEN, no colonies grow. Addition of telomere (TEL) sequences to the ends of the linear DNA gives the linearized plasmids the ability to replicate as new chromosomes that behave very much like a normal chromosome in both mitosis and meiosis. See A. W. Murray and J. W. Szostak, 1983, Nature 305:189, and L. Clarke and J. Carbon, 1985, Ann. Rev. Genet. 19:29. Description Experiments to investigate the necessary components for chromosome replication and segregation in yeast cells can be summarized as follows. In illustration a, the progeny of L E U deficient cells transfected with L E U cannot grow without leucine, whereas 50 percent of the progeny of those transfected with L E U and sequences that allow autonomous replication can grow without leucine but mitotic segregation is poor. In illustration b, the progeny of L E U deficient yeast cells transfected with circular plasmids containing yeast centromere sequences, L E U, and autonomous replication sequences show good mitotic segregation. In illustration c, the progeny of yeast cells transfected with plasmids containing L E U and autonomous replication and centromere sequences but that have been cut open, forming a linear plasmid, do not grow in leucine deficient media, indicating that the linear plasmid is unstable without telomere sequences. 4. The progeny of cells transfected with linear plasmids with autonomous
replication and centromere sequences, L E U, and telomeres show good mitotic segregation and the linear plasmids behave like normal chromosomes. Each experiment is depicted using circles to represent yeast cells and the LEU is depicted in the ones that were successful. As discussed in Chapter 5, replication of DNA begins from sites that are scattered throughout eukaryotic chromosomes. The yeast genome contains many 100-bp sequences, called autonomously replicating sequences (ARSs), that act as replication origins. The observation that insertion of an ARS into a circular plasmid allowed the plasmid to replicate in yeast cells provided the first functional identification of replication origins in eukaryotic DNA (Figure 7-37a). Even though circular ARS-containing plasmids can replicate in yeast cells, only about 5–20 percent of progeny cells contain the plasmid, because mitotic segregation of the plasmids is faulty. However, plasmids that also carry a CEN sequence, derived from the centromeres of yeast chromosomes, segregate equally, or nearly so, to both mother and daughter cells during mitosis (Figure 7-37b). If circular plasmids containing an ARS and a CEN sequence are cut once with a restriction enzyme, the resulting linear plasmids do not transform yeast cells generating colonies that grow on medium lacking leucine unless they contain special telomeric (TEL) sequences ligated to their ends (Figure 7-37c). The first successful experiments involving transfection of yeast cells with linear plasmids were achieved by using the ends of a DNA molecule that was known to replicate as a linear molecule
Centromere Sequences Vary Greatly in Length and Complexity
in the ciliated protozoan Tetrahymena. During part of the life cycle of Tetrahymena, much of the nuclear DNA is repeatedly copied in short pieces to form a so-called macronucleus. One of these repeated fragments was identified as a dimer of ribosomal DNA, the ends of which contained a repeated sequence . When a section of this repeated TEL sequence was ligated to the ends of linear yeast plasmids containing ARS and CEN, replication and good segregation of the linear plasmids occurred. The initial cloning and characterization of telomeres garnered the Nobel Prize in Physiology or Medicine in 2009, which was awarded to Elizabeth Blackburn, Carol Greider, and Jack Szostak. Centromere Sequences Vary Greatly in Length and Complexity Once the yeast centromere regions that confer mitotic segregation were cloned, their sequences could be determined and compared. The results revealed three regions (I, II, and III) that are conserved among the centromeres on different yeast chromosomes (Figure 7-38a). Short, fairly well-conserved nucleotide sequences are present in regions I and III. Region II does not have a specific sequence, but is AT-rich with a fairly constant length, probably so that regions I and III will lie on the same side of the specialized centromere-associated histone octamer. As mentioned earlier in the discussion of variant histones, this specialized centromereassociated histone octamer contains the usual histones H2A, H2B, and H4, but a variant form of histone H3. Centromeres from all eukaryotes similarly contain nucleosomes with a specialized, centromere-specific
form of histone H3, called CENP-A in humans. In the simple kinetochore of S. cerevisiae, a protein complex called CBF3 associates with this specialized nucleosome. The CBF3 complex, in turn, associates with several copies of an elongated multiprotein complex called Ndc80 (Figure 7-38b). The Ndc80 complexes initially make lateral interactions with a spindle microtubule and subsequently interact with a Dam1 complex, which forms a ring around the end of the microtubule (Figure 7-38c). This interaction results in an end-on attachment of the centromere to the spindle microtubule. S. cerevisiae has by far the simplest centromere known in nature.
FIGURE 7-38 Kinetochore-microtubule interaction in S. cerevisiae. (a) Sequence of the simple centromeres of S. cerevisiae. Data from L. Clarke and J. Carbon, 1985, Ann. Rev. Genet. 19:29. (b) Ndc80 complexes associate with both the microtubule and the CBF3 complex. (c) Diagram of the centromere-associated CBF3 complex and its associated Ndc80 complexes, which associate with a ring of Dam1 proteins at the end of a spindle microtubule. The Ndc80 complexes initially make lateral interactions with the side of a spindle microtubule (top) and then associate with the Dam1 ring, making an end-on attachment (bottom) to the microtubule. See T. U. Tanaka, 2010, EMBO J. 29:4070. Description The illustration labeled a, shows the sequence of the centromeres of S. cerevisiae. The labeled Yeast C E N shows the following rows of letters and numbers: G T C A C G T G (1) - 78-86 b p (2)– T G T T T C T G N T T T C C G A A A (3). The illustration labeled b shows the N d c 80 complex with red ovals at the left labeled Domains that associate with a microtubule and a blue oval at the right labeled domains that associate with the C B F 3 complex. The illustration labeled c shows N d c 80 making a lateral attachment to a bundle of microtubules colored green. The red ovals are attached here. The blue oval shape is attached to a C B F 3 complex. The tubule structure is labeled spindle pole at the left and microtubule plus-end on the right side. A downward arrow is labeled Lateral to end-on conversion. The N d c 80 complexes are attached at the right side of the tubules. In the fission yeast S. pombe, centromeres are 40–100 kb in length and are composed of repeated copies of sequences similar to those in S. cerevisiae centromeres. Multiple copies of proteins homologous to those that interact with S. cerevisiae centromeres bind to these much larger S. pombe centromeres, and in turn bind the much longer S. pombe chromosomes to several microtubules of the mitotic spindle apparatus. In plants and animals, centromeres are megabases in length and are composed of multiple repeats of simple-sequence DNA (see Table 7-1 and Figure 7-6).
Addition of Telomeric Sequences by Telomerase Prevents Shortening of Chromosomes
In humans, centromeres contain several types of repeated simple-sequence DNAs including 2–4 Mb arrays of a 171-bp simple-sequence DNA called alphoid DNA, which is bound by nucleosomes containing the CENP-A histone H3 variant. In multicellular animals and plants, centromeres are many megabases in length. A complex protein structure called the kinetochore assembles at these large centromeres and associates with multiple mitotic spindle fibers during mitosis (see Figure 18-43). Homologs of many of the centromereassociated proteins found in the yeasts occur in humans and other multicellular eukaryotes. Where homologs are not evident in multicellular organisms based on amino acid sequence comparisons (such as the Dam1 complex), alternative complexes with similar properties to the yeast proteins have been proposed to function at kinetochores. The functions of the centromere and of the kinetochore proteins that bind to it during the segregation of sister chromatids in mitosis and meiosis are described in Chapters 18 and 19. Addition of Telomeric Sequences by Telomerase Prevents Shortening of Chromosomes Sequencing of telomeres from multiple organisms, including humans, has shown that most are repetitive oligomers with a high G content located in the strand with its end at the end of the chromosome. The telomere repeat sequence in humans and other vertebrates is TTAGGG. These
simple sequences are repeated at the ends of chromosomes for a total of a few hundred base pairs in yeasts and protozoans and a few thousand base pairs in vertebrates. The end of the G-rich strand extends 12–16 nucleotides beyond the end of the complementary C-rich strand. This short single-stranded region is bound by proteins that protect the ends of linear chromosomes from attack by exonucleases. The need for a specialized region at the ends of eukaryotic chromosomes is apparent when we consider that all known DNA polymerases elongate DNA chains at the end, and all require an RNA or DNA primer. As the replication fork approaches the end of a linear chromosome, synthesis of the leading strand continues to the end of the DNA template strand, completing one daughter DNA double helix. However, because the lagging-strand template is copied in a discontinuous fashion, it cannot be replicated in its entirety (Figure 7-39). When the final RNA primer is removed, there is no upstream strand onto which DNA polymerase can build to fill the resulting gap. Without some special mechanism, the daughter DNA strand resulting from lagging-strand synthesis would be shortened at each cell division.
FIGURE 7-39 Standard DNA replication leads to loss of DNA at the end of each strand of a linear DNA molecule. Replication of the right end of a linear DNA is shown; the same process occurs at the left end (as can be shown by inverting the figure). As the replication fork approaches the end of the parental DNA molecule, the leading strand can be synthesized all the way to the end of the template strand without the loss of deoxyribonucleotides. However, since synthesis of the lagging strand requires RNA
primers, the right end of the lagging daughter DNA strand would remain as ribonucleotides, which are removed and therefore cannot serve as the template for a replicative DNA polymerase. Alternative mechanisms must be used to prevent successive shortening of the lagging strand with each round of replication. Description The illustration shows a double-stranded D N A undergoing replication. The top diagram is the fork shape with the parent strands in blue and the R N A primer in red. The chromosome end is labeled on the right. The next diagram down is labeled Leading strand D N A synthesis and shows a polymerase structure as an orange oval on the blue D N A strand. The primer is also labeled. The next one down shows the blue D N A strand as a complete line across, but the red line now has a break in the left-center labeled ligation. To the right is another gap with an arrow labeled Gap fill-in. The right side end shows primer removal. The next set of D N A strand shows the blue strand at full length and the red strand is labeled with a shortened end. The diagram at the bottom shows two D N A strands of the same length. The problem of telomere shortening is solved by an enzyme that adds telomeric repeat sequences to the ends of each chromosome. The enzyme is a protein-RNA complex called telomere terminal transferase, or telomerase. Because the sequence of the telomerase-associated RNA serves as the template for addition of deoxyribonucleotides to the ends of telomeres, the source of the enzyme, and not the source of the telomeric DNA primer, determines the sequence added. This was proved by transforming Tetrahymena with a mutated form of the gene encoding the telomerase-associated RNA. The resulting telomerase added a DNA sequence complementary to the mutated RNA sequence to the ends of telomeric primers. Thus telomerase is a specialized form of a reverse transcriptase that carries its own internal RNA template to direct DNA
synthesis. These experiments also earned the Nobel Prize in Physiology or Medicine for the structure and function of telomeres in 2009.
Figure 7-40 depicts how telomerase, by reverse transcription of its associated RNA, elongates the end of the single-stranded DNA at the end of the G-rich strand mentioned above. Cells from knockout mice that cannot produce the telomerase-associated RNA exhibit no telomerase activity, and their telomeres shorten successively with each cell generation. Such mice can breed and reproduce normally for three generations before the long telomere repeats become substantially eroded. Then, the absence of telomere DNA results in adverse effects, including fusion of chromosome termini and chromosome loss. By the fourth generation, the reproductive potential of these knockout mice declines, and they cannot produce offspring after the sixth generation.
FIGURE 7-40 Mechanism of action of telomerase. The single-stranded terminus of a telomere is extended by telomerase, counteracting the inability of the DNA replication mechanism to synthesize the extreme terminus of linear DNA. Telomerase elongates this single-stranded end by a reiterative reverse-transcription mechanism. The action of the telomerase from the protozoan Tetrahymena, which adds a repeat unit, is depicted
here; other telomerases add slightly different sequences. The telomerase contains an RNA template (red) that base-pairs to the end of the lagging-strand template. The telomerase catalytic site then adds deoxyribonucleotides TTG (blue), using the RNA molecule as a template (step 1 ). The strands of the resulting DNA-RNA duplex are then thought to slip (translocate) relative to each other so that the TTG sequence at the end of the replicating DNA base-pairs to the complementary RNA sequence in the telomerase RNA (step 2 ). The end of the replicating DNA is then again extended by telomerase (step 3 ). Telomerases can add multiple repeats by repetition of steps 2 and 3 . DNA polymerase α-primase can prime synthesis of new Okazaki fragments on this extended template strand. The net result prevents shortening of the lagging strand at each cycle of DNA replication. See C. W. Greider and E. H. Blackburn, 1989, Nature 337:331. Description The illustration begins with a gold oval shape to represent telomerase. The top oval shows a D N A double strand by listing the base letters, and the top strand is short. There is a R N A template in the telomerase which is depicted in red and a chain of base letters attaching to the D N A strand. The first downward arrow is labeled elongation. The second telomerase oval looks similar to the top one but shows the D N A strand getting longer by 3 letters coded by the R N A strand. A second downward arrow is labeled translocation and the D N A strands have moved to the left. The last downward arrow is labeled Elongation and the D N A strand in the fourth telomerase shows added base letters. The human genes expressing the telomerase protein and the telomerase-associated RNA are active in germ cells and stem cells, but are turned off in most cells of adult tissues that replicate only a limited number of times or will never replicate again (such cells are called postmitotic). However, these genes are activated in most human cancer cells, where telomerase is required for the multiple cell divisions necessary to form a tumor. This phenomenon has stimulated a search for
inhibitors of human telomerase as potential therapeutic agents for treating cancer. While telomerase prevents telomere shortening in most eukaryotes, some organisms use alternative strategies. Drosophila species maintain telomere lengths by the regulated insertion of non-LTR retrotransposons into telomeres. This is one of the few instances in which a mobile element has a specific function in its host organism. KEY CONCEPTS OF SECTION 7.5 Morphology and Functional Elements of Eukaryotic Chromosomes During metaphase, eukaryotic chromosomes become sufficiently condensed that they can be visualized individually in the light microscope. The chromosomal karyotype is characteristic of each species. Closely related species can have dramatically different karyotypes, indicating that similar genetic information can be organized on chromosomes in different ways. Banding analysis and chromosome painting are used to identify the different human metaphase chromosomes and to detect translocations and deletions (see Figures 7-33 and 7-34). Analysis of chromosomal rearrangements and regions of conserved synteny between related species allows scientists to make predictions about the evolution of chromosomes (see Figure 7-35c). The evolutionary relationships between organisms indicated by these studies are consistent with proposed evolutionary relationships based on the fossil record and DNA sequence analysis. The highly reproducible banding patterns of polytene chromosomes make it possible to visualize chromosomal deletions and rearrangements as changes in the normal pattern of bands. Three types of DNA sequences are required for a long linear DNA molecule to function as a chromosome: a replication origin, called ARS in yeast; a centromere (CEN) sequence; and two telomere (TEL) sequences at the ends of the DNA (see
Figure 7-37). Telomerase, a protein-RNA complex, has a special reverse transcriptase activity that completes replication of telomeres during DNA synthesis (see Figure 7-40). In the
absence of telomerase, the daughter DNA strand resulting from lagging-strand synthesis is shortened at each cell division (see Figure 7-39).
Key Terms
End of Chapter Visit Achieve to access study tools and to learn more about the content in this chapter: Perspectives for the Future Analyze the Data Chapter References Additional study tools, including videos, animations, and quizzes Key Terms alternative splice site autosome centromere chromatid chromatin DNA transposon enhancer euchromatin exon shuffling fluorescence in situ hybridization (FISH) gene family genetic complementation heterochromatin histones
Review the Concepts
histone octamer interspersed repeats karyotype linker DNA long interspersed elements (LINEs) long terminal repeats (LTRs) micro-RNA (miRNA) microsatellite nucleosome polytene chromosome promoters protein family pseudogene replication origin retrotransposon reverse transcriptase short interspersed elements (SINEs) simple-sequence (satellite) DNA small nuclear RNA (snRNA) small nucleolar RNA (snoRNA) synteny telomere transcription factor transcription unit transposable (mobile) DNA element transposition
Review the Concepts 1. Genes can be transcribed into mRNA, in the case of proteincoding genes, or into RNA, in the case of genes such as those that encode ribosomal or transfer RNAs. Define a gene. For the following characteristics, state whether they apply to (a) simple or (b) complex transcription units. i. Found in eukaryotes ii. Contain introns iii. Capable of making multiple proteins from a given gene 2. Sequencing of the human genome has revealed much about the organization of genes. Describe the differences between solitary genes, gene families, pseudogenes, and tandemly repeated genes. 3. Much of the human genome consists of repetitive DNA. Describe the difference between microsatellite and minisatellite DNA. How is this repetitive DNA useful for identifying individuals by the technique of DNA fingerprinting? 4. Mobile DNA elements that can move or transpose to a new site directly as DNA are called DNA transposons. Describe the mechanism by which a bacterial DNA transposon, called an insertion sequence, can transpose. 5. Retrotransposons are a class of mobile elements that transpose via an RNA intermediate. Contrast the mechanism of transposition between retrotransposons that contain long terminal repeats (LTRs) and those that lack LTRs. 6. Discuss the role that transposons may have played in the evolution of modern organisms. What is exon shuffling? What role do transposons play in the process of exon shuffling?
7. The DNA in a cell associates with proteins to form chromatin. What is a nucleosome? What role do histones play in nucleosomes? How are nucleosomes arranged in condensed 30 nm fibers? 8. How do chromatin modifications regulate transcription? What modifications are observed in regions of the genome that are being actively transcribed? In regions that are not actively transcribed? 9. What is chromosome painting, and how is this technique useful? How can chromosome paint probes be used to analyze the evolution of mammalian chromosomes? 10. Certain organisms contain cells that possess polytene chromosomes. What are polytene chromosomes, where are they found, and what function do they serve? 11. Replication and segregation of eukaryotic chromosomes require three functional elements: replication origins, a centromere, and telomeres. How would a chromosome be affected if it lacked (a) replication origins or (b) a centromere? 12. Describe the problem that occurs during DNA replication at the ends of chromosomes. How are telomeres related to this problem?