Introduction
Genetic modifications make it possible to locate a specific cell type within the body of a living mouse. Scientists can label cells of the immune system by generating a transgenic mouse carrying the gene for insect luciferase expressed from the CD2 promoter, which is specifically expressed in T cells. After injection of the bioluminescent substrate for
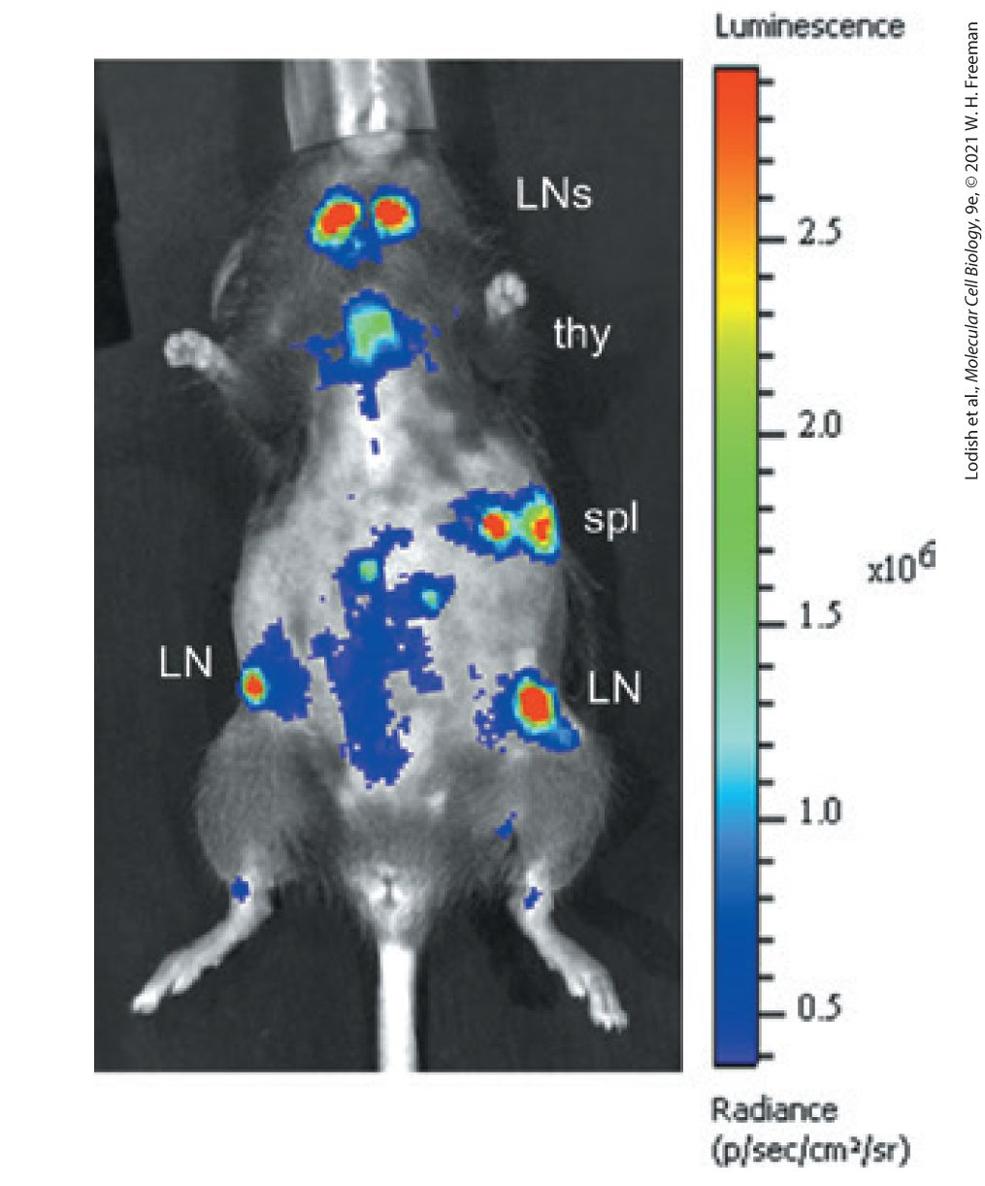
luciferase, the light emitted through the skin is imaged for 30 seconds. T cells can be seen located in the lymph nodes (LNs), the thymus (thy), and the spleen (spl). [From J. W. Kleinovink et al., 2019. A dual-color bioluminescence reporter mouse for simultaneous in vivo imaging of T cell localization and function. Frontiers in Immunology 9:3097. https://www.ncbi.nlm.nih.gov/pmc/articles/PMC6333049]
6.1 Using Genetic Analysis of Mutations to Identify and Study Genes
6.3 Using Sequence Information to Identify Genes and Deduce Their Function
6.4 Locating and Identifying Genes That Specify Human Traits

6.5 Using Cloned DNA Fragments to Study Gene Expression
6.6 Altering the Function of Specific Genes by Design In the field of molecular cell biology, we seek to understand the biological behavior of cells in terms of the underlying chemical and molecular mechanisms. Most often, cell biologists investigating some molecular process focus on the function of particular proteins or sets of proteins. They set out to answer a set of fundamental questions: What is the function of the protein in the context of a living cell? What is the biochemical function of the purified protein? Where is the protein located within the cell? When and where is the protein expressed? How is it related to other proteins? And how did the function of the protein arise during evolution? The answers to these questions almost always come from the study and manipulation of the gene that encodes the particular protein. In the first part of this chapter, we consider strategies for identifying and isolating genes of interest. We then consider strategies for determining the cellular function of the gene product (Figure 6-1). These strategies rely on experimental methods for manipulating genes.
FIGURE 6-1 Genetic and genomic analysis is central to understanding cell function at the molecular level. The general strategy for understanding the function of the constituent parts of a cell is to first identify and isolate a gene. This process begins with a mutant organism, a purified protein, or the identification of a protein-coding sequence by analysis of genomic sequence databases. The actual gene is isolated either from a DNA library of clones or by amplifying the specific gene sequence from genomic DNA. The gene sequence can be used to identify other similar gene sequences in genomic databases, providing insight into the general function of the gene and how it evolved. Once a cloned gene is isolated, it can be manipulated to produce large quantities of the protein it encodes for biochemical experiments and to design probes for studies of where and when the protein is expressed in an organism. Alternatively, a cloned gene can be inactivated by one of various techniques and used to generate mutant cells or organisms. By examining the phenotypic consequences of mutations that inactivate a particular gene, geneticists are able to connect knowledge about the sequence, structure, and biochemical activity of the encoded protein to its function in the context of a living cell or multicellular organism. Description Mutation with observable phenotype [model organism or human], genomic sequence with homology to known function, and protein with observable biochemical activity are incorporated into the cloned gene or D N A sequence. The cloned gene is used for gene inactivation, mutant phenotype, function deduced from sequence analysis,
expression profile, cellular localization, and protein production for biochemical activity and structure determination. Classically, proteins with important cellular functions were discovered either by purifying a protein with a relevant biochemical activity or by isolating an appropriate mutant. An excellent example showing how these two approaches can mutually reinforce one another was the discovery of NSF, a key protein required for vesicle trafficking in the secretory pathway, described in Chapter 14. The mammalian NSF protein was purified using a biochemical assay for fusion of transport vesicles with their target membrane. Meanwhile, a mutation in the yeast gene known as sec18 was identified in a genetic screen for mutants with a defect in protein secretion. Eventually the genetic and biochemical approaches were shown to have converged on the same gene when the yeast gene defective in the sec18 mutant was shown to be highly similar in sequence to the mammalian gene that encodes the NSF protein. Today the complete genome sequences of the human and all of the major experimental organisms are known, and the pace at which genes can be identified and studied has accelerated enormously. Because gene sequences and the sequences of the encoded proteins can be obtained from genomic sequences, almost the entire repertoire of encoded proteins is already known for most experimental organisms. Thus gene sequences of interest can now be readily and automatically identified from the chromosomal location of a mutation or just a short segment of the amino acid sequence of a purified protein. Moreover, genes worthy of study can be identified entirely from sequence information by comparing the
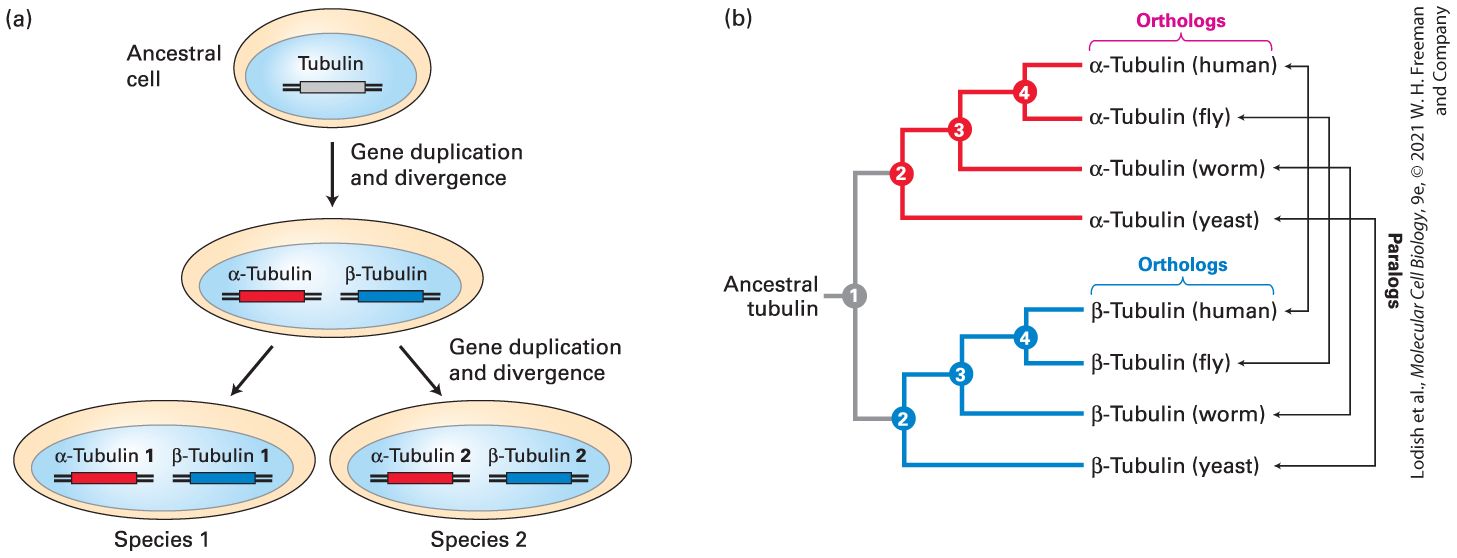
genome sequences from different organisms. Using this approach, investigators can study the function of a human gene that is implicated in cancer, for example, by manipulating the corresponding gene of similar sequence in the mouse or even in the fruit fly or in yeast if a similar gene is present.
6.1 Using Genetic Analysis of Mutations to Identify and Study Genes
6.1 Using Genetic Analysis of Mutations to Identify and Study Genes As described in Chapter 5, the information encoded in the DNA sequence of genes specifies the sequence — and therefore the structure and function — of every protein molecule in a cell. The power of genetics as a tool for studying cells and organisms lies in the ability of researchers to make a change in some gene and then evaluate the effect on a living organism. Geneticists expose organisms to an agent that induces mutations, then search for mutant organisms that are defective in a process of interest. Genetic analyses of mutants defective in a particular process can reveal (1) genes required for the process to occur, (2) the order in which gene products act in the process, and (3) whether and how the proteins encoded by different genes interact with one another. Before we look more closely at genetic studies of this type, let’s first review some basic genetic terms used throughout our discussion. The different forms or variants of a gene are referred to as alleles. Geneticists commonly refer to the numerous naturally occurring genetic variants that exist in populations, particularly human populations, as alleles. The term mutation is usually reserved for a recent change in an allele, such as after treatment of an experimental organism with a mutagen, an agent that causes a heritable change in the DNA sequence.
Recessive and Dominant Mutant Alleles Generally Have Opposite Effects on Gene Function
Strictly speaking, the particular set of alleles for all the genes carried by an individual constitutes its genotype. However, this term is most often used in a more restricted sense to denote the alleles of a particular gene or genes under examination. For experimental organisms, the term wild type is often used to designate a standard genotype for use as a reference in breeding experiments. Thus the normal, nonmutant allele is usually designated as the wild type. Because of the enormous allelic variation that naturally exists in human populations, the term wild type usually denotes an allele that is present at a much higher frequency than any of the other possible alternatives. Geneticists draw an important distinction between the genotype and the phenotype of an organism. The term phenotype refers to all the physical attributes or traits of an individual that are the consequence of a given genotype. In practice, however, the term phenotype is usually used to denote the consequences that result from the particular alleles that are under experimental study. Readily observable phenotypic characteristics are critical in the genetic analysis of mutations. Recessive and Dominant Mutant Alleles Generally Have Opposite Effects on Gene Function A fundamental genetic difference between experimental organisms is whether their cells carry two copies of each chromosome or only one copy of each chromosome. The former are referred to as diploid; the latter as
haploid. Most complex multicellular organisms (e.g., fruit flies, mice, humans) are diploid, whereas many simple, unicellular organisms are haploid. Some organisms, notably the yeast Saccharomyces cerevisiae, can exist in either haploid or diploid states. The normal cells of some organisms, both plants and animals, carry more than two copies of each chromosome and are thus designated polyploid. Moreover, cancer cells begin as diploid cells, but through the process of transformation into cancer cells can gain extra copies of one or more chromosomes and are thus designated as aneuploid. Our discussion of genetic techniques and analysis relates to diploid organisms, including diploid yeasts. Although many different alleles of a gene might be present in a population, any individual diploid organism will carry two copies of each gene and thus at most can have two different alleles. A diploid individual with two different alleles is heterozygous for a gene, whereas a diploid individual that carries two identical alleles is homozygous for a gene. A mutant allele is recessive if both alleles must be mutant in order for the mutant phenotype to be observed; that is, the individual must be homozygous for the mutant allele to show the mutant phenotype. In contrast, a mutant allele is dominant if the mutant phenotype can be observed in a heterozygous individual carrying one mutant and one wildtype allele (Figure 6-2).
FIGURE 6-2 Effects of dominant and recessive mutant alleles on phenotype in diploid organisms. A single copy of a dominant mutant allele is sufficient to produce a mutant phenotype, whereas both copies of a recessive mutant allele must be present to cause a mutant phenotype. Recessive mutations usually cause a loss of function; dominant mutations usually cause a gain of function or an altered function. Description The chart has two rows. The top row is labeled diploid genotype and has five possible gene combinations of genotype: a wild type and blank gene, a dominant and blank gene, a dominant and another dominant gene, a recessive and blank gene, and a recessive and another recessive gene. The bottom row is labeled diploid phenotype. Each gene combination forms a wild type, mutant, mutant, wild type, and a mutant, respectively. Whether a mutant allele is recessive or dominant provides valuable information about the function of the affected gene and the nature of the causative mutation. Recessive alleles usually result from a mutation that inactivates the affected gene, leading to a partial or complete loss of function. Such recessive mutations may remove part of the gene or the entire gene from the chromosome, disrupt expression of the gene, or alter the structure of the encoded protein, thereby altering its function. Conversely, dominant alleles are often the consequence of a mutation that causes some kind of gain of function. Such dominant mutations may increase the activity of the encoded protein, confer a new function on it, or lead to a new spatial or temporal pattern of expression. In some rare cases, dominant mutations are associated with a loss of function. For instance, some genes are haploinsufficient, in that removing
or inactivating one of the two alleles of such a gene leads to a mutant phenotype because not enough gene product is made. In other rare instances, a dominant mutation in one allele may lead to a structural change in the protein that interferes with the function of the wild-type protein encoded by the other allele. This type of mutation, referred to as a dominant-negative, produces a phenotype similar to that obtained from a loss-of-function mutation. Some alleles can exhibit both recessive and dominant properties. In such cases, statements about whether an allele is dominant or recessive must specify the phenotype. For example, the allele of the hemoglobin gene that produces sickle cell disease, designated , has more than one phenotypic consequence. Individuals who are homozygous for this allele have debilitating anemia caused by sickle-cell disease, but heterozygous individuals do not have the disease. Therefore, is recessive for the trait of sickle-cell disease. On the other hand, heterozygous individuals are more resistant to malaria than are homozygous individuals, revealing that is dominant for the trait of malaria resistance. As described in Chapter 5, spontaneous mutations continually arise as a result of chemical and radiation damage to DNA and of errors in DNA replication. In genetic screens of experimental organisms, it is usually desirable to increase the frequency of mutations by controlled application of a chemical mutagen. A mutagen commonly used in experimental organisms is ethylmethane sulfonate (EMS), which can chemically modify
Segregation of Mutations in Breeding Experiments Reveals Whether They Are Dominant or Recessive
guanine bases in DNA, ultimately leading to the conversion of a G·C base pair into an A·T base pair. The alteration of only a single base pair in the sequence of a gene is known as a point mutation. As will be described in Section 6.3, a point mutation can cause either a loss of function or a gain of function in a gene depending on the type of mutation and where it occurs in a gene sequence. Segregation of Mutations in Breeding Experiments Reveals Whether They Are Dominant or Recessive To see how Mendelian genetics is used to test whether an allele is dominant or recessive, we must first review the type of cell division that gives rise to gametes (sperm and egg cells in animals). Whereas the body (somatic) cells of most multicellular organisms divide by mitosis, the germ cells that give rise to gametes undergo meiosis. Like somatic cells, before meiosis germ cells are diploid, containing two homologs of each morphological type of chromosome. The two homologs are descended from different parents, and thus their genes may exist in different allelic forms. Figure 6-3 depicts the major events in mitotic and meiotic cell division. In mitosis, DNA replication is always followed by cell division, yielding two diploid daughter cells. In meiosis, one round of DNA replication is followed by two separate cell divisions, yielding haploid (1n) cells known as gametes that contain only one chromosome of each homologous pair. The apportionment, or segregation, of the replicated homologous chromosomes to daughter cells during the first meiotic
division is random, and different chromosomes segregate independently of one another, yielding gametes with different mixes of paternal and maternal chromosomes.
FIGURE 6-3 Comparison of mitosis and meiosis. Both somatic cells and pre-meiotic germ cells have two copies of each chromosome (2n), one inherited from the mother and one from the father. In mitosis, the replicated chromosomes, each composed of two sister chromatids, align at the cell center in such a way that both daughter cells receive a maternal and a paternal homolog of each morphological type of chromosome. During the first
meiotic division, however, each replicated chromosome pairs with its homologous partner at the cell center; this pairing off is referred to as synapsis, and crossing over between homologous chromosomes is evident at this stage. One replicated chromosome of each morphological type then goes into each daughter cell. The resulting cells undergo a second division without intervening DNA replication, so that one of the sister chromatids of each morphological type is apportioned to the daughter cells. In the second meiotic division, the alignment of chromatids and their equal segregation into daughter cells is the same as in mitotic division. The alignment of pairs of homologous chromosomes in metaphase I is random with respect to other chromosome pairs, resulting in a mix of paternally and maternally derived chromosomes in each daughter cell. Description The process of mitosis and meiosis are depicted schematically in several steps. Mitosis has five steps, where a somatic cell is divided into two daughter cells with the same number of chromosomes as the first somatic cell. Meiosis is divided into two sub processes labeled meiosis one and meiosis two. In meiosis, four daughter cells are produced and each cell has half the number of chromosomes (1 n) as compared to a somatic cell. Mitotic cell division is summarized in the following steps. Step 1. A somatic cell containing a paternal homolog and a maternal homolog with two copies of each chromosome (2 n) undergoes D N A replication, resulting in a doubling of the genetic material (4 n). Step 2. The mitotic apparatus separate each chromosome, where each half is pulled to each pole of the cell. Step 3. Cell division occurs, yielding two daughter cells with two copies of each chromosome (2 n). Meiosis is summarized as follows. The first two steps are in common with mitosis. Step 1. A premeiotic cell has 2 n chromosomes. Step2. D N A replication results in 4 n chromosomes.
Step 3. The meiosis 1 phases starts, and homologous chromosomes align, and synapsis and crossing over occur. Step 4. The mitotic apparatus pull the chromosomal material to each pole of the cell, resulting in two daughter cells with 2 n chromosomes. Step 5. The meiosis 2 phase starts, each daughter cell is in metaphase 2 and the chromosomes are pulled to the poles of the cells, followed by cell division. Step 6. Four daughter cells have been produced. Each cell contains 1 n chromosome and the paternal and maternal chromosomes have been mixed by synapsis and crossing over. The key to determining whether an allele is dominant or recessive is to construct a heterozygote by breeding experiments. As a way to avoid unwanted complications in this process, geneticists usually strive to begin with strains of organisms that are homozygous for the genes under examination. In such true-breeding strains, every individual will receive the same allele from each parent, and therefore the composition of alleles will not change from one generation to the next. When a true-breeding mutant strain is mated to a true-breeding wild-type strain, all the first filial progeny will be heterozygous (Figure 6-4). If the progeny exhibit the mutant trait, then the mutant allele is dominant; if the progeny exhibit the wild-type trait, then the mutant allele is recessive. Further crossing between individuals will also reveal different patterns of inheritance according to whether the mutation is dominant or recessive. When individuals that are heterozygous for a dominant allele are crossed among themselves, three-fourths of the resulting progeny will exhibit the mutant trait. In contrast, when individuals that are
heterozygous for a recessive allele are crossed among themselves, only one-fourth of the resulting progeny will exhibit the mutant trait.
FIGURE 6-4 Segregation patterns of dominant and recessive mutations in crosses between true-breeding strains of diploid organisms. All the offspring in the first generation are heterozygous. If the mutant allele is dominant, the offspring will exhibit the mutant phenotype, as in part (a). If the mutant allele is recessive, the offspring will exhibit the wild-type phenotype, as in part (b). Crossing of the heterozygotes among themselves also produces different segregation ratios for dominant and recessive mutant alleles in the generation. Diploid organisms with the mutant phenotype are yellow and diploid organisms with a normal phenotype are blue. Description In illustration a, a description of the segregation of dominant mutation is summarized as follows. 1. The mutant organism has two dominant alleles represented as big A and big A. The wild-type organism has two recessive alleles represented by small a and small a. 2. The gametes of the mutant only contain dominant alleles (all big A); those of the wild type contain only recessive alleles (All small a). 3. The first filial generation, F subscript 1, produced by offspring of the mutant and the wild-type organism has one dominant and one recessive allele (Big A and small a). The F subscript 1 generation expresses the mutant phenotype. 4. The gametes of the F subscript 1 generation can be dominant or recessive (Big A or small a). 5. Offspring of the F subscript 1 generation, the second filial (F subscript 2) generation, can be dominant (Big A and big A), dominant and recessive (Big A and small a) and (Small a and big A) or recessive and recessive (Small a and small a). Thus, the dominant phenotype is expressed 3 out of 4 times. Only in the case of recessive and recessive; the recessive phenotype (normal) expressed. In illustration b, a description of the segregation of recessive mutation is summarized as follows. 1. The mutant contains two recessive alleles represented by (small b and small b) and the wild-type contains two dominant alleles represented by (big B and big B).
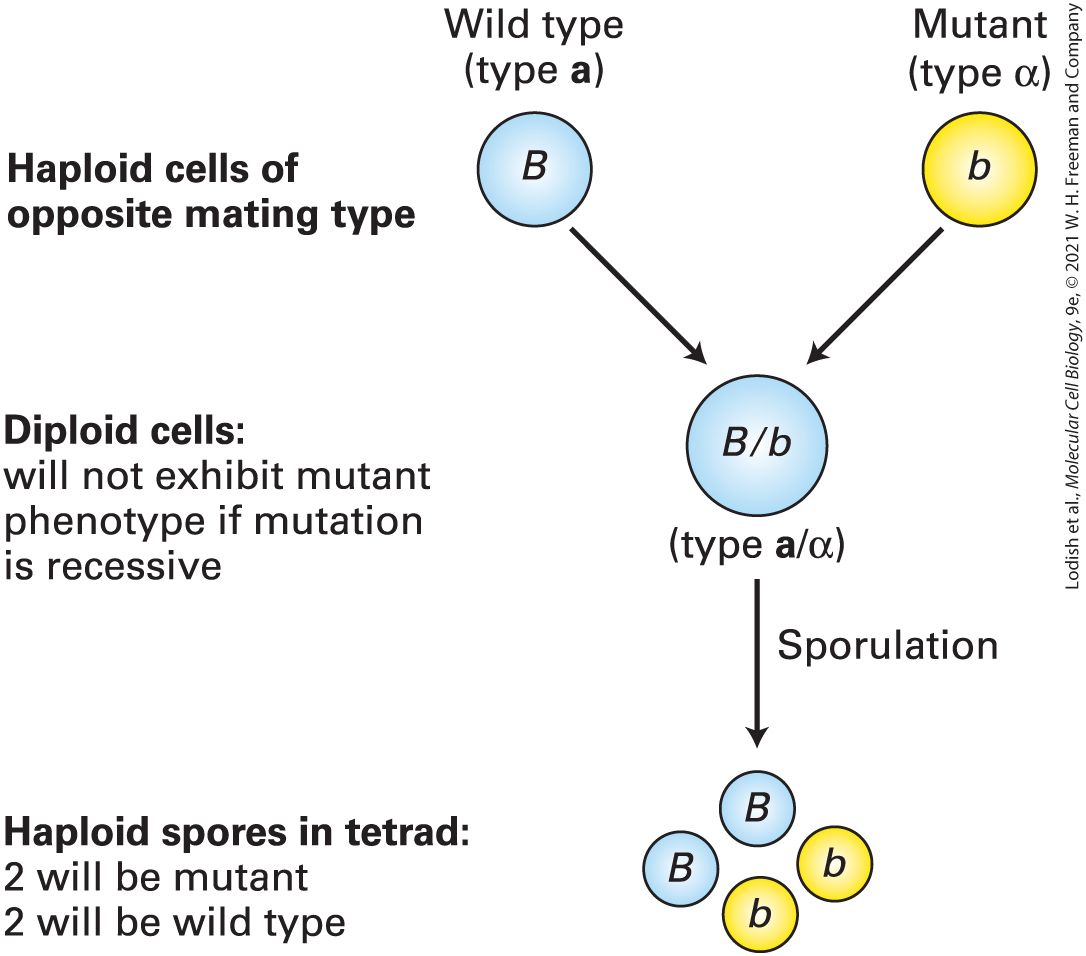
2. The gametes of the mutant are all recessive (all small b), whereas those of the wild type are dominant (all big B). 3. The F subscript 1 generation have a recessive mutant gene and a dominant wild-type gene (small b and big B), and consequently, they express the wild-type phenotype. 4. The gametes of the F1 generation are either mutant recessive (small b) or wild type dominant (big B). 5. In the F subscript 2 generation, the recessive mutant phenotype (small b and small b) will only be expressed one out of four times. The other three (small b and big B), (big B and small b), and (big B and big B) are normal phenotypes. As noted earlier, the yeast S. cerevisiae, an important experimental organism, can exist in either a haploid or a diploid state. In these unicellular eukaryotes, crosses between haploid cells can determine whether a mutant allele is dominant or recessive. Haploid yeast cells, which carry one copy of each chromosome, can be of two different mating types, known as a and α. Haploid cells of opposite mating type can mate to produce a/α diploids, which carry two copies of each chromosome. If a new mutation with an observable phenotype is isolated in a haploid strain, the mutant strain can be mated to a wild-type strain of the opposite mating type to produce a/α diploids that are heterozygous for the mutant allele. If these diploids exhibit the mutant trait, then the mutant allele is dominant, but if the diploids exhibit the wild-type trait, then the mutant allele is recessive. When a/α diploids are placed under starvation conditions, the cells undergo meiosis, each giving rise to a tetrad of four haploid spores, two of type a and two of type α. A heterozygous diploid cell yields two spores carrying the mutant allele and two carrying the wild-type allele
(Figure 6-5). Under appropriate conditions, yeast spores will germinate, producing vegetative haploid strains of both mating types.
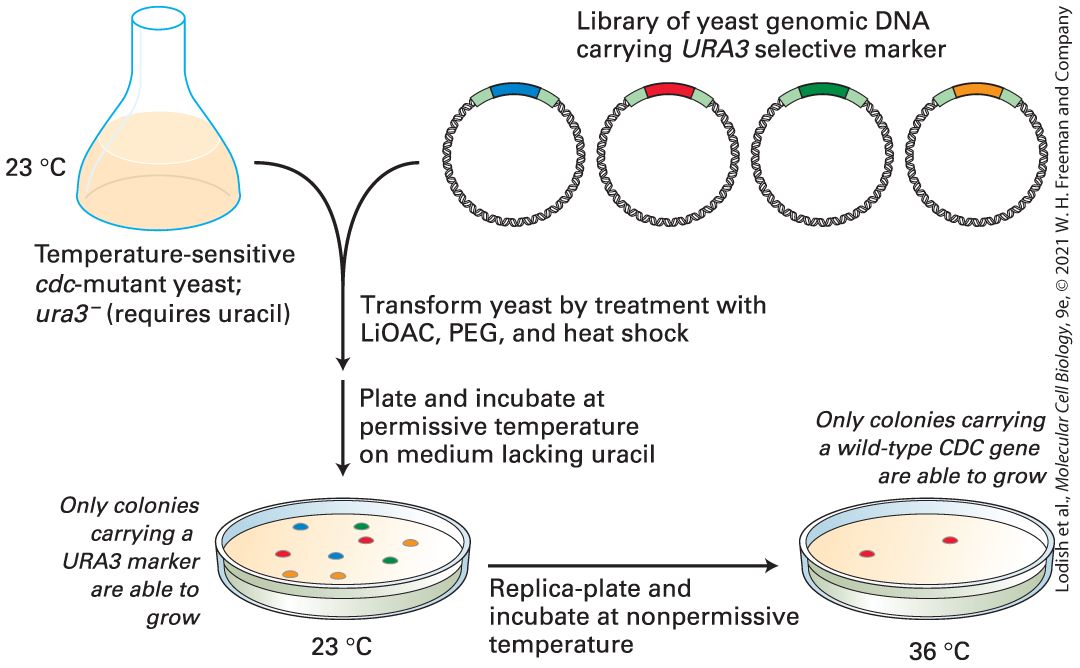
FIGURE 6-5 Segregation of alleles in yeast. Haploid Saccharomyces cells of opposite mating type (i.e., one of mating type a and one of mating type α) can mate to produce an a/ α diploid. If one haploid carries a dominant wild-type allele and the other carries a recessive mutant allele of the same gene, the resulting heterozygous diploid will express the dominant trait. Under certain conditions, a diploid cell will form a tetrad of four haploid spores. Two of the spores in the tetrad will express the recessive trait and two will express the dominant trait. Yeast with the mutant trait are shown in yellow and yeast with a normal phenotype are shown in blue.
Conditional Mutations Can Be Used to Study Essential Genes in Yeast
Description The illustration starts with a blue circle labeled big B representing the wild type (type a) and a yellow circle labeled small b representing the mutant (type alpha). The label to the left reads: Haploid cells of opposite mating type. Then arrows go down to one blue circle labeled big B and small b representing (type a and alpha). The label next to it reads Diploid cells: will not exhibit mutant phenotype if mutation is recessive. One more arrow down to a group of 4 small circles, 2 blue ones labeled big B and big B and two yellow ones labeled small b and small b. The label next to it reads: Haploid spores in tetrad: 2 will be mutant 2 will be wild type. Conditional Mutations Can Be Used to Study Essential Genes in Yeast Procedures called genetic screens are used to identify and isolate mutants. These procedures depend on whether the experimental organism is haploid or diploid and, if the latter, whether the mutation is recessive or dominant. Genes that encode proteins essential for life are among the most interesting and important ones to study. Since phenotypic expression of a mutation in an essential gene leads to death of the individual, clever genetic screens are needed to isolate and maintain organisms with a lethal mutation. In haploid yeast cells, essential genes can be studied through the use of conditional mutations, so called because the mutant phenotype is exhibited under certain conditions but not others. Among the most common conditional mutations are temperature-sensitive mutations, which are useful in organisms, such as bacteria and lower eukaryotes, that can grow
at a range of temperatures. For instance, a missense mutation may cause the resulting mutant protein to be less stable at certain temperatures, such that the protein is fully functional at one temperature (e.g., 23 °C) but begins to denature and is thus inactive at another temperature (e.g., 36 °C), whereas the normal protein would be fully stable and functional at both temperatures. A temperature at which the mutant phenotype is observed is called nonpermissive; a permissive temperature is one at which the mutant phenotype is not observed even though the mutant allele is present. Thus mutant strains can be maintained at a permissive temperature and then grown at a nonpermissive temperature for analysis of the mutant phenotype. An example of a particularly important screen for temperature-sensitive mutants in the yeast S. cerevisiae comes from the studies of L. H. Hartwell and colleagues in the late 1960s and early 1970s. They set out to identify genes important in regulation of the cell cycle (during which a cell synthesizes proteins, replicates its DNA, and then undergoes mitotic cell division). Exponential growth of a single yeast cell for 20–30 cell divisions forms a visible yeast colony on solid agar medium. Because mutants with a complete block in the cell cycle would not be able to form colonies, conditional mutants were required to study mutations that affect this basic cellular process. To screen for such mutants, the researchers first exposed yeast cells to mutagens and then identified mutant yeast cells that could grow normally at 23 °C, but could not form a colony when placed at 36 °C (Figure 6-6a).
EXPERIMENTAL FIGURE 6-6 Haploid yeast cells carrying temperature-sensitive lethal mutations can be maintained at permissive temperature and analyzed at nonpermissive temperature. (a) Genetic screen for temperature-sensitive cell division cycle (cdc) mutants in S. cerevisiae. Yeast cells that grow and form colonies at 23 °C (permissive temperature) but not at 36 °C (nonpermissive temperature) may carry a lethal mutation that blocks cell division. See L. H. Hartwell, 1967, J. Bacteriol. 93:1662. (b) The subset of temperature-sensitive mutants that have a block in the cell cycle can be identified by an arrest at the nonpermissive temperature at a uniform stage of the cell cycle. Shown here are representations of wild-type yeast and two different temperature-sensitive mutants after incubation at the nonpermissive temperature for 6 hours. Wild-type cells, which continue to grow, can be seen with all different sizes of buds, reflecting different stages of the cell cycle. In contrast, cdc28 mutants arrest at a point before emergence of a new bud and therefore appear as unbudded cells, while the cdc7 mutants, which arrest just before separation of the mother cell and bud (emerging daughter cell), appear as cells with large buds. Description In illustration a, the experimental procedure for studying temperature sensitive mutation in yeast involves five steps. Step 1: Yeast is cultured in a liquid broth to which a mutagen is added. Step 2: The liquid broth is divided into smaller aliquots in test tubes. The test tubes with the broth are incubated at 23 degree Celsius for five hours. Step 3: Individual aliquots are plated out on to agar plates. Step 4: The plates are incubated at 23 degree Celsius. The incubated agar plates show multiple colonies. Step 5: The plate is replicated and incubated at two different temperatures, for example, 23 and 26 degrees Celsius to find mutant colonies whose growth is temperature sensitive. Illustration labeled b, shows wild-type, c d c 28 mutant, and c d c 7 mutant yeast cells. The wild type show tiny circular buds of different sizes growing on the oval yeast cells.
Recessive Lethal Mutations in Diploids Can Be Identified by Inbreeding and Maintained in Heterozygotes
c d c 28 mutant yeast shows no budding. c d c 7 mutant yeast cells show large buds growing from the yeast cell, almost the same size as the yeast cells. Once temperature-sensitive mutants were isolated, further analysis revealed that some indeed were defective in cell division. In S. cerevisiae, cell division occurs through a budding process, and the size of the bud, which is easily visualized by light microscopy, indicates a cell’s position in the cell cycle. Each of the mutants that could not grow at 36 °C was examined by microscopy after several hours at the nonpermissive temperature. Examination of many different temperature-sensitive mutants revealed a set that exhibited a distinct block in the cell cycle. These mutants were therefore designated cdc (cell division cycle) mutants. Importantly, these yeast mutants did not simply fail to grow, as they might have if they carried a mutation affecting general cellular metabolism. Rather, at the nonpermissive temperature, the mutants grew normally for part of the cell cycle, but then arrested at a particular stage of the cell cycle, so that many cells at that stage were seen (Figure 6-6b). Most cdc mutations in yeast are recessive; that is, when haploid cdc strains are mated to wild-type haploids, the resulting heterozygous diploids are neither temperature sensitive nor defective in cell division. Recessive Lethal Mutations in Diploids Can Be Identified by Inbreeding and Maintained in Heterozygotes
Complementation Tests Determine Whether Different Recessive Mutations Are in the Same Gene
In diploid organisms, phenotypes resulting from recessive mutations can be observed only in individuals that are homozygous for the mutant alleles. Yet exposure of a diploid organism to a mutagen typically changes only one of the two copies of a given gene, yielding heterozygous mutants. Thus genetic screens must include inbreeding steps to generate progeny that are homozygous for the mutant allele. The geneticist H. Muller developed a general and efficient procedure for carrying out such inbreeding experiments in the fruit fly Drosophila. By using such procedures, recessive lethal mutations in Drosophila and other diploid organisms can be maintained in heterozygous individuals and their phenotypic consequences analyzed in homozygotes. The Muller approach was used to great effect by Christiane NüssleinVolhard and Eric Wieschaus, who systematically screened for recessive lethal mutations affecting embryogenesis in Drosophila. The two researchers screened for dead homozygous embryos carrying recessive lethal mutations, then examined the dead embryos under the microscope for specific morphological defects. Current understanding of the molecular mechanisms underlying the development of multicellular organisms is based, in large part, on the detailed picture of embryonic development revealed by characterization of these Drosophila mutants. Complementation Tests Determine Whether Different Recessive Mutations Are in the Same Gene
Researchers using the classical genetic approach to studying a particular cellular process often isolate multiple recessive mutations that produce the same phenotype. A common test for determining whether these mutations are in the same gene or in different genes exploits the phenomenon of genetic complementation; that is, restoration of the wild-type phenotype by mating two different mutants. If two recessive mutations, a and b, are in the same gene, then a diploid organism carrying one a allele and one b allele will exhibit the mutant phenotype because neither allele provides a functional copy of the gene. In contrast, if mutations a and b are in separate genes, then heterozygotes carrying a single copy of each mutant allele will not exhibit the mutant phenotype because a wild-type allele of each gene is also present. In this case, the mutations are said to complement each other. Complementation analysis cannot be performed on dominant mutations because the phenotype conferred by the mutant allele is displayed even in the presence of a wild-type allele of the gene. Complementation analysis of a set of mutants exhibiting the same phenotype can distinguish the individual genes in a set of functionally related genes, all of which must function to produce a given phenotypic trait. For example, the screen for cdc mutations in the yeast S. cerevisiae described previously yielded many recessive, temperature-sensitive mutants that appeared to be arrested at the same cell cycle stage. To determine how many genes were affected by these mutations, Hartwell and his colleagues performed complementation tests on all of the pair-wise combinations of their cdc mutants, following the general protocol outlined in Figure 6-7. These tests organized more than 100 cdc mutations into about 20 different CDC genes. The subsequent molecular characterization
of the CDC genes and their encoded proteins, as described in detail in
Chapter 19, has provided a framework for understanding how cell division is regulated in organisms ranging from yeast to humans.
Double Mutants Are Useful in Assessing the Order in Which Proteins Function
EXPERIMENTAL FIGURE 6-7 Complementation analysis determines whether recessive mutations are in the same or different genes. Complementation tests in yeast are performed by mating haploid a and α cells carrying different recessive mutations to produce diploid cells. In the analysis of cdc mutations, pairs of different haploid temperaturesensitive cdc strains were systematically mated and the resulting diploids tested for growth at the permissive and nonpermissive temperatures. In this hypothetical example, the cdcX and cdcY mutants complement each other and thus have mutations in different genes, whereas the cdcX and cdcZ mutants have mutations in the same gene. Description A set of illustrations show the steps of complementation analysis of yeast cells. The first step is labeled: mate haploids opposite mating types and carrying different recessive temperature sensitive c d c mutations, showing a pair of cells labeled: Small c d c big X representing mutant type a and small c d c big Y representing mutant type alpha and the other pair labeled small c d c big X representing mutant type a and small c d c big Z representing mutant alpha. These mutants are plated and incubated at permissive temperatures. The second section is labeled: Test resulting diploids for a temperature sensitive phenotype. This part shows two sets of agar plates (the original and the replica-plates), one set labeled 23 degrees Celsius and the other labeled 36 degrees Celsius. Both of the 23 degree Petri dishes show colonies. The replica-plates are incubated at nonpermissive temperatures. Only the small c d c big X and small c d c big Y Petri dish shows growth at 36 degrees. Below is the phenotype interpretation box. On the left it says: Phenotype: small c d c big X and small c d c big Y wild type, then below this the interpretation reads "growth indicates that small c d c big X and small c d c big Y are in different genes. Receptive wild-type alleles provide normal function. On the right, the box says: small c d c big X and small c d c big Z mutant, then below this a text reads "absence of growth indicates small c d c big X and small c d c big Z are on the same gene. Both alleles non-functional.
Double Mutants Are Useful in Assessing the Order in Which Proteins Function By careful analysis of mutant phenotypes associated with a particular cellular process, researchers can often deduce the order in which a set of genes and their protein products function. Two general types of processes are amenable to such analysis: (1) biosynthetic pathways in which a precursor material is converted via one or more intermediates to a final product, and (2) signaling pathways that regulate other processes and involve the flow of information rather than chemical intermediates. Ordering of Steps in Biosynthetic Pathways A simple example of the first type of process is the biosynthetic pathway for secreted proteins discussed in Chapter 14. In the secretory pathway, proteins move from their site of synthesis on the rough endoplasmic reticulum (ER) to the Golgi complex, then to secretory vesicles, and finally to the cell surface. The genetic analysis of this pathway in S. cerevisiae began, like the analysis of cell cycle mutants, with the isolation of temperature-sensitive mutants that blocked different steps along the secretory pathway. These mutants could be categorized according to the type of organelle that accumulated at the nonpermissive temperature. For example, at the nonpermissive temperature, sec12 mutants accumulated membranes that looked like ER membranes, whereas sec4 mutants accumulated secretory vesicles. It was possible to establish the order in
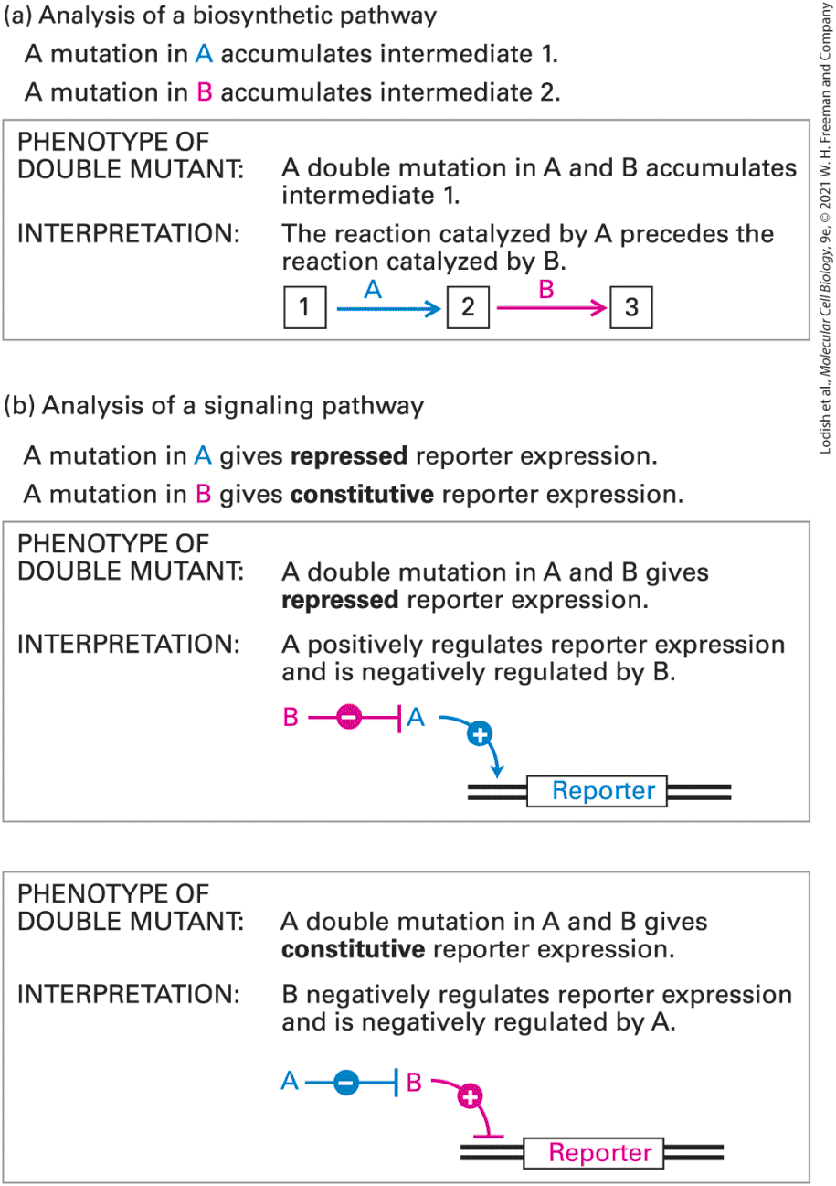
which the genes act along the pathway by analysis of double mutants. By constructing a double mutant that contained both sec12 and sec4, it was conclusively shown that the sec12 mutant acts earlier in the pathway than sec4 because the double mutant accumulates ER membranes and not secretory vesicles. The general logic by which double mutants defective in two steps in a biosynthetic pathway are useful in ordering such pathways is shown in Figure 6-8a.
FIGURE 6-8 Analysis of double mutants can often order the steps in biosynthetic or signaling pathways. When mutations in two different genes affect the same cellular process but produce distinctly different phenotypes, the phenotype of the double mutant can often reveal the order in which the two genes must function. (a) In the case of mutations that affect the same biosynthetic pathway, a double mutant will accumulate the intermediate immediately preceding the step catalyzed by the protein that acts earlier in the wild-type organism. (b) Double-mutant analysis of a signaling pathway is possible if two mutations have opposite effects on expression of a reporter gene. Description (a) Two mutations, A and B, occur in two different genes that affect the same biosynthetic pathway. The process is represented diagrammatically by three boxes labeled 1, 2, and 3, representing intermediates in a biochemical pathway. A mutation in A causes intermediate 1 to accumulate, and a mutation in B causes intermediate 2 to accumulate. The double mutant shows an accumulation of intermediate 1, indicating that the reaction catalyzed by A precedes that catalyzed by B. (b) A signaling pathway mediated by two genes, A and B, is shown schematically. Two phenotypes and their interpretations are shown. 1. If the double-mutant phenotype shows a repressed reporter expression, gene A positively regulates the reporter expression and is negatively regulated by gene B. 2. If the double-mutant phenotype yields constitutive reporter expression, B negatively regulates reporter expression and is negatively regulated by gene A. Ordering Steps of Signaling Pathways As we will learn in later chapters, the expression of many eukaryotic genes is regulated by signaling pathways that are initiated by extracellular hormones, growth factors, or other signals. Such signaling pathways may include numerous components, and double-mutant analysis can often
Genetic Suppression and Synthetic Lethality Can Reveal Interacting or Redundant Proteins
provide insight into the functions and interactions of these components. The only prerequisite for obtaining useful information from this type of analysis is that the two mutations must have very different, or even opposite, effects on the output of the same regulated pathway as measured by expression of a reporter gene. Most commonly, one mutation represses expression of a particular reporter gene even when the signal is present, while another mutation results in the expression of that reporter gene even when the signal is absent (i.e., constitutive expression). As illustrated in
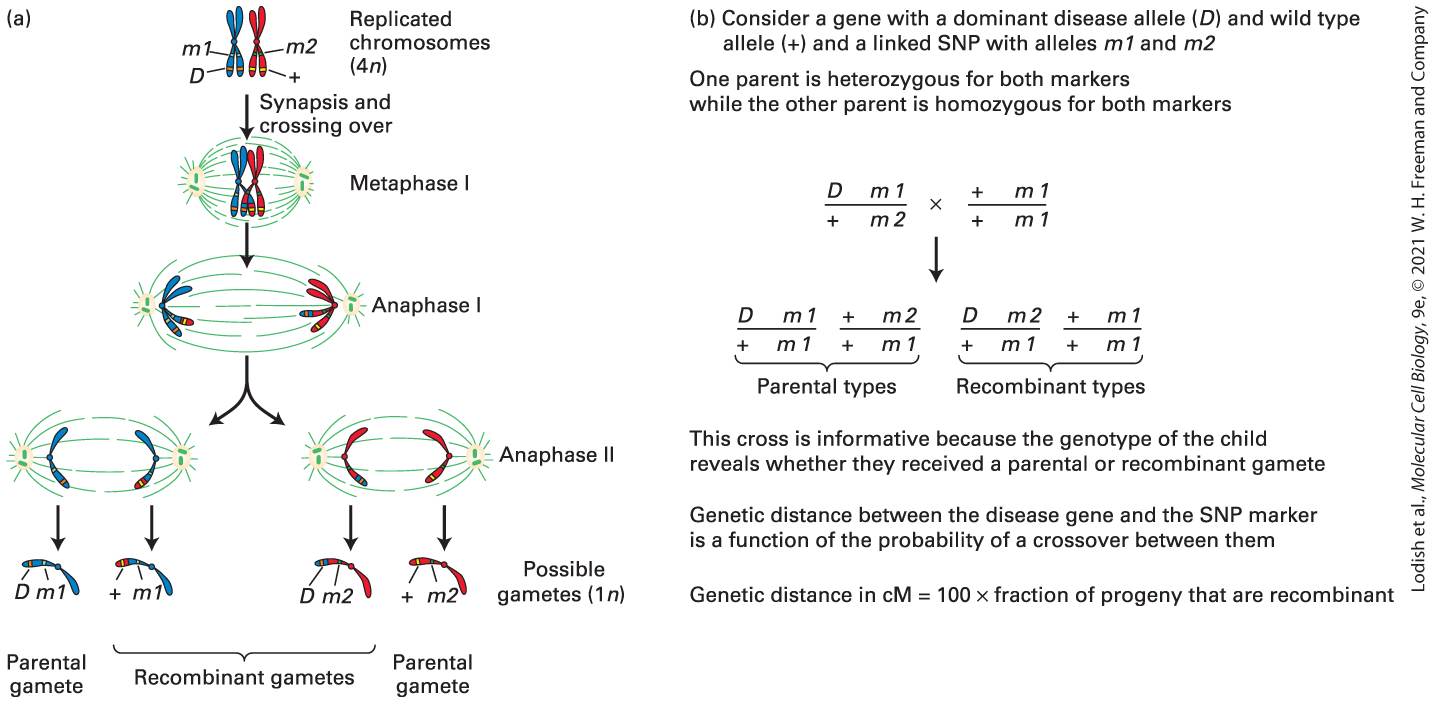
Figure 6-8b, two simple regulatory mechanisms are consistent with such single mutants, but the double-mutant phenotype can distinguish between them. Thus the observed phenotype of the double mutant provides information about the order in which the proteins act and whether they are positive or negative regulators. This general approach has enabled geneticists to delineate many of the key steps in a variety of different regulatory pathways, setting the stage for more specific biochemical assays. Note that this technique differs from the complementation analysis just described in that both dominant and recessive mutants can be subjected to double-mutant analysis. When two recessive mutations are tested, the double mutant created must be homozygous for both mutations. Genetic Suppression and Synthetic Lethality Can Reveal Interacting or Redundant Proteins
Two other types of genetic analysis can provide additional clues about how proteins that function in the same cellular process may interact with one another in the living cell. Both of these methods, which are applicable in many experimental organisms, involve the use of double mutants in which the phenotypic effects of one mutation are changed by the presence of a second mutation. Suppressor Mutations The first type of analysis is based on genetic suppression. To understand this phenomenon, suppose that point mutations lead to structural changes in one protein (A) that disrupt its ability to associate with another protein (B) involved in the same cellular process. Similarly, mutations in protein B lead to small structural changes that inhibit its ability to interact with protein A. Assume, furthermore, that the normal functioning of proteins A and B depends on their interacting. In theory, a specific structural change in protein A might be suppressed by compensatory changes in protein B, allowing the mutant proteins to interact. In the rare cases in which such suppressor mutations occurred, strains carrying both mutant alleles would be normal, whereas strains carrying only one or the other mutant allele would have a mutant phenotype (Figure 6-9a).
FIGURE 6-9 Mutations that result in genetic suppression or synthetic lethality reveal interacting or redundant proteins. (a) The observation that double mutants with two defective proteins (A and B) have a wild-type phenotype but that single mutants have a
mutant phenotype indicates that the function of each protein depends on interaction with the other. (b) The observation that double mutants have a more severe phenotypic defect than single mutants is also evidence that two proteins (e.g., subunits of a heterodimer) must interact to function normally. (c) The observation that a double mutant is nonviable but that the corresponding single mutants have the wild-type phenotype indicates that two proteins function in redundant pathways to produce an essential product. Description Illustration a, describes suppression: Four genotypes big A and big B, small a and big B, big A and small b, and small a and small b, have wild type, mutant, mutant, and suppressed mutant phenotypes, respectively. The effect of these genotypes on the phenotype and the interpretation of protein function is summarized as follows: Each genotype is inside a circle with mutants (middle 2) colored yellow and the other colored blue. Puzzle piece shapes are used to show how the genes go together. The puzzle pieces for the mutants do not fit. Illustration b, describes synthetic lethality 1: Four genotypes big A and big B, small a and big B, big A and small b, and small a and small b, have wild type, partial defect, partial defect and severe defect phenotypes, respectively. The effect of these genotypes on the phenotype and the interpretation of protein function is summarized as follows: Four circles represent each situation. The first circle has matching puzzle pieces, but the other 3 have puzzle pieces that don’t fit. Illustration c, describes synthetic lethality 2: Four genotypes are shown big A and big B, small a and big B, big A and small b, and small a and small b, have wild type, wild type, wild type, and mutant phenotypes respectively. The effect of these genotypes on the phenotype and the interpretation of protein function is summarized as follows: Four rectangles are present. The first three are blue, the last one is yellow. Each is labeled precursor at the top inside the rectangle, then has a down arrow from each gene. In the first rectangle, the two down arrows each have a blue product circle. In the next two rectangles there is only one product and one empty arrow. In the last rectangle, there is no product.
Global Analysis of Double Mutant Combinations Can Reveal Networks of Gene Functions
The observation of genetic suppression in yeast strains carrying a mutant actin allele (act1-1) and a second mutation in another gene (sac6) provided early evidence for a direct interaction in vivo between the proteins encoded by the two genes. Later biochemical studies showed that these two proteins — Act1 and Sac6 — do indeed interact in the construction of functional actin structures within the cell. Synthetic Lethal Mutations Another phenomenon, called synthetic lethality, produces a phenotypic effect opposite to that of suppression. In this case, the deleterious effect of one mutation is greatly exacerbated (rather than suppressed) by a second mutation in a related gene. One situation in which such synthetic lethal mutations can occur is illustrated in Figure 6-9b. In this example, a heterodimeric protein is partially, but not completely, inactivated by mutations in either one of its nonidentical subunits. However, in double mutants carrying specific mutations in the genes encoding both subunits, little interaction between subunits occurs, resulting in severe phenotypic effects. Synthetic lethal mutations can also reveal nonessential genes whose encoded proteins function in redundant pathways for producing an essential cell component. As depicted in Figure 6-9c, if either pathway alone is inactivated by a mutation, the other pathway will be able to supply the needed product. However, if both pathways are inactivated at the same time, the essential product cannot be synthesized, and the double mutants will be nonviable.
Global Analysis of Double Mutant Combinations Can Reveal Networks of Gene Functions In the preceding sections we have seen how evaluation of the phenotype of double mutants can provide information about whether two genes participate in the same process or in redundant processes. We have also seen how double mutants can be used to determine the order of function for genes that participate in the same biosynthetic or regulatory pathway. The consequences of double mutants can usually be interpreted in more than one way, and the phenotype of any particular double mutant rarely provides a definitive conclusion about how the participating genes interact. However, when pair-wise combinations of double mutants from large sets of genes are examined together, convincing patterns of gene interactions can emerge. The first comprehensive analysis of double mutants on a genome-wide scale was performed in S. cerevisiae, which has a total of about 6000 genes. Mutations in the approximately 1000 essential genes were obtained as temperature-sensitive alleles as described previously for cdc mutants, and the 5000 genes that are not essential were deleted, as described in Section 6.6. Using an automated system to perform genetic crosses, almost every possible double mutant was constructed and its phenotype compared to that of each of the single-component mutants. Computer algorithms determined the type and strength of genetic interaction based on the logic outlined previously. These algorithms produced a two-dimensional map of
genetic interactions that clusters genes according to how closely related their functions are (Figure 6-10). Remarkably, when looking at the genes for which something is already known about their function, this interaction map, based only on information from the phenotype of double mutants, closely matches the known organization of metabolic and cell biologic processes. Importantly, for the many genes whose function is still unknown, their placement on the interaction map provides important clues to their function that may guide future biochemical and genetic studies. Methods using CRISPR-Cas9 now enable mutations to be produced in mammalian cells, as described in Section 6.6. These methods should allow similar large-scale gene interaction networks to be mapped in human cells.
FIGURE 6-10 Gene Interaction Network for S. cerevisiae. The approximately 6000 genes of S. cerevisiae were tested in every possible pair-wise combination (a total of double mutants were constructed). The relationships between genes were then arranged based on the type and strength of their genetic interactions by a computer algorithm. (a) In this global map of gene interactions, each point represents a single S. cerevisiae gene and the length of the segments connecting genes represents the degree to which genes display similar genetic interactions, with genes that exhibit the most closely
related functions clustered most closely together. (b) A sample of genes of known function, color coded according to their cellular function, are placed on the global map of gene interactions. Importantly, genes known to be involved in the same process are in close proximity on the genetic interaction map. [Reprinted by permission from American Association for the Advancement of Science, from M. Costanzo et al., 2016. A global genetic interaction network maps a wiring diagram of cellular function. Science, 353(6306):aaf1420. https://doi.org/10.1126/science.aaf1420; permission conveyed through Copyright Clearance Center, Inc.] Description The illustration on the left labeled (a) is the gene interaction network made of many tiny white dots networked together. The illustration on the right labeled (b) shows a dotted circle inside which there are many colored dots, where dots similarly colored are clumped together. Different colored dots represent various functions of the sample genes. From the bottom left, the functions are: m R N A processing, r R N A and n c R N A processing, ribosome biogenesis, vesicle traffic, glycosylation protein folding or targeting cell wall biosynthesis, M V B sorting and p H dependent signaling, cell polarity and morphogenesis, cytokinesis, t R N A wobble modification, peroxisome, respiration; oxidative phosphorylation mitochondrial targeting, protein degradation, metabolism and fatty acid biosynthesis, mitosis and chromosome segregation, D N A replication and repair, nuclear-cytoplasmic transport, and transcription and chromatin organization. KEY CONCEPTS OF SECTION 6.1 Genetic Analysis of Mutations to Identify and Study Genes Diploid organisms carry two copies (alleles) of each gene, whereas haploid organisms carry only one copy. Recessive mutations often lead to a loss of function, which is masked if a wild-type allele of the gene is present. For the mutant phenotype to be observed, both alleles must carry the mutation. Dominant mutations lead to a mutant phenotype in the presence of a wild-type allele of the gene. The phenotypes associated with dominant mutations often represent a
gain of function. In meiosis, a diploid cell undergoes one DNA replication and two cell divisions, yielding four haploid cells in which maternal and paternal chromosomes and their associated alleles are randomly assorted (see Figure 6-3). Dominant and recessive mutations exhibit characteristic segregation patterns in genetic crosses (see Figure 6-4). In haploid yeast, temperature-sensitive mutations are particularly useful for identifying and studying genes essential to survival. The number of functionally related genes involved in a process can be defined by complementation analysis (see Figure 6-7). The order in which genes function in a biosynthetic or signaling pathway can be deduced from the phenotype of double mutants defective in two steps in the affected process. Functionally significant interactions between proteins can be deduced from the phenotypic effects of allele-specific suppressor mutations or synthetic lethal mutations. By evaluating combinations of double mutants for all of the genes in an organism, it is possible to construct a global map of the network of functional gene interactions within a cell. Such a map has been constructed for the 6000 genes of S. cerevisiae, and it should be possible to construct an equivalent map of the 20,000 mammalian genes.
6.2 DNA Cloning and Characterization
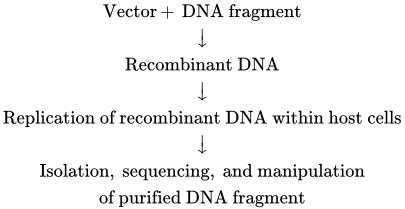
6.2 DNA Cloning and Characterization Detailed studies of the structure and function of a gene at the molecular level require large quantities of the individual gene in pure form. Researchers use DNA cloning as a way to prepare large numbers of identical DNA molecules. DNA cloning uses a variety of techniques, often referred to as recombinant DNA technology. Recombinant DNA is simply any DNA molecule composed of sequences derived from different organisms. The key to cloning a DNA fragment of interest is to link it into a vector DNA molecule that can replicate within a host cell. Such a vector could be a bacterial plasmid or a modified viral genome, for example. The DNA fragment is inserted into the vector, forming a single recombinant DNA molecule. That recombinant molecule is introduced into a host cell, and the inserted DNA is replicated along with the vector, generating a large number of identical DNA molecules. The basic scheme can be summarized as follows:
Restriction Enzymes and DNA Ligases Allow Insertion of DNA Fragments into Cloning Vectors
Although investigators have devised numerous experimental variations, this flow diagram indicates the essential steps in DNA cloning. In this section, we first describe methods for isolating a specific sequence of DNA from a sea of other DNA sequences. This process often involves cutting the genome into fragments and then placing each fragment in a vector so that the entire collection can be propagated as recombinant molecules in separate host cells. While many different types of vectors exist, our discussion will mainly focus on plasmid vectors in Escherichia coli host cells, which are commonly used. Various techniques can then be employed to identify the sequence of interest from this collection of DNA fragments. Once a specific DNA fragment is isolated, the exact sequence of nucleotides in the fragment can be determined. We end with a discussion of the polymerase chain reaction (PCR). This powerful and versatile technique can be used in many ways to generate large quantities of a specific sequence and to manipulate DNA in the laboratory. The various uses of cloned DNA fragments are discussed in subsequent sections.
Restriction Enzymes and DNA Ligases Allow Insertion of DNA Fragments into Cloning Vectors A major objective of DNA cloning is to obtain discrete, small regions of an organism’s DNA that constitute specific genes. In addition, only relatively small DNA molecules can be inserted into any of the available vectors. For these reasons, the very long DNA molecules that compose an organism’s genome must be cleaved into fragments that can be inserted into the vector DNA. Two types of enzymes — restriction enzymes and DNA ligases — are used to produce such recombinant DNA molecules. Cutting DNA Molecules into Small Fragments Restriction enzymes are endonucleases produced by bacteria that typically recognize specific 4–8-bp sequences, called restriction sites, and cleave both DNA strands at these sites. Restriction sites commonly are short palindromic sequences; that is, the restriction-site sequence is the same on each DNA strand when read in the to direction (Figure 6-11).
FIGURE 6-11 Cleavage of DNA by the restriction enzyme EcoRI. This restriction enzyme from E. coli makes staggered cuts at the specific 6-bp palindromic sequence shown, yielding fragments with single-stranded, complementary 4-base sticky ends. Many other restriction enzymes also produce fragments with sticky ends. Description The illustration shows the two strands of D N A, the strand above runs from 5 prime to 3 prime direction; with the gene sequence G A A T T C present in the middle. The bottom strand runs from one 3 prime to 5 prime direction; with the gene sequence; C T T A A G present in middle. E co R 1 enzyme is represented by dotted lines cutting through the strands, in the 5 prime to 3 prime strand after G, starting left of the first A, then moving over between the strands until the last A in the 3 prime to 5 prime strand before G. A down arrow labeled cleavage points at sticky ends which represent nucleotides A A T T of the 5 prime to 3 prime strand (which is cut) and T T A A of the 3 prime to 5 prime strand (which is cut).
For each restriction enzyme, bacteria also produce a modification enzyme, which protects a host bacterium’s own DNA from cleavage by modifying the host DNA at or near each potential cleavage site. The modification enzyme adds a methyl group to one or two bases, usually within the restriction site. When a methyl group is present there, the restriction endonuclease is prevented from cutting the DNA. Together, the restriction endonuclease and the modification enzyme form a restrictionmodification system that protects the host DNA while it destroys incoming foreign DNA (e.g., bacteriophage DNA or DNA taken up during transformation) by cleaving it at all the available restriction sites. Many restriction enzymes make staggered cuts in the two DNA strands at the corresponding restriction site, generating fragments that have a singlestranded tail at both ends (see Figure 6-11). The tails on the fragments generated at a given restriction site are complementary to those on all other fragments generated by the same restriction enzyme. At room temperature, these sticky ends can transiently base-pair with those on other DNA fragments generated with the same restriction enzyme. The DNA isolated from an individual organism has a specific sequence that, purely by chance, contains a specific set of restriction sites. Thus a given restriction enzyme will cut the DNA from a particular source into a reproducible set of fragments called restriction fragments. The frequency with which a restriction enzyme cuts DNA, and thus the average size of the resulting restriction fragments, depends largely on the length of the recognition site. For example, a restriction enzyme that recognizes a 4-bp site will cleave DNA an average of once every , or 256, base pairs,
whereas an enzyme that recognizes an 8-bp sequence will cleave DNA an average of once every base pairs (65 kb). Hundreds of different restriction enzymes have been identified from different species of bacteria. Thus DNA molecules can be cut at a large number of different sequences corresponding to the recognition sites of these enzymes. Inserting DNA Fragments into Vectors DNA fragments with either sticky ends or blunt ends can be inserted into vector DNA with the aid of DNA ligase. During normal DNA replication, DNA ligase catalyzes the end-to-end joining (ligation) of short fragments of DNA. For purposes of DNA cloning, purified DNA ligase is used to covalently join together the ends of a restriction fragment with the ends of the restriction enzyme–cut vector DNA by forming the standard covalent phosphodiester bonds of DNA (Figure 6-12). DNA ligase from bacteriophage T4 can ligate complementary sticky ends as well as two blunt DNA ends. However, blunt-end ligation is inherently inefficient and requires a higher concentration of both DNA and DNA ligase than does ligation of sticky ends.
FIGURE 6-12 Ligation of restriction fragments with complementary sticky ends. In this example, vector DNA cut with EcoRI is mixed with a sample containing restriction
Isolated DNA Fragments Can Be Cloned into E. coli Plasmid Vectors
fragments produced by cleaving genomic DNA with several different restriction enzymes. The short base sequences composing the sticky ends of each fragment type are shown. The sticky end on the cut vector DNA base-pairs only with the complementary sticky ends on the EcoRI fragment (a) in the genomic sample. The adjacent hydroxyl and phosphate groups (red) on the base-paired fragments are then covalently joined (ligated) by T4 DNA ligase. Description The illustration has a vector D N A (a prime) and three genomic D N A fragments (a, b, and c, respectively). The 5 prime strand of vector D N A has a hydroxyl end and the 3 prime strand has a sticky end with a T T A A sequence which is bonded to a phosphate group. The genomic D N A fragment (a) has its 3 prime strand with a T T A A sequence bonded to a phosphate group. Its 5 prime strand has a hydroxyl group end. The genomic D N A fragment (b) has its 3 prime strand with a G C sequence bonded to a phosphate group. Its 5 prime strand has a hydroxyl group end. The genomic D N A fragment (c) has its 3 prime strand with a T C G A sequence bonded to a phosphate group. Its 5 prime strand has a hydroxyl group end. Complementary ends base-pair: The vector D N A binds with the genomic D N A fragment (a) has its 3 prime strand has a T T A A sequence. Genomic D N A fragment (b) and (c) are unpaired. After base pairing, the phosphodiester backbone of the vector and genomic DNA fragments are not connected. T 4 DNA ligase is used to ligate (a prime) and (a) D N A strands together, using 2 molecules of ATP in the process and liberating 2 A M P and 2 P P subscript i. Isolated DNA Fragments Can Be Cloned into E. coli Plasmid Vectors Let’s take a closer look at the plasmids used as vectors. Plasmids are circular, double-stranded DNA (dsDNA) molecules that replicate
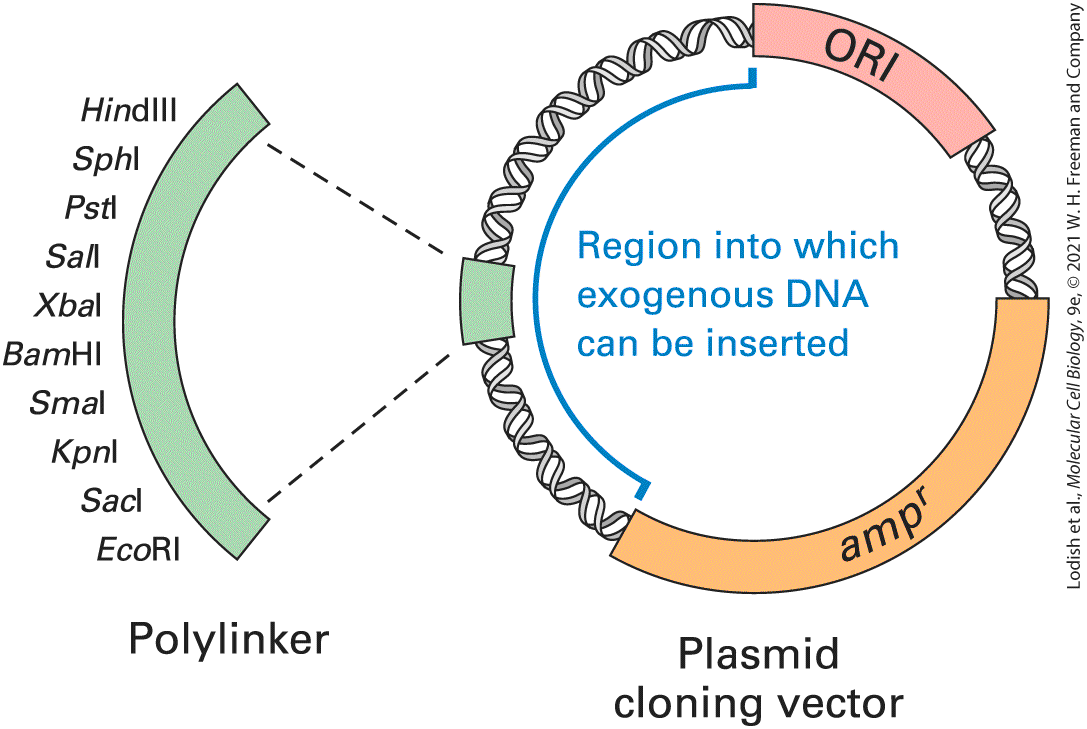
separately from a cell’s chromosomal DNA. These extrachromosomal DNAs, which occur naturally in bacteria and in lower eukaryotic cells (e.g., yeast), exist in a symbiotic relationship with their host cell. Like the host-cell chromosomal DNA, plasmid DNA is duplicated before every cell division. During cell division, copies of the plasmid DNA segregate to each daughter cell, ensuring that the plasmid continues to be propagated through successive generations of the host cell. The plasmids most commonly used in recombinant DNA technology are those that replicate in E. coli. Investigators have engineered these plasmids to optimize their use as vectors in DNA cloning — for instance, by removing unneeded portions from naturally occurring E. coli plasmids. Removal of unneeded portions yields plasmid vectors about 1.2–3 kb in length that contain three regions essential for DNA cloning: a replication origin (ORI); a marker that permits selection of plasmids that have the incorporated gene (selectable marker), usually a drug-resistance gene; and a region in which exogenous DNA fragments can be inserted (Figure 613).
FIGURE 6-13 Basic components of a plasmid cloning vector that can replicate within an E. coli cell. Plasmid vectors contain a replication origin (ORI) sequence where DNA replication can be initiated by host-cell enzymes. They also contain a gene that functions as a selectable marker, such as , which encodes the enzyme β-lactamase and confers resistance to ampicillin. Inclusion of a synthetic polylinker containing the recognition sequences for several different restriction enzymes increases the versatility of a plasmid vector since the vector is designed so that each site in the polylinker is unique on the plasmid. Exogenous DNA can be inserted into the polylinker without disturbing the ability of the plasmid to replicate or express the gene. Description A circular plasmid containing O R I, a m p superscript r, and poly linker regions surrounded by other genes. A part of the vector is labeled, region into which exogenous D N A can be inserted. The polylinker portion is enlarged and is labeled with 10 other recognition sequences for several different restriction enzymes namely, Hind 3, S p h 1, P s t 1, S a l 1, X b a 1, Bam H 1, S m a 1, K p n 1, S a c 1, and E co R 1.
Figure 6-14 outlines the general procedure for cloning a DNA fragment using E. coli plasmid vectors. When E. coli cells are mixed with recombinant vector DNA and subjected to a stress such as heat shock, a small fraction of the cells will take up the plasmid DNA, a process known as transformation. Typically, 1 cell in about 10,000 incorporates a single plasmid DNA molecule and thus becomes transformed. The rare transformed cells can be easily selected by use of a selectable marker. For instance, if the plasmid carries a gene that confers resistance to the antibiotic ampicillin, transformed cells can be selected by growing them in a medium containing ampicillin. All the antibiotic-resistant progeny cells that arise from the initial transformed cell will contain plasmids with the same inserted DNA. Since all the cells in a colony arise from a single transformed parent cell, they constitute a clone of cells, and the initial fragment of DNA inserted into the parental plasmid is referred to as cloned DNA or a DNA clone.
EXPERIMENTAL FIGURE 6-14 DNA cloning in a plasmid vector permits amplification of a DNA fragment. A fragment of DNA to be cloned is first inserted into a plasmid vector containing an ampicillin-resistance gene , such as that shown in
Figure 6-13. Only the few cells transformed by incorporation of a plasmid will survive on ampicillin-containing medium. In transformed cells, the plasmid DNA replicates and segregates into daughter cells, resulting in the formation of an ampicillin-resistant colony in which each cell contains the cloned DNA. Description The following steps are used to clone and amplify target D N A. 1. Circle diagram: A D N A fragment to be cloned is enzymatically inserted into a circular plasmid vector, forming a recombinant plasmid. The plasmid also contains a gene conferring resistant to the antibiotic ampicillin (a m p superscript r). 2. E. coli bacteria are exposed to the recombinant plasmid, calcium chloride, and heat. 3. The bacteria are modified on nutrient agar in the presence of ampicillin. 4. Only bacteria that have taken up plasmids containing the ampicillin-resistance gene grow. 5. Plasmid replication within the surviving bacteria occurs. 6. Cell multiplication occurs. 7. A colony of cells, each containing copies of the same recombinant plasmid is obtained. The versatility of an E. coli plasmid vector is increased by the addition of a polylinker, a synthetically generated sequence containing one copy of each of several different restriction sites that are not present elsewhere in the plasmid sequence (see Figure 6-13). Typically, the polylinker is cleaved with two different restriction enzymes in preparation to accept a
Yeast Genomic Libraries Can Be Constructed with Shuttle Vectors and Screened by Functional Complementation
DNA fragment prepared with two different sticky ends formed by cleavage by the same two enzymes. Such a strategy eliminates unwanted byproducts such as a cleaved plasmid vector that has reclosed and greatly increases the efficiency of cloning DNA fragments. Plasmid cloning vectors are useful for propagating DNA fragments up to about 20 kb in length, but fragments longer than this cannot be reliably replicated within one cell-division cycle. For some purposes, such as the isolation and manipulation of large segments of the human genome, it is desirable to clone DNA segments as large as several megabases [1 megabase (Mb) = 1 million base pairs]. For this purpose, specialized plasmid vectors known as BACs (bacterial artificial chromosomes) have been developed. One type of BAC uses a replication origin, derived from an E. coli plasmid, known as the F factor. The F factor, and cloning vectors derived from it, can be stably maintained at a single copy per E. coli cell even when it contains inserted sequences of up to about 2 Mb. Production of BAC libraries requires special methods for the isolation, ligation, and transformation of large segments of DNA because segments of DNA larger than about 20 kb are highly vulnerable to mechanical breakage even by standard manipulations such as pipetting. Yeast Genomic Libraries Can Be Constructed with Shuttle Vectors and Screened by Functional Complementation
A collection of DNA molecules, each cloned into a vector molecule, is known as a DNA library. When genomic DNA from a particular organism is the source of the starting DNA, the set of clones that collectively represent all the DNA sequences in the genome is known as a genomic library. Once a genomic library is established, investigators need ways to isolate the cloned genes that are relevant to the function they are studying. For example, investigators may have identified an interesting recessive mutation in an experimental organism and would like to isolate the cloned wild-type copy of the gene from their genomic library. The method frequently used for this is referred to as functional complementation. Let’s look at a functional complementation assay in yeast. Yeast genes that are cloned in special E. coli plasmids can be introduced into mutant yeast cells to identify the wild-type gene that is defective in the mutant strain. Because genes of the yeast Saccharomyces do not contain multiple introns, they are sufficiently compact that an entire sequence of as many as 10 genes can be included in a genomic DNA fragment inserted into a plasmid vector. A plasmid genomic library that is to be screened by functional complementation in yeast cells needs to be constructed so that it contains clones of all the yeast genes. The plasmid vector carrying the clones must be capable of replication in both E. coli cells and yeast cells: in E. coli cells to produce the clones and in yeast cells to screen for functional complementation. This type of vector, capable of propagation in two different hosts, is called a shuttle vector. The structure of a typical yeast shuttle vector is shown in Figure 6-15a. This vector contains the basic
elements that permit cloning of DNA fragments in E. coli as well as sequences required for its propagation in yeast.
EXPERIMENTAL FIGURE 6-15 A yeast genomic library can be constructed in a plasmid shuttle vector that can replicate in yeast and in E. coli. (a) Components of a typical plasmid shuttle vector for cloning Saccharomyces genes. The presence of a yeast replication origin (ARS) and a yeast centromere (CEN) allows stable replication and segregation in yeast. Also included is a yeast selectable marker such as URA3, which allows a ura3 mutant to grow on medium lacking uracil. Finally, the vector contains sequences for replication and selection in E. coli (ORI and ) and a polylinker for easy insertion of yeast DNA fragments. (b) Typical protocol for constructing a yeast genomic library. Partial digestion of total yeast genomic DNA with Sau3A is adjusted to generate fragments with an average size of ∼10 kb. The vector is prepared to accept the genomic fragments by digestion with BamHI, which produces the same sticky ends as Sau3A. Each transformed clone of E. coli that grows after selection for ampicillin resistance contains a single type of yeast DNA fragment. Description The illustration a, shows the shuttle vector that contains polylinker, O R I and a m p superscript r, C E N, A R S, and U R A 3. Illustration b, shows the experimental procedure for generating a genomic library in the following steps. 1. A shuttle vector is cut open at the polylinker by Bam H 1, shown as a ribbon circle with an open area. 2. Yeast genomic D N A containing genes of interest is partially digested with S a u 3 A, shown as 3 sections of ribbon with different colored bars on it 3. The yeast genomic D N A is ligated with the open shuttle vector plasmids, where each colored section is attached to its own plasmid circle. 4. The resultant recombinant shuttle vectors, each containing a new yeast gene, are inserted into E. coli by transformation; colonies grow on the agar plate. 5. The E. coli is cultured on ampicillin-containing agar media to screen bacteria that have not been transformed. 6. The plasmids are isolated and pooled from the one hundred thousand transformed E. coli colonies.
To increase the probability that all regions of the yeast genome will be successfully cloned and represented in the plasmid library, the genomic DNA is usually only partially digested to yield overlapping restriction fragments of ∼10 kb. These fragments are then ligated into a shuttle vector in which the polylinker has been cleaved with a restriction enzyme that produces sticky ends complementary to those on the yeast DNA fragments (Figure 6-15b). Because the 10-kb restriction fragments of yeast DNA are incorporated into the shuttle vectors randomly, at least E. coli colonies, each containing a particular recombinant shuttle vector, are necessary to ensure that each region of yeast DNA has a high probability of being represented in the library at least once.
Figure 6-16 outlines how such a yeast genomic library can be screened to isolate the wild-type gene corresponding to one of the temperaturesensitive cdc mutations mentioned earlier in this chapter. The starting yeast strain is a double mutant that requires uracil for growth due to a mutation and is temperature sensitive due to a cdc28 mutation identified by its phenotype (see Figure 6-6b). Recombinant plasmids isolated from the yeast genomic library are mixed with yeast cells under conditions that promote transformation of the cells with foreign DNA. Since transformed yeast cells carry a plasmid-borne copy of the wild-type URA3 gene, they can be selected by their ability to grow in the absence of uracil. Typically, about 20 petri dishes, each containing about 500 yeast transformants, are sufficient to represent the entire yeast genome. This collection of yeast transformants can be maintained at 23 °C, a temperature permissive for growth of the cdc28 mutant. The entire collection on 20 plates is then transferred to replica plates, which are
maintained at 36 °C, a nonpermissive temperature for cdc mutants. Yeast colonies that carry recombinant plasmids expressing a wild-type copy of the CDC28 gene will be able to grow at 36 °C. Once temperature-resistant yeast colonies have been identified, plasmid DNA can be extracted from the cultured yeast cells and analyzed by DNA sequencing, a topic we take up shortly. EXPERIMENTAL FIGURE 6-16 Screening of a yeast genomic library by functional complementation can identify clones carrying the normal form of a mutant yeast gene. In this example, a wild-type CDC28 gene is isolated by complementation of a temperaturesensitive cdc28 yeast mutant. The yeast genomic library prepared as shown in Figure 6-15 is transformed into a , temperature-sensitive cdc mutant strain. The relatively few transformed yeast cells, which contain recombinant plasmid DNA, can grow in the absence of uracil at 23 °C. When these colonies are replica-plated and incubated at 36 °C (a nonpermissive temperature), only clones carrying a library plasmid that contains the wildtype copy of the CDC gene will survive. LiOAC = lithium acetate; PEG = polyethylene glycol.
cDNA Libraries Represent the Sequences of Protein-Coding Genes
Description Illustration starts with a flask at 23 degrees Celsius with pink liquid representing the yeast collection. A downward arrow points to a Petri dish in which the pink liquid is used as well as the library of yeast genomic DNA (pictured as 4 ribbon circles each with a different colored area at the top). An arrow to the right shows a Petri dish with fewer colonies on it. A yeast genomic library can be screened by functional complementation. The process is summarizes as follows: 1. Temperature sensitive c d c-mutant yeast missing the U R A 3 gene, meaning that they require uracil for growth, and combined with a library of yeast genomic D N A plasmids carrying the U R A 3 marker. 2. The yeast is transformed by treatment with lithium acetate, poly (ethylene) glycol, and heat shock. 3. The yeast cells are transferred to an agar plate. The medium lacks uracil. 4. The plate is incubated at a permissive temperature, and only yeast colonies carrying U R A 3, which was inserted into the recombinant plasmid, can grow. 5. A replica-plate is prepared and incubated at a non-permissive temperature. As a result, only colonies carrying the wild-type c d c gene grow. cDNA Libraries Represent the Sequences of Protein-Coding Genes Genomic libraries are ideal for representing the genetic content of relatively simple organisms such as bacteria or yeast, but present certain experimental difficulties for higher eukaryotes. First, the genes of eukaryotes usually contain extensive intron sequences and can therefore be too large to be inserted intact into plasmid vectors. Within a genomic
library, the sequences of individual genes are often broken apart and carried in more than one clone. Moreover, the presence of introns and long intergenic regions in genomic DNA often makes it difficult to identify the important parts of a gene that actually encode protein sequences. For example, only about 1.5 percent of the human genome actually represents protein-coding gene sequences. Thus for many studies, cellular mRNAs, which lack the noncoding regions present in genomic DNA, are a more useful starting material for generating a DNA library. In this approach, DNA copies of mRNAs, called complementary DNAs (cDNAs), are synthesized and cloned into plasmid vectors. A large collection of the resulting cDNA clones, representing all the mRNAs expressed in a cell type, is called a cDNA library. The first step in preparing a cDNA library is to isolate the total mRNA from the cell type or tissue of interest. Because of their poly(A) tails, mRNAs are easily separated from the much more prevalent rRNAs and tRNAs present in a cell extract by use of a matrix to which short strings of thymidylate (oligo-dTs) are linked. The crucial step for preparing cDNAs from cellular mRNAs is the synthesis of a DNA strand complementary to the mRNA. This synthesis is carried out by the enzyme reverse transcriptase, which is found in retroviruses, and is similar to DNA polymerase except that reverse transcriptase uses RNA as a template for synthesis of a complementary DNA strand. As with DNA polymerase, DNA synthesis by reverse transcriptase requires a DNA primer. For cDNA synthesis, oligo-dT can efficiently base-pair with the poly(A) tails of mRNAs and serve as a primer for synthesis of a complementary DNA strand (Figure 6-17). In several steps, the resulting cDNA-mRNA hybrid
molecules are converted into double-stranded cDNA molecules and DNA sequences are appended onto the ends of the cDNA to enable cloning into an appropriate vector. Figure 6-17 outlines one of the many possible procedures for generating a cDNA library inserted into a plasmid vector.
FIGURE 6-17 Generation and cloning of a cDNA copy of an mRNA. A mixture of mRNAs is the starting point for preparing recombinant plasmid clones, each containing a unique cDNA. The enzyme reverse transcriptase is used to synthesize a strand of DNA complementary to each mRNA molecule, starting from an oligo-dT primer (steps 1 and
2 ). The resulting cDNA-mRNA hybrid molecules are converted in several steps into double-stranded cDNA molecules corresponding to all the mRNA molecules in the original preparation (steps 3 – 5 ). Each double-stranded cDNA contains an oligo-dC⋅oligo-dG double-stranded region at one end and an oligo-dT⋅oligo-dA double-stranded region at the other end. Methylation of the cDNA protects it from subsequent restriction enzyme cleavage (step 6 ). To prepare double-stranded cDNAs for cloning, short double-stranded DNA molecules containing the recognition site for a particular restriction enzyme (called linkers) are ligated to both ends of the cDNAs using DNA ligase from bacteriophage T4 (step 7 ). As noted earlier, this ligase can join blunt-ended, double-stranded DNA molecules lacking sticky ends. The resulting molecules are then treated with the restriction enzyme specific for the attached linker, generating cDNA molecules with sticky ends (step 8a ). In a separate procedure, plasmid DNA is treated with the same restriction enzyme to produce the appropriate sticky ends (step 8b ). The plasmid vector and the collection of cDNAs, all containing complementary sticky ends, are then mixed and joined covalently by DNA ligase (step 9 ). The resulting DNA molecules are introduced into E. coli cells to generate individual clones; each clone carries a cDNA derived from a single mRNA. Description The following steps are used in the preparation of a c D N A library. 1. m R N A is hybridized with an oligo-d T primer. 2. The R N A is reverse transcribed into c D N A. 3. The R N A is removed with an alkali and a poly (d G) tail is added, resulting in single-stranded c D N A. 4. The single-stranded c D N A is hybridized with an oligo-d C primer. 5. The complementary strand is synthesized. 6. The c D N A is protected by selective methylation at E co R 1 sites. 7. The c D N A is ligated to E co R 1 site linkers.
The Polymerase Chain Reaction Amplifies a Specific DNA Sequence from a Complex Mixture
8. E co R 1 cleaves the linkers, leaving sticky ends. 9. The D N A is ligated to an open plasmid vector with complementary sticky ends. 10. E coli bacteria are transformed by the plasmid vector. The bacteria are incubated on an ampicillin-containing agar plate to select the transformed bacteria. Only expressed gene sequences are represented in cDNA libraries, and screening cDNA libraries can be a highly efficient means to identify genes of interest in large complex genomes, such as those of mammals. However, there are two technical limitations to the utility of cDNA libraries. The first is that because of the inherent instability of RNA molecules full-length mRNAs may be partially degraded before the cDNA strand is synthesized. The longer the mRNA, the more likely that some degradation will occur; for very long mRNAs it is unlikely that the cDNA will include the end of the mRNA sequence. The second limitation is due to different genes being transcribed at very different rates. Because of this, cDNA clones corresponding to abundantly transcribed genes will be represented many times in a cDNA library, whereas cDNAs corresponding to infrequently transcribed genes will be extremely rare or not present at all. To have a reasonable chance of including clones corresponding to slowly transcribed genes, mammalian cDNA libraries must contain – individual recombinant clones. The Polymerase Chain Reaction Amplifies a Specific DNA Sequence
from a Complex Mixture If the nucleotide sequences at the ends of a particular DNA region are known, the intervening fragment can be amplified directly by the polymerase chain reaction (PCR). Here we describe the basic PCR technique and three situations in which it is used. The PCR depends on the ability to alternately denature (melt) doublestranded DNA molecules and hybridize complementary single strands in a controlled fashion. As outlined in Figure 6-18, a typical PCR procedure begins with heat-denaturation of a DNA sample into single strands at 95 °C. Next two synthetic oligonucleotides complementary to the ends of the DNA segment of interest (the target sequence) are added in great excess to the denatured DNA, and the temperature is lowered to 50–60 °C. These specific oligonucleotides, which are present at a very high concentration, hybridize to their complementary sequences in the DNA sample, whereas the long strands of the sample DNA remain apart because of their comparatively low concentration. The hybridized oligonucleotides then serve as primers for DNA chain synthesis in the presence of deoxynucleotides (dNTPs) and a temperature-resistant DNA polymerase such as that from Thermus aquaticus, a bacterium that lives in hot springs. This enzyme, called Taq polymerase, can remain active even after being heated to 95 °C and can extend the primers at temperatures up to 72 °C. When synthesis is complete, the whole mixture is reheated to 95 °C to denature the newly formed DNA duplexes. After the temperature is lowered again, another cycle of synthesis takes place because excess
primer is still present. Repeated cycles of denaturation (heating) followed by hybridization and synthesis (cooling) quickly amplify the sequence of interest. At each cycle, the number of copies of the sequence between the primer sites is doubled; therefore, the target sequence increases exponentially — about 1-million-fold after 20 cycles — whereas all other sequences in the original DNA sample remain unamplified.
FIGURE 6-18 The polymerase chain reaction (PCR) is widely used to amplify DNA regions with known flanking sequences. To amplify a specific region of DNA, an investigator chemically synthesizes two different oligonucleotide primers complementary to sequences of approximately 18 bases flanking the region of interest (shown here as light blue and dark blue bars). The complete reaction is composed of a complex mixture of double-stranded DNA (usually genomic DNA containing the target sequence of interest), a stoichiometric excess of both primers, the four dNTPs, and a heat-stable DNA polymerase known as Taq polymerase. During each PCR cycle, the reaction mixture is first heated to separate the strands and then cooled to allow the primers to bind to complementary sequences flanking the region to be amplified. Taq polymerase then extends each primer from its end, generating newly synthesized strands that extend in the direction to the end of the template strand. During the third cycle, two double-stranded DNA molecules are generated equal in length to the sequence of the region to be amplified. In each successive cycle, the target sequence, which anneals to the primers, is duplicated, so it eventually vastly outnumbers all other DNA sequences in the reaction mixture. Successive PCR cycles can be automated by cycling the reaction at timed intervals between a high temperature for DNA melting and a lower temperature for the annealing and elongation parts of the cycle. A reaction that cycles 20 times will amplify the specific target sequence 1-million-fold. Description The steps are labeled cycles and cycles 1, 2, 3 are detailed with 4, 5, 6, etc. added at the end. The polymerase chain reaction is carried out in multiple steps, as follows. 1. A D N A sequence is denatured. 2. Primers corresponding regions that flank the sequence of interest are prepared. These base pair with the D N A. 3. The primers are elongated. 4. The newly synthesized D N A is denatured, and primers are annealed. 5. This sequence of primer annealing and denaturing is repeated until the D N A has been amplified sufficiently.
Direct Isolation of a Specific Segment of Genomic DNA For organisms in which all or most of the genome has been sequenced, PCR amplification starting with the total genomic DNA is often the easiest way to obtain a specific DNA region of interest for cloning. In this application of the PCR, the two oligonucleotide primers are designed to hybridize to sequences flanking the genomic region of interest and to include sequences that are recognized by specific restriction enzymes (Figure 6-19). For an oligonucleotide to be useful as a PCR primer, it must be long enough for its sequence to occur uniquely in the genome. For most purposes, this condition is satisfied by oligonucleotides containing about 20 nucleotides. Any given 20-nucleotide sequence occurs once in every nucleotides by chance, so it is usually possible to identify two specific 20-nucleotide sequences flanking the target sequence that each occur only once in the genome.
EXPERIMENTAL FIGURE 6-19 A specific target sequence in genomic DNA can be amplified by PCR for use in cloning. Each primer for PCR is complementary to one end of the target sequence and includes the recognition site for a restriction enzyme that does not have a recognition site within the target region. In this example, primer 1 contains a BamHI recognition sequence, whereas primer 2 contains a HindIII recognition sequence. (Note that for clarity, in any round, amplification of only one of the two strands — the one in brackets — is shown.) After amplification, the target segments are treated with appropriate restriction enzymes, generating fragments with sticky ends. These fragments can be incorporated into complementary plasmid vectors and cloned in E. coli by the usual procedure (see Figure 614). Description The bar models go through 3 rounds of amplification before the strand is attached to the vector. A D N A region to be amplified for P C R is depicted schematically. 1. A primer is added to one strand and the primer is elongated. The first primer contains a Bam H 1 recognition sequence which is made of G G A T C C bases. 2. The D N A is then denatured, and another primer is added. This time, the primer contains a Hind 3 recognition sequence which is made of T T C G A A bases. 3. The D N A is denatured again, another primer containing a Bam H 1 sequence is added, and the D N A is elongated. 4. This sequence continues for around 20 P C R cycles. Then, the amplified D N A containing the restriction enzyme recognition sequences is cut using restriction enzymes. 5. The resulting D N A fragments with sticky ends are inserted into a plasmid vector. After amplification of the target sequence for about 20 PCR cycles, the primers are cleaved with the appropriate restriction enzymes, producing fragments with sticky ends containing the target sequence. Each fragment is then ligated to a plasmid vector whose polylinker has been cleaved by
the same restriction enzymes. The resulting recombinant plasmids, all carrying the identical genomic DNA segment, can then be cloned in E. coli cells. With certain refinements of the PCR, even DNA segments greater than 10 kb in length can be amplified and cloned in this way. Note that this method does not require the cloning of large numbers of restriction fragments derived from genomic DNA and their subsequent screening to identify the specific fragment of interest. In effect, the PCR method inverts this traditional approach and so avoids its most tedious aspects. The PCR method is useful for isolating gene sequences to be manipulated in a variety of useful ways described later. In addition, the PCR method can be used to isolate gene sequences from mutant organisms to determine how they differ from the wild type. A variation on the PCR method is used to amplify a specific cDNA sequence made from cellular mRNAs. This method, known as reverse transcriptase–PCR (RT-PCR), begins with the same procedure described previously for isolation of cDNA from a collection of cellular mRNAs (see Figure 6-17). Typically, an oligo-dT primer, which hybridizes to the poly(A) tail of the mRNA, is used as the primer for the first strand of cDNA synthesis by reverse transcriptase. A specific cDNA can then be isolated from this complex mixture of cDNAs by PCR amplification using two oligonucleotide primers designed to match sequences at the and ends of the corresponding mRNA. As described previously, these primers can be designed to include restriction sites that make it possible to insert the amplified cDNA into a suitable plasmid vector.
Cloned DNA Molecules Can Be Sequenced Rapidly by Methods Based on PCR
RT-PCR can be performed so that the starting amount of a particular cellular mRNA can be determined accurately. To carry out quantitative RTPCR, the amount of double-stranded DNA sequence produced by each amplification cycle is determined as the amplification of a particular mRNA sequence proceeds. By extrapolation from these amounts, an estimate of the starting amount of the mRNA sequence can be obtained. Such quantitative RT-PCR analyses carried out on tissues or whole organisms using primers targeted to genes of interest provide one of the most accurate means to follow changes in gene expression. Cloned DNA Molecules Can Be Sequenced Rapidly by Methods Based on PCR A cloned DNA fragment is only completely characterized when its nucleotide sequence is known. The technology used to determine the sequence of a DNA segment represents one of the most rapidly developing fields in molecular biology. In the 1970s, Frederick Sanger and his colleagues developed the chain-termination procedure, which served as the basis for most DNA-sequencing methods for the next 30 years. This method is based on the selective incorporation of chain-terminating dideoxynucleotides into the daughter strands synthesized from the DNA fragment to be sequenced. Daughter-strand lengths from reactions containing each one of the four possible nucleotides provide the readout. Separation of the truncated daughter strands by gel electrophoresis, which can resolve strands that differ in length by a single nucleotide, can then
reveal the lengths of all strands. From these collections of strands of different lengths, the nucleotide sequence of the original DNA fragment can be established. The Sanger method has undergone many refinements and can now be fully automated, but because each DNA fragment of a few hundred nucleotides requires a separate, individual sequencing reaction, the overall rate at which new DNA sequences can be produced by this method is limited by the total number of reactions that can be performed at one time. A breakthrough in sequencing technology occurred when methods were devised to allow a single sequencing instrument to carry out millions of sequencing reactions simultaneously. These sequencing methods localize the millions of reactions per square centimeter in tiny clusters on the surface of a solid substratum. In 2007, when these so-called next generation sequencers became commercially available, the capacity for new sequence production increased enormously, and since then, because of improvements in the technology, it has been further increasing at an amazing pace — doubling every few months. In one popular sequencing method, billions of different DNA fragments to be sequenced are prepared by ligating double-stranded linkers to their ends (Figure 6-20). Next the DNA fragments are amplified by PCR using primers that match the linker sequences. This reaction differs from the standard PCR amplification shown in Figure 6-19 in that the primers used are covalently attached to a solid substratum. Thus as the PCR amplification proceeds, one end of each daughter DNA strand is covalently linked to the substratum, and at the end of the amplification about a thousand identical PCR products are linked to the surface in a tight cluster.
EXPERIMENTAL FIGURE 6-20 Generation of clusters of identical DNA fragments attached to a solid support. A large collection of DNA fragments to be sequenced is ligated to double-stranded linkers, which become attached to each end of each fragment. The DNA is then amplified by PCR using primers matching the sequences of the linkers and that are covalently attached to a solid substratum. Ten cycles of amplification yield about a thousand identical copies of each DNA fragment localized in a small cluster and attached at
both ends to the solid substratum. These reactions are optimized to produce as many as discrete, nonoverlapping clusters that are ready to be sequenced. Description The illustration shows the process of attachment of D N A on a solid support in seven steps. 1. Linkers are ligated to a D N A sequence of interest. 2. The D N A is denatured and the primers are annealed to attach the D N A sequence to primers linked to a solid substrate. 3. D N A synthesis occurs. 4. A D N A strand is now covalently attached to the primer that is linked to the substrate. The D N A is denatured and the substrate is washed. The original strand of D N A is removed during this process. 5. Another cycle of annealing leads the free end of the D N A strand to become attached to a primer on the substrate, forming an arc-like strand. 6. D N A synthesis occurs. 7. Ten or more rounds of P C R are carried out, yielding thousands of copies of each D N A fragment. These clusters can then be sequenced by using a special microscope to image fluorescently labeled deoxyribonucleotide triphosphates (dNTPs) as they are incorporated by DNA polymerase one at a time into a growing DNA chain (Figure 6-21). First, one strand is cut and washed out, leaving a single-stranded DNA template. Then sequencing is carried out on the thousand or so identical templates in each cluster, one nucleotide at a time. All four dNTPs are fluorescently labeled and added to the sequencing reaction. After they are allowed to anneal, the substratum is
imaged and the color of each cluster is recorded. Next the fluorescent tag is chemically removed and a new dNTP is allowed to bind. This cycle is repeated about a hundred times, resulting in billions of hundrednucleotide-long sequences. The entire procedure may take about one day and yield some bases of sequence information. EXPERIMENTAL FIGURE 6-21 Using fluorescently-tagged precursors for highthroughput sequence determination. (a) The reaction begins with the cleaving of one strand of the amplified, clustered DNA (see Figure 6-20). After denaturation, a single DNA strand remains attached to the substratum. A synthetic oligodeoxynucleotide is used as the primer for the polymerization reaction, which also contains dNTPs, each fluorescently tagged with a different color. The fluorescent tag is designed to block the OH group on the dNTP so that once the fluorescent dNTP has been incorporated, further elongation is not possible. Because DNA polymerase will incorporate the same fluorescently labeled dNTP into each of the thousand or so identical DNA copies in a cluster, the entire cluster will be uniformly labeled with the same fluorescent color, which can be imaged in a special microscope. (b) Five images from the same field of view, each corresponding to an individual cycle of dNTP addition. Each colored dot represents a cluster of identical DNA fragments. After each image is made, the fluorescent tags are removed by a chemical
reaction that leaves a new primer terminus available for the next cycle of dNTP addition. As can be seen for the circled colored dot, the color changes in each reaction cycle according to which nucleotide is added to the DNA fragments (from the five panels the sequence of the circled fragment would be read: A-C-C-T-T). A typical sequencing reaction may carry out a hundred cycles of NTP addition, allowing a hundred bases of sequence for each cluster to be determined. Thus a total sequencing reaction of this type may generate as much as bases of sequence information in about two days. [Part (b) A. Loehr and A. W. Zaranek for the Harvard Personal Genome Project.] Description A micrograph sequence of five panels shows fluorescence imaging. One colored spot is highlighted in each frame. In each frame, the color is different, the color changes correspond to the different base pairs. The process of adding fluorescent tags to D N A clusters is illustrated by the following points. 1. A D N A strand anchored at both ends by primers attached to a substrate is cut, denatured, and washed leaving a single strand. (Shows upside-down U shape being cut and straightened) 2. A new primer is added to the single stranded D N A strand, followed by the introduction of fluorescently labeled d N T P’s. Only one fluorescent tag links to the D N A. (in the illustration, 4 bases are highlighted: C T A G, each with its own color.) 3. Fluorescence imaging is carried out to determine the bound d N T P. 4. The fluorescent-tagged to the D N A strand is chemically removed and washed. The process, from step 2 onwards is repeated until the sequence is determined. In order to sequence a long, continuous region of genomic DNA, or even the entire genome of an organism, researchers usually employ one of the strategies outlined in Figure 6-22. The first method requires the isolation of a collection of cloned DNA fragments whose sequences overlap. Once the sequence of one of these fragments is determined, oligonucleotides
based on that sequence can be chemically synthesized for use as primers in sequencing the adjacent overlapping fragments. In this way, the sequence of a long stretch of DNA is determined incrementally by sequencing of the overlapping, cloned DNA fragments that compose it. A second method, which is called whole genome shotgun sequencing, bypasses the timeconsuming step of isolating an ordered collection of DNA segments that span the genome. This method involves simply sequencing random clones from a genomic library. A sufficient number of clones are chosen for sequencing so that on average, each segment of the genome is sequenced about 10 times. This degree of coverage ensures that each segment of the genome is sequenced more than once. The entire genomic sequence is then assembled using a computer algorithm that aligns all the segments using their regions of overlap. Whole genome shotgun sequencing is the fastest and most cost-effective method for sequencing long stretches of DNA, and most genomes, including the human genome, have been sequenced by this method.
EXPERIMENTAL FIGURE 6-22 Two strategies for assembling whole genome sequences. One method (left) depends on isolating and assembling a set of cloned DNA fragments that span the genome. This can be done by matching cloned fragments by
hybridization or by alignment of restriction-site maps. The DNA sequence of the ordered clones can then be assembled into a complete genomic sequence. The alternative method (right) depends on the relative ease of automated DNA sequencing and bypasses the laborious step of ordering a DNA library. By sequencing enough random clones from the library so that each segment of the genome is represented from 3 to 10 times, it is possible to reconstruct the genomic sequence by computer alignment of the very large number of sequence fragments. Description The illustration shows the genomes as small-multicolored bars. Both start with an unknown genome of interest and finish with the determined genomic sequence. The first process contains the following steps: 1. Create an aligned library of c D N A. 2. Sequence ordered fragments. 3. Read sequence in order dictated by clone map. 4. A genomic sequence formed. The second process contains the following steps. 1. Create a random library of c D N A. 2. Sequence unordered fragments. 3. Align sequenced clones by computer. 4. A genomic sequence formed. KEY CONCEPTS OF SECTION 6.2 DNA Cloning and Characterization In DNA cloning, recombinant DNA molecules are formed in vitro by inserting DNA fragments into vector DNA molecules. The recombinant DNA molecules are then
introduced into host cells, where they replicate, producing large numbers of recombinant DNA molecules. Restriction enzymes (endonucleases) typically cut DNA at specific 4–8-bp palindromic sequences, producing defined fragments that often have selfcomplementary, single-stranded tails (sticky ends). Two restriction fragments with complementary ends can be joined with DNA ligase to form a recombinant DNA molecule (see Figure 6-12). E. coli cloning vectors are small circular DNA molecules (plasmids) that include three functional regions: a replication origin, a selectable marker gene, and a site where a DNA fragment can be inserted. Transformed cells carrying a vector grow into colonies on the selection medium (see Figure 6-14). A genomic library is a set of clones carrying restriction fragments produced by cleavage of the entire genome. Shuttle vectors that can replicate in both yeast and E. coli can be used to construct a yeast genomic library. Specific genes can be isolated by their ability to complement the corresponding mutant genes in yeast cells (see Figure 6-16). In cDNA cloning, expressed mRNAs are reverse-transcribed into complementary DNAs, or cDNAs. A cDNA library is a set of cDNA clones prepared from the mRNAs isolated from a particular type of cell or tissue (see Figure 6-17). The polymerase chain reaction (PCR) permits exponential amplification of a specific segment of DNA from a single initial template DNA molecule if the sequence flanking the DNA region to be amplified is known (see Figure 6-19). PCR is a highly versatile method that can be programmed to amplify a specific genomic DNA sequence, a cDNA, or a sequence at the junction between a DNA transposon and flanking chromosomal sequences. DNA fragments up to about 100 nucleotides long can be sequenced by generating clusters of identical fragments by PCR and imaging fluorescently labeled nucleotide precursors incorporated by DNA polymerase (see Figures 6-20 and 6-21). Whole genome sequences can be assembled from the sequences of a large number of overlapping clones from a genomic library (see Figure 6-22).
6.3 Using Sequence Information to Identify Genes and Deduce Their Function
6.3 Using Sequence Information to Identify Genes and Deduce Their Function By using automated DNA-sequencing techniques and computer algorithms to piece together sequence data, researchers have determined vast amounts of DNA sequence, including nearly the entire genomic sequence of humans and of many experimental organisms. By now, the genomic sequences have been completely determined for all of the major model organisms and thousands of viruses, bacteria, archea, and eukaryotes including representatives of all of the 35 or so metazoan phyla. The genome sequence of an organism contains the information that specifies the sequence of all of its protein and RNA components. In addition, regulatory sequences in the genome specify when and where each of these proteins or RNA molecules is expressed. Thus it should be possible, at least in principle, to learn almost all there is to know about an organism — what it is, how it functions, and how it evolved — from a properly informed reading of its genomic sequence. Useful biological information is extracted from sequence data, largely by computers that search for meaningful patterns in sequence data by comparing one sequence to another. The effort to extract biological information from genomes has led to the emergence of an enormously powerful new field of biology: bioinformatics.
Most Genes Can Be Readily Identified Within Genomic DNA Sequences
Although this field depends upon the highly technical application of advanced computer algorithms, the fundamental principle underlying all of bioinformatics is not complicated. Bioinformatic reasoning is based on the understanding that life on earth arose only once and all genome sequences, either existing or extinct, are derived from this single common ancestor through a continual process of random mutation and natural selection. Thus, any substantial similarity between two sequences from different species can be attributed to one of two causes. Either the organisms are closely related such that not enough time has passed for random differences to have accumulated by mutation, or the sequence is constrained to perform some important function and so mutational variations have been systematically weeded out by natural selection. This latter case is known as conservation, and we would say that a sequence is conserved if it has remained substantially unchanged in organisms that are evolutionarily so far apart that most sequences have lost recognizable similarity due to random mutations. Most bioinformatics reasoning rests on the following overarching concept: the more a sequence shows conservation among distantly related organisms, the more important its function is likely to be. In this section, we first show how protein coding genes are identified in genomic sequences. Next we examine how functional and evolutionary relationships between proteins are studied. Finally, we explore the relationship between the complexity of an organism and the number of protein-coding genes that it contains.
Most Genes Can Be Readily Identified Within Genomic DNA Sequences The complete genomic sequence of an organism contains within it the information needed to deduce the sequence of every protein made by the cells of that organism. Different strategies are used to deduce protein sequences for prokaryotes and eukaryotes. In the genomes of prokaryotes, the protein-coding sequences are continuous reading frames that are not broken up by introns. Thus for prokaryotes the vast majority of proteincoding sequences can be found simply by scanning the genomic sequence for open reading frames (ORFs) of significant length. An ORF is defined as a continuous sequence of triplet codons that does not contain a stop codon. ORFs that are never translated into amino acids may appear by random chance. How many codons must an ORF contain for us to be sure that it is part of a gene? This number can be calculated by utilizing the probability that a run of non-stop codons has occurred by chance. The probability of a non-stop codon in a random sequence is 61/64, which is simply the fraction of the 64 possible triplet codons that are not stop codons. Thus the probability of a random sequence containing an ORF of greater than n codons is , which is the joint probability of not encountering a stop codon n times in a row. Taking the average length of a prokaryotic protein to be about 300 amino acids, the calculated probability of an ORF greater than this length arising by chance is only , and it is unlikely that even one ORF of this length would occur in an entire
bacterial genomic sequence of base pairs. In practice, prokaryotic genes can be reliably found by simply searching for ORFs greater than about 100 codons. ORF analysis correctly identifies more than 90 percent of the genes in bacteria and in eukaryotes such as S. cerevisiae that have few introns. Some of the very shortest genes, however, are missed by this method, and occasionally long open reading frames that are not actually genes do arise by chance. Both types of misassignments can be corrected by more sophisticated analysis of the sequence and by genetic tests for gene function. Of the genes identified in this manner, about half were already known by some functional criterion such as mutant phenotype. Some of the proteins encoded by the remaining putative genes identified by ORF analysis have been assigned functions based on their sequence similarity to known proteins in other organisms. More sophisticated algorithms are required to identify genes in organisms with a more complex genome structure. Scanning for ORFs is a poor method for finding genes in higher eukaryotes because the coding sequences of most genes are broken up by multiple noncoding introns (humans have an average of 9 introns per gene), and the relatively short ORFs derived from exons are not easily distinguished from the many short ORFs that arise in the genome by chance. In a typical gene-sized segment of genomic DNA, more than a thousand fortuitous ORFs greater in length than the average exon would be expected. A much more reliable way to find eukaryotic genes is to consider the possible encoded amino acid sequences, not just the presence of an ORF. One way to do this is to have a
computer generate a list of all of the thousands of peptide sequences produced by hypothetical translation of all ORFs of any length with a specific genome sequence. Each of these peptide sequences would then be compared to the entire database of protein sequences to look for significant matches to a known protein family. Finding multiple short ORFs from the same region of DNA that show similarity to sequential segments of a single known protein would provide strong evidence that the set of ORFs is the set of exons for a single human gene. The best gene-finding algorithms combine all the available data that might suggest the presence of a gene at a particular genomic site. Relevant data include alignment of the sequence under examination to a full-length cDNA sequence; alignment to a partial cDNA sequence, generally 200– 400 bp in length, known as an expressed sequence tag (EST); fitting to models for exon, intron, and splice-site sequences; and similarity to gene sequences from other organisms. Using these computer-based bioinformatic methods, computational biologists have identified approximately 21,000 protein-coding genes in the human genome. A particularly powerful method for identifying human genes is to compare the human genomic sequence with that of other mammals, particularly the mouse. Humans and mice are sufficiently related to have most genes in common, although largely nonfunctional DNA sequences, such as introns and the regions between genes, tend to be very different because these sequences are not under strong selective pressure. In addition to conserved coding sequences of exons, the segments of the human and mouse genome that are important for gene structure and function, such as intron splice
Bioinformatic Principles Can Be Used to Deduce the Likely Functional Consequences of Mutations
sites or transcription-control regions, can be identified because these sequences tend to be conserved. Bioinformatic Principles Can Be Used to Deduce the Likely Functional Consequences of Mutations Once a gene has been identified, comparison of a mutant gene sequence with that of wild type can be used to deduce the likely effect of the mutation on the gene product. Mutations that alter the coding sequence of a gene usually provide the most insight into function of the expressed protein. The most severe types of mutations introduce a premature stop codon (nonsense mutations) or change the reading frame of a gene by the addition or deletion of bases (frameshift mutations). Nonsense mutations and frameshift mutations almost always cause a complete loss of gene function and are therefore often referred to as null alleles. Point mutations that result in substitution of one amino acid for another (missense mutations) can have dramatic effects on gene function or they can have no effect at all, and the principle of conservation of the functionally important parts of a gene can contribute to an educated guess as to the severity of the effect of a missense mutation. For example, a missense mutation that changed a highly conserved amino acid residue to a chemically dissimilar residue would likely have a large effect on protein function, whereas a change in a non-conserved position would likely have a mild effect or no effect at all. A point mutation that changes a codon to a different codon that codes for the same amino acid will almost never have
The Function and Evolutionary Origins of Genes and Proteins Can Be Deduced from Their Sequence
an effect on gene function and is therefore considered to be a silent mutation. In higher eukaryotes, point mutations outside the coding sequence of genes rarely have dramatic effects on phenotype. This is not because promoter sequences and sequences at splice sites are not important for gene function, but rather that the function of these cis-acting sequences is usually distributed redundantly among multiple nucleotide residues such that no single point mutation will have a large effect. The majority of point mutations outside gene-coding sequences that have observable effects on gene function interfere with pre-mRNA splicing, and these mutations often lie in highly conserved residues that are pivotal to selecting the proper pre-mRNA splice site. The Function and Evolutionary Origins of Genes and Proteins Can Be Deduced from Their Sequence As discussed in Chapter 3, proteins with similar functions often contain similar amino acid sequences that correspond to important functional domains in the three-dimensional structure of the proteins. By comparing the amino acid sequence of the protein encoded by a newly cloned gene with the sequences of proteins of known function, an investigator can look for sequence similarities that provide clues to the function of the encoded protein. Because of the degeneracy in the genetic code, related proteins invariably exhibit much more sequence conservation than the genes
encoding them. For this reason, protein sequences, rather than the corresponding DNA sequences, are usually compared. The most widely used computer program for this purpose is known as BLAST (basic local alignment search tool). The BLAST algorithm divides the protein sequence to be examined (known as the query sequence) into shorter segments and then searches the database for significant matches to any of the stored sequences. The matching program assigns a high score to identically matched amino acids and a lower score to matches between amino acids that are related (e.g., hydrophobic, polar, positively charged, negatively charged) but not identical. When a significant match is found for a segment, the BLAST algorithm searches locally to extend the region of similarity. After searching is completed, the program ranks the matches between the query protein and various known proteins according to their p-values. This parameter is a measure of the probability of finding such a degree of similarity between two protein sequences by chance. The lower the p-value, the greater the sequence similarity between two sequences. A p-value less than about is usually considered significant evidence that two proteins share a common ancestor. Many alternative computer programs have been developed that can detect relationships between proteins that are more distantly related to each other than can be detected by BLAST. The development of such methods is currently an active area of bioinformatics research. To illustrate the power of this sequence-comparison approach, let’s consider the human gene NF1. Mutations in NF1 are associated with the inherited disease neurofibromatosis 1, in which multiple tumors develop
in the peripheral nervous system, causing large protuberances in the skin. After a cDNA clone of NF1 was isolated and sequenced, the deduced sequence of the NF1 protein was checked against all other protein sequences in GenBank. A region of NF1 protein was discovered to have considerable homology to a portion of the yeast protein called Ira (Figure 6-23). Previous studies had shown that Ira is a GTPase-activating protein (GAP) that modulates the GTPase activity of the monomeric G protein called Ras (see Figure 3-35). Its homology with Ira suggested that NF1 also regulated Ras activity. As we examine in detail in Chapter 16, GAP and Ras proteins normally function to control cell replication and differentiation in response to signals from neighboring cells. Functional studies on the normal NF1 protein, obtained by expression of the cloned wild-type gene, showed that it did indeed regulate Ras activity. These findings suggest that patients with neurofibromatosis express a mutant NF1 protein in cells of the peripheral nervous system, leading to abnormally high signaling through Ras protein. The enhanced rate of signaling in turn leads to excessive cell division and formation of the tumors characteristic of the disease.
Biological Complexity of an Organism Is Not Directly Related to the Number of Protein-Coding Genes in the Genome
the α-tubulin genes in different species) are described as orthologous. From the degree of sequence relatedness of the tubulins present in different organisms today, evolutionary relationships can be deduced, as illustrated in Figure 6-24b. Of the three types of sequence relationships, orthologous sequences are the most likely to share the same function. Biological Complexity of an Organism Is Not Directly Related to the Number of Protein-Coding Genes in the Genome The combination of genomic sequencing and gene-finding computer algorithms has yielded the complete inventory of protein-coding genes for a variety of organisms. Figure 6-25 shows the total number of proteincoding genes in several eukaryotic genomes that have been completely sequenced. The functions of about half the proteins encoded in these genomes are known or have been predicted on the basis of sequence comparisons. One of the surprising features of this comparison is that the number of protein-coding genes within different organisms does not seem proportional to our intuitive sense of their biological complexity. For example, the roundworm C. elegans apparently has more genes than the fruit fly Drosophila, which has a much more complex body plan and more complex behavior. And humans have only about 5 percent more proteincoding genes than C. elegans. When it first became apparent that humans appeared to have only a slightly more comlex genome than the simple
roundworm, it was difficult to understand how such a small increase in the number of proteins could generate such a staggering difference in complexity.
FIGURE 6-25 Comparison of the number and types of proteins encoded in the genomes of different eukaryotes. For each organism, the area of the entire pie chart represents the total number of protein-coding genes, all shown at roughly the same scale. In most cases, the functions of the proteins encoded by about half the genes are still unknown (light blue). The functions of the remainder are known or have been predicted by sequence similarity to genes of known function. [Data from ENCODE Project Consortium, 2012, Nature 489:57; J. D. Hollister, 2014, Chromosome Res. 22:103; L. W. Hillier et al., 2005, Genome Res. 15:1651; FlyBase: FB2015_02 Release Notes, http://flybase.org/static_pages/docs/release_notes.html; Saccharomyces Genome Data Base 2015, http://www.yeastgenome.org/genomesnapshot.] Description Each pie chart shows the proportion of each different class of protein coded by the genes in one species. Each pie chart represents an organism and its genes. Each pie chart represents Homo sapiens (human), Arabidopsis thaliana (plant), Caenorhabditis elegans (roundworm), Drosophila melanogaster (fly), and Saccharomyces cerevisiae (yeast), respectively. Each species is labeled with an estimated amount of genes: 21,000, 27,000, 20,000, 13,000, and 5,800, respectively. The pie charts of all these organisms show that the functions of approximately half of the proteins coded by their genes are unknown. Approximately 15 percent of each pie chart represents genes coding for proteins involved in metabolism. The second and third largest portions represent transcription/translation and intracellular signaling. The remainder of the
charts show that the remaining genes code for proteins involved in DNA replication and modification, cell-to-cell communication, protein folding and degradation, transport, those with many functions, the cytoskeleton and cell structure, defense and immunity, and miscellaneous functions. Clearly simple quantitative differences in the number of protein-coding genes in the genomes of different organisms are inadequate for explaining differences in biological complexity. However, several phenomena can generate more complexity in the expressed proteins of higher eukaryotes than is predicted from their genomes. First, a particular gene can yield multiple functional mRNAs, and therefore multiple proteins, through alternative splicing of a pre-mRNA (see Chapter 9). In humans, the mean number of alternatively spliced mRNAs expressed per gene is about six. Second, variations in the post-translational modification of many proteins may produce functional differences. Finally, stable modifications to chromatin structure that are not evident in gene sequences can have large effects on gene expression in particular cell types (see Chapter 9). These so-called epigenetic effects can greatly contribute to biological complexity. Evolution of the increasing biological complexity of multicellular organisms probably required increasingly complex regulation of cell replication and temporal and spatial regulation of gene expression in the cells that make up the organisms, leading to increasing complexity of embryological development. Researchers still have not determined the specific functions of many genes and proteins identified by analysis of genomic sequences. As they unravel the functions of individual proteins in different organisms and further
detail their interactions with other proteins, the resulting advances will become immediately applicable to all homologous proteins in other organisms. No doubt, when the function of every protein is known, a more sophisticated understanding of the molecular basis of complex biological systems will emerge. KEY CONCEPTS OF SECTION 6.3 Using Sequence Information to Identify Genes and Deduce Their Function All species are derived from a common ancestor and have evolved by random mutation and natural selection. Sequence patterns that are conserved among distantly related species are likely to be functionally important and to have been maintained by natural selection. A fundamental principle of bioinformatics is that the more highly conserved a sequence is, the more important its function is likely to be. For organisms such as bacteria and yeast whose genes are not interrupted by introns, protein-coding genes can be identified by computer searching of the entire bacterial and yeast genomic sequences for open reading frames (ORFs). For most higher eukaryotes, which have relatively short coding exons separated by introns, methods other than ORF identification are required to reliably identify genes. These methods include reconstructing spliced genes from cDNA sequences, searching for similarities between hypothetical translation of ORFs and known protein sequences, and identifying conserved gene features such as intron-splice sites. The function of a protein that has not been isolated can often be predicted on the basis of similarity of its amino acid sequence (the query sequence) to the sequences of proteins of known function. A computer algorithm known as BLAST rapidly searches databases of known protein sequences to find those with significant similarity to a query protein. Proteins with common functional motifs, which can often be quite short, may not be identified in a typical BLAST search. Such short sequences may be located by searches of structural motif databases. A protein family comprises multiple proteins all derived from the same ancestral protein. The genes encoding these proteins, which constitute the corresponding gene family, arose by an initial gene-duplication event and subsequent divergence during speciation (see Figure 6-24).
Related genes and their encoded proteins expressed in one organism that derive from a gene duplication event are paralogous, such as the α- and β-tubulin proteins that combine to form an αβ dimer building block of the microtubule. Those that derive from mutations that accumulated during speciation are orthologous. Proteins that are orthologous usually have the same function in different organisms. Analysis of the complete genomic sequences of several different organisms indicates that biological complexity is not directly related to the number of protein-coding genes (see Figure 6-25).
6.4 Locating and Identifying Genes That Specify Human Traits
6.4 Locating and Identifying Genes That Specify Human Traits The function of human proteins and human genes is of primary interest to cell biologists. In many cases, cell biologists will study human genes that are orthologs of genes of known cell biological function that have been studied in model organisms because these orthologs are often genes with important cell biological functions in humans as well. However, in certain key cases human genes with important functions that were not identified in model organisms have been identified solely because mutations in these genes have an observable effect on human biology. Many of these genes have been identified because they cause, contribute to, or protect against human disease.
Table 6-1 lists several of the most commonly occurring inherited diseases. Although a “disease” gene may result from a new mutation that arose in the preceding generation, most cases of inherited diseases are caused by preexisting mutant alleles that have been passed from one generation to the next for many generations.
TABLE 6-1 • Common Inherited Human Diseases Disease Molecular and Cellular Defect Incidence Autosomal Recessive Sickle-cell disease Abnormal hemoglobin causes deformation of red blood cells, which can become lodged in 1/625 of sub-
capillaries; also confers resistance to malaria. Saharan African origin Cystic fibrosis Defective chloride channel (CFTR) in epithelial cells leads to excessive mucus in lungs. 1/2500 of European origin Phenylketonuria (PKU) Defective enzyme in phenylalanine metabolism (tyrosine hydroxylase) results in excess phenylalanine leading to mental retardation, unless restricted by diet. 1/10,000 of European origin Tay-Sachs disease Defective hexosaminidase enzyme leads to accumulation of excess sphingolipids in the lysosomes of neurons, impairing neural development. 1/1000 Ashkenazi Jews Autosomal Dominant Huntington’s disease Defective neural protein (huntingtin) may assemble into aggregates, causing damage to neural tissue. 1/10,000 of European origin Hypercholesterolemia Defective LDL receptor leads to excessive cholesterol in blood and early heart attacks. 1/250 French Canadians X-Linked Recessive Duchenne muscular dystrophy (DMD) Defective cytoskeletal protein (dystrophin) leads to impaired muscle function. 1/3500 males Hemophilia A Defective blood clotting factor VIII leads to uncontrolled bleeding. 1/5000 males
The typical first step in deciphering the underlying cause of any inherited human disease is to identify the affected gene and its encoded protein. Historically, researchers have used whatever phenotypic clues might be relevant to make guesses about the molecular basis of inherited diseases. An early example of successful guesswork was the hypothesis that sicklecell disease, known to be a disease of blood cells, might be caused by defective hemoglobin. This idea led to the identification of a specific amino acid substitution in hemoglobin that causes the defective hemoglobin molecules to polymerize. These polymers in turn cause the sickle-like deformation of red blood cells in individuals who have inherited two copies of the allele for sickle-cell hemoglobin. Most often, however, the genes responsible for inherited diseases must be found without any prior knowledge or reasonable hypotheses about the identity of the affected gene or its encoded protein. In this section, we see how human geneticists can find the gene responsible for an inherited disease by following the segregation of the disease in families. That is, geneticists trace which family members had the disease and which did not over the course of a few generations. They then look for genetic markers present in the DNA sequence that appear only in the family members with the disease. In other words, the segregation of the disease within the family can be correlated with the segregation of many other genetic markers. The location of the genetic markers, already known, eventually leads to identification of the chromosomal position of the affected gene. Using this information, along with knowledge of the sequence of the human genome, geneticists can ultimately pinpoint the affected gene and the disease-causing mutations.
Monogenic Diseases Show One of Three Patterns of Inheritance
Monogenic Diseases Show One of Three Patterns of Inheritance We have already seen that one of the most useful aspects of genetic analysis in model organisms is that the phenotype of a mutation along with knowledge of whether the mutation is genetically recessive or dominant enables biologists to deduce the function of the normal protein. Of course in humans the same types of test crosses that are used to determine dominance or recessiveness in model organisms cannot be applied. Nevertheless, researchers can determine whether a human trait is dominant or recessive by examining the pattern of inheritance of a trait in families or human populations. Thus determining the mode of inheritance along with identifying the gene or genes that are affected are the primary objectives of human genetic studies. Human genetic diseases that result from mutation in one specific gene, referred to as monogenic diseases, display different inheritance patterns depending on whether the alleles that cause them are dominant or recessive and whether they are located on an autosome or a sex chromosome. One characteristic pattern is that exhibited by a dominant allele in an autosome (i.e., one of the 22 human chromosomes that is not a sex chromosome). Because an autosomal dominant allele is expressed in the heterozygote, usually at least one of the parents of an affected individual will also have the disease. For example, in Huntington’s disease, which is autosomal dominant, if either parent carries a mutant HD
allele, each of his or her children (regardless of sex) has a 50 percent chance of inheriting the mutant allele and being affected (Figure 6-27a). What are the molecular mechanisms underlying dominance? Huntington’s disease, a neural degenerative disease, is caused by an expansion of the number of triplet CAG repeats in the coding sequence of a neuronal protein HTT. The mutant HTT protein that has an expanded number of glutamine residues has been shown to form protein aggregates. The fact that the mutant HD allele is inherited in a dominant fashion strongly implies that the symptoms of Huntington’s disease result from a gain in propensity of the mutant HTT protein to form aggregates and not because of a loss of the normal HTT protein function. Diseases such as Huntington’s disease caused by dominant alleles often strike in middle to late life, after reproductive age. If this were not the case, natural selection would have eliminated these alleles during human evolution. A recessive allele in an autosome exhibits quite a different segregation pattern. Both parents must be heterozygous carriers of an autosomal recessive allele in order for their children to be at risk of the disease. Each child of heterozygous parents has a 25 percent chance of receiving both recessive alleles and thus being affected; a 50 percent chance of receiving one normal and one mutant allele and thus being a carrier; and a 25 percent chance of receiving two normal alleles. Related individuals (e.g., first or second cousins) have a relatively high probability of being carriers for the same recessive alleles. Thus children born to related parents are much more likely than those born to unrelated parents to be homozygous for, and therefore affected by, a rare autosomal recessive disorder.
A clear example of an autosomal recessive disease is cystic fibrosis, which results from a defective chloride-channel gene known as CFTR (Figure 626b). The presence of this defect disturbs the balance of ions across the epithelial cell layers of the lungs and intestine. Because cystic fibrosis is a recessive disease, we may deduce that the effects of the disease are due to insufficient activity of the chloride channels in the epithelial cells.
FIGURE 6-26 Three common inheritance patterns for human monogenic diseases. Wild-type autosomes (A) and sex chromosomes (X and Y) are indicated by superscript plus
signs. (a) In an autosomal dominant disorder such as Huntington’s disease, only one mutant allele is needed to confer the disease. If either parent is heterozygous for the mutant HD allele, his or her children have a 50 percent chance of inheriting the mutant allele and getting the disease. (b) In an autosomal recessive disorder such as cystic fibrosis, two mutant alleles must be present to confer the disease. Both parents must be heterozygous carriers of the mutant CFTR allele for their children to be at risk of being affected or being carriers. (c) An X-linked recessive disease such as Duchenne muscular dystrophy is caused by a recessive mutation on the X chromosome and exhibits the typical sex-linked segregation pattern. Males born to mothers heterozygous for a mutant DMD allele have a 50 percent chance of inheriting the mutant allele and being affected. Females born to heterozygous mothers have a 50 percent chance of being carriers. Description Autosomal dominant Huntington's disease: A male with an allele for Huntington's disease and a normal allele (Big A superscript big H D and big A superscript plus) and a female with two normal alleles (Big A superscript plus and big A superscript plus) can have progeny, male or female, affected by Huntington's disease or not affected in equal proportion. The affected have (Big A superscript big H D and big A superscript plus) alleles. Autosomal recessive cystic fibrosis: A male and a female, both heterozygous carries of the recessive cystic fibrosis gene (Big A superscript big C F T R and big A superscript plus) have children. There is a 25 percent chance a child will be affected; that is, they will have two copies of the recessive allele, a 50 percent chance they will carry the cystic fibrosis allele, but they will not be affected by the disease, and a 25 percent chance that they will be a non-carrier with two normal versions of the allele. X-linked recessive Duchenne muscular dystrophy: A male with a normal big X superscript plus and big Y chromosome and a female carrying one copy of the Duchenne muscular dystrophy gene (Big X superscript big D M D and big X superscript plus) have children. Of male children, 50 percent will be affected. Of the woman, 50 percent will be carriers.
DNA Polymorphisms Are Used as Markers for Linkage Mapping of Human Mutations
The third common pattern of inheritance is that of an X-linked recessive allele. A recessive allele on the X chromosome will most often be expressed in males, who receive only one X chromosome from their mother, but not in females, who receive an X chromosome from both their mother and their father. The presence of an X-linked recessive allele leads to a distinctive sex-linked segregation pattern in which the disease is exhibited much more frequently in males than in females. For example, Duchenne muscular dystrophy (DMD), a muscle degenerative disease that specifically affects males, is caused by a recessive allele on the X chromosome. DMD exhibits the typical sex-linked segregation pattern in which mothers who are heterozygous, and therefore phenotypically normal, can act as carriers, transmitting the DMD allele, and therefore the disease, to 50 percent of their male progeny (Figure 6-26c). DNA Polymorphisms Are Used as Markers for Linkage Mapping of Human Mutations Once the mode of inheritance has been determined, the next step in finding a disease allele is to map its position with respect to known genetic markers. Genetic mapping studies rely on exchanges of genetic information that occur during meiosis. As shown in Figure 6-27a, genetic recombination takes place in germ cells after the chromosomes of each homologous pair have replicated, but before the first meiotic cell division. At this time, homologous DNA sequences on maternally and paternally
derived chromatids can be exchanged with each other in a process known as crossing over.
FIGURE 6-27 Recombination during meiosis can be used to map the positions of genes. (a) Consider the gametes produced by an individual that carries on one chromosome a dominant disease allele, designated D and linked SNP marker allele m1, and on the homologous chromosome the corresponding wild-type allele designated + and SNP marker m2. Because this arrangement of alleles is the same as in the parent of the individual these are known as parental types. If crossing over occurs within an interval between the disease gene and the SNP marker, then two recombinant types of gametes can be produced; one carries D and m2 and one carries + and m1. The closer the SNP marker is to the disease gene, the less likely that a recombination event between them will occur, and the rarer recombinant types will be. If the markers were on different chromosomes or far apart on the same chromosome they would segregate independently of one another and recombinant types would occur with equal frequency as parental types. Note that in meiosis of the human female, only one gamete is produced to form an egg cell. (b) Genetic mapping in humans involves scoring the genotypes of parents and offspring to determine the fraction of gametes that are recombinant types. For a cross to be informative, at least one of the parents must be heterozygous for both markers. In the example shown, the presence of the D allele in the gamete can be deduced from whether the child has the dominant trait and the presence of the m2 allele can be determined from the SNP genotype of the child. By scoring the gametes from many families in this way the genetic distance can be obtained by the
fraction of recombinant types. By convention, the unit of genetic distance is a centimorgan (cM), defined as the distance between two positions along a chromosome that results in 1 recombinant individual in 100 progeny. Positions that show about as many recombinant types as parental types are said to be unlinked. Description The illustration labeled a, shows two replicated chromosomes (4 n), small m 1 and big D of the first chromosome and the small m 2 and plus are labeled. They undergo synapsis and crossing over in the metaphase 1 stage, and further enter the anaphase 1 stage. The first and the second chromosomes each enter the anaphase 2 stage to yield two parental gametes; where one carries big D and small m 1 and the other carries plus and small m 2, two recombinant gametes; where one carries plus and small m 1 and the other carries big D and small m 2. At the end of the cross-over is the following sentence: Genetic distance in centimorgan is equal to 100 times the fraction of progeny that are recombinant. To see how genetic recombination during meiosis can be used as the basis of mapping the distances between genes, consider an individual with two different mutations, one inherited from each parent, that are located close to each other on the same chromosome. That individual can produce two different types of gametes according to whether a crossover occurs between the mutations during meiosis. If no crossover occurs between them, gametes known as parental types, which contain either one or the other mutation, will be produced. In contrast, if a crossover occurs between the two mutations, gametes known as recombinant types will be produced. In this example, recombinant chromosomes would contain either both mutations or neither one of them. Recombination events occur more or less at random along the length of chromosomes; thus the closer together two genes are, the less likely that recombination will happen to
occur between them during meiosis. Thus the less frequently recombination is observed to occur between two genes on the same chromosome, the closer together they must be. Two genes that are on the same chromosome and that are sufficiently close together that significantly fewer recombinant gametes than parental gametes are produced are considered to exhibit genetic linkage. If the number of recombinant gametes produced is not significantly less than the number of parental gametes, the two loci under consideration are considered to be unlinked and could be far apart on the same chromosome, or they could be on different chromosomes. We have seen that by setting up the appropriate crosses, genetic recombination can be used in many different kinds of model organisms to determine the distance between two genetic markers that lie on the same chromosome. To find the map position of a new mutation, a process known as genetic mapping, it is necessary to carry out multiple pair-wise crosses with genetic markers of known position that span the entire genome. In the experimental organisms commonly used in genetic studies, numerous markers with easily detectable phenotypes are available for genetic mapping of mutations. For humans, there are not nearly enough phenotypic markers to carry out genetic mapping studies. Instead, recombinant DNA technology has made available a wealth of useful DNAbased molecular markers. Because most of the human genome does not encode proteins, a large amount of phenotypically inconsequential sequence variation exists between individuals. Indeed, it has been estimated that nucleotide differences between unrelated individuals occur on an average of 1 of every nucleotides. Since variations in DNA
Human Linkage Studies Can Map Disease Genes with a Resolution of About 1 Mbp
sequence, referred to as DNA polymorphisms, can be followed from one generation to the next by sequencing the DNA of individuals, they can serve as ideal genetic markers for linkage studies. Currently, a panel of as many as different known polymorphisms whose locations have been mapped in the human genome is used for genetic linkage studies in humans. Single-nucleotide polymorphisms (SNPs) constitute the most abundant type of DNA polymorphism and are therefore useful for constructing genetic maps of maximum resolution. Another useful type of DNA polymorphism consists of a variable number of repetitions of a two-, three-, or four-base sequence. Such polymorphisms, known as short tandem repeats (STRs) or microsatellites, presumably are formed by recombination or by slippage of either the template or newly synthesized strand during DNA replication. A useful property of STRs is that different individuals often have different numbers of repeats. The existence of multiple versions of an STR makes it more likely to produce an informative segregation pattern in a given pedigree and therefore to be of more general use in mapping the positions of disease genes. These polymorphisms can be detected by PCR amplification and DNA sequencing. Human Linkage Studies Can Map Disease Genes with a Resolution of About 1 Mbp
Without going into all the technical considerations, let’s see how a geneticist might map the allele conferring a particular dominant disease trait (e.g., familial hypercholesterolemia). The first step is to obtain DNA samples from all the members of a family containing individuals that exhibit the disease. The DNA from each individual, affected and unaffected, is then analyzed to determine that individual’s genotype for a large number of known DNA polymorphisms (either STR or SNP markers can be used). The segregation pattern of each DNA polymorphism within the family is then compared with the segregation pattern of the disease under study. Polymorphisms that are not linked to the disease allele will not show any significant tendency to appear more frequently in individuals with the disease, whereas polymorphisms that are closely linked to it will almost always be present in individuals with the disease, because recombination events that would separate the disease allele and the polymorphism will be rare. Computer analysis of the segregation data is used to calculate the likelihood of linkage between each DNA polymorphism and the disease-causing allele. Under ideal circumstances, the segregation patterns from at least 10 individuals in a family are needed to establish statistically significant evidence for linkage. In practice, segregation data are usually collected from different families exhibiting the same disease and pooled. The more families that can be examined, the greater the statistical significance of any evidence for linkage that can be obtained, and the greater the precision with which the distance between a linked DNA polymorphism and a disease allele can be measured. Most family studies have a maximum of about 100 individuals in whom linkage between a disease gene and a panel of DNA
Further Analysis Is Needed to Locate a Disease Gene in Cloned DNA
polymorphisms can be tested. This number of individuals sets the practical upper limit on the resolution of such a mapping study to about 1 centimorgan, or a physical distance of about Further Analysis Is Needed to Locate a Disease Gene in Cloned DNA Although linkage mapping can usually locate a human disease gene to a region containing about 1 Mbp, as many as 10 different genes may be located in a region of this size. The ultimate objective of a mapping study is to locate the gene of interest within a cloned segment of DNA and then to determine the nucleotide sequence of this fragment. The relative scales of a chromosomal genetic map and physical maps corresponding to ordered sets of plasmid clones and the nucleotide sequence are shown in
FIGURE 6-28 Relationship between genetic and physical maps of a human chromosome. The diagram depicts a human chromosome analyzed at different levels of detail. The chromosome as a whole can be viewed in the light microscope when it is in a condensed state that occurs at metaphase, and the approximate location of specific sequences can be determined by fluorescence in situ hybridization (FISH). At the next level of detail, genetic traits can be mapped relative to DNA-based genetic markers. These genetic mapping studies usually do not pinpoint the gene identity because they localize
genes with an accuracy of only 1 cM, which would correspond to a region of about 1 M bp. To identify the sequence of a gene segment local segments of the chromosome carried on bacterial artificial chromosomes (BACs) can be analyzed at the level of DNA sequences. Important genetic differences are ultimately defined by differences in the nucleotide sequence of the chromosomal DNA. Description The illustration has a human chromosome with bands marked along the chromosome. The level of resolution is described as cytogenic map. Its method of detection is chromosome banding pattern fluorescence in situ hybridization (F I S H). A zoomed-in section of the human chromosome shows a linkage map with polymorphic markers. Its method of detection is linkage to single nucleotide polymorphisms (S N P’s) and short tandem repeats (S T R’s). A 1 centimorgan zoomed in portion of the linkage map shows a physical map having plasmid or B A C clones (750 kilobase). Its method of detection is by hybridization to plasmid clones. The highest level of resolution is labeled as a sequence map, determined by D N A sequencing, and this shows the individual base pairs in the D N A sequence. One strategy for further localizing a disease gene within the genome is to identify mRNA encoded by DNA in the region of the chromosome under study. The aim is to find an mRNA that is altered or missing in various individuals affected with a disease compared with wild-type mRNA. Such an mRNA would be an excellent candidate for encoding the protein whose disrupted function causes that disease. One strategy is to compare the expression of the genes in the candidate region in tissues from normal and affected individuals to discover tissues in which a particular disease gene is expressed in normal individuals but not in affected individuals. The rationale here is that a mutation that phenotypically affects muscle, but no other tissue, might be in a gene that is expressed only in muscle tissue. As discussed in Section 6.5, the level of expression of mRNA is generally
Most Inherited Diseases Result from Multiple Genetic Defects
determined by in situ hybridization of labeled DNA or RNA to tissue sections, by microarray analysis, or by massively parallel sequencing of cDNAs (RNAseq). Each of these methods allows researchers to compare gene expression in mutant and wild-type tissues. Although the sensitivity of in situ hybridization is lower than other methods, it is able to identify an mRNA that is expressed at low levels in a given tissue but at very high levels in a subclass of cells within that tissue. In many cases, point mutations may give rise to disease-causing alleles and yet result in no obvious change in the level of expression of mRNAs or change in length. In that case, researchers undertake a search for point mutations in the DNA regions encoding the mRNAs. Now that highly efficient methods for sequencing DNA are available, researchers frequently identify point mutations by determining the sequences of candidate regions of DNA isolated from affected individuals. The overall strategy is to search for a coding sequence that consistently shows possibly deleterious alterations in DNA from individuals that exhibit the disease. A limitation of this approach is that the region near the affected gene may carry naturally occurring polymorphisms unrelated to the gene of interest. Such polymorphisms, not functionally related to the disease, can lead to misidentification of the DNA fragment carrying the gene of interest. For this reason, the more mutant alleles available for analysis, the more likely that a gene will be correctly identified. Most Inherited Diseases Result from Multiple Genetic Defects
Until now we have considered monogenic diseases; that is, a clearly discernible disease state is produced by a defect in a single gene. Monogenic diseases caused by mutation in one specific gene exhibit one of the characteristic inheritance patterns shown in Figure 6-26. Researchers have already mapped the genes associated with hundreds of common monogenic diseases, including those listed in Table 6-1, using DNA-based markers as described previously. However, many other inherited diseases show more complicated patterns of inheritance. The underlying genetic cause of such diseases is much more difficult to identify. One frequently encountered type of added complexity is genetic heterogeneity. In such cases, mutations in any one of several different genes can cause the same disease. For example, retinitis pigmentosa, which is characterized by degeneration of the retina usually leading to blindness, can be caused by mutations in any one of more than 60 different genes. In human linkage studies, data from multiple families must usually be combined to determine whether a statistically significant linkage exists between a disease gene and known molecular markers. Genetic heterogeneity such as that exhibited by retinitis pigmentosa can confound such an approach because any statistical trend in the mapping data from one family tends to be canceled out by the data obtained from another family with an unrelated causative gene. Human geneticists used two different approaches to identify the many genes associated with retinitis pigmentosa. The first approach relied on mapping studies of exceptionally large families. Each family contained so many affected individuals that it was possible to provide statistically
Identifying Component Genetic Risk Factors of Complex Traits
significant evidence for linkage between known DNA polymorphisms and a single one of the many potential causative genes. From these studies geneticists found that several of the mutations that cause retinitis pigmentosa lie within genes that encode proteins that are abundant in the retina. Following up on this clue, when screening other individuals with retinitis pigmentosa geneticists concentrated their attention on those genes that are highly expressed in the retina. This approach of using additional information to focus screening efforts on a subset of candidate genes led to identification of additional, rare causative mutations in many different genes encoding retinal proteins. Identifying Component Genetic Risk Factors of Complex Traits The most common human disorders not caused by foreign infectious agents are heart disease, obesity, hypertension, diabetes, most cancers, and a variety of mental disorders. Although diet, behavior, and other environmental conditions clearly contribute to these diseases, the existence of a strong genetic component is suggested by the propensity of these diseases to run in families. The relative contribution of genetics, known as heritability, can be formally measured by calculating the proportion of genetically identical monozygotic twins who have been raised apart, but nevertheless both have the disease. For the diseases listed, most of the incidence of disease is heritable and the contribution of genetics is measured to be from 60 to 80 percent. In all but a few rare instances, the disease shows a complex pattern of inheritance that cannot
be explained by a single causative allele — thus the genetic component of these diseases is known as a complex trait. Alleles from multiple genes must be involved in the production of complex traits, and for this reason these genes and their alleles are referred to as risk factors. The systematic mapping of risk factors for complex traits in humans is one of the most important and challenging problems in human genetics, and we already know that for each of the diseases listed alleles of tens and even hundreds of different genes may be risk factors. The most promising method of studying complex traits is to seek a statistical correlation between inheritance of a particular region of a chromosome and the propensity to have a disease, using a procedure known as a genome-wide association study (GWAS). To see how a GWAS would work, consider the complex trait of type II diabetes. Very large samples are needed to obtain statistically significant results because of the enormous heterogeneity of possible genetic causes for type II diabetes. A typical experiment might include a case group of say 5000 individuals with type II diabetes would be compared to a socioeconomically matched control group of 5000 individuals with normal blood glucose homeostasis. The basic concept behind a GWAS is quite simple. The SNPs represented in these 10,000 individuals are surveyed to find those that have a small but significantly greater tendency to appear in individuals that have type II diabetes than in those that do not. The power of this approach lies in computer algorithms that scan data from large numbers of individuals to identify small but significant correlations between a disease and inheritance of a particular region of the genome. A conceptually straightforward method to find all of the SNPs represented in
the 10,000 case and control individuals would be to obtain and survey their complete genome sequences. At present, large-scale sequencing projects of this type are not yet practical. Rather, a typical GWAS will survey a set of of the most common SNPs. Even rare disease-causing alleles not included in the set of common SNPs can be identified by GWAS by taking advantage of the phenomenon of linkage disequilibrium. When an allele that predisposes an individual to a disease arises by mutation, the allele will reside within the context of whatever particular set of SNPs was carried by the ancestral chromosome. Even many generations later, genetic recombination between the disease gene and nearby SNPs will be rare, and the disease-causing allele will tend to remain associated with the particular set of SNPs in the neighborhood of its chromosomal location. This lingering association of nearby genetic markers is known as linkage disequilibrium because not enough time has passed for genetic recombination to have caused the association between markers to be randomized or, in other words, to have come to equilibrium (Figure 6-29). Thus a risk factor for type II diabetes that itself is too rare to be included in the standard set of SNPs may nevertheless be found by associations with SNPs that are in linkage disequilibrium.
FIGURE 6-29 Linkage disequilibrium preserves the association between closely spaced SNPs. A new disease mutation arises in the context of an ancestral chromosome among a set of polymorphisms known as the haplotype of that chromosome (indicated by red shading; the blue segments of chromosomes represent general haplotypes derived from the general population and not from the ancestral haplotype in which the mutation originally arose). After many generations, chromosomes that carry the disease mutation will also carry segments of the ancestral haplotype that have not been separated from the disease mutation by recombination. The regions closest to the disease mutation are the most likely to be the ancestral haplotype. This phenomenon is known as linkage disequilibrium. The position of the disease mutation can be located by scanning chromosomes that contain it for highly conserved polymorphisms corresponding to the ancestral haplotype. Description
Medically Important Genes Can Be Identified by Alleles That Protect Against Disease
Multi-generation schematic shows 10 generations of chromosomes. The top one is labeled Generation 1, and has 2 chromosomes. The left one is red and is labeled new mutation in particular haplotype (m). The right one is blue and labeled chromosome with different haplotype. A downward arrow is labeled meiotic recombination. The next row is labeled generation 2 and contains 4 chromosomes, and two contain the new mutation (red parts). Three consecutive downward arrows are used to show multiple generations. The third row shows generation 10 with 8 pairs of chromosomes. Every pair shows some of the new mutation (red) chromosome material. GWAS can be a powerful tool to identify candidate genes that cause a predisposition to disease, but when all of the risk factors found by a typical GWAS are aggregated, usually they account for less than half of the total known heritability. Much of this missing heritability may eventually be accounted for by very rare SNPs or by factors that make such a small incremental contribution to the risk of disease that no significant association can be observed. As whole genome sequencing information becomes available for very large human cohorts, many more of these elusive risk factors should be found. Medically Important Genes Can Be Identified by Alleles That Protect Against Disease Until now, our discussion of human genes has centered on genes and alleles that cause inherited disease or increase its risk. The same technological advances that have accelerated the search for alleles that cause disease have enabled hunts for an equally important class of alleles
Identification of Causative Mutations in Cancer Cells
that protect against disease. To illustrate the power of protective alleles, we will use the example of PCSK9, a gene recently found to play a key role in cholesterol homeostasis. As described in Chapter 17, cholesterol moves through the bloodstream in lipoprotein particles known as LDL. High LDL levels in the blood can pose a risk of heart disease because excessive LDL can be deposited in coronary arteries as atherosclerotic plaque. PCSK9 was first identified as a sequenced human gene that encodes a secreted protein with homology to a class of proteases. When it was discovered that a rare class of mutations that lead to increased LDL genetically mapped to PCSK9, a role in regulating cholesterol level was suspected. These mutated PCSK9 alleles showed a dominant pattern of inheritance, implying that a gain of function leads to increased LDL. By extension of this logic, a loss of PCSK9 activity should decrease LDL levels. Sequencing the PCSK9 gene in a large number of individuals to find frameshift and nonsense alleles confirmed that individuals with loss of function alleles did indeed have decreased LDL. Subsequent biochemical experiments have shown that the protein product of PCSK9 negatively regulates the LDL receptor, which is responsible for transporting LDL from the blood into the liver by endocytosis. Inactivation of PCSK9 protein has been shown to dramatically decrease LDL levels and PCSK9 inhibitors have become a major target for cholesterol-lowering drugs. This great success in applying basic principles of human genetics to the discovery of the role of PCSK9 in cholesterol homeostasis has spurred interest in finding similar protective alleles for diabetes, obesity, and hypertension.
Identification of Causative Mutations in Cancer Cells The cost of sequencing DNA has fallen so low that the entire genomes of cancer cells have been sequenced and compared with the genomes of normal cells from the same individuals in order to determine all the mutations that have accumulated in those persons’ tumor cells. As discussed in Chapter 25, transformation of a normal cell into a cancer cell that divides without control usually requires multiple mutations. A major goal of sequencing cancer genomes is to identify all of the possible driver mutations implicated in transformation, but this approach is greatly complicated by the fact that transformed cells are usually defective in DNA repair and are prone to accumulate a large number of passenger mutations that do not contribute to cancer. To distinguish driver mutations from passenger mutations, investigators compared a large number of cancer genome sequences in an important application of the bioinformatic principles outlined in Section 6.3. The primary criterion for distinguishing driver mutations is that they are commonly present in all cancers, as well as commonly present in tumors from different patients with the same type of cancer (e.g., breast or colon cancer). A second criterion is based on the types of mutations that are found. A mutation in a driver gene would be expected to produce a significant change in gene function and may be a nonsense or frameshift mutation for a loss of function or a missense mutation for a gain of function. In contrast, a mutation in a passenger gene is as likely as not to be a silent mutation.
KEY CONCEPTS OF SECTION 6.4 Locating and Identifying Genes That Specify Human Traits Inherited diseases and other traits in humans caused by a single gene show three major patterns of inheritance: autosomal dominant, autosomal recessive, and X-linked recessive (see Figure 6-26). Genes for human diseases and other traits can be mapped by determining their cosegregation with markers whose locations in the genome are known. The closer a gene is to a particular marker, the more likely they are to co-segregate (see Figure 627). Mapping of human genes with great precision requires thousands of molecular markers distributed along the chromosomes. The most useful markers are differences in the DNA sequence (polymorphisms) between individuals in noncoding regions of the genome, including single-nucleotide polymorphisms (SNPs) and short tandem repeats (STRs). Linkage mapping can often locate a human disease gene to a chromosomal region that includes as many as 10 genes. To identify the gene of interest within this candidate region typically requires expression analysis and comparison of DNA sequences between wild-type and disease-affected individuals. Some inherited diseases can result from mutations in different genes in different individuals (genetic heterogeneity). The most common inherited diseases depend on the presence of mutant alleles of multiple genes in the same individual. This type of disease is known as a complex trait and the alleles that contribute to the propensity for these diseases are known as risk factors. Risk factors can be mapped by finding a statistical correlation between the disease and a particular chromosomal location in a genome-wide association study. Genetic association studies can also identify alleles that protect against disease. Searching for alleles that protect against major inherited diseases is one of the most promising future directions of human genetics. Genomic sequencing of cancer cells reveals thousands of mutations that arise during the process of transformation into cancer cells. By comparing large numbers of cancer genome sequences, researchers can distinguish driver mutations, which contribute to cell transformation, from passenger mutations, which do not contribute to cell transformation.
In Situ Hybridization Techniques Permit Detection of Specific mRNAs
6.5 Using Cloned DNA Fragments to Study Gene Expression In the previous sections, we described how to identify and characterize genes by analysis of mutations and by bioinformatic analysis of genome sequences. We also described the basic techniques for using recombinant DNA technology to isolate specific DNA clones and ways in which those clones can be further characterized. Here we consider how an isolated DNA clone can be used to study gene expression. We discuss several widely used general techniques that rely on nucleic acid hybridization to elucidate when and where genes are expressed, as well as methods for generating large quantities of protein and otherwise manipulating amino acid sequences to determine their expression patterns, structure, and function. In Situ Hybridization Techniques Permit Detection of Specific mRNAs Hybridization depends on the ability of complementary single-stranded DNA or RNA molecules to associate (hybridize) specifically with each other via base pairing. As discussed in Chapter 5, double-stranded (duplex) DNA can be denatured (melted) into single strands by heating in a dilute salt solution. If the temperature is then lowered and the ion concentration raised, complementary single strands will reassociate
(hybridize) into duplexes. In a mixture of nucleic acids, only complementary single strands (or strands containing complementary regions) will reassociate; moreover, the extent of their reassociation is virtually unaffected by the presence of noncomplementary strands. The power of the hybridization method comes from the ability to adjust the hybridization conditions so that only perfectly complementary sequences will hybridize. One of the most basic ways to characterize a cloned gene is to determine when and where in an organism the gene is expressed. The expression of a particular gene can be followed by identifying in which cells or tissues its mRNA is found. One way to locate a gene’s corresponding mRNA is to probe for it by hybridization to a specific complementary oligonucleotide that is fluorescently labeled. Thus an oligonucleotide of only about 20 nucleotides can be used to label a single unique complementary mRNA. To retain precise information about the location of the mRNA, a chemically fixed whole or sectioned tissue, or even a fixed whole permeabilized embryo, may be subjected to in situ hybridization to detect the mRNA encoded by a particular gene. By examining the fixed tissue in a fluorescence microscope, the amount of gene transcription can be monitored in both time and space (Figure 6-30).
EXPERIMENTAL FIGURE 6-30 In situ hybridization can detect activity of specific genes in whole and sectioned embryos. The specimen is made permeable to nucleic acids by treatment with detergent and a protease to expose the mRNA to the probe. A DNA or RNA probe, specific for the mRNA of interest, is made with nucleotide analogs containing chemical groups that can be recognized by antibodies. After the permeabilized specimen has been incubated with the probe under conditions that promote hybridization, the excess probe is removed with a series of washes. The specimen is then incubated in a solution containing an antibody that binds to the probe. This antibody is covalently joined to a reporter enzyme (e.g., horseradish peroxidase or alkaline phosphatase) that produces a colored reaction product. After excess antibody has been removed, substrate for the reporter enzyme is added. A colored precipitate forms where the probe has hybridized to the mRNA being detected. (a) A whole mouse embryo at about 10 days of development probed for Sonic hedgehog mRNA. The stain marks the notochord (red arrow), a rod of mesoderm running along the future spinal cord. (b) A cross section of a mouse embryo similar to that in part (a). The dorsal/ventral axis of the neural tube (NT) can be seen, with the notochord expressing Sonic hedgehog (red arrow) below it and the endoderm (blue arrow) still farther ventral. (c) A whole Drosophila embryo probed for an mRNA produced during trachea development. The repeating pattern of body segments is visible. Anterior (head) is up; ventral is to the left. Description The micrograph labeled a, shows a curled up embryo. The head is indicated, and the notochord, which leads from the head to the base of the embryo in the path of the
DNA Microarrays Can Be Used to Evaluate the Expression of Many Genes at Once
future spinal cord, is indicated by an arrow. The micrograph labeled b shows a section of the mouse embryo. The notochord is present in the center and is labeled. The neural tube is marked above the notochord and the dorsal (top) and ventral (bottom) surfaces are labeled. Below the notochord, the endoderm is indicated with an arrow. The micrograph labeled c shows a fruit fly embryo. A repeating pattern, corresponding to body segments is visible. DNA Microarrays Can Be Used to Evaluate the Expression of Many Genes at Once The expression of thousands of genes can be monitored simultaneously using DNA microarray analysis, another technique based on the concept of nucleic acid hybridization. A DNA microarray consists of an organized array of thousands of individual, closely packed sequences, each specific to a single gene, attached to the surface of a glass microscope slide. By coupling microarray analysis with the results from genomic sequencing projects, researchers can analyze the global patterns of gene expression in an organism during specific physiological responses or developmental processes. Preparation of DNA Microarrays In one method of preparing microarrays, a DNA segment of about 1 kb corresponding to part of the coding region of each of many genes to be analyzed is individually amplified by PCR. A robotic device is used to
apply each amplified DNA sample to the surface of a glass microscope slide, which is then chemically processed to permanently attach the DNA sequences to the glass surface and to denature them. A typical array might contain some 6000 spots of DNA in a grid. In an alternative method, multiple DNA oligonucleotides, usually at least 20 nucleotides in length, are synthesized, each starting from an initial nucleotide that is covalently bound to the surface of a glass slide. The synthesis of an oligonucleotide of specific sequence can be programmed in a small region on the surface of the slide. Several oligonucleotide sequences corresponding to different regions of a single gene are thus synthesized in neighboring regions of the slide. Using this method, oligonucleotides representing thousands of genes can be produced on a single glass slide. Because the methods for constructing these arrays of synthetic oligonucleotides were adapted from methods for manufacturing microscopic integrated circuits used in computers, these types of oligonucleotide microarrays are often called DNA chips. Using Microarrays to Compare Gene Expression Under Different Conditions The initial step in a microarray expression study is to prepare cDNAs from the mRNAs expressed by the cells under study and attach fluorescent labels to them (see Figure 6-17). When the cDNA preparation is applied to a microarray under appropriate conditions, DNA spots representing genes that are expressed will hybridize to their complementary cDNAs in the
labeled probe mix and can subsequently be detected in a scanning laser microscope.
Figure 6-31 depicts how this method can be applied to examine the changes in gene expression observed after starved human fibroblasts are transferred to a rich, serum-containing growth medium. In this type of experiment, the separate cDNA preparations from starved and from serum-grown fibroblasts are labeled with differently colored fluorescent dyes. A DNA microarray comprising 8600 mammalian genes is then incubated with a mixture containing equal amounts of the two cDNA preparations under hybridization conditions. After unhybridized cDNA is washed away, the intensity of green and red fluorescence at each DNA spot is measured using a fluorescence microscope and is recorded under the name of each gene according to its known position on the slide. The relative intensities of red and green fluorescence signals at each spot provide a measure of the relative level of expression of that gene in response to serum. Genes that are not transcribed under these growth conditions give no detectable signal. Genes that are transcribed at the same level under both conditions hybridize equally to both red- and greenlabeled cDNA preparations. Microarray analysis of gene expression in fibroblasts showed that transcription of about 500 of the 8600 genes examined changed substantially after addition of serum.
EXPERIMENTAL FIGURE 6-31 DNA microarray analysis can reveal differences in gene expression in fibroblasts under different experimental conditions. (a) In this example, cDNA prepared from mRNA isolated from fibroblasts either starved for serum or after addition of serum is labeled with different fluorescent dyes. A microarray composed of DNA spots representing 8600 mammalian genes is exposed to an equal mixture of the two cDNA preparations under hybridization conditions. The ratio of the intensities of red and green fluorescence over each spot, detected with a scanning confocal laser microscope, indicates the relative expression of each gene in response to serum. (b) A micrograph of a small segment of an actual DNA microarray. Each spot in this array contains DNA from a different gene hybridized to control and experimental cDNA samples labeled with red and green fluorescent dyes. (A yellow spot indicates equal hybridization of green and red fluorescence, indicating no change in gene expression.) Description In illustration labeled a, D N A microarray is used to analyze the differences in gene expression. The process is outlined below.
Cluster Analysis of Multiple Expression Experiments Identifies Co-Regulated Genes
1. Two sets of cells under different conditions are cultured. In this example, fibroblasts cultured either with or without serum. 2. The total m R N As from the two sets of cells is isolated. 3. Reverse transcriptase is used to prepare c D N A. At the same time the c D N A is labeled with a fluorescent dye. In this example, the dye is green for c D N A extracted generated from fibroblasts cultured without serum and red for fibroblasts cultured with serum. 4. The two sets of c D N A are mixed. 5. The c D N A is hybridized to a D N A microarray. 6. The microarray is washed. 7. The fluorescence of the each microarray well is measured. An array of 8600 is present. One well of the array has c D N A s hybridized to D N As for a single gene. It shows several strands of D N A. A box indicates that, if a well (or spot) in the microarray is green, labeled gene decreases in cells after serum addition. In contrast, if the spot is red, expression of the gene increases in cells after serum addition. In micrograph labeled b, A D N A microarray showing fluorescence corresponding to the expression of genes under different conditions shows a plate containing 16 by 16 wells, and each well is colored red, blue, yellow, or green. Cluster Analysis of Multiple Expression Experiments Identifies CoRegulated Genes
Microarray studies reveal sets of genes that show similar patterns of gene expression; these genes are expressed at the same times in the same tissues. Genes that are expressed under the same conditions and in the same cell types are hence likely to be closely related functionally. However, a firm conclusion can rarely be drawn from a single microarray experiment. For example, many of the observed differences in gene expression just described in fibroblasts could be indirect consequences of the many different changes in cell physiology that occur when cells are transferred from one medium to another. In other words, genes that appear to be co-regulated in a single microarray expression experiment may undergo changes in expression for very different reasons and may actually have very different biological functions. A solution to this problem is to combine the information from a set of microarray expression experiments to find genes that are similarly regulated under a variety of conditions or over a period of time. This more informative use of multiple microarray expression experiments is illustrated by examining the relative expression of the 8600 genes mentioned above at different times after serum addition to fibroblasts, which generated more than individual pieces of data. A computer program, related to the one used to determine the relatedness of different protein sequences, can organize these data and cluster genes that show similar expression over the time course after serum addition. This cluster analysis based on gene transcription efficiently groups sets of genes whose encoded proteins participate in a common cellular process, such as cholesterol biosynthesis or the cell cycle (Figure 6-32).
EXPERIMENTAL FIGURE 6-32 Cluster analysis of data from multiple microarray expression experiments can identify co-regulated genes. The expression of 8600 mammalian genes was detected by microarray analysis at time intervals over a 24-hour period after serum-starved fibroblasts were provided with serum. The cluster diagram shown here is based on a computer algorithm that groups genes showing similar changes in expression compared with a serum-starved control sample over time. Each column of colored boxes represents a single gene, and each row represents a time point. A red box indicates an increase in expression relative to the control; a green box, a decrease in expression; and a black box, no significant change in expression. The “tree” diagram at the top shows how the expression patterns for individual genes can be organized in a hierarchical fashion to group together the genes with the greatest similarity in their patterns of expression over time. Five clusters of coordinately regulated genes were identified in this experiment, as indicated by the bars at the bottom. Each cluster contains multiple genes whose encoded proteins function in a particular cellular process: cholesterol biosynthesis (A), the cell cycle (B), the immediate-early response (C), signaling and angiogenesis (D), and wound healing and tissue remodeling (E). Description A cluster analysis that looks like a black rectangle with bright green sections to the left and red sections to the right. Above the rectangle is a phylogenetic tree diagram color coded to represent different genes activated at different times. Under the rectangle, 5 areas are labeled. Toward the right side of the green area is a section labeled A. Near the part where the red sections start is an area labeled B, followed by a short section of bright green area labeled C. The first section of red is labeled D and a longer section right next to that is labeled E.
Sequencing of cDNAs Allows Analysis of Gene Expression in Individual Cells
Microarray analysis is a powerful diagnostic tool in medicine. Previously indistinguishable disease variations are now detectable. For instance, particular sets of mRNAs have been found to distinguish tumors with a poor prognosis from those with a good prognosis. Analysis of these tumor biopsies will help physicians to select the most appropriate treatment. As more patterns of gene expression characteristic of various diseased tissues are recognized, the diagnostic use of DNA microarrays will be extended to other conditions. Sequencing of cDNAs Allows Analysis of Gene Expression in Individual Cells A limitation of DNA microarray analysis is that while hybridization is highly selective, it is relatively insensitive. Many mRNAs that are present but are of low abundance fail to produce a detectable signal. A powerful method is available that enables detection of mRNAs that are present at only one copy per cell. Known as whole transcriptome shotgun sequencing (or RNA-Seq), the method is to directly subject a large number cDNAs from a tissue to shotgun sequence analysis. A sequencing read of about 100 bases is obtained for each cDNA, which allows each read sequence to be unambiguously assigned to a particular mRNA. The method makes it possible to quantify relative mRNA abundance by simply counting the relative number of sequencing reads corresponding to each mRNA. For example, when cDNA prepared from hepatocytes is subjected to RNA-Seq analysis, sequence reads
E. coli Expression Systems Can Produce Large Quantities of Proteins from Cloned Genes
corresponding to abundant mRNAs such as that for serum albumin may be detected thousands of times out of a total of a million reads. Since one read per million is used as the threshold for detection of very rare mRNAs, we can see that RNA-Seq can measure mRNA abundance over a range of -fold, which is far greater than any experiment based on hybridization could achieve. Refinements of RNA-Seq, such as introducing a few rounds of amplification of cDNAs by PCR, have increased the sensitivity of the method so that RNA abundance even in single cells can be measured. This method, called single cell RNA-Seq (scRNA-Seq), allows detection of differences in gene expression among individual cells that could be obscured when different cell types in a tissue are combined for preparation of a bulk mRNA sample. E. coli Expression Systems Can Produce Large Quantities of Proteins from Cloned Genes An important application of our knowledge of how to engineer genes for high levels of expression is the production of large quantities of useful proteins. Many protein hormones and other signaling or regulatory proteins are normally expressed at very low concentrations and so cannot be isolated and purified in large quantities by standard biochemical techniques. To enable the widespread therapeutic use of such proteins, as
well as basic research on their structure and functions, efficient procedures are needed for producing them in large amounts at reasonable cost. Recombinant DNA techniques that turn E. coli cells into factories for synthesizing low-abundance proteins are now used to produce commercially a variety of human proteins with therapeutic uses, including granulocyte colony-stimulating factor (G-CSF), insulin, growth hormone, and erythropoietin. For example, G-CSF stimulates the production of granulocytes, the phagocytic white blood cells that are critical to defense against bacterial infections. Administration of G-CSF to cancer patients helps offset the reduction in granulocyte production caused by chemotherapeutic agents, thereby protecting patients against serious infection while they are receiving chemotherapy. The first step in producing large amounts of a low-abundance protein is to obtain a cDNA clone encoding the full-length protein by the methods (see
Figure 6-17). The second step is to engineer plasmid vectors that will express large amounts of the encoded protein when they are inserted into E. coli cells. The key to designing such expression vectors is to include a promoter, a DNA sequence from which transcription of the cDNA can begin. Consider, for example, the relatively simple system for expressing G-CSF shown in Figure 6-33. In this case, G-CSF is expressed in E. coli transformed with plasmid vectors that contain the lac promoter adjacent to the cloned cDNA encoding G-CSF. Transcription from the lac promoter occurs at high rates only when lactose, or a lactose analog, such as isopropylthiogalactoside (IPTG), is added to the culture medium. Even larger quantities of a desired protein can be produced in more complicated E. coli expression systems.
EXPERIMENTAL FIGURE 6-33 Some eukaryotic proteins can be produced in E. coli cells from plasmid vectors containing the lac promoter. (a) This plasmid expression vector contains a fragment of the E. coli chromosome containing the lac promoter and the neighboring lacZ gene. In the presence of the lactose analog IPTG, RNA polymerase
normally transcribes the lacZ gene, producing lacZ mRNA, which is translated into the encoded protein, β-galactosidase. (b) The lacZ gene can be cut out of the expression vector with restriction enzymes and replaced by a cloned cDNA, in this case, one encoding granulocyte colony-stimulating factor (G-CSF). When the resulting plasmid is inserted into E. coli cells, addition of IPTG and subsequent transcription from the lac promoter produce G-CSF mRNA, which is translated into G-CSF protein. Description The illustration a, shows an E. coli bacterium on the left with a vector that contains the lac promoter and the lac Z gene. The bacterial cell is labeled negative I P T G. The E. coli bacterium on the right has a vector that produces m R N A that produces the betagalactosidase enzyme. The bacterial cell is labeled positive I P T G. The illustration labeled b shows the process of modifying E. coli cells to produce eukaryotic proteins are summarized as follows. 1. A plasmid expression vector containing the lac promoter and lac Z gene is treated with restriction enzymes to cut out the lac Z gene. 2. The (G-C S F) c D N A is inserted into the plasmid immediately after the lac controller. 3. E. coli are transformed with the plasmid vector having a lac promoter region and the G-C S F c D N A region. 4. In the absence of I P T G, the G-C S F gene is not active, but in the presence of I P T G, m R N A is transcribed, and the G-C S F protein is produced. To aid in purification of a eukaryotic protein produced in an E. coli expression system, researchers often modify the cDNA encoding the recombinant protein to make it easier to separate from endogenous E. coli proteins. For example, a short nucleotide sequence is commonly added to the end of the cDNA, so that the expressed protein will have six histidine
Plasmid Expression Vectors Can Be Designed for Use in Animal Cells
residues at the C-terminus. Proteins modified in this way bind tightly to an affinity matrix that contains chelated nickel atoms, whereas E. coli proteins do not bind to such a matrix. The bound proteins can be released from the nickel atoms by decreasing the pH of the surrounding medium. In most cases, the modified protein is still functional, since addition of short amino acid sequences to either the C-terminus or the N-terminus of a protein usually does not interfere with the protein’s biochemical activity. Plasmid Expression Vectors Can Be Designed for Use in Animal Cells Although bacterial expression systems can be used successfully to create large quantities of some proteins, bacteria are not suitable expression hosts in many cases. Many experiments are designed to examine the function of a protein in the context of an appropriate cell. In such cases, a genetically modified protein must be expressed in cultured animal cells. To accomplish this, genes are cloned into specialized eukaryotic expression vectors and are introduced into cultured animal cells by a process called transfection. Two common methods for transfecting animal cells differ in whether the recombinant vector DNA is or is not integrated into the host-cell genomic DNA. In both methods, cultured animal cells must be treated to facilitate their initial uptake of the recombinant plasmid vector. This can be done by exposing cells to a preparation of lipids that penetrates the plasma membrane, increasing its permeability to DNA. Alternatively, cells are
subjected to a brief electric shock of several thousand volts, a technique known as electroporation that makes the cells transiently permeable to DNA. Usually the plasmid DNA is added in sufficient concentration to ensure that a large proportion of the cultured cells will receive at least one copy. Researchers have also harnessed viruses for transfection; viruses can be modified to contain DNA of interest, which is then introduced into host cells by simply infecting them with the recombinant virus. Transient Transfection The simpler of the two transfection methods, called transient transfection, employs a plasmid vector similar to the yeast shuttle vectors described previously. For use in mammalian cells, plasmid vectors are engineered to carry a replication origin derived from a virus that infects mammalian cells, a strong promoter recognized by mammalian RNA polymerase, and the cloned cDNA encoding the protein to be expressed adjacent to the promoter (Figure 6-34a). Once such a plasmid vector enters a mammalian cell, the viral replication origin allows it to replicate efficiently, generating numerous plasmids from which the protein is expressed. However, during cell division, such plasmids are not faithfully segregated into both daughter cells, and in time, a substantial fraction of the cells in a culture will not contain a plasmid, hence the name transient transfection.
EXPERIMENTAL FIGURE 6-34 Transient and stable transfection with specially designed plasmid vectors permits expression of cloned genes in cultured animal cells. Both methods employ plasmid vectors that contain the usual elements — replication origin, selectable marker (e.g., ), and polylinker — that permit propagation in E. coli as well as a cloned cDNA with an adjacent animal promoter. For simplicity, these elements are not depicted. (a) In transient transfection, the plasmid vector contains a replication origin from a virus that can replicate in the cultured animal cells. Since the vector is not incorporated into the genome of the cultured cells, production of the cDNA-encoded protein continues for only a limited time. (b) In stable transfection, the vector carries a selectable marker such as , which confers resistance to G-418. The relatively few transfected animal cells that integrate the exogenous DNA into their genomes are selected on medium containing G-418. Because the vector is integrated into the genome, these stably transfected, or transformed, cells will continue to produce the cDNA-encoded protein as long as the culture is maintained. Description Transient transfection: A vector has a promoter region, c D N A and a viral origin of replication. An arrow labeled transfect cultured cells by lipid treatment or electroporation points at three animal cells attached together. Protein is expressed from c D N A in plasmid D N A of the animal cells. Stable transfection (transformation): A vector has a promoter region, c D N A and a n e o superscript r region. Two consecutive downward arrows labeled transfect cultured cells by lipid treatment or electroporation and select for G-418 resistance respectively point at an agar plate which has colonies. The colonies contain G-418-resistant clones. An arrow points from a colony on the agar plate to three animal cells which show a protein being released from its genes. Protein is expressed from c D N A integrated into host chromosome. Stable Transfection (Transformation)
The second of the two transfection methods integrates the introduced vector into the genome of the host cell. In that case, the genome is permanently altered, and the cell is said to be transformed. Integration is most likely accomplished by endogenous enzymes that normally function in DNA repair and recombination. The basic procedure for expressing a cloned cDNA by stable transfection is outlined in Figure 6-34b. A commonly used selectable marker is the gene for neomycin phosphotransferase (designated ), which confers resistance to a toxic compound chemically related to neomycin, known as G-418. In the presence of a high concentration of G-418, only those cells that have integrated the expression vector into the host chromosome will survive and give rise to a clone. Because the expression vector is integrated at random sites in the genome, individual transformed clones will differ in their rates of transcribing the inserted cDNA. Therefore, the stable transfectants are usually screened to identify those that produce the protein of interest at the highest levels. Retroviral Expression Systems Researchers have exploited the basic mechanisms used by viruses for inserting their genetic material into the host’s chromosomal DNA to greatly increase the efficiency by which a modified gene can be stably expressed in animal cells. One such viral expression system is derived from a class of retroviruses known as lentiviruses. The system utilizes lentivirus particles that carry an RNA version of the cloned gene incorporated into the virus’s RNA genome. The cloned gene is flanked by lentivirus LTR sequences. In the target cell, the LTR sequences direct the
copying of the RNA into double-stranded DNA by reverse transcription, resulting in the integration of that DNA into chromosomal DNA following a sequence of events depicted in Figure 7-14. The key to the procedure is the production of lentivirus particles suitable for efficient introduction of a cloned gene into target animal cells. As shown in Figure 6-35, three different plasmids, introduced into cells by transient transfection, are used to produce recombinant lentivirus particles. The first plasmid, known as the vector plasmid, contains a cloned gene of interest next to a selectable marker such as flanked by lentivirus LTR sequences. The left LTR sequence directs synthesis of an RNA molecule that carries lentiviral LTR sequences at either end and thus has many of the properties of native retroviral RNA. In an appropriate host, this LTR-bearing RNA can be packaged into viral particles with the assistance of the other two plasmids. The second plasmid, known as the packaging plasmid, carries all of the viral genes except for the major viral envelope protein, necessary for packaging of LTR containing viral RNA into the nucleocapsid of a functional lentiviral particle. The final plasmid allows expression of a viral envelope protein that, when incorporated into a recombinant lentivirus, allows the resulting hybrid virus particles to infect a desired target cell type. A common envelope protein used in this context is the glycoprotein of the vesicular stomatitis virus (VSV-G protein), which can readily replace the normal lentivirus envelope protein on the surface of completed virus particles. Virus particles coated with the VSV-G protein are able to infect a wide variety of mammalian cell types, including hematopoietic stem cells, neurons, and muscle and liver cells.
EXPERIMENTAL FIGURE 6-35 Retroviral vectors can be used for efficient integration of cloned genes into the mammalian genome. Recombinant lentiviral particles are produced in cells expressing viral proteins from a packaging plasmid and that include a coat protein that confers a broad host range expressed from the viral coat plasmid. These viral particles will package viral RNA synthesized from a vector plasmid that contains a gene sequence of interest. When a recombinant lentiviral particle formed in this way infects a recipient cell the cloned gene of interest is introduced into the cell in a form that can integrate into chromosomal DNA and thus be stably expressed in the recipient cell. Description The illustration of lentivirus has retroviral R N A represented by a red wavy single strands. It is encapsulated by a circle that has eight spike like structures. Vector plasmid: It has a L T R region, a cloned gene region, a neo superscript r region, and another L T R region. It produces retroviral R N A.
Packaging plasmid: It has seven unlabeled regions and points to the viral coat of the recombinant lentiviral particle. Viral coat plasmid: It has a promoter region, a gene for viral coat protein, and a viral origin of replication. It produces the viral coat protein. After cell infection, the cloned gene flanked by the viral LTR sequences is reverse-transcribed into DNA, which is transported into the nucleus and then integrated into the host genome. If necessary, as in the case of stable transfection, cells with a stably integrated cloned gene and marker can be selected by resistance to G-418. Many of the techniques for inactivating the function of specific genes (see Section 6.6) require that an entire population of cultured cells be genetically modified simultaneously. Engineered lentiviruses are particularly useful for such experiments because they infect cells with such high efficiency that every cell in a population will receive at least one copy of the lentivirus-borne plasmid. Gene and Protein Tagging Expression vectors can provide a way to study the expression of eukaryotic proteins and their location with the cell. Such studies often rely on the use of a reporter protein, such as green fluorescent protein (GFP), which can be conveniently detected in cells (see Figure 4-15). Here we describe two ways to create a hybrid gene that connects expression of the reporter protein to expression of the protein of interest. When the hybrid gene is reintroduced into cells, either by transfection with a plasmid expression vector containing the modified gene or by creation of a transgenic animal as described in Section 6.6, the expression of the
reporter protein can be used to determine where and when a gene is expressed. This method provides data similar to that from the in situ hybridization experiments described previously, but often with greater resolution and sensitivity.
Figure 6-36 illustrates the use of two different types of GFP-tagging experiments to study the expression of an odorant receptor protein in C. elegans. In the first type of experiment, the coding sequence of GFP is placed under control of the promoter for the odorant receptor in a configuration usually known as a promoter-fusion. In the second type of experiment, the coding sequence of GFP is linked directly to the coding sequence of the odorant receptor, in a configuration known as proteinfusion. When GFP is linked to the promoter, the GFP is expressed throughout specific neurons; thus this promoter fusion experiment provides readout of gene expression. But to look at the protein in the cell, protein-fusion methods are used. When GFP is linked to the odorant receptor coding sequence, it is localized at the distal cilia in sensory neurons, the site at which the receptor protein is normally located.
EXPERIMENTAL FIGURE 6-36 Gene and protein tagging facilitate cellular localization of proteins expressed from cloned genes. In this experiment, the gene encoding a chemical odorant receptor, Odr10, of C. elegans was fused to the gene encoding green fluorescent protein (GFP). (a) A promoter-fusion was generated by linking just the promoter of Odr10 to the coding sequence for GFP. The result is that GFP is expressed in the cytoplasm of the same specific sensory neurons in the head of C. elegans where Odr10 is expressed. (b) A protein-fusion was constructed by linking GFP to the end
of the full-length Odr10 coding sequence. In this case, the Odr10-GFP fusion protein is targeted to the membrane at the tip of the sensory neurons and is apparent only at the distal end of the sensory cilia. The observed distribution can be inferred to reflect the normal location of Odr10 protein in specific neurons. Because the promoter-fusion shown in (a) lacks the Odr10 localization sequences, the expressed GFP fills the entire cell cytoplasm rather than being localized just to the distal tip of the sensory cilia. An alternative to GFP tagging for detecting the location of a protein inside the cell is to modify the gene of interest by appending to it a short DNA sequence that encodes a short stretch of amino acids recognized by a known monoclonal antibody. Such a short peptide that can be bound by an antibody is called an epitope; hence this method is known as epitope tagging. After transfection of cells with a plasmid expression vector containing the modified gene, the expressed epitope-tagged form of the protein can be detected by immunofluorescence microscopy utilizing a monoclonal antibody specific for the epitope. The choice of whether to use a short epitope or GFP to tag a given protein often depends on what types of modification a cloned gene can tolerate and still remain functional. GFP expressed in C. elegans can be imaged by fluorescent microscopy because the body of a living worm is transparent. To image gene expression in a larger animal such as the mouse a more sensitive bioluminescent reporter can be used. This method uses an enzyme derived from insects known as luciferase, which is responsible for the flashes of light emitted by fireflies. When provided with the substrate luciferin, luciferase will catalyze a chemical reaction that produces visible light. Visible light photography can detect the light from a luciferase reporter emitted from within the body of a living mouse. The chapter opening
figure shows a transgenic mouse expressing a promoter fusion of the Tcell specific promoter CD2 expressing luciferase. KEY CONCEPTS OF SECTION 6.5 Using Cloned DNA Fragments to Study Gene Expression Hybridization of a labeled DNA to the complementary RNA or DNA sequence allows specific detection of a single mRNA species in the context of a whole cell. The presence and distribution of specific mRNAs within tissues can be determined by in situ hybridization and fluorescence microscopy. DNA microarray analysis simultaneously detects the relative levels of expression of thousands of genes in different types of cells or in the same cells under different conditions (see Figure 6-30). Cluster analysis of the data from multiple microarray expression experiments can identify genes that are similarly regulated under various conditions. Such co-regulated genes commonly encode proteins that have biologically related functions. RNA-Seq analysis, based on direct sequencing of millions of cDNAs, gives a picture of all of the mRNAs that are expressed in a single cell. Expression vectors derived from plasmids allow the production of abundant amounts of a protein from a cloned gene. Eukaryotic expression vectors can be used to express cloned genes in the context of a living organism. An important application of these methods is to the tagging of proteins with GFP or some other identifiable marker to determine the pattern of expression and intracellular location.
6.6 Altering the Function of Specific Genes by Design
6.6 Altering the Function of Specific Genes by Design The vast amount of genomic DNA sequence information obtained in recent years has led to the identification of many new genes. The function of a new gene can often be deduced from the similarity of the encoded proteins with proteins of known function, but its roles in the context of a living organism can’t be known with certainty unless a mutant forms of the gene is available. In this section, we describe several ways of disrupting the normal function of a specific gene in the genome of an organism. Analysis of the resulting mutant phenotype often helps reveal the in vivo function of the normal gene and its encoded protein. We will begin this section with a description of how gene deletions are constructed in yeast. Yeast is the most easily genetically manipulatable organism and is the first organism for which deletions for every gene have been constructed. This comprehensive collection of null alleles has allowed researchers to observe the effect of completely inactivating every gene in an organism. We will then turn to the recently developed, powerful genome editing method known as CRISPR, which is based on a bacterial system for making cuts in specific DNA sequences. This system has been adapted to edit specific genes in a wide variety of organisms, including mammals. The basic CRISPR protocol will cause a small deletion in the targeted gene, which usually generates a null allele. Alternatively, gene
Normal Yeast Genes Can Be Replaced with Mutant Alleles by Homologous Recombination
researchers often desire to study the effect of a particular allele of a gene, such as a dominant gain of function allele, and CRISPR has been modified to carry out this more specific type of genome editing as well. We will also describe other approaches that are used widely in model organisms to study the effects of gene inactivation: (1) use of transgenic mice to construct gene alleles that can be selectively inactivated in particular tissues and (2) promoting destruction of the mRNA transcribed from a gene using RNA interference. Normal Yeast Genes Can Be Replaced with Mutant Alleles by Homologous Recombination Modifying the genome of the yeast S. cerevisiae is particularly easy for two reasons: yeast cells readily take up exogenous DNA under certain conditions, and the introduced DNA is efficiently exchanged for the homologous chromosomal site in the recipient cell. This specific, targeted recombination of identical stretches of DNA allows any gene in yeast chromosomes to be replaced with a mutant allele. In one popular method for disrupting yeast genes in this fashion, a gene is replaced by a selectable marker. PCR is used to generate a disruption construct containing the selectable marker, which is subsequently transfected into yeast cells. As shown in Figure 6-37a, the two primers for PCR amplification of the selectable marker are each designed to include
about 20 nucleotides identical to sequences flanking the yeast gene to be replaced. The resulting amplified construct comprises the selectable marker (e.g., the KanMX gene, which, like , confers resistance to G418) flanked by about 20 bp at each end that match the ends of the target yeast gene. Once transfected into a diploid yeast cell, the disruption construct will typically replace one of the two copies of the target endogenous gene. These transformed diploid yeast cells can be identified by their resistance to G-418 or other selectable phenotype. Heterozygous diploid yeast cells generally grow normally regardless of the function of the target gene, but half the haploid spores derived from these cells will carry only the disrupted allele (Figure 6-37b). If a gene is essential for viability, then spores carrying a disrupted allele will not survive.
EXPERIMENTAL FIGURE 6-37 Homologous recombination with transfected disruption constructs can inactivate specific target genes in yeast. (a) A suitable construct for disrupting a target gene can be prepared using PCR. The two primers designed for this purpose each contain a sequence of about 20 nucleotides (nt) that is homologous to one end of the target yeast gene as well as sequences needed to amplify a segment of DNA carrying a selectable marker gene such as kanMX, which confers resistance to G-418. (b) When recipient diploid Saccharomyces cells are transformed with the disruption construct, homologous recombination between the ends of the construct and the corresponding chromosomal sequences integrates the marker gene into the chromosome, replacing the target-gene sequence. The recombinant diploid cells will grow on a medium containing G418, whereas untransformed cells will not. If the target gene is essential for viability, half the haploid spores that form after sporulation of recombinant diploid cells will be nonviable. Description The illustration labeled a shows a target yeast gene on a D N A, with a purple section on the left terminal; labeled 20- nucleotide flanking sequence, and another of the same sequence in green on the right terminal. The next step shows D N A synthesis using primer 2 for the 5 prime to 3 prime strand and primer 1 for the 3 prime to 5 prime strand. The section in the middle is labeled k a n M X. Last, a downward arrow points at the disruption construct which has its middle section labeled k a n M X and having 20 nucleotide flanking sequences on both terminals. The illustration labeled b shows a diploid cell. An arrow labeled transform diploid cells with disruption construct points from the diploid cell to another cell which has undergone homologous recombination. Another arrow points from this to another cell. The arrow is labeled select for G- 418 resistance. This cell undergoes sporulation to give four haploid spores. Two of which have the disruption construct and the other two the normal genes. A text reads, If the disrupted gene is essential, these spores will be nonviable. Disruption of genes by this method is proving particularly useful in assessing the roles of proteins identified by analysis of the entire genomic
sequence of S. cerevisiae. Each of the approximately 6000 genes has been disrupted with the KanMX construct in diploids, and gene disruptions in haploid spores have also been produced. These analyses have shown that about 4500 of the 6000 yeast gene disruptions can reside in viable haploid spores, revealing an unexpectedly large number of apparently nonessential genes. In some cases, disruption of a particular gene may give rise to subtle defects that do not compromise the viability of yeast cells growing under laboratory conditions. Alternatively, cells carrying a disrupted gene may be viable because of the operation of backup or compensatory pathways. The existence of compensatory pathways and processes is revealed through the analysis of double mutants as shown in Figure 6-10. The construction of KanMX deletion constructs for S. cerevisiae included the insertion of two sequences of 20 nucleotides (nt) that are unique to each deleted gene. These sequences can be used as molecular bar codes that can be read out either by DNA sequencing or by hybridization to a microarray. By counting the number of copies of a given bar code the growth properties of the corresponding deletion mutant can be followed in a pooled mixture of all 4500 nonessential gene deletion mutants. In an early application of the bar code technology for parallel screening of deletion mutants, the pool of all 4500 deletion mutants was tested for sensitivity to various stress conditions. For example, the pool was evaluated by hybridization to a microarray to determine the relative numbers of each deletion strain. After this initial calibration the pool was placed in growth medium containing 1 M NaCl, a condition that causes stress and will slow the growth of wild-type yeast. Deletion mutants that are less able to withstand salt stress will exhibit decreased fitness relative
Engineered CRISPR Systems Allow Precise Genome Editing
to the average strain when grown in 1 M NaCl. From among 4500 deletion strains 62 gene deletions were identified that exhibited a significant decrease in cell number as determined by counting the number of the corresponding bar codes after growth in 1 M NaCl. The typical approach to conducting an equivalent screen would be to test the growth of each of the 4500 deletion mutants individually, whereas this method of following each strain by its molecular bar code enables growth characteristics of the entire collection of mutants to be screened in a single culture flask. This efficient method for screening mutants can be applied whenever individual mutant strains can be identified by a unique sequence tag, as we will see in the next section on mutations generated by the CRISPR system. Engineered CRISPR Systems Allow Precise Genome Editing Precise alterations can be made in genomic DNA sequences, a process known as genome editing, of virtually all organisms through the use of CRISPR. This genome-editing technique is an adaptation of a natural mechanism that evolved to protect bacterial cells against foreign DNA, such as phage DNA. The name CRISPR (clustered regularly interspaced short palindromic repeats) refers to the curious arrays of tandem repeated sequences found in about half of the bacterial genomes that have been sequenced. The arrays of repeated sequences are flanked by a conserved set of genes, known as Cas (CRISPR-associated) genes, that show similarity to genes encoding nucleases.
The breakthrough in understanding the function of CRISPR sequences came from the observation that one set of repeated sequence elements in the array often matched short segments in phage genomes. It was subsequently shown that the CRISPR element and associated Cas genes confer on bacterial cells the ability to cleave phage DNA at precisely the site that corresponds to repeated sequences in the CRISPR array. By this means the bacterial cells acquire immunity to a phage. The acquisition of immunity takes place in two stages. In the first stage, a phage-infected bacterium cleaves the phage DNA into short segments and adds those segments to the CRISPR array so that they are interspersed with highly conserved repeats. In the second stage, transcription of the CRISPR array and processing of the resulting RNA yields mature bipartite RNA molecules, known as guide RNAs, that carry both the conserved repeat sequences and a phage-derived spacer sequence. The guide RNA assembles with Cas proteins to form an interference complex, which can target infecting phage DNA (that has been released from the viral particle) through base pairing of the guide RNA and with its complementary sequence in the phage DNA. Once targeted to a specific DNA sequence, nucleases in the Cas proteins cleave both strands of the target DNA molecule at a site adjacent to the region base-paired with the guide sequence. Using CRISPR to Modify Eukaryotic Genomes Although CRISPR elements have been found only in prokaryotic organisms, researchers proposed that the guide RNA and Cas proteins should be able to perform their functions if expressed in eukaryotic cells.
To adapt CRISPR to function in virtually any cell type, researchers have developed minimal systems consisting of the nuclease Cas9 and an engineered guide RNA (Figure 6-38a). Cas9 contains the enzymatic activities necessary for precise DNA cleavage, including two separate endonuclease activities — one for each strand of DNA. The guide RNA is composed of two regions: the first is a scaffold made up of two complementary sequences that form a double-stranded hairpin structure that binds to Cas9, and the second region of about 20 nt identifies the target sequence and is designed to perfectly match a specific target site in genomic DNA. When both Cas9 and the guide RNA are expressed in a recipient cell, Cas9 will cleave both DNA strands at the chromosomal site specified by the guide RNA sequence (Figure 6-38b, c). Transfection with expression plasmids for Cas9 and a specific guide RNA has been shown to give rise to specific DNA cleavages in cells derived from a variety of organisms, including Drosophila, C. elegans, zebrafish, mouse, rat, and human.
FIGURE 6-38 Single-nucleotide mutations can be introduced into the genome using an engineered CRISPR-Cas9 system. (a) The genome of a target cell can be modified by expression of the double-stranded DNA endonuclease Cas9 and a guide RNA. Expression of these components can be achieved by transfection with plasmids carrying genes for Cas9 and the guide RNA or by direct injection of Cas9 mRNA and guide RNA. The guide RNA
is composed of two parts: a sequence that folds into a hairpin scaffold structure that binds to Cas9, and a sequence of approximately 20 nt corresponding to the targeted site in the genome. (b) A complex of guide RNA bound to Cas9 is targeted to the genome by base pairing of the guide RNA with the complementary genomic DNA sequence. This structure allows the two distinct nuclease active sites of Cas9 to cleave both strands of the target DNA adjacent to the heteroduplex formed with the guide RNA. (c) By this mechanism, the expression of both Cas9 and a bipartite guide RNA designed to target a specific gene sequence leads to a double-strand cleavage of the target gene. (d) Cleaved DNA can be repaired via a nonhomologous end joining (NHEJ) process, which usually removes a small number of bases at the cleavage site. If the cleavage occurs in a coding sequence, NHEJ will usually inactivate gene function by producing a frameshift mutation. If an ∼100-nt single-stranded DNA segment that spans the sequences flanking the cleavage site is injected along with Cas9 mRNA and the guide RNA, the cleaved DNA can be repaired by homologous recombination (homology-directed repair, HDR). By this mechanism, single base changes can be introduced into the repaired genomic DNA. [Part (b) data from C. Anders et al., 2014, Nature 513:569–573, PDB ID 4un3.] Description Illustration a, has an R N A represented by a pink and red bar labeled guide R N A expression. The red part is labeled target sequence (species-specific promoter) and the pink part is labeled t r a c r R N A scaffold. Next to this on the right is another bar shape in gray, labeled C a s 9 expression (codon optimized). Its right terminal is labeled N L S. The guide R N A gene undergoes transcription to form a functional synthetic guide R N A (s g R N A). The C a s 9 gene undergoes transcription and translation to form a C a s 9 protein. Illustration b shows a space-filling model of C a s 9 which encloses the guide R N A, target D N A, the scaffold R N A and the bacterial D N A. It also has two D N A cleavage sites. Illustration c has a Genomic D N A with a promoter, a middle target sequence and a gene of interest. C a s 9 binds the guide R N A to the target sequence. Distinct C a s 9 nuclease sites cleave the target D N A. C a s 9 induces a double-strand break at target sequence. The first part of the illustration d shows the nonhomologous ends joining, where a short deletion disrupts open reading frame to yield an m R N A. The second part shows
homology-directed repair (H D R). A H D R template with specific change is formed which undergoes homologous recombination to yield a specific change introduced genomic D N A, which yields an m R N A with the specific change. A particularly efficient way to modify the germ line of a mouse begins with the microinjection of Cas9 mRNA and a guide RNA into a mouse zygote. The resulting double-strand break in the specific target sequence is typically repaired by a set of enzymes that ligate the free DNA ends back together in a process known as nonhomologous end joining (Figure 6-40d). Typically, a few base pairs are deleted at the site of cleavage because nucleases remove bases from the free DNA ends before the end joining reaction is completed. If the cleavage site is within a gene-coding sequence, the deletion of several bases will usually cause a frameshift mutation, thus producing a loss of function mutation that inactivates the targeted gene. An important refinement of this method of genome editing allows exact single-base changes in the target DNA to be produced. This method first requires targeting Cas9 cleavage close to the site of the desired single-base change. With the addition of a segment of DNA, typically about 100-nt long, that matches the sequences flanking the cleavage site and contains the desired single base mutation, the free ends can be repaired by homologous recombination using the added homologous DNA segment, leaving the single-base mutation in the repaired DNA (see Figure 6-40d). In a dramatic demonstration of this genome editing method, a single-base mutation was corrected in Crygc, a gene for gamma-crystallin that leads to the formation of cataracts. The mutated allele was corrected back to the
wild-type form by injection of a mutant mouse zygote with Cas9 mRNA, a guide RNA that directs cleavage at the site of the mutation, and a 90-nt DNA segment spanning the cleavage site and containing the wild-type Crygc sequence. This experiment also illustrates the remarkable selectivity of CRISPR-Cas9 targeting, since the guide RNA was able to discriminate between the mutant and wild-type alleles even though they differed by only one base pair. Genome-Wide CRISPR Screens The ability of CRISPR genome editing to produce genetically modified mammals, including humans, has sparked both public interest and controversy. But from the perspective of cell biologists hoping to learn more about cell function, genome editing by CRISPR of somatic cells grown in culture is a powerful (and not at all controversial) research tool for exploring the function of mammalian genes in the context of a living cell. One of the most significant extensions of genome editing to somatic cells is the ability to test in a single experiment the effects of loss of function mutations in each of approximately 20,000 mammalian genes. One way to do this would be to transfect cultured cells with the gene for Cas9 and a gene for a guide RNA specifically targeting an exon of a selected gene. To test for the effects of loss of function of each of 20,000 mammalian genes would require 20,000 different transfections and 20,000 different phenotypic assays of the CRISPR edited cell lines. As was the case for screening the collection of yeast gene deletions, a much more efficient way to conduct such a screen would be to pool all 20,000
transfected cell lines and then to use the sequence of the guide RNA as a unique molecular tag to follow the growth of each individual cell line. To see how such a pooled screen would work, suppose we wanted to identify genes that, when mutated, conferred resistance to Taxol, an anticancer drug which interferes with the function of microtubules during cell division. First, a collection of cells transfected with genes for Cas9 and with a guide RNA for each of 20,000 different genes is generated as a large pool. Next DNA isolated from the pool is subjected to large-scale sequencing of the transfected guide RNA genes such that separate guide RNA gene sequences are determined from the pool. The relative number of reads corresponding to each specific guide RNA will give a count of the relative numbers of cells carrying each guide RNA and provide a baseline for the experiment. After pooled cells have been exposed to Taxol for a period of time long enough for the number of Taxol-sensitive cells to decline substantially (e.g., 36 hours), the guide RNA genes in the pool are sequenced again. The typical cell line would decrease in relative number compared to a baseline determined at the start of the experiment because sensitivity to Taxol would have slowed cell growth. However, the relative number for some cell lines would increase after Taxol treatment. These would contain guide RNA genes that promote mutations that increase resistance to Taxol. Some cell lines would show an even greater decrease in relative number relative to the average cell line; this would indicate that the corresponding guide RNA genes promoted mutations that cause hypersensitivity to Taxol. Thus in a single large experiment, the effect of CRISPR inactivation of every gene in the mammalian genome can be tested for increased resistance or sensitivity to
Taxol — an important advance in identifying all of the genes that may play a role in modulating the efficacy of Taxol as an anticancer agent. Inducible Activation of CRISPR A significant limitation of genome editing using CRISPR, which generally produces loss of function mutations, is that mutations in essential genes are difficult to study. Moreover, for some genes, it is often desirable to study the effects of gain-of-function alleles. Examples are the genes for proteins involved in signal transduction or gene regulation. In such cases, it is desirable to transiently increase or decrease the expression of a given gene rather than permanently inactivate it by genome editing. The CRISPR system has been adapted for this purpose through the development of two different systems, one for transiently decreasing gene expression and one for increasing it. One system, known as CRISPRi, targets Cas9 to the promoter so as to interfere with transcription initiation, whereas a complementary gene-activating system, known as CRISPRa, activates transcription of a gene of interest by delivering a transcriptional activation domain to its promoter (Figure 6-39). Both CRISPRi and CRISPRa employ a modified version of Cas9 with the endonuclease activity inactivated (this nuclease dead form is called dCas9). When dCas9 is targeted to the promoter region of a gene by transiently expressing an appropriate guide RNA, dCas9 will bind to the promoter without cleaving the DNA. For CRISPRi, dCas9 is targeted to a region of the promoter that will directly compete with the ability of RNA polymerase to initiate transcription and thus will transiently interfere with gene expression. For CRISPRa, dCas9 is fused to a powerful transcription activation domain
that will cause a transient activation of gene expression when this hybrid protein is targeted to a promoter.
FIGURE 6-39 CRISPR-Cas9 engineered to produce transient inactivation or hyperactivation of a gene. (a) CRISPR interference (CRISPRi) can be used to inactivate transcription of a specific gene. For CRISPRi, a synthetic guide RNA is designed to target the RNA polymerase binding region within the promoter for a gene of interest. When this guide RNA is expressed together with a mutated form of Cas9 that lacks endonuclease activity (dCas9), the guide RNA will direct dCas9 to bind to the promoter, preventing RNA polymerase from binding and thus blocking transcription of the gene. (b) CRISPRa employs a similar strategy except that the region targeted by the guide RNA is upstream of the promoter of interest and dCas9 is fused to a powerful transcription activation domain (dCas9-VP16). When dCas9-VP16 is targeted to the promoter region of the gene of interest the activation domain will activate transcription of that gene. Description The illustration labeled C R I S P R interference (C R I S P R i) has gene named d C a s 9 represented by a bar with two parallel lines on both sides. It has a species-specific promoter, a middle gray region labeled C a s 9 with inactive nuclease having two red crosses. There is a s g R N A gene represented by a red and pink colored bar with two parallel lines on both sides. It has a species specific promoter, a target sequence (red part) and the t r a c r R N A 9 (pink part). The d C a s 9 gene undergoes transcription and translation to produce a d C a s 9 protein molecule. The s g R N A gene undergoes transcription to yield functional synthetic guide R N A. The genomic D N A has a target sequence a promoter and the gene of interest. In the genomic D N A d C a s 9 and s g R N A binds to the target sequence in promoter and interferes with gene transcription. The illustration labeled C R I S P R activation (C R I S P R a) has gene named d C a s 9 represented by a gray and blue colored bar with two parallel lines on both sides. It has a species-specific promoter, a middle gray region labeled d C a s 9 and the blue region labeled V P 16 activation domain. There is a s g R N A gene represented by a red and pink colored bar with two parallel lines on both sides. It has a species-specific promoter, a target sequence (red part) and the t r a c r R N A 9 (pink part). The d C a s 9 gene undergoes transcription and translation to produce a d C a s 9- V P 16 fusion protein. The s g R N A gene undergoes transcription to yield functional synthetic guide R N A. The genomic D N A has a target sequence a promoter and the gene of interest.
Somatic Cell Recombination Can Inactivate Genes in Specific Tissues of Mice
In the genomic D N A d C a s 9-V P 16 and s g R N A binds near promoter and activates gene transcription. Somatic Cell Recombination Can Inactivate Genes in Specific Tissues of Mice The same principles applied to genetically modify yeast by homologous recombination can be applied to mammalian genes. The use of homologous recombination to replace a normal mouse gene by a gene knockout has been a historically important way to construct null alleles of mouse genes, but these methods have been largely replaced by the powerful CRISPR-Cas9 genome editing methods. However, investigators are often interested in examining the effects of knockout mutations in a particular tissue of the mouse, at a specific stage in development. The problem is that mice carrying a germ-line mutation may have defects in numerous tissues or die before the developmental stage of interest. To address this problem, mouse geneticists have devised a clever technique to inactivate target genes in specific types of somatic cells or at particular times during development. In the first stage of this procedure, a DNA construct containing a specifically modified allele of a particular target gene is introduced into embryonic stem (ES) cells. These cells, which are derived from the blastocyst, can be grown in culture through many generations (see Figure
22-6). In a small fraction of transfected cells, the introduced DNA undergoes homologous recombination with the target gene, although recombination at nonhomologous chromosomal sites occurs much more frequently. To enable selection for cells in which the construct allele has successfully replaced the target gene, the recombinant DNA construct introduced into ES cells includes the selectable marker , which confers resistance to G-418. To produce mice carrying this construct in their genome, modified ES cells are injected into a recipient wild-type mouse blastocyst, which subsequently is transferred into a pseudopregnant female mouse. The resulting progeny will be chimeras, containing tissues derived from both the transplanted ES cells and the host cells. Chimeric mice are then mated with mice that are homozygous for another allele of the marker trait to determine if the knockout mutation has been incorporated into the germ line. Finally, mating of mice, each heterozygous for the knockout allele, will produce progeny homozygous for the knockout mutation. Homologous recombination can also be used to produce a mouse in which the gene of interest has been inactivated in only a single tissue. This technique employs short DNA recombination sites (called loxP sites) and the enzyme Cre that catalyzes recombination between them. The loxP-Cre recombination system is derived from bacteriophage P1, but this sitespecific recombination system also functions when placed in mouse cells. An essential feature of this technique is that expression of Cre is controlled by a promoter specific to a single cell type. In loxP-Cre mice generated by the procedure depicted in Figure 6-40, inactivation of the gene of interest (X) occurs only in cells in which the promoter controlling
the cre gene is active. By using different promoters, researchers can study the effects of knocking out gene X in various types of cells. EXPERIMENTAL FIGURE 6-40 The loxP-Cre recombination system can knock out genes in specific cell types. The outlined protocol is designed to produce a knockout of a target gene (GeneX) targeted to a specific cell type. A a loxP mouse contains the conditional gene X knockout generated by inserting loxP sites (purple) on each side of an essential exon (exon 2) of the target gene (blue). Since the loxP sites are in introns, they do not disrupt the function of gene X. The Cre mouse carries the cre gene (orange) from bacteriophage P1 expressed from a mouse promoter specific for the desired cell-type (yellow). The cre gene is incorporated into the mouse genome by nonhomologous recombination and does not affect the function of endogenous mouse genes. The Cre mouse is also heterozygous for a gene X knockout allele. Crossing these two strains
generates among the progeny loxP-Cre mice that contain as the only functional copy of gene X the conditional knockout construct as well as having regulated expression of cre. Cre protein produced only in those cells in which the promoter is active will catalyze recombination between the loxP sites, leading to deletion of exon 2 and a complete loss of function of gene X in all cells expressing Cre. Description The procedure the preparing mice with X knockout using the l o x P-C r e combination is summarized as follows. At the top, there are two illustrations. The left is of a mouse labeled l o x P mouse and having the note: All cells carry endogenous gene X with l o p P sites flanking exon 2. The right of a mouse labeled C r e Mouse and having the note: heterozygous for gene X knockout; all cells carry C r e gene. Below each illustration is a color coded bar diagram of the genes involved. Then a downward arrow points to another bar diagram under the left mouse with the label: cells not expressing C r e. On the right, is a diagram labeled Cells expressing C r e. This bar diagram is now curled around a light red circle labeled C r e protein. Under this diagram is the note: Gene function is disrupted. A third mouse picture is in a box and is labeled l o x P-C r e mouse, and having the note: All cells carry one copy of l o x P modified X and one copy of gene X knockout and C r e genes. An early application of this technique provided strong evidence that a particular neurotransmitter receptor is important for learning and memory. Previous pharmacological and physiological studies had indicated that normal learning requires the NMDA class of glutamate receptors in the hippocampus, a region of the brain. But mice in which the gene encoding an NMDA receptor subunit was knocked out died shortly after birth, precluding analysis of the receptor’s role in learning. Following the protocol in Figure 6-40, researchers generated mice in which the receptor subunit gene was inactivated in the hippocampus but expressed in other
RNA Interference Causes Gene Inactivation by Destroying the Corresponding mRNA
tissues. These mice survived to adulthood and showed learning and memory defects, confirming a role for these receptors in the ability of mice to encode their experiences into memory. RNA Interference Causes Gene Inactivation by Destroying the Corresponding mRNA First observed in the roundworm C. elegans, RNA interference (RNAi) refers to the ability of double-stranded RNA to block expression of its corresponding single-stranded mRNA, but not that of mRNAs with a different sequence. The phenomenon provides a straightforward method to inhibit transiently the function of specific genes. As described in Chapter 9, the phenomenon of RNAi rests on the ability of eukaryotic cells to cleave double-stranded RNA into short (23-nt) doublestranded segments known as small inhibitory RNAs (siRNAs). The RNA endonuclease that catalyzes this reaction, known as Dicer, is found in all metazoans, but not in simpler eukaryotes such as yeast. The siRNA molecules, in turn, can cause cleavage of mRNA molecules of matching sequence, in a reaction catalyzed by a protein complex known as RISC. Attached to RISC, one strand of the siRNA recognizes and hybridizes with its complementary sequence on the target mRNA; subsequently, specific nucleases in the RISC complex cleave the mRNA-siRNA hybrid. This model accounts for the specificity of RNAi, since it depends on base pairing, and for its potency in silencing gene function, since the
complementary mRNA is permanently destroyed by nucleolytic degradation. The normal function of both Dicer and RISC is to allow for gene regulation by small endogenous RNA molecules known as microRNAs, or miRNAs. Researchers can exploit the microRNA pathway to intentionally silence a C. elegans gene of interest by using either of two general methods for generating siRNAs of defined sequence. In the first method, a doublestranded RNA corresponding to the target-gene sequence is produced by in vitro transcription of both sense and antisense copies of that sequence (Figure 6-41a). This dsRNA is then injected into the gonad of an adult worm, where it is converted to siRNA by Dicer in the developing embryos. In conjunction with the RISC complex, the siRNA molecules cause the corresponding mRNA molecules to be destroyed rapidly. The resulting worms display a phenotype similar to the one that would result from disruption of the target gene itself. In some cases, insertion of just a few molecules of a particular dsRNA into a cell is sufficient to inactivate many copies of the corresponding mRNA. Figure 6-41b illustrates the ability of an injected dsRNA to interfere with the production of the corresponding endogenous mRNA in C. elegans embryos. In this experiment, the mRNA levels in embryos were determined by in situ hybridization, as described earlier, using a fluorescently labeled probe.
EXPERIMENTAL FIGURE 6-41 RNA interference (RNAi) can inhibit gene function in C. elegans and other organisms. (a) In vitro production of double-stranded RNA (dsRNA) for interference with a specific target gene. The coding sequence of the gene, derived from either a cDNA clone or a segment of genomic DNA, is placed in two orientations in a plasmid vector adjacent to a strong promoter. Transcription of both constructs in vitro using RNA polymerase and ribonucleoside triphosphates yields many RNA copies in both the sense orientation (identical to the mRNA sequence) and the complementary antisense orientation. Under suitable conditions, these complementary RNA molecules hybridize to form dsRNA. When the dsRNA is injected into cells, it is cleaved by Dicer into siRNAs. (b) Inhibition of mex3 RNA expression in C. elegans embryos by RNAi (see the text for the mechanism). Expression of mex3 RNA in embryos was assayed by in situ hybridization to a probe specific for this mRNA, linked to an enzyme that produces a colored (purple) product. (Left) Wild-type embryo. (Right) Embryo derived from a worm injected with double-stranded mex3 RNA. Each four-cell-stage embryo is ∼50 mm in length. (c) In vivo production of double-stranded RNA via an engineered plasmid introduced directly into cells. The synthetic gene construct is a tandem arrangement of both sense and antisense sequences of the target gene. When it is transcribed, double-stranded small hairpin RNA (shRNA) forms. The shRNA is cleaved by Dicer to form siRNA. [Reprinted by permission from Macmillan Publishers Ltd, from A. Fire, 1998. Potent and specific genetic interference by double-stranded RNA in Caenorhabditis elegans. Nature, 391(6669):806–811; permission conveyed through Copyright Clearance Center, Inc.] Description Production of double-stranded R N A in vitro: a plasmid has a gene of interest labeled S E N S E. a sense transcript that runs from 5 prime to 3 prime direction is formed. Another plasmid has a gene of interest labeled E S N E S. An antisense transcript runs from 5 prime to three prime directions. The sense strand and the antisense strand come together to form a d s R N A. A downward arrow labeled dicer points to s i R N A which is represented by two opposite sided arrows. Micrographs show a comparison of C. elegans embryos derived from adults injected with m e x 3 R N A and noninjected. The embryo of the injected worm is colored purple. The embryo from the noninjected adult is colorless. Both four-cell-stage embryos are 50 mm in length.
Production of double-stranded R N A in vivo: A plasmid has the hairpin construct gene. A sense transcript is produced, which runs from 5 prime to 3 prime direction. A hairpin loop id formed by this transcript which is labeled s h R N A. A downward arrow labeled dicer points to s i R N A which is represented by two opposite sided arrows. The second method is to produce a specific double-stranded RNA in vivo. An efficient way to do this is to express a synthetic gene that is designed to contain tandem segments of both sense and antisense sequences corresponding to the target gene (Figure 6-41c). When this gene is transcribed, a double-stranded RNA hairpin structure forms, known as small hairpin RNA, or shRNA. The shRNA will then be cleaved by Dicer to form siRNA molecules. The lentiviral expression vectors are particularly useful for introducing synthetic genes for the expression of shRNA constructs into animal cells. Both RNAi methods lend themselves to systematic studies in which researchers inactivate each of the known genes in an organism and observe what goes wrong. For example, in initial studies with C. elegans, RNA interference with 16,700 genes (about 86 percent of the genome) yielded 1722 visibly abnormal phenotypes. The genes whose functional inactivation causes particular abnormal phenotypes can be grouped into sets; each member of a set presumably controls the same signals or events. The regulatory relations between the genes in a set — for example, the genes that control muscle development — can then be worked out.
RNAi-mediated gene inactivation has been successful in many organisms, including Drosophila, many kinds of plants, zebrafish, the frog Xenopus, and mice, and these organisms are now the subjects of large-scale RNAi screens. For example, lentiviral vectors have been designed to inactivate by RNAi more than 10,000 different genes expressed in cultured mammalian cells. The functions of the inactivated genes can be inferred from defects in the growth or morphology of cell clones transfected with lentiviral vectors. KEY CONCEPTS OF SECTION 6.6 Altering the Function of Specific Genes by Design Once a gene has been cloned, important clues about its normal function in vivo can be deduced from the observed phenotypic effects of mutating the gene. Genes can be disrupted in yeast by inserting a selectable marker gene into one copy of a wild-type gene via homologous recombination, producing a heterozygous mutant. When such a heterozygote forms spores, two nonviable haploid spores will be produced (see Figure 6-37). Each yeast gene deletion has been tagged with a unique DNA sequence that can serve as a molecular bar code that allows the growth of individual deletion strains to be traced in a pooled population containing all of the deletion strains. A bacterial system that evolved to precisely target and cleave foreign DNA, known as CRISPR, has been adapted for introducing specific changes in the genomic DNA of many organisms. Cleavage of chromosomal DNA at a specific site by CRISPR-Cas9 usually results in a short deletion at the cleavage site. If an appropriately designed DNA segment is provided by transfection, specific DNA changes, such as point mutations, can be introduced at the cleavage site (see Figure 6-39). All genes in the mammalian genome can be disrupted by CRISPR-Cas9 genome editing, and the growth properties of specific gene disruptions in a pooled population can be traced. Cas9 protein with an inactivated nuclease can be used for the transient interference (CRISPRi) or activation (CRISPRa) of a targeted gene. In mice, modified genes can be incorporated into the germ line at their original genomic location by homologous recombination. The loxP-Cre recombination system
permits production of mice in which a gene is knocked out in a specific tissue. In many organisms, including the roundworm C. elegans, double-stranded RNA triggers destruction of the all the mRNA molecules with the same sequence. This phenomenon, known as RNAi (RNA interference), provides a specific and potent means of inactivating genes without altering their structure.
Key Terms
End of Chapter Visit Achieve to access study tools and to learn more about the content in this chapter: Perspectives for the Future Analyze the Data Chapter References Additional study tools, including videos, animations, and quizzes Key Terms alleles clone complementary DNA (cDNA) conservation
DNA cloning DNA library DNA microarray dominant functional complementation genome-wide association study (GWAS) genotype heterozygous homozygous
Review the Concepts
hybridization in situ hybridization linkage mutagen mutation open reading frames (ORFs) phenotype plasmids point mutation polymerase chain reaction (PCR) recessive recombinant DNA recombination restriction enzymes RNA interference (RNAi) RNA-Seq segregation single cell RNA-Seq (scRNA-Seq) structural motifs transfection transformation vector whole transcriptome shotgun sequencing (RNA-Seq) wild type Review the Concepts
1. Genetic mutations can provide insights into the mechanisms of complex cellular or developmental processes. How might your analysis of a genetic mutation be different depending on whether a particular mutation is recessive or dominant? 2. What is a temperature-sensitive mutation? Why are temperaturesensitive mutations useful for uncovering the function of a gene? 3. Describe how complementation analysis can be used to reveal whether two mutations are in the same or in different genes. Explain why complementation analysis will not work with dominant mutations. 4. Restriction enzymes and DNA ligase play essential roles in DNA cloning. How is it that a bacterium that produces a restriction enzyme does not cut its own DNA? Describe some general features of restriction sites. What are the three types of DNA ends that can be generated after cutting DNA with restriction enzymes? What reaction is catalyzed by DNA ligase? 5. Bacterial plasmids often serve as cloning vectors. Describe the essential features of a plasmid vector. What are the advantages and applications of plasmids as cloning vectors? 6. A DNA library is a collection of clones, each containing a different fragment of DNA, inserted into a cloning vector. What is the difference between a cDNA library and a genomic DNA library? Suppose you would like to clone gene X, a gene expressed only in neurons, into a vector using a library as the source of the insert. You have the following libraries at your disposal: a genomic library from skin cells, a cDNA library from skin cells, a genomic library from neurons, and a cDNA library from neurons. Which could you use, and why?
7. In 1993, Kary Mullis won the Nobel Prize in Chemistry for his invention of the PCR process. Describe the three steps in each cycle of a PCR reaction. Why was the discovery of a thermostable DNA polymerase so important for the development of PCR? 8. A number of foreign proteins have been expressed in bacterial and mammalian cells. Describe the essential features of a recombinant plasmid that are required for expression of a foreign gene. How can the foreign protein be modified to facilitate its purification? What is the advantage of expressing a protein in mammalian cells versus expressing the same protein in bacteria? 9. RT-PCR and microarrays can be used to analyze gene expression. A lab studies yeast cells, comparing their growth in two different sugars, glucose and galactose. One student is comparing expression of the gene HMG2 under these two conditions. Which technique(s) could he use and why? Another student wants to compare expression of all the genes on chromosome 4, of which there are approximately 800. What technique(s) could she use and why? 10. What are paralogous and orthologous genes? What are some of the explanations for the finding that humans are a much more complex organism than the roundworm C. elegans, yet have only 5 percent more protein-coding genes (21,000 versus 20,000)? 11. In determining the identity of the protein that corresponds to a newly discovered gene, it often helps to know the pattern of tissue expression for that gene. For example, researchers have found that a gene called SERPINA6 is expressed in the liver,
kidney, and pancreas but not in other tissues. What techniques might researchers use to find out which tissues express a particular gene? 12. DNA polymorphisms can be used as DNA markers. Describe the differences between SNPs and STR polymorphisms. How can these markers be used for DNA-mapping studies? 13. How can linkage-disequilibrium mapping sometimes provide a much higher resolution of gene location than classical linkage mapping? 14. Genetic linkage studies can usually locate the chromosomal position of a disease gene only roughly. How can expression analysis and DNA sequence analysis help locate a disease gene within the region identified by linkage mapping? 15. The ability to selectively modify the genome in the mouse has revolutionized mouse genetics. Outline the procedure for generating a knockout mouse at a specific genetic locus. How can the loxP-Cre system be used to conditionally knock out a gene? What is an important medical application of knockout mice? 16. Two methods for functionally inactivating a gene without altering the gene sequence involve dominant-negative alleles and RNA interference (RNAi). Describe how each method can inhibit expression of a gene.