Introduction
Chapter 8 Transcriptional Control of Gene Expression Drosophila polytene chromosomes stained with antibodies against a chromatin-remodeling ATPase called Kismet (blue), RNA polymerase II with low CTD phosphorylation (red), and RNA polymerase II with high CTD phosphorylation (green). [Reproduced with permission from The Company of Biologists, from S. Srinivasan et. al., 2005, “The Drosophila Trithorax Group Protein Kismet Facilitates an Early Step in
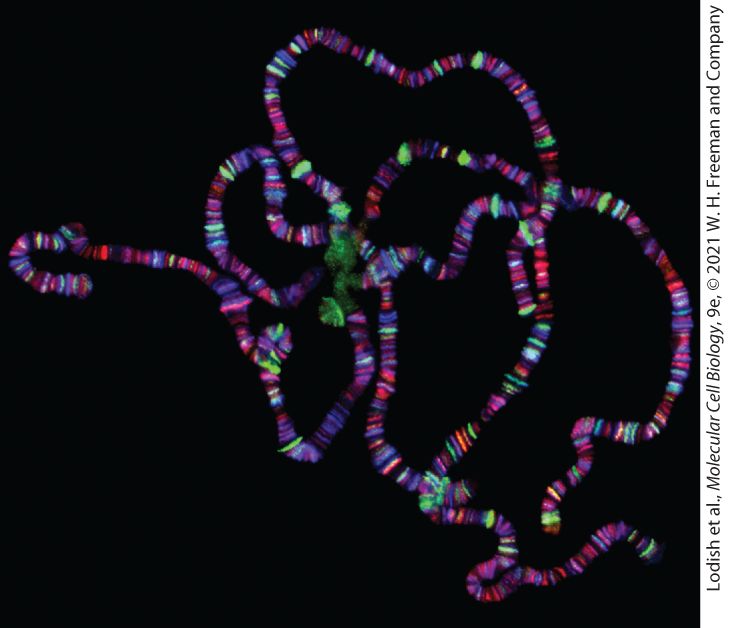
Trascriptional Elongation by RNA Polymerase II,” Development 132:7, 1623–1635; permission conveyed through Copyright Clearance Center, Inc.]
8.2 RNA Polymerase II Promoters and General Transcription Factors
8.3 Regulatory Sequences for Protein-Coding Genes and the Proteins Through Which They Function
8.4 Molecular Mechanisms of Transcription Repression and Activation
8.7 Other Eukaryotic Transcription Systems In previous chapters, we have seen that the properties and functions of each cell type are determined by the proteins it contains. In this chapter and the next, we consider how the kinds and amounts of the various proteins produced by a particular cell type in a multicellular organism are regulated. This regulation of gene expression is the fundamental process that controls the development of multicellular organisms such as ourselves from a single fertilized egg cell into the thousands of cell types of which we are made. When gene expression goes awry, cellular properties are altered, a process that all too often leads to the development of cancer. As discussed further in Chapter 25, genes encoding proteins that restrain cell growth are abnormally repressed in cancer cells, whereas genes encoding proteins that promote cell growth and replication are inappropriately activated in cancer cells. Abnormalities in gene expression also result in developmental defects such as cleft palate, tetralogy of Fallot (a serious
developmental defect of the heart that can be treated surgically), and many others. The basic steps in gene expression — that is, the entire process whereby the information encoded in a particular gene is decoded into a particular protein — are reviewed in Chapter 5. Synthesis of mRNA requires that an RNA polymerase initiate transcription (initiation), polymerize ribonucleoside triphosphates complementary to the DNA-coding strand (elongation), and then terminate transcription (termination). In bacteria, ribosomes and translation initiation factors have immediate access to newly formed RNA transcripts, which function as mRNA without further modification. In eukaryotes, however, the initial RNA transcript is subjected to processing that yields a functional mRNA (see Figure 5-27). The mRNA then is transported from its site of synthesis in the nucleus to the cytoplasm, where it is translated into protein with the aid of ribosomes, tRNAs, and translation factors. Regulation occurs at several of the steps in gene expression outlined above: transcription initiation, elongation, RNA processing, and mRNA export from the nucleus, as well as through control of mRNA degradation, mRNA translation into protein, and protein degradation. The diversity of options for regulating gene expression results in differential protein expression that varies among cell types, developmental stages, or in response to external conditions. Although examples have been found of regulation at each step in gene expression, in multicellular animals (metazoans), the control of transcription initiation and elongation are the most important mechanisms (Figure 8-1). The molecular mechanisms that
regulate transcription initiation and elongation are critical for normal development of a multicellular organism, for proper immune responses that protect us from pathogenic microorganisms, and for neurological processes such as learning and memory. When these regulatory mechanisms controlling transcription function improperly, pathological processes may occur. For example, mutations of the HOXD13 gene result in polydactyly, the embryological development of extra digits of the feet and hands (Figure 8-2a). HOXD13 encodes a transcription factor that regulates transcription of multiple genes involved in development of the extremities. Other mutations affecting the function or expression of transcription factors cause an extra pair of wings to develop in Drosophila (Figure 8-2b) or alter the structures of flowers in plants (Figure 8-2c), among many other developmental abnormalities.
FIGURE 8-1 Contributions of the major processes that regulate protein concentrations. The concentration of a protein is controlled by regulation of the frequency with which the mRNA encoding the protein is synthesized (gene transcription), the rate at which that mRNA is degraded, the rate at which that mRNA is translated into protein, and the rate at
which that protein is degraded. The relative contributions of these four rates to determining the concentrations of thousands of proteins in cultured mouse fibroblasts were determined by mass spectrometry to measure protein concentrations (see Chapter 3), mRNA sequencing (RNA-seq) to measure mRNA levels (see Chapter 6), protection of mRNA from ribonuclease digestion by associated ribosomes (ribosome footprinting) to estimate translation rates, stable isotope labeling to determine degradation rates, and statistical analysis of the data to correct for inherent biases and errors in these methods. [Data from J. J. Li and M. D. Biggin, 2014, Science 347:1066.] Description The information presented in the pie chart is as follows: rates of transcription, 73 percent; m R N A degradation, 11 percent; m R N A translation, 8 percent; and protein degradation, 8 percent.
FIGURE 8-2 Phenotypes of mutations in genes encoding transcription factors. (a) A dominant mutation in the human HOXD13 gene results in the development of extra digits, a condition known as polydactyly. (b) Homozygous recessive mutations that prevent expression of the Ubx gene in the third thoracic segment of Drosophila result in transformation of that segment, which normally has a balancing organ called a haltere, into a second copy of the thoracic segment that develops wings. (c) Mutations in Arabidopsis thaliana that inactivate both copies of three floral organ–identity genes transform the normal parts of the flower into leaflike structures. In each case, these mutations affect master regulatory transcription factors that regulate multiple genes, including many genes encoding other transcription factors. [Part (a) right: Republished with permission of John Wiley & Sons, Inc., from F. R. Goodman and P. J. Scrambler, 2001, “Human Hox Gene Mutations,” Clin. Genet. 59(1):1– 11. Part (b) Reproduced with permission from E. B. Lewis, “The Bithorax Complex: The First Fifty Years,” Int. J. Dev. Biol. 42:403–415, Figures 4a and 4b. Part (c) Republished with permission of Elsevier, from D. Weigel and M. Meyerowitz, 1994, “The ABCs of Floral Homeotic Genes,” Cell 78(2):203–209; permission conveyed through Copyright Clearance Center, Inc.] Description Photo (a) shows phenotypes of mutations in the genes of a human baby. The normal phenotype is a foot with 5 toes, the abnormal one has 6 toes Photo (b) shows normal fruit fly with two body segments, one pair of wings, and a head and a fruit fly with an extra thorax segment and two sets of wings. Photo (c) shows two arabidopsis flowers, one normal with four petals and white color, and the other with homozygous recessive mutations in a p 2, p i 1, and a g 1 genes, resulting in the flower having many green leaf-like petals. Transcription is a complex and highly regulated process that results in the expression of specific genes in specific cell types, despite the fact that nearly all cells contain the same chromosomes with the same DNA sequences. In this chapter, we focus on the molecular events in eukaryotic
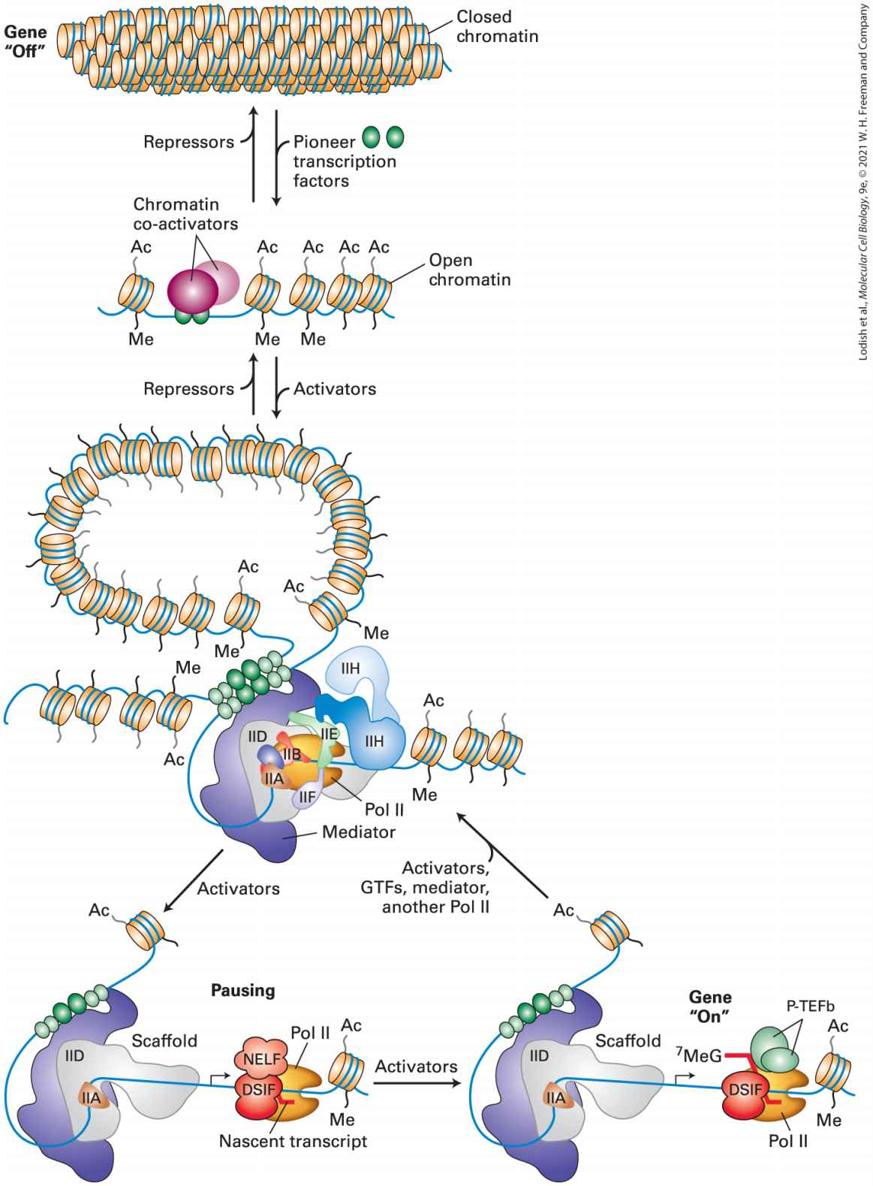
cells that determine when transcription of a gene occurs. Eukaryotic transcription regulation mechanisms make use of the association of DNA with histone octamers, by forming chromatin structures with varying degrees of condensation, and through post-translational modifications of histone tails (Figures 7-26 and 7-28). Figure 8-3 provides an overview of transcription regulation in metazoans and of the processes outlined in this chapter. We discuss how the RNA polymerases responsible for transcription of different classes of eukaryotic genes bind to promoter sequences to initiate the synthesis of an RNA molecule and how specific DNA sequences function as transcription-control regions by serving as the binding sites for transcription factors that regulate transcription. Next we consider how eukaryotic activators and repressors influence transcription through interactions with large multiprotein complexes. Some of these multiprotein complexes modify chromatin condensation, altering the accessibility of chromosomal DNA to transcription factors and RNA polymerases. Other complexes directly influence the frequency at which RNA polymerases bind to promoters and initiate transcription. In metazoans, the RNA polymerase pauses after transcribing a short RNA, and one mechanism for regulating transcription of a gene involves release of the paused polymerase, allowing it to transcribe the rest of the gene. We discuss how transcription of specific genes can be specified by particular combinations of the roughly 1600 transcription factors encoded in the human genome, giving rise to cell-type-specific gene expression. We consider the various ways in which the activities of transcription factors themselves are controlled to ensure that genes are expressed only in the correct cell types and at the appropriate time during their differentiation.
FIGURE 8-3 Overview of eukaryotic transcriptional control. Inactive genes are assembled into regions of condensed chromatin that inhibit RNA polymerases and their initiation factors from binding to promoters. A pioneer transcription factor is able to bind to a specific regulatory sequence in DNA within the condensed chromatin and interact with chromatin co-activators that decondense, acetylate (Ac), and methylate (Me) the chromatin, thus making the DNA more accessible to binding by other activators (green), RNA polymerase II (the polymerase that transcribes protein coding genes), and its general transcription factors (IIA, IIB, … IIH). Additional activator proteins bound to both promoter-proximal sites and to distant enhancers interact with one another and with the multisubunit Mediator complex to assemble RNA polymerase II (Pol II) and general transcription factors on promoters. Alternatively, repressor proteins bind to other transcription-control elements to inhibit transcription initiation by Pol II. They do this by associating with multiprotein co-repressor complexes to condense chromatin. During transcriptional activation, Pol II initiates transcription, but pauses after transcribing fewer than 100 nucleotides due to the action of an elongation inhibitor (NELF) associated with a protein that clamps the polymerase on the DNA template (DSIF). Activators promote the association of the paused complex with an elongation factor (P-TEFb) that releases NELF and allows productive elongation through the gene. See S. Malik and R. G. Roeder, 2010, Nat. Rev. Genet. 11:761. Description The flow diagram uses small cylindrical shapes as chromatin, which is then acted upon by activators and repressors to move into a chain of cylinders with transcription happening to the cylinders within a larger blue circular shape. The path through the circular shape is then enlarged to show four steps from the building of a scaffold, to nascent transcript with activators that turn the gene "on." We also discuss recent studies revealing that RNA-protein complexes in the nucleus can regulate transcription. New methods for sequencing DNA, coupled with reverse transcription of RNA into DNA in vitro, have revealed that much of the genome of eukaryotes is transcribed into low-
abundance RNAs that do not encode proteins. Several nuclear long noncoding RNAs (lncRNAs) regulate the transcription of protein-coding genes. This finding raises the possibility that transcriptional control by noncoding RNAs may be much more general than is currently understood. Recent advances in mapping the association of transcription factors with specific regions of chromatin across the entire genome in a variety of cell types have provided the first glimpses of how transcription factors regulate embryonic development from the pluripotent stem cells of the early embryo to the fully differentiated cells that make up most of our tissues. RNA processing and various post-transcriptional mechanisms for controlling eukaryotic gene expression are covered in Chapter 9. Subsequent chapters, particularly Chapters 15, 16, and 21, provide examples of how transcription is regulated by interactions between cells and how the resulting gene control contributes to the development and function of the thousands of specific types of cells in multicellular organisms.
8.1 Overview of Eukaryotic Transcription
8.1 Overview of Eukaryotic Transcription In bacteria, gene control serves mainly to allow a single cell to adjust to rapid changes in its environment, such as the availability of nutrients, so that its growth and division can be optimized. In contrast, in multicellular organisms the cellular environment is relatively stable. As with bacteria, though, when sudden changes in the environment do occur, eukaryotic cells rapidly induce sets of genes that protect themselves, as we will see in the cellular responses to heat-shock and hypoxia discussed in Chapter 21. However, the most characteristic and biologically far-reaching purpose of gene control in multicellular organisms is execution of the genetic program that underlies embryological development. Generation of the many different cell types that collectively form a multicellular organism depends on the right genes being activated in the right cells at the right time during the developmental period. In most cases, once a developmental step has been taken by a cell, it is not reversed. In executing their genetic programs, many differentiated cells (e.g., skin cells, red blood cells, and antibody-producing cells) march down a pathway to final cell death, leaving no progeny behind. The fixed patterns of gene control leading to differentiation serve the needs of the whole organism and not the survival of an individual cell.
Regulatory Elements in Eukaryotic DNA Are Found Both Close to and Many Kilobases Away from Transcription Start Sites
Bacteria and eukaryotes share two key features of transcriptional control. First, transcription-control regions are associated with genes. Second, specific proteins that bind to a gene’s transcription-control regions determine where and how frequently transcription will initiate. Eukaryotic cells exploit chromatin structure to regulate transcription; a mechanism of transcriptional control that is not available to bacteria. In multicellular eukaryotes, many inactive genes are assembled into condensed regions of chromatin, which inhibit binding of the RNA polymerases and general transcription factors required for transcription initiation (see Figure 8-3). Activator proteins, which bind to transcription-control regions near the transcription start site of a gene, and also bind to transcription control regions called enhancers located kilobases from the transcription start site, promote chromatin decondensation, binding of RNA polymerase to the promoter, and transcriptional elongation. Repressor proteins, which bind to alternative control elements, cause condensation of chromatin and inhibition of polymerase binding or elongation. In this section, we discuss general principles of eukaryotic gene control. Subsequent sections of this chapter will address specific aspects of eukaryotic transcription regulation in greater detail. Regulatory Elements in Eukaryotic DNA Are Found Both Close to and Many Kilobases Away from Transcription Start Sites
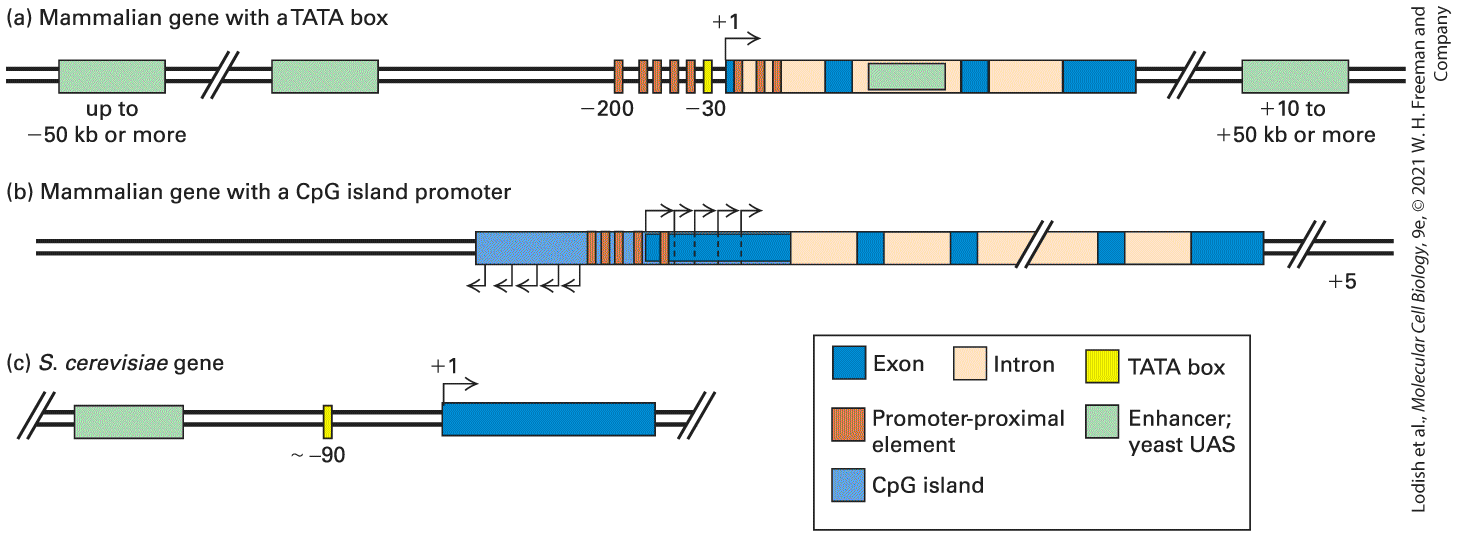
Direct measurements of the transcription rates of multiple genes in different cell types have shown that regulation of transcription, either at the initiation step or during elongation in the promoter proximal region, is the most widespread form of gene control in eukaryotes (as it is in bacteria). In eukaryotes, as in bacteria, a DNA sequence that specifies where RNA polymerase binds and initiates transcription of a gene is called a promoter. Transcription from a particular promoter is controlled by DNA-binding proteins that bind to transcription control regions. Individual eukaryotic transcriptional regulatory proteins often can function to either activate or repress transcription, depending on their associations with other proteins. Consequently, they are referred to by the general term transcription factors. The DNA-control elements in eukaryotic genomes to which transcription factors bind are often located much farther from the promoter they regulate than is the case in bacterial genomes. In some cases, transcription factors bind at regulatory sites tens of thousands of base pairs either upstream (opposite to the direction of transcription) or downstream (in the same direction as transcription) from the promoter. As a result, transcription of a gene may be regulated by the binding of multiple transcription factors to alternative control elements. This directs expression of the same gene in different types of cells at different times during development. For example, several transcription-control regions regulate expression of the mammalian gene encoding the transcription factor Pax6. As mentioned in Chapter 1, Pax6 protein is required for development of the eye. Pax6 is
also required for development of certain regions of the brain and spinal cord and for cells in the pancreas that secrete insulin. Humans with only one functional Pax6 gene are born with aniridia, a lack of irises in the eyes (Figure 1-31d). In mammals, the Pax6 gene is expressed from at least three alternative promoters that function in different cell types and at different times during embryogenesis (Figure 8-4a).
FIGURE 8-4 Transcription-control regions of the mouse Pax6 gene and the orthologous human PAX6 gene. (a) Three alternative Pax6 promoters are used at distinct times during embryogenesis in different tissues of the developing mouse embryo. Transcription-control regions regulating expression of Pax6 in different tissues are indicated by colored rectangles. These control regions are some 200–500 bp in length. (b) Expression of a β-galactosidase reporter transgene fused to the 8 kb of mouse DNA upstream from exon 0. A transgenic mouse embryo 10.5 days after fertilization was stained with X-gal to reveal β-
galactosidase. Lens pit (LP) is the tissue that will develop into the lens of the eye. Expression was also observed in tissue that will develop into the pancreas (P). (c) Expression in a mouse embryo at 13.5 days after fertilization of a β-galactosidase reporter gene linked to the sequence in part (a) between exons 4 and 5 marked Retina. Arrow points to nasal and temporal regions of the developing retina. (d) Human PAX6 control regions identified in the 600-kb region between the upstream gene RCN1 and the promoter of the downstream ELP4 gene. RCN1 and ELP4 are transcribed to the left. Their exons are shown as black rectangles below the line representing the DNA sequence. PAX6 exons are diagrammed as red rectangles above the line. The three PAX6 promoters are shown by rightward arrowheads, and the control regions shown in (a) are represented by gray rectangles. Regions flanking the gene where the sequence is partially conserved in most vertebrates (as in Figure 8-5a) are shown as ovals. Colored ovals represent sequences that cause expression of a transgene in specific neuroanatomical locations in the zebrafish where transcription control regions can be assayed much more rapidly than in transgenic mice. [Part (a) Data from B. Kammendal et al., 1999, Devel. Biol. 205:79. Part (b) Republished with permission of Elsevier, B. Kammendal et al., 1999, “Distinct cis-Essential Modules Direct the Time–Space Pattern of the Pax6 Gene Activity,” Devel. Biol. 205(1): 79–97; permission conveyed through Copyright Clearance Center, Inc. Part (d) Data from S. Bhatia et al., 2014, Devel. Biol. 387:214.] Description Part (a) shows regulation of gene expression in the Pax 6 mouse gene. The Pax 6 gene, which codes Pax 6 in various tissues during embryogenesis, is presented schematically. A scale shows the size of the gene in kilobases, up to approximately 45 kilobases. 15 distinct coding regions are indicated by boxes along the length of the gene; these are labeled 0 through 13 and alpha. Several colored rectangles between these coding regions are transcription control regions, controlling the expression of pax 6 in different tissues. The following tissues are labeled, moving from 5-prime to 3-prime, pancreas, lens and cornea, telencephalon, retina, retina, and di- and rhombo-encephalon. Beneath this, three alternative transcripts are labeled a, b, and c. Transcript a contains coding regions 0, 2, 3, 4, 5, 6, 7, 8, 9, 10, 11, 12, and 13. Transcript b contains 1, 2, 3, 4, 5, 6, 7, 8, 9, 10, 11, 12, and 13 and terminates in a poly-adenine sequence. Transcript c contains alpha, 5, 6, 7, 8, 9, 10, 11, 12, and 13, terminating in a poly-adenine sequence. Part (b) shows an image of a ten and a half day old transgenic mouse
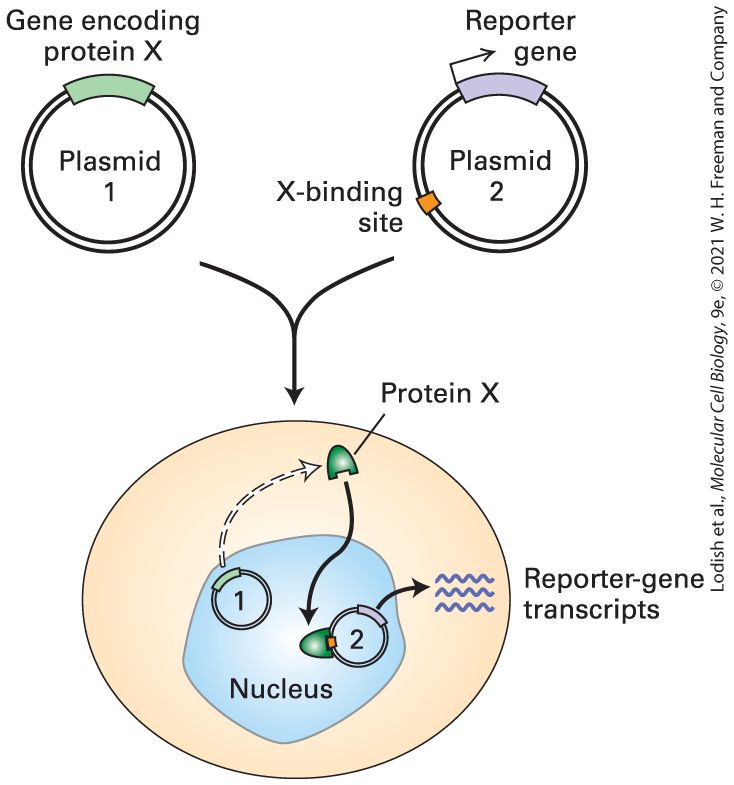
embryo. The embryo is presented in side-view. The lens pit, labeled by lp, is indicated in the head of the embryo. The pancreas, p, is labeled at the base of the embryo. Both lens pit and pancreas are stained green. Part (c) shows an image of a thirteen and a half day old transgenic mouse embryo. The embryo is presented in side-view. The retina is indicated with an arrow and is stained green. Researchers often analyze transcription-control regions by preparing recombinant DNA molecules that combine a fragment of DNA to be tested for its ability to regulate transcription with the coding region for a reporter gene whose expression is easily assayed. Typical reporter genes include the gene that encodes luciferase, an enzyme that generates light that can be assayed with great sensitivity and over many orders of magnitude of intensity using a luminometer. Other frequently used reporter genes encode green fluorescent protein (GFP) and proteins that fluoresce other colors, which can be visualized by fluorescence microscopy (see Figures 4-9d and 4-16), and Escherichia coli β-galactosidase, which generates an intensely blue insoluble precipitate when incubated with the colorless soluble lactose analog X-gal. When transgenic mice are produced containing a β-galactosidase reporter gene fused to 8 kb of DNA upstream from Pax6 exon 0 (see Figure 8-4a), β-galactosidase is observed in the developing lens, cornea, and pancreas of the embryo halfway through gestation (Figure 8-4b). Analysis of transgenic mice with smaller fragments of DNA from this region allowed the mapping of the separate transcription-control regions regulating transcription in the pancreas and in both the lens and cornea. Transgenic mice with other reporter gene constructs revealed additional transcriptioncontrol regions (see Figure 8-4a). These regions control transcription in
the developing retina and in different regions of the developing brain (encephalon). Some of these transcription-control regions are in introns between exons 4 and 5 and between exons 7 and 8. For example, a reporter gene under control of the region labeled Retina in Figure 8-4a between exons 4 and 5 led to reporter-gene expression specifically in the retina (Figure 8-4c). Control regions for many genes are found hundreds of kilobases away from the coding exons of the gene. One method for identifying such distant control regions is to compare the sequences of distantly related organisms. Transcription-control regions for a conserved gene are also often conserved and can be recognized in the background of nonfunctional sequences that diverge during evolution. For example, there is a DNA sequence about 500 kb downstream of the SALL1 gene that is highly conserved among humans, mice, chickens, frogs, and fish (Figure 8-5a). SALL1 encodes a transcription factor required for normal development of the limbs. When transgenic mice were produced containing this conserved DNA sequence linked to a β-galactosidase reporter gene (Figure 8-5b), the transgenic embryos expressed a very high level of β-galactosidase in the developing limb buds (Figure 8-5c). Human patients with deletions in this region of the genome develop with limb abnormalities. These results indicate that this conserved region directs transcription of the SALL1 gene in the developing limb. Presumably, other transcription-control regions regulate expression of this gene in other types of cells, where it functions in the normal development of the ears, the lower intestine, and kidneys. After discussing the proteins that function with RNA polymerase to carry
out transcription in eukaryotic cells, we will return to a discussion of how such distant transcription-control regions, called enhancers, function.
EXPERIMENTAL FIGURE 8-5 The human SALL1 enhancer activates expression of a reporter gene in limb buds of the developing mouse embryo. (a) Graphic representation of the conservation of DNA sequence in a region of the human genome (in the interval of chromosome 16 from 50214 kb to 50220.5 kb) about 500 kb downstream from the SALL1 gene, which encodes a zinc-finger transcription repressor. A region of roughly 500 bp of nonprotein-coding sequence is conserved from zebra fish to human. Nine hundred base pairs of human DNA including this conserved region were inserted into a plasmid next to the coding region for E. coli β-galactosidase. (b) The plasmid was microinjected into a pronucleus of a fertilized mouse egg and implanted in the uterus of a pseudopregnant mouse to generate a transgenic mouse embryo with the reporter-gene-containing plasmid incorporated into its genome. (c) After 11.5 days of development, at the time when limb buds develop, the fixed and permeabilized embryo was incubated in X-gal, which is converted by β-galactosidase into an insoluble, intensely blue compound. The results showed that the conserved region contains an enhancer that stimulates strong transcription of the β-galactosidase reporter gene specifically in limb buds. [Part (a) Data from the VISTA Enhancer Browser, http://enhancer.lbl.gov. Parts (b) Deco/Alamy and (c) Republished with permission of Nature Publishing Group, from L. A. Pennacchio et al., 2006, “In Vivo Enhancer Analysis of Human Conserved Non-Coding Sequences,” Nature 444:499–506; permission conveyed through Copyright Clearance Center, Inc.] Description The line graph shows how similar mouse, chicken, frog and fish D N A sequences are. The first photo shows how an egg cell is microinjected and the other shows reporter genes expressed in the limbs of a mouse embryo. Part (a) shows a comparative analysis of the S A L L 1 gene in human chromosome 16 and other animals as a graph. The y- axis is labeled 'sequence similarity to humans' and the x-axis is labeled 'chromosome 16'. The x-axis units are kilobases. Four sequences are depicted, based on a comparison of D N A from mouse, chickens, frogs, and fish. In the comparative analysis, a region of similarity between fifty-thousand two-hundred and fifteen and fifty-thousand two-hundred and seventeen kilobases is present in the graphs representing all four animals. The mouse sequence includes large portions over the whole range showing similarity to the human gene. Part (b) shows microinjection of a plasmid vector into a fertilized mouse egg. Part (c) shows side-view of a 11 and a half
Three Eukaryotic Nuclear RNA Polymerases Catalyze Formation of Different RNAs
day old mouse embryo. The forelimb and hind limb buds are indicated. Both of these regions are stained dark. Three Eukaryotic Nuclear RNA Polymerases Catalyze Formation of Different RNAs The nuclei of all eukaryotic cells examined so far contain three different RNA polymerases, designated I, II, and III. These enzymes elute at different salt concentrations during ion-exchange chromatography, reflecting the differences in their net charges. The three nuclear RNA polymerases also differ in their sensitivity to α-amanitin, a poisonous cyclic octapeptide produced by some mushrooms (Figure 8-6). RNA polymerase I is insensitive to α-amanitin, but RNA polymerase II is very sensitive — the drug binds near the active site of the enzyme and inhibits translocation of the enzyme along the DNA template. RNA polymerase III has intermediate sensitivity. Each eukaryotic RNA polymerase catalyzes transcription of genes encoding different classes of RNA (Table 8-1). RNA polymerase I (Pol I), located in the nucleolus, transcribes genes encoding precursor rRNA (pre-rRNA), which is processed into 28S, 5.8S, and 18S rRNAs. RNA polymerase III (Pol III) transcribes genes encoding tRNAs, 5S rRNA, and an array of small stable RNAs, including one involved in RNA splicing (U6) and the RNA component of the signal recognition particle (SRP) involved in directing nascent proteins to the endoplasmic reticulum (see Chapter 13).
EXPERIMENTAL FIGURE 8-6 Liquid chromatography separates and identifies the three eukaryotic RNA polymerases, each with its own sensitivity to α-amanitin. A protein extract from the nuclei of cultured eukaryotic cells was passed through a DEAE Sephadex column and adsorbed protein eluted (black curve) with a solution of constantly increasing NaCl concentration. An aliquot of each fraction of eluate collected from the column was assayed for RNA polymerase activity without (red curve) and with (green shading) 1 μg/ml α-amanitin. This concentration of α-amanitin inhibits polymerase II activity but has no effect on polymerases I and III. Polymerase III is inhibited by 10 μg/ml of α-amanitin (not shown), whereas polymerase I is unaffected even at this higher concentration. [Data from R. G. Roeder, 1974, J. Biol. Chem. 249:241.] Description The first plot shows the total amount of protein on the y-axis versus the concentration of the sodium chloride eluent and fraction number, both on the x-axis. The amount of
protein and the concentration of the eluent have no units. The fraction number ranges from 0 to approximately 53. A black line, corresponding to total protein, is eluted at low sodium chloride concentration and in fraction numbers from 0 to 10. A second line is plotted on the same chart. This line shows the R N A synthesis activity of three R N A polymerases, numbered one, two, and three, in the absence of the toxin alphaamanitin. Polymerase one, which was observed between fraction number 20 and 30 shows the highest activity, reaching about 80 percent of the height of the graph; the height of the peak corresponding to polymerase two, which was eluted in fractions 40 to 45, is about 50 percent of the total plot height, and polymerase three, which eluted in fractions 45 to 50, about 10 percent. A shaded green curve shows the activity of the polymerases in the presence of 1 microgram per milliliter of alpha amantin. The green shaded curve corresponding to polymerases one and three are identical in the absence of alpha amanitin. The activity of polymerase two is zero.
TABLE 8-1 • Classes of RNA Transcribed by the Three Eukaryotic Nuclear RNA Polymerases and Their Functions Polymerase RNA Transcribed RNA Function RNA polymerase I Pre-rRNA (28S, 18S, 5.8S rRNAs) Ribosome components, protein synthesis RNA polymerase II mRNA Encodes protein snRNAs RNA splicing siRNAs Chromatin-mediated repression, translation control miRNAs Translation control RNA polymerase III tRNAs Protein synthesis
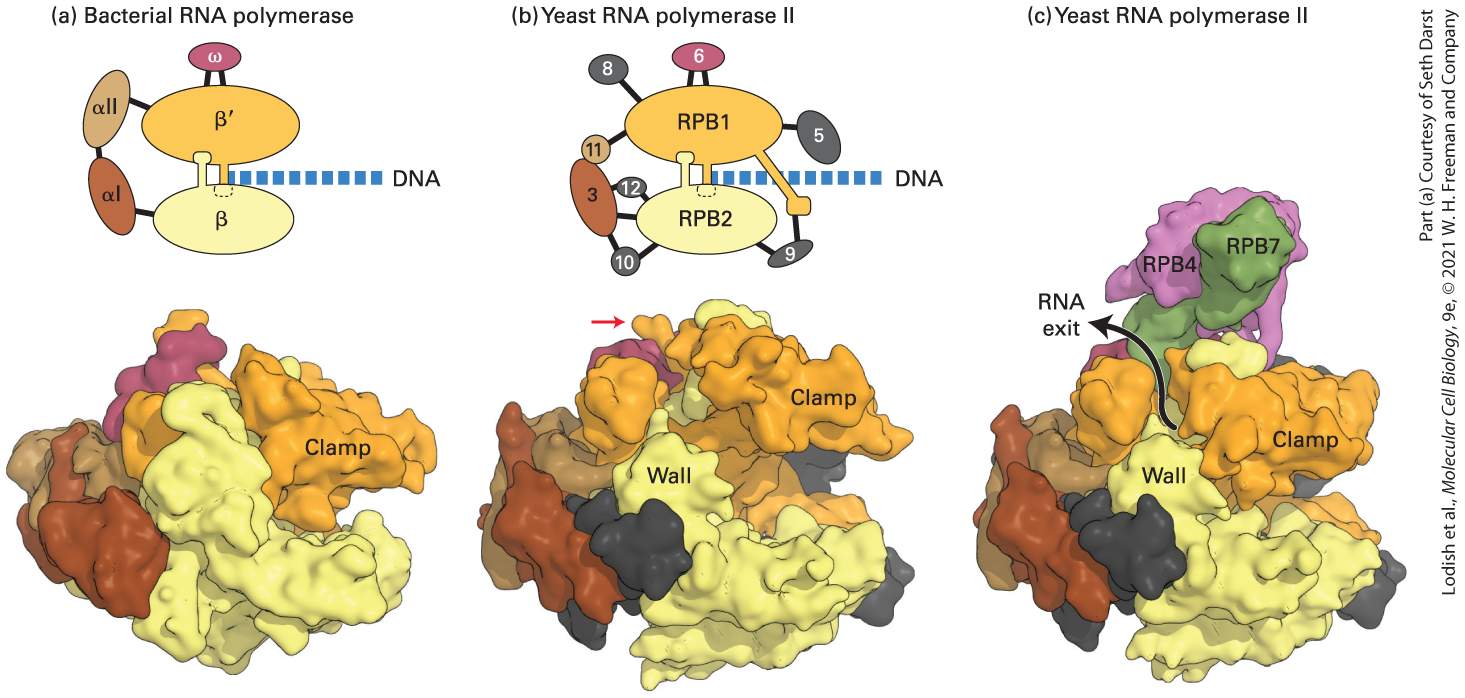
5S rRNA Ribosome component, protein synthesis snRNA U6 RNA splicing 7S RNA Signal recognition particle for insertion of polypeptides into the endoplasmic reticulum Other small stable RNAs Various functions, unknown for many RNA polymerase II (Pol II) transcribes all protein-coding genes: that is, it functions in production of mRNAs. RNA polymerase II also produces four of the five small nuclear RNAs (snRNAs) that take part in RNA splicing and micro-RNAs (miRNAs) involved in translation control, as well as the closely related endogenous small interfering RNAs (siRNAs) and most of the long noncoding RNAs (lncRNAs) (see Chapter 9). We will be focusing on the regulation of Pol II in this chapter, but we will discuss the regulation of Pol I and Pol III at the end of the chapter. The eukaryotic RNA polymerases are more complex than bacterial RNA polymerase, but all RNA polymerases have a similar overall design (Figure 8-7a, b). Each eukaryotic RNA polymerase contains two large subunits and 10–14 smaller subunits, some of which are common between two or all three of the polymerases. The best characterized eukaryotic RNA polymerases are from the yeast Saccharomyces cerevisiae. Each of the yeast genes encoding the polymerase subunits has been subjected to gene-knockout mutations (see Chapter 6) and the resulting phenotypes characterized. In addition, the three-dimensional structure of yeast RNA
polymerase II has been determined (Figure 8-7b, c). The three nuclear RNA polymerases from all eukaryotes so far examined are very similar to those of yeast. Plants contain two additional nuclear RNA polymerases (RNA polymerases IV and V), which are closely related to their RNA polymerase II but have a unique large subunit and some additional unique subunits. RNA polymerases IV and V function in transcriptional repression of plant transposons directed by nuclear siRNAs in plants. We discuss them toward the end of this chapter.
FIGURE 8-7 Comparison of three-dimensional structures of bacterial and eukaryotic RNA polymerases. These space-filling models are based on x-ray crystallographic analysis. (a) RNA polymerase from the bacterium T. aquaticus. The five subunits of the bacterial enzyme are distinguished by color. Only the N-terminal domains of the α subunits are included in this model. (b) Core RNA polymerase II from S. cerevisiae. Ten of the 12 subunits constituting yeast RNA polymerase II are shown in this model. Subunits that are similar in conformation to those in the bacterial enzyme are shown in the same colors. The C-terminal domain of the large subunit RPB1 was not observed in the crystal structure, but it is known to extend from the position marked with a red arrow. (RPB is the abbreviation for “RNA polymerase B,” which is an alternative way of referring to RNA polymerase II.) DNA entering the polymerases as they transcribe to the right is diagrammed in the top row.
(c) Space-filling model of yeast RNA polymerase II including subunits 4 and 7. These subunits extend from the core portion of the enzyme shown in (b) near the region of the C-terminal domain of the large subunit. [Part (a) see N. Korzheva et al., 2000, Science 289:619–625. Part (b) Data from P. Cramer et al., 2001, Science 292:1863. Part (c) Data from K. J. Armache et al., 2003, Proc. Nat’l. Acad. Sci. USA 100:6964, and D. A. Bushnell and R. D. Kornberg, 2003, Proc. Nat’l. Acad. Sci. USA 100:6969.] Description The left and center models show how D N A exits the structure, and the right side model shows how R N A is released from it. The first schematic shows the structure of a bacterial R N A polymerase with its four subunits, alpha one, alpha two, beta, beta prime, and omega. D N A is between the beta and beta prime subunits. Below, the 3-D, X-ray crystallographic structure is depicted. The clamp is indicated. The second schematic shows the structure of yeast R N A polymerase two with its subunits, R P B 1, R P B 2, 3, 5, 6, 8, 9, 10, 11, and 12. D N A is present between the R P B 1 and 2 subunits. The structure is similar to that of bacterial R N A polymerase, but contains more subunits. The approximate position of the C-terminal domain is indicated with an arrow pointing to the R P B 1 subunit. Below, the 3-D, X-ray crystallographic structure is depicted. The clamp and wall are indicated. The third schematic shows the X-ray crystallographic structure of yeast R N A polymerase two with bound R P B 4 and R P B 7 subunits. The location and pathway of R N A exit is indicated with an arrow that emerges from between the wall and the clamp. The two large subunits of all eukaryotic RNA polymerases are related in sequence and structure and are also similar to the large E. coli RNA polymerase subunits, and β (Figure 8-8 and see Figure 8-7a). Each of the eukaryotic RNA polymerases also contains an ω-like and two nonidentical α-like subunits (see Figure 8-8). The extensive similarity in the structures of these core subunits in RNA polymerases from diverse organisms indicates that RNA polymerase arose early in evolution and has
been largely conserved. This seems logical for an enzyme catalyzing a process as fundamental as the copying of RNA from DNA. In addition to the core subunits, all yeast RNA polymerases contain four additional small subunits, which are not in the bacterial RNA polymerase (see Figure 8-8). Finally, each eukaryotic nuclear RNA polymerase has several unique enzyme-specific subunits (see Figure 8-8). Three of these additional subunits of Pol I and Pol III are homologous to the three additional Pol IIspecific subunits. The other two Pol I-specific subunits are homologous to the Pol II general transcription factor TFIIF, discussed later, and the four additional subunits of Pol III are homologous to the Pol II general transcription factors TFIIF and TFIIE. The functions of these general transcription-factor-like subunits in Pol I and Pol III are like those of TFIIE and TFIIF. But during enzyme purification, these subunits remain associated with RNA polymerases I and III, whereas the functionally similar RNA polymerase II subunits separate from RNA polymerase II during purification.
FIGURE 8-8 Schematic representation of the subunit structure of the E. coli RNA core polymerase and yeast nuclear RNA polymerases. All three yeast polymerases have five core subunits homologous to the β, , two α, and ω subunits of E. coli RNA polymerase. The largest subunit (RPB1) of RNA polymerase II also contains an essential C-terminal domain (CTD). RNA polymerases I and III contain the same two nonidentical α-like subunits, whereas RNA polymerase II contains two other nonidentical α-like subunits. All three polymerases share the same ω-like subunit and four other common subunits. In addition, each yeast polymerase contains three to seven unique smaller subunits. Description The similarity between eukaryotic and E coli core R N A polymerase is presented schematically. The E coli core R N A polymerase contains two beta units, two alpha units, and an omega unit. The eukaryotic R N A polymerases 1, 2, and 3 contain a beta and beta prime like subunits, two alpha-like subunits, and a gamma like subunit. Eukaryotic polymerases 1 and 2 contain the same alpha-like subunits, whereas polymerase 2 contains slightly different alpha-subunits. In addition, the eukaryotic R N A polymerases contain four subunits they share in common, and polymerases 1, 2, and 3 have 5, 3, and 7 additional enzyme-specific subunits, respectively. Archaea, like bacteria, have a single type of RNA polymerase involved in gene transcription, but archaeal RNA polymerases, like eukaryotic nuclear RNA polymerases, have on the order of a dozen subunits. Archaea also possess general transcription factors that are related to those of eukaryotes, which is consistent with the closer evolutionary relationship between archaea and eukaryotes than between bacteria and eukaryotes (see
Figure 1-1). Gene-knockout experiments in yeast indicate that most of the subunits of the three nuclear RNA polymerases are essential for cell viability. Disruption of the genes encoding the few polymerase subunits that are not
The Clamp Domain Enables RNA Polymerase II to Transcribe Long Stretches of DNA
essential for viability (e.g., subunits 4 and 7 of RNA polymerase II) nevertheless results in cells that grow very poorly. Thus all of the subunits are necessary for eukaryotic RNA polymerases to function normally. The Clamp Domain Enables RNA Polymerase II to Transcribe Long Stretches of DNA Subunit RPBI contains the clamp domain, so called because it has been observed to clamp down on DNA that enters the enzyme. In crystals of free Pol II (Figure 8-9a) and in a complex that mimics the elongating form of the enzyme (Figure 8-9b), the clamp domain is in different positions. The domain rotates on a hinge that is open when downstream DNA is inserted into the cleft between RPB1 and RPB2 subunits (see Figure 8-7b), and then swings shut when the enzyme is in its elongation mode (Figure 89b). It is postulated that when the 8–9-bp RNA-DNA hybrid region near the active site (where RNA is base-paired to the template strand; see
Figure 8-9b) is bound between RBP1 and RBP2 and nascent RNA fills the exit channel, the clamp is locked in its closed position, anchoring the polymerase to the downstream double-stranded DNA. Furthermore, a transcription elongation factor called DSIF, discussed later, associates with the elongating polymerase, holding the clamp in its closed conformation. As a consequence, the polymerase is extraordinarily processive, which is to say that it continues to transcribe down the template DNA polymerizing ribonucleotides until transcription is terminated. After termination and release of RNA from the exit channel,
the clamp can swing open, releasing the enzyme from the template DNA. This mechanism explains how human RNA polymerase II can transcribe the longest human gene, encoding dystrophin, which is some 2 million base pairs in length, without dissociating and terminating transcription. Since transcription elongation proceeds at 1–2 kb per minute, transcription of the DMD gene requires approximately one day!
The Largest Subunit in RNA Polymerase II Has an Essential Carboxy-Terminal Repeat
FIGURE 8-9 The clamp domain of RPBI. The structures of the free (a) and transcribing (b) RNA polymerase II differ mainly in the position of a clamp domain in the RPB1 subunit (orange), which swings over the cleft between the jaws of the polymerase during formation of the transcribing complex, trapping the template DNA strand and transcript. Binding of the clamp domain to the 8–9-bp RNA-DNA hybrid helps couple clamp closure to the presence of RNA, stabilizing the closed, elongating complex. RNA is shown in red, the template DNA strand in dark blue, and the downstream nontemplate DNA strand in cyan in this model of an elongating complex. The clamp closes over the incoming downstream DNA. This model is shown with portions of RBP2 that form one side of the cleft removed so that the nucleic acids can be better visualized. The ion that participates in catalysis of phosphodiester bond formation is shown in green. Wall is the domain of RPB2 that forces the template DNA entering the jaws of the polymerase to bend before it exits the polymerase. The bridge α helix, shown in green, extends across the cleft in the polymerase (see Figure 8-7b) and is postulated to bend and straighten as the polymerase translocates one base down the template strand. The nontemplate strand is thought to form a flexible, single-stranded region above the cleft (not shown), extending from three bases downstream of the template base-paired to the base of the growing RNA to where the template strand exits the polymerase, where it hybridizes with the nontemplate strand to generate the transcription bubble. [Data from A. L. Gnatt et al., 2001, Science 292:1876, PDB ID 1i6h.] Description Part (a) shows the 3-dimensional structure of free R N A polymerase two. The clamp domain, wall, bridge, a magnesium dicat-ion, r p b 2 lobe, r p b 5, and r p b 9 are all indicated. Part (b) shows the 3-dimensional structure of R N A polymerase two while it is transcribing D N A. A D N A fragment enters the right-hand-side of the structure and, on the left-hand-side between the clamp and the wall, the R N A transcript emerges. The direction of transcription is from left to right.
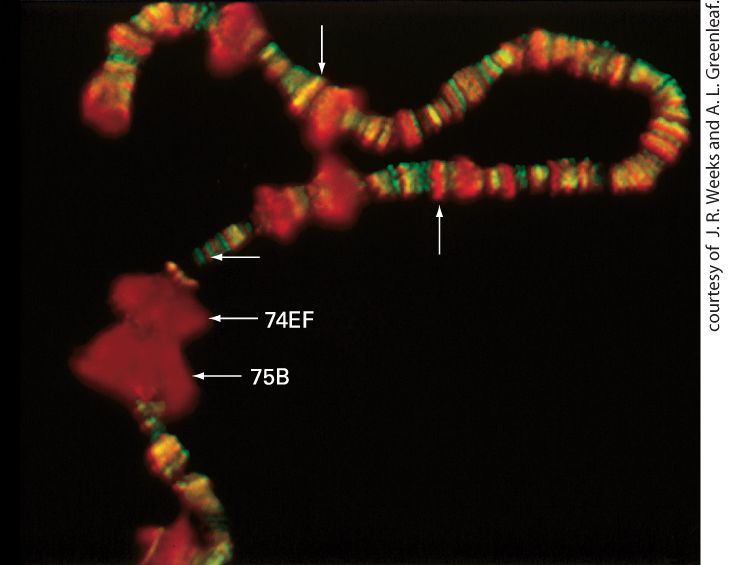
The Largest Subunit in RNA Polymerase II Has an Essential Carboxy-Terminal Repeat RNA polymerase II contains a unique domain at the carboxyl end of its RPB1 subunit. The domain is made of seven amino acids repeated multiple times. This heptapeptide repeat, with a consensus sequence of Tyr-Ser-Pro-Thr-Ser-Pro-Ser, is known as the carboxy-terminal domain (CTD) (see Figure 8-8, red squiggle). Yeast RNA polymerase II contains 26 or more of these repeats, vertebrate enzymes have 52 repeats, and an intermediate number of repeats occurs in RNA polymerase II from nearly all other eukaryotes. The CTD is critical for cell viability, and at least 10 copies of the repeat must be present for yeast to survive. In vitro experiments with model promoters first showed that RNA polymerase II molecules that initiate transcription have a nonphosphorylated CTD. Once the polymerase initiates transcription and begins to move away from the promoter, many of the serine and some tyrosine residues in the CTD are phosphorylated. Analysis of polytene chromosomes from Drosophila salivary glands prepared just before molting of the larva, a time of active transcription, indicates that the CTD is also phosphorylated during in vivo transcription. The large chromosomal “puffs” induced at this time in development are regions where the genome is very actively transcribed. Staining with antibodies specific for either the phosphorylated or nonphosphorylated CTD
demonstrated that RNA polymerase II associated with the highly transcribed puffed regions contains a phosphorylated CTD (Figure 8-10). EXPERIMENTAL FIGURE 8-10 Antibody staining demonstrates that the carboxyterminal domain of RNA polymerase II is phosphorylated during in vivo transcription. Salivary-gland polytene chromosomes were prepared from Drosophila larvae just before they molted. The preparation was treated with a rabbit antibody specific for phosphorylated CTD and with a goat antibody specific for nonphosphorylated CTD. The preparation was then stained with fluorescein-labeled anti-goat antibody (green) and rhodamine-labeled antirabbit antibody (red). Thus polymerase molecules with a nonphosphorylated CTD stained green, and those with a phosphorylated CTD stained red. The molting hormone ecdysone induces very high rates of transcription in the puffed regions labeled 74EF and 75B; note that only phosphorylated CTD is present in these regions. Smaller puffed regions transcribed at high rates are also visible. Nonpuffed sites that stained red (up arrow) or
green (horizontal arrow) are also indicated, as is a site staining both red and green, producing a yellow color (down arrow). [Republished with permission from Cold Spring Harbor Press, from: J. R. Weeks et al., 1993, “Locus-Specific Variation In Phosphorylation State of RNA Polymerase II In Vivo: Correlations with Gene Activity and Transcript Processing,” Genes Dev. 7(12A):2329– 2344;] Description Several puffed-up regions are indicated by arrows, labeled 74 E F and 75 B. Phosphorylated bands are stained red; an unpuffed red band is indicated. In addition, a yellow band, a combination of red and green staining are indicated. KEY CONCEPTS OF SECTION 8.1 Overview of Eukaryotic Transcription The primary purpose of gene control in multicellular organisms is the execution of precise developmental programs so that the proper genes are expressed in the proper cells at the proper times during embryologic development and cellular differentiation. Transcriptional control is the primary means of regulating gene expression in eukaryotes, as it is in bacteria. In eukaryotic genomes, DNA transcription-control elements may be located many kilobases away from the promoter they regulate. Different control elements can control transcription of the same gene in different cell types. Eukaryotes contain three types of nuclear RNA polymerases. All three contain two large and three smaller core subunits with homology to the , β, α, and ω subunits of E. coli RNA polymerase, as well as several additional small subunits (see Figure 8-8). RNA polymerase I synthesizes only pre-rRNA. RNA polymerase II synthesizes mRNAs, some of the small nuclear RNAs that participate in mRNA splicing, microand small interfering RNAs (miRNAs and siRNAs) that regulate the translation and stability of mRNAs, and long noncoding (lnc) RNAs that regulate transcription. RNA polymerase III synthesizes tRNAs, 5S rRNA, and several other small stable RNAs (see Table 8-1). The carboxy-terminal domain (CTD) in the largest subunit of RNA polymerase II becomes phosphorylated during transcription initiation and remains phosphorylated
RNA Polymerase II Initiates Transcription at DNA Sequences Corresponding to the 5′ Cap of mRNAs
8.2 RNA Polymerase II Promoters and General Transcription Factors The mechanisms that regulate transcription initiation and elongation by RNA polymerase II have been studied extensively because this polymerase is the one that transcribes mRNAs. Transcription initiation and elongation by RNA polymerase II are the initial biochemical processes required for the expression of protein-coding genes. These are the steps in gene expression that are most frequently regulated and thus determine when and in which cells specific proteins are synthesized. As we mentioned in the previous section, the expression of eukaryotic protein-coding genes is regulated by multiple protein-binding DNA sequences, generically referred to as transcription-control regions. These sequences include promoters, which determine where transcription of the DNA template begins, and other types of control elements located near transcription start sites. They also include sequences, called enhancers, located far from the genes they regulate, which regulate cell type-specific transcription and how frequently specific genes are transcribed. In this section, we take a closer look at the properties of various transcription-control elements found in eukaryotic protein-coding genes and some techniques used to identify them. RNA Polymerase II Initiates Transcription at DNA Sequences
The TATA Box, Initiators, and CpG Islands Function as Promoters in Eukaryotic DNA
Corresponding to the Cap of mRNAs In vitro transcription experiments using purified RNA polymerase II, a protein extract prepared from the nuclei of cultured cells, and DNA templates containing sequences encoding the ends of mRNAs for a number of abundantly expressed genes revealed that the transcripts produced always contained a cap structure at their ends identical to that present at the end of the spliced mRNA normally expressed from the gene in vivo (see Figure 5-26). In these experiments, the cap was added to the end of the nascent RNA by enzymes in the nuclear extract, which can add a cap only to an RNA that has a tri- or diphosphate. Because a end generated by cleavage of a longer RNA would have a monophosphate, it would not be capped. Consequently, researchers concluded that the capped nucleotides generated in the in vitro transcription reactions must have been the nucleotides with which transcription was initiated. Sequence analysis revealed that, for any given gene, the sequence at the end of the RNA transcripts produced in vitro is the same as that at the end of the mRNAs isolated from cells, confirming that the capped nucleotide of eukaryotic mRNAs coincides with the transcription start site. Today the transcription start site for a newly characterized mRNA is generally determined simply by identifying the DNA sequence encoding the -capped nucleotide of the encoded mRNA.
The TATA Box, Initiators, and CpG Islands Function as Promoters in Eukaryotic DNA Several different types of DNA sequences can function as promoters for RNA polymerase II, directing the polymerase where to initiate transcription of an RNA complementary to the template strand of a double-stranded DNA molecule. These sequences include TATA boxes, initiators, and CpG islands. TATA Boxes The first genes to be sequenced and studied through in vitro transcription systems were viral genes and cellular protein-coding genes that are very actively transcribed, either at particular times of the cell cycle or in specific differentiated cell types. In all these highly transcribed genes, a conserved sequence called the TATA box was found about 26–31 bp upstream of the transcription start site (Figure 8-11). Mutagenesis studies have shown that a single-base change in this nucleotide sequence drastically decreases in vitro transcription of the gene adjacent to it. If the base pairs between the TATA box and the normal transcription start site are deleted, transcription of the altered, shortened template begins at a new site about 25 bp downstream from the TATA box. Initiator Sequences, BREs and DPEs
Instead of a TATA box, some eukaryotic genes contain an alternative core promoter element called an initiator. Most naturally occurring initiator elements have a cytosine (C) at the −1 position and an adenine (A) residue at the transcription start site (+1). Directed mutagenesis of mammalian genes with an initiator-containing promoter revealed that the nucleotide sequence immediately surrounding the start site determines the strength of such promoters. In contrast to the conserved TATA box sequence, however, only an extremely degenerate initiator consensus sequence has been defined: where is the base at which transcription starts, Y is a pyrimidine (C or T), N is any of the four bases, and T/A is T or A at position +3. As discussed below, transcription initiation by RNA polymerase II requires several general transcription factors (GTFs) that bind with the polymerase to template DNA. The largest of these, TFIID, has two subunits, which together bind the initiator sequence in promoters where it occurs. Other DNA sequences within base pairs of the transcription start site can also influence the frequency of transcription initiation. Another GTF, TFIIB, binds to the major groove of DNA immediately upstream of the TATA box, and the strongest promoters contain the optimal sequence for this interaction, called the TFIIB recognition element (BRE) (Figure 8-11). Another promoter element designated DPE for downstream promoter element (Figure 8-11), can be bound by other subunits of TFIID (see below).
FIGURE 8-11 Core promoter elements in metazoans. The sequence of each element is shown with the end at the left and the end at the right. Description Four areas on the D N A sequence show sequences that change expression of other genes next to them. The first box is from negative 37 to negative 32, and is labeled B R E T F I I B recognition element, negative 31 to negative 26 there is a red box labeled TATA box with a short sequence of base pairs below, negative 2 to 4 there is a yellow box labeled I n r Initiator which has a drosophila example and a mammals example, last box is light blue and is labeled D P E Downstream Promoter Element with a set of base pairs below. CpG Islands Transcription of genes with promoters containing a TATA box or initiator element begins at a well-defined initiation site. However, the transcription of percent of protein-coding genes in mammals occurs at a lower rate than at TATA box–containing and initiator-containing promoters. For these genes, transcription begins at any of several alternative start sites within
regions about 100–1000-bp long that have an unusually high frequency of CG sequences compared to the rest of the genome. Many such genes encode proteins that are not required in large amounts (e.g., genes encoding enzymes involved in basic metabolic processes required in all cells, often called “housekeeping genes”). These promoter regions are called CpG islands (where “p” represents the phosphate between the C and G nucleotides) because the sequence CG occurs relatively rarely in the genome sequences of mammals, for reasons explained shortly. Within CpG island promoters, the sequence CG occurs several times within a few tens of base pairs — a very unusual occurrence in mammalian genomes — leading to the image of rare islands of sequences containing multiple CGs in a sea of genomic sequence bereft of them. The low frequency of the sequence CG in mammalian genomes is thought to have occurred by the following mechanism: In mammals, most Cs followed by a G are methylated at position 5 of the pyrimidine ring (5methyl C, represented as ; see Figure 2-17). This allows DNA repair mechanisms to distinguish the parental strand of newly replicated DNA containing from the newly synthesized daughter strand lacking , which is more likely to include a mutation introduced by an error in copying the parental strand. In mammalian genomes, CG sequences occur at only percent their expected frequency based on the percentages of GC and AT base pairs in their genomes. This is thought to be because the slow, spontaneous deamination of 5-methyl C generates thymidine. Over the time scale of mammalian evolution, this is thought to have led to the conversion of most CGs to TG. As a consequence, the frequency of CG in the human genome is only 21 percent of that expected if Cs were randomly
followed by a G. However, the Cs in active CpG island promoters are unmethylated. Consequently, when they deaminate spontaneously, they are converted to U, a base that is recognized by DNA-repair enzymes and converted back to C. As a result, the frequency of CG sequences within CpG island promoters (where they are not methylated) is close to that expected if C were followed by any of the other three nucleotides randomly. CG-rich sequences are bound by histone octamers more weakly than CGpoor sequences because more energy is required to bend them into the small-diameter loops required to wrap around the histone octamer forming a nucleosome (see Figure 7-20). As a consequence, CpG islands coincide with linker regions of DNA between nucleosomes (see Figure 7-22). Much remains to be learned about the molecular mechanisms that control transcription from CpG island promoters, but a current hypothesis is that the general transcription factors discussed in the next section can bind to them because access to the DNA is not inhibited by DNA interactions with the surface of a histone octamer. Divergent Transcription from CpG Island Promoters Another remarkable feature of CpG islands is that transcription from these elements is initiated in both directions, even though only transcription of the sense strand yields an mRNA. By a mechanism(s) that remains to be fully elucidated, most RNA polymerase II molecules transcribing in the “wrong” direction — that is, transcribing the nonsense strand — terminate
transcription about 1–3 kb from the transcription start site. This phenomenon was discovered by taking advantage of the stability conferred on the elongation complex by the RNA polymerase II clamp domain when an RNA-DNA hybrid is bound near the active site (see Figure 8-9b). In one key experiment, nuclei were isolated from cultured human fibroblasts and incubated in a buffered solution containing salt and mild detergent, which removes RNA polymerases except for those in the process of elongation because of their stable association with template DNA. Nucleotide triphosphates were then added, with UTP replaced by bromo-UTP, containing uracil with a Br atom at position 5 on the pyrimidine ring (see Figure 2-17). The nuclei were then incubated at 30 °C long enough for about 100 nucleotides to be polymerized by the RNA polymerase II molecules that were in the process of elongation at the time the nuclei were isolated. RNA was isolated, and RNA containing bromo-U was immunoprecipitated with an antibody specific for BrU-labeled RNA. Thirty-three nucleotides at the ends of tens of millions of these isolated RNA molecules were then sequenced by massively parallel DNA sequencing (see Chapter 6) of reverse transcripts, and the sequences were mapped on the human genome. The results of this experiment indicated that approximately equal numbers of RNA polymerase molecules transcribed most promoters (mostly CpG island promoters) in the sense direction and in the antisense direction, away from the gene. A peak of sense transcripts was observed at about +50 relative to the major transcription start site (TSS), indicating that at most genes in mammals, Pol II pauses in the +50 to +200 region before elongating further. A peak at
−250 to −500 relative to the major transcription start site was also observed for Pol II transcribing in the antisense direction. These observations, which greatly surprised most molecular biologists when they were first reported, are explained by understanding how transcription factors that bind to promoter sequences function, as we discuss in the following section. Briefly here, multiple processes that regulate the accessibility of DNA at promoters allow proteins known as general transcription factors to bind to promoters. At strong promoters with a TATA box or an initiator sequence, the direction of Pol II binding is determined by these promoter sequences and transcription occurs primarily in the sense direction. But at weaker promoters, the general transcription factors and Pol II associate with the promoter DNA in both possible directions randomly, resulting in transcription by half of the polymerases in one direction, and transcription by the other half of polymerases in the opposite direction. Then, RNA processing, discussed in
Chapter 9, results in degradation of the RNAs that were transcribed in the wrong direction so that they are not processed into mRNAs. This apparent waste of energy from widespread antisense transcription followed by degradation of the antisense RNA apparently was not selected against during the evolution of mammals. This is probably because the most abundantly expressed genes are transcribed primarily in the sense direction, and because the amount of energy devoted to mRNA synthesis is only a small fraction of the energy required for other processes essential to mammals such as the movement of our muscles and the constant pumping of the ions required for neurological activity (Chapter 23).

The widely used technique of chromatin immunoprecipitation outlined in Figure 8-12a provided additional data supporting the occurrence of divergent transcription from most CpG island promoters in mammals. The method allows one to determine the multiple binding sites of a specific protein along nearly the entire length of the bp human genome, within a resolution of base pairs. First, starting with living cells, all proteins are rapidly cross-linked to nearby proteins and other macromolecules including DNA. This is usually done by adding formaldehyde to the media. The cross-linked chromatin is isolated and fragmented into lengths of two to three nucleosomes ( base pairs of DNA). The fragmented chromatin is subjected to immunoprecipitation using an antibody specific for the protein of interest. The data from this analysis are reported as the number of times a specific sequence from a region of the genome was identified per million total bases of the immunoprecipitated DNA sequenced (Figure 8-12b). At divergently transcribed genes, such as the Hsd17b12 gene encoding an enzyme involved in intermediary metabolism, two peaks of immunoprecipitated DNA were detected, corresponding to Pol II transcribing in the sense and antisense directions and then pausing. However, only Pol II transcribing in the sense direction was detected more than 1 kb from the start site (TSS). The number of counts per million from this region of the genome >1 kb from the TSS was very low because the gene is transcribed at low frequency. However, the number of counts per million at the transcription start site regions for both sense and antisense transcription was much higher, reflecting the fact that Pol II molecules had initiated transcription in both directions at this promoter, but paused before transcribing farther than 1 kb from the start sites in each direction. In contrast, the Rpl6 gene,
encoding a large ribosomal subunit protein that was abundantly transcribed in the proliferating mouse embryonic stem cells used in the study, was transcribed almost exclusively in the sense direction. The peak in counts per million less than 250 bp from the transcription start site again results from a long pause in transcription in the promoter-proximal region before the polymerase is released to transcribe into the gene. The number of sequence counts per million more than 1 kb downstream from the transcription start site in the sense direction was much higher than for sense-direction transcription of the Hsd17b12 gene, reflecting the high rate of transcription of the Rpl6 gene.
General Transcription Factors Position RNA Polymerase II at Transcription Start Sites and Assist in Initiation
EXPERIMENTAL FIGURE 8-12 Chromatin immunoprecipitation technique localizes where a protein of interest associates with the genome. (a) Step 1 : Live cultured cells or tissues are incubated in 1 percent formaldehyde to covalently cross-link proteins to DNA and proteins to proteins. Step 2 : The preparation is then subjected to sonication to solubilize chromatin and shear it into fragments of 200–500 bp of DNA. Step 3 : An antibody to a protein of interest, here RNA polymerase II, is added, and DNA covalently linked to the protein of interest is immunoprecipitated. Step 4 : The covalent cross-linking is then reversed and the DNA is isolated. The isolated DNA can be analyzed by PCR with primers for a sequence of interest. Alternatively, total recovered DNA can be subjected to massively parallel DNA sequencing. See A. Hecht and M. Grunstein, 1999, Method. Enzymol. 304:399. (b) Results from DNA sequencing of chromatin from mouse embryonic stem cells immunoprecipitated with antibody to RNA polymerase II are shown for a gene that is divergently transcribed (left) and a gene that is transcribed only in the sense direction (right). Data are plotted as the number of times a DNA sequence in a 50-bp interval was observed per million base pairs sequenced. The region encoding the end of the gene is shown below, with exons shown as rectangles and introns as lines. [Part (b) Data from P. B. Rahl et al., 2010, Cell 141:432.] Description The diagram a at the top is a four step process for chromatin immunoprecipitation technique, below are two graphs labeled b and c. Graph a is titled 'bidirectional initiation' and graph b is titled 'unidirectional initiation;. The x-axes of both graphs show the number of kilobases. The y-axes are labeled 'counts' in millions. The graph of bidirectional initiation ranges from ninety-three thousand nine-hundred and fifty six to ninety-three thousand nine-hundred and sixty two. The y-axis ranges from 0 to 20. A double sided peak is centered at ninety-three thousand nine-hundred and fifty eight. General Transcription Factors Position RNA Polymerase II at
Transcription Start Sites and Assist in Initiation Initiation of transcription by RNA polymerase II requires several initiation factors. These initiation factors position Pol II molecules at transcription start sites and help to separate the DNA strands so that the template strand can enter the active site of the enzyme. They are called general transcription factors because they are required for transcription of most, if not all, genes transcribed by RNA polymerase II. These proteins are designated TFIIA, TFIIB, and so on, and most are multisubunit proteins. The largest is TFIID, which consists of a single 38-kDa TATA box– binding protein (TBP) and 13 TBP-associated factors (TAFs). General transcription factors with similar activities and homologous sequences are found in all eukaryotes. The complex of Pol II and its general transcription factors bound to a promoter and ready to initiate transcription is called a preinitiation complex (PIC). Figure 8-13a summarizes the current model for the stepwise assembly of the Pol II transcription preinitiation complex on a promoter containing a TATA box. The model is based on cryoelectron microscopy structures of intermediates in the assembly (Figure 8-13b–e).
FIGURE 8-13 Model for the sequential assembly of an RNA polymerase II preinitiation complex. (a) The indicated general transcription factors and purified RNA polymerase II
(Pol II) bind sequentially to promoter DNA with a TATA box to form a preinitiation complex (PIC). ATP hydrolysis then provides the energy for the unwinding of DNA at the transcription start site by a TFIIH helicase subunit that pushes upstream DNA into the polymerase. The DNA is held in position in the PIC by binding of the TATA box by the TBP subunit of TFIID, and the resulting strain on the structure of the duplex DNA assists the N-terminal region of TFIIB and Pol II to melt the DNA at the transcription start site, forming the transcription bubble. As Pol II initiates transcription in the resulting open complex, the polymerase transcribes away from the promoter, its CTD becomes phosphorylated by the TFIIH kinase domain, and the general transcription factors dissociate from the promoter. Data from S. Sainsbury, C. Berrnecky, and P. Cramer, 2015, Nat. Rev. Mol. Cell Biol. 16:129. (b–e) Cryoelectron microscopy structures of (b) TBP (red), TFIIA (orange), and TFIIB (blue) bound to a strong TATA box promoter. The DNA is not visible because it is obscured by TFIIA and TFIIB. (c) The core PIC composed of TBP-TFIIA-TFIIB-TFIIF-Pol2 bound to promoter DNA. (d) TFIIE bound to the core PIC; (e) TFIIH bound to the core PICTFIIE complex, generating the complete, closed preinitiation complex. (f) Diagram of how the TFIIH helicase subunit XPB pushes downstream DNA into the polymerase active site. This distorts the DNA structure because the TATA box is held by TBP, TFIIA, and TFIIB at a fixed distance. This assists the N-terminus of TFIIB and the polymerase in melting the DNA at the transcription start site and inserting the coding strand into the channel between RPB1 and RPB2 where it associates with the polymerase active site, resulting in melting of the transcription start site region, generating the “open complex.” [Republished with permission of Nature Publishing Group, from Y. He et al., 2013, “Structural Visualization of Key Steps in Human Transcription Initiation.” Nature 495:481– 486; permission conveyed through Copyright Clearance Center, Inc.] Description Part (a) shows the following sequence. 1. The unbound promoter T F I D comprises T B P and T A Fs. This unbound promoter binds with T F-two-b and T F-two-A and binds to the TATA box of the promoter D N A forming the upstream promoter complex. 2. R N A polymerase two with its attached C T D binds the promoter complex along with T F-two-F forming the core preinitiation complex (P I C). Upstream D N A is on the left of the P I C and downstream on the right.
3. Subsequently, T F-two-H kinase, T F-two-H, and T F-two-E associate, forms the closed P I C. 4. The addition of A T P allows the melting of D N A, forming the open P I C and a transcription bubble. 5. The initially transcribing complex is now formed and the addition of phosphorylated nucleosides allows the formation of nascent R N A. 6. The subsequent addition of elongation factor and loss of initiation factors forms the elongation complex. Parts labeled (b) through (f) show the 3-D models, with the various subunits of the preinitiation complex indicated. In the side view, upstream D N A enters the complex. In the front and back views, the downstream D N A exits the preinitiation complex. Beneath these 3-D models, a schematic shows the formation of the transcription bubble powered by A T P. The TBP subunit of TFIID is the first protein to bind to a TATA box promoter. All eukaryotic TBPs analyzed to date have very similar C-terminal domains of 180 residues. This domain of TBP folds into a saddleshaped structure; the two halves of the molecule exhibit an overall dyad symmetry but are not identical. TBP interacts with the minor groove in DNA, bending the helix considerably (see Figure 5-5). The DNA-binding surface of TBP is conserved in all eukaryotes, explaining the high conservation of the TATA box promoter element (see Figure 8-11). Once TBP has bound to the TATA box, TFIIA and TFIIB can bind (see
Figure 8-13a). TFIIA is a heterotrimer larger than TBP, and TFIIB is a monomeric protein, slightly smaller than TBP. TFIIA associates with TBP and DNA on the upstream side of the TBP–TATA box complex. The C-terminal domain of TFIIB clamps onto the C-terminal “stirrup” of the saddle-shaped TBP molecule (see Figure 5-5) and contacts the major
groove of DNA on either side of the TATA box. Next, a complex of Pol II and TFIIF, a heterodimer, associates with the promoter DNA-TFIIA-TFIIB complex forming a core promoter initiation complex or core PIC (see
Figure 8-13a). The extended N-terminal domain of TFIIB is inserted into the RNA exit channel of RNA polymerase II (see Figure 8-7c) where it interacts with the double-stranded DNA, stabilizing the complex and helping to hold the DNA in the region of the transcription start site (TSS) over the cleft between RPB1 and RPB2 when the clamp is open (see Figures 8-9a and 8-13a, c). Next TFIIE, a heterodimer of two different subunits binds next to TIIF, completely enclosing the template DNA in a protein channel over the TSS region, and further stabilizing the complex with promoter DNA (see
Figure 8-13d). TFIIE also contains a docking site for TFIIH, another multisubunit factor nearly as large as the polymerase itself, containing 10 different subunits. Binding of TFIIH completes assembly of the transcription preinitiation complex (see Figures 8-13a closed PIC, and 813e). The helicase activity of one of the core TFIIH subunits (XPB in humans, Ssl2 in yeast; see Figure 8-13f) uses energy from ATP hydrolysis to help unwind the DNA duplex at the start site, allowing Pol II to form an open complex in which the DNA duplex surrounding the start site is melted and the template strand is bound at the polymerase active site (see Figure 813a, Open PIC). As the polymerase transcribes away from the promoter region, the N-terminal domain of TFIIB is released from the RNA exit channel as the end of the nascent RNA enters it. Three TFIIH subunits
form a kinase module (TFIIH in Figure 8-13a) that phosphorylates the Pol II CTD multiple times on serine 5 (underlined) of the Tyr-Ser-Pro-Thr- Ser-Pro-Ser repeat that constitutes the CTD. As we will discuss further in
Chapter 9, when multiphosphorylated at Ser5, the CTD is a docking site for the enzymes that form the cap structure (see Figure 5-26) on the end of an RNA transcribed by RNA polymerase II. In the minimal in vitro transcription assay with TBP substituting for the full TFIID complex, TBP remains bound to the TATA box as the polymerase transcribes away from the promoter region, but the other general transcription factors, and probably the TFIID-TAF subunits, dissociate. Remarkably, the first subunits of TFIIH to be cloned from humans were identified because mutations in them cause defects in the repair of DNA damaged by alkylation, such as a base with a covalently linked mutagen, or a UV-induced thymidine dimer (see Figure 5-17). In normal individuals, when a transcribing RNA polymerase becomes stalled at a region of damaged template DNA, the core TFIIH complex, lacking the three subunits of the kinase domain (see Figure 8-13a) but including the helicase subunit mentioned above plus an additional helicase subunit whose activity is not required for transcription initiation, recognizes the stalled polymerase and then associates with other proteins that function with TFIIH in repairing the damaged DNA region. In patients with mutant forms of these TFIIH subunits, such repair of damaged DNA in transcriptionally active genes is impaired. As a result, affected individuals have extreme skin sensitivity to sunlight (a common cause of DNA damage through the generation of thymidine dimers) and exhibit a high
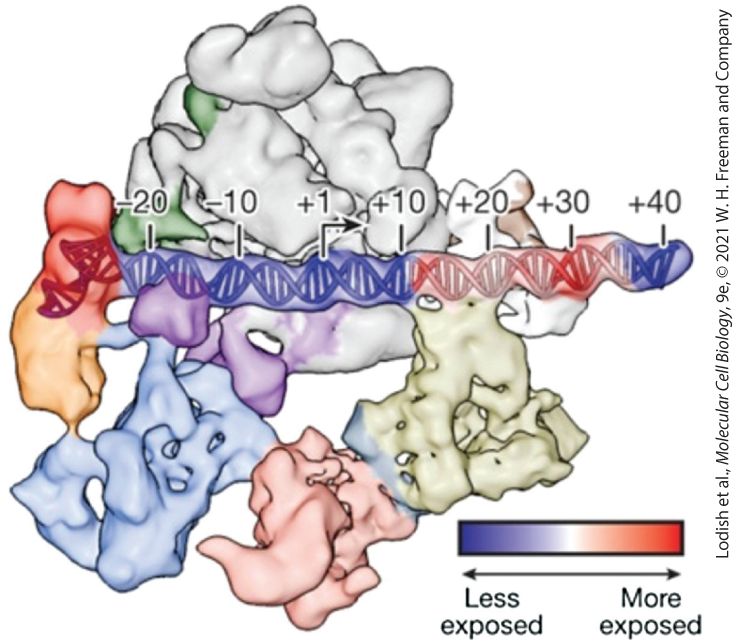
incidence of cancer. Consequently, these subunits of TFIIH serve two functions in the cell, one in the process of transcription initiation (where one of the helicase subunits helps to open the DNA strands at the transcription start site) and a second in the repair of DNA (where the activities of both helicase subunits are required; see Figure 5-18). Depending on the severity of the defect in TFIIH function, these individuals may suffer from diseases such as xeroderma pigmentosum (see Chapter 25) and Cockayne syndrome (see Chapter 5). The TAF subunits of TFIID function in initiating transcription from promoters that lack a TATA box (>70 percent of human promoters, usually transcribed at lower level compared to TATA box promoters). For instance, some TAF subunits contact the initiator, and or DPE promoter elements (see Figure 8-11) in promoters where they occur (Figure 8-14). This probably explains how such sequences can replace a TATA box (see
Figure 8-13) to allow TFIID binding to a TATA-minus promoter.
FIGURE 8-14 Cryoelectron microscopy structure of a closed complex of TFIID, TFIIA, TFIIB, and Pol II bound to promoter DNA. TBP is shown in red, TFIIA in orange, TAF complexes in light blue, pink, and tan, and Pol II in gray. The color scale at the bottom indicates the sensitivity of the DNA in the complex to digestions by DNase I. [Republished with permission of Nature Publishing Group, from R. Louder et al., 2016, “Structure of Promoter-Bound TFIID and Model of Human Pre-Initiation Complex Assembly.” Nature 531:604–609; https://doi.org/10.1038/nature17394; permission conveyed through Copyright Clearance Center, Inc.] Description A space filling 3-D model of a closed complex of T F 2 A, T F 2 B, T F 2 D and Pol 2 all bound to D N A, the D N A is depicted as a straight line of spiraled ladder shape, the
Elongation Factors Regulate the Initial Stages of Transcription in the Promoter-Proximal Region
left side of the D N A is colored blue, which stands for less exposed, then in the right half, the first part is colored red, which stands for more exposed. The very last part of D N A on the right, which is colored blue again, is outside the complex Pol 2. Chromatin immunoprecipitation assays (see Figure 8-12) using antibodies to TBP show that TBP binds in the region between the divergent transcription start sites in CpG island promoters. Consequently, the general transcription factors required for initiation from promoters containing a TATA box are probably also required for initiation from the weaker CpG island promoters. The absence of any of the promoter elements summarized in Figure 8-11 may account for the divergent transcription from multiple start sites observed from CpG island promoters, since cues from the DNA sequence are not present to correctly orient the preinitiation complex. TFIID and the other general transcription factors may instead choose among nearly equivalent, weak binding sites in CpG island promoters, which may contribute to the low frequency of transcription initiation. Elongation Factors Regulate the Initial Stages of Transcription in the Promoter-Proximal Region In metazoans, at most promoters, Pol II pauses after transcribing fewer than 100 nucleotides, due to the binding of a protein called NELF (negative elongation factor). NELF binds to Pol II along with an elongation factor called DSIF (DRB sensitivity-inducing factor, so named
because an ATP analog called DRB inhibits further transcription elongation in its presence) (Figure 8-15a). The surfaces of Pol II bound by DSIF and NELF are covered by TFIIF and TFIIE in the preinitiation complex, but become exposed when polymerase initiates and separates from the general transcription factors. NELF appears to inhibit transcription elongation by blocking the principal channel through which NTPs reach the active site of the enzyme and by inhibiting conformational changes in the RPB1 and RPB2 subunits of Pol II required for translocation of the enzyme down the template.
FIGURE 8-15 Switch from Pol II pausing to active elongation. The structures of the paused transcription elongation complex Pol II–DSIF–NELF and the activated elongation complex Pol II–DSIF–PAF–SPT6. The view is along downstream DNA and looking into the polymerase cleft. The general elongation factor DSIF (red) is present in the paused and activated elongation complex, but changes its conformation between the two complexes. The negative elongation factor NELF (blue) stabilizes the paused state. In the activated elongation complex, the positive elongation factor SPT6 (gray) binds the phosphorylated
linker to the Pol II CTD, and the PAF complex (purple) binds the polymerase funnel and competes with NELF. [Republished with permission of Nature Publishing Group, from P. Cramer, 2019, “Organization and Regulation of Gene Transcription.” Nature 573:45–54; permission conveyed through Copyright Clearance Center, Inc.] Description The space filling 3-D structure of a Pol 2 is on the left in a paused condition. The N E L F area is at the bottom in blue, D S I F area is labeled at the top in red. At the center of the main body of the Pol 2 is pictured a coil of D N A with R N A alongside. The structure on the right shows the same Pol 2 in active elongation. The N E L F is no longer visible, and replaced with a purple area at the bottom labeled P A F. At the top to the right of the D S I F area is a dark grey area labeled S P T 6 at the top and C T D linker at the bottom. Still at the center is the D N A labeled with the R N A more closely linked to the D N A. The inhibition of elongation that results from NELF/DSIF binding to Pol II is relieved when DSIF, NELF, and serine 2 of the Pol II CTD (Tyr-SerPro-Thr-Ser-Pro-Ser) are phosphorylated by the heterodimeric protein kinase CDK9–cyclin T, also called P-TEFb, which associates with the Pol II-NELF-DSIF complex, leading to phosphorylation of NELF and DSIF. Phosphorylated NELF dissociates from the complex, allowing two additional elongation factors to bind. These factors, PAF and SPT6 (Figure 8-15b), block further binding of NELF, which allows the polymerase to resume elongation. Phosphorylated DSIF binds to the RPB1 clamp (see
Figure 8-9) and RPB2 on the other side of the cleft between RPB1 and RPB2, helping to hold the clamp closed, which allows the polymerase to transcribe long distances without terminating and dissociating from the template. These same elongation factors also regulate transcription from
CpG island promoters. So we see that factors that regulate elongation in the promoter-proximal region provide another mechanism for controlling gene transcription in addition to the many factors that regulate transcription initiation. Transcription of HIV (human immunodeficiency virus), the cause of AIDS, is dependent on the activation of CDK9–cyclin T by a small viral protein called Tat. Cells experimentally infected with mutants produce short viral transcripts about 50 nucleotides long. In contrast, cells infected with wild-type HIV synthesize many more long viral transcripts that encompass the entire integrated proviral genome (see Figure 8-16; also Figure 5-43). Thus Tat functions as an anti-pausing factor, permitting RNA polymerase II to read through the transcriptional block caused by NELF binding. (Tat is initially made by rare transcripts that fail to be arrested by NELF when the HIV promoter is transcribed at a high rate in activated T-lymphocytes; see Chapter 24.) Tat is a sequence-specific RNAbinding protein. It binds to the RNA copy of a sequence called TAR, which forms a stem-loop structure near the end of the HIV transcript (Figure 8-16). TAR also binds cyclin T, holding the cyclin T-CDK9 complex close to the polymerase, where it efficiently phosphorylates its substrates, resulting in release of NELF and transcription elongation. Chromatin immunoprecipitation assays done after treating cells with specific inhibitors of CDK9 indicate that transcription of some 30 percent of mammalian genes is regulated by controlling the activity of cyclin TCDK9 (P-TEFb). This regulation is probably due to interactions between
P-TEFb and sequence-specific DNA-binding transcription factors, rather than by an RNA-binding protein, as in the case of HIV Tat.
FIGURE 8-16 Model of antitermination complex composed of HIV Tat protein and several cellular proteins. The TAR element in the HIV transcript contains sequences recognized by Tat and the cellular protein cyclin T. Cyclin T activates and helps position the protein kinase CDK9 near its substrate, the CTD of RNA polymerase II. CTD phosphorylation at serine 2 of the Pol II CTD heptad repeat is required for transcription elongation. Cellular proteins DSIF and the NELF complex are also involved in regulating Pol II elongation, as discussed in the text. See T. Wada et al., 1998, Genes Dev. 12:343; Y. Yamaguchi et al., 1999, Cell 97:451; and T. Yamada et al., 2006, Mol. Cell 21:227. Description The structure is a complex with the H I V D N A across the middle. The red D S I F area is at the top, the blue N E L F area is at the bottom. Also labeled above the D S I F area are an R N A strand called T A R, a blue oval labeled Tat, and two light blue areas labeled Cyclin T and C d k 9. A chain depicted with a black line with yellow circles labeled P comes off to the right of the structure.
KEY CONCEPTS OF SECTION 8.2 RNA Polymerase II Promoters and General Transcription Factors RNA polymerase II initiates transcription of genes at the nucleotide in the DNA template that corresponds to the nucleotide that is capped in the encoded mRNA. Four principal types of promoter sequences have been identified in eukaryotic DNA. The TATA box is prevalent in highly transcribed genes. Initiator promoters are found in some genes, and many strong promoters contain a downstream promoter element (DPE) near +30 and a BRE near −35 required for the highest rates of transcription (see Fig 8-11). CpG islands, the promoters for about 70 percent of protein-coding genes in vertebrates, are characteristic of genes transcribed at a low rate. Transcription by Pol II of genes with a TATA box promoter is initiated by sequential binding of the following in the indicated order: TFIID, which contains the TBP subunit that binds to TATA box DNA; TFIIA and TFIIB; a complex of Pol II and TFIIF; TFIIE; and finally, TFIIH (see Figure 8-13). The helicase activity of a TFIIH subunit helps to separate the DNA strands at the transcription start site in most promoters, a process that requires hydrolysis of ATP. As Pol II begins transcribing away from the start site, its CTD is phosphorylated on serine 5 by the TFIIH kinase domain. In metazoans, NELF and DSIF associate with Pol II after initiation, inhibiting elongation to fewer than 100 bp from the transcription start site. Inhibition of elongation is relieved when cyclin T-CDK9 (also called P-TEFb) associates with the paused elongation complex and CDK9 phosphorylates subunits of NELF, DSIF, and serine 2 of the Pol II CTD, causing dissociation of NELF from the elongating complex. Elongation factors PAF and SPT6 bind to the Pol II surfaces bound by NELF, preventing further NELF binding, and preventing opening of the cleft between RPB1 and RBP2, assisting in long distance processive elongation.
Promoter-Proximal Elements Help Regulate Eukaryotic Genes
8.3 Regulatory Sequences for Protein-Coding Genes and the Proteins Through Which They Function As we have seen, expression of eukaryotic protein-coding genes is regulated by multiple DNA sequences, generically referred to as transcription-control regions. These regions include promoters and other types of control elements located near transcription start sites, as well as sequences located far from the genes they regulate. In this section, we take a closer look at the properties of various control elements found in eukaryotic protein-coding genes and the proteins that bind to them. Promoter-Proximal Elements Help Regulate Eukaryotic Genes Recombinant DNA techniques have been used to systematically mutate the nucleotide sequences of various eukaryotic genes in order to identify transcription-control regions. The use of linker scanning mutagenesis, for example, can pinpoint the sequences within a regulatory region that function to control transcription. In this approach, a set of constructs with contiguous overlapping mutations are assayed for their effect on expression of a reporter gene or production of a specific mRNA (Figure 8-
17a). This type of analysis identified promoter-proximal elements of the thymidine kinase (tk) gene from herpes simplex type I virus (HSV-I). The results demonstrated that the DNA region upstream of the HSV-I tk gene contains three separate transcription-control sequences: a TATA box in the interval from −32 to −16 and two other control elements farther upstream (Figure 8-17b). Experiments using mutants containing single-base-pair changes in promoter-proximal control elements revealed that these elements are generally about 6–12 bp long. In human genes, promoterproximal elements are usually defined as being within bp of a transcription start site (TSS). In vertebrates, promoter-proximal elements are found both upstream and downstream of the TSS at equal frequency. While, strictly speaking, the term promoter refers to the DNA sequence that determines where a polymerase initiates transcription, the term is often used to refer to both a promoter and its associated promoterproximal control elements.
EXPERIMENTAL FIGURE 8-17 Linker scanning mutations identify transcriptioncontrol elements. (a) In linker scanning mutagenesis, a region of eukaryotic DNA (tan) that supports high-level expression of a reporter gene (light purple) is cloned in a plasmid vector as diagrammed at the top. Overlapping linker scanning (LS) mutations (crosshatched areas) are introduced from one end of the region being analyzed to the other. These mutations are created by scrambling the nucleotide sequence in a short stretch of the DNA. After the mutant plasmids are transfected separately into cultured cells, the activity of the reportergene product is assayed. In the example shown here, the sequence from −120 to +1 of the herpes simplex virus thymidine kinase gene, LS mutations 1, 4, 6, 7, and 9 have little or no effect on expression of the reporter gene, indicating that the regions altered in these mutants contain no control elements. Reporter-gene expression is significantly reduced in mutants 2,
3, 5, and 8, indicating that control elements (brown) lie in the intervals shown at the bottom. (b) Analysis of these LS mutations identified a TATA box and two promoter-proximal elements (PE-1 and PE-2). See S. L. McKnight and R. Kingsbury, 1982, Science 217:316. Description (a) A bar model shows the vector D N A on the left followed by the control region (in pink) and ending with an area labeled "t k coding region" This model is repeated 10 times showing a striped area along the control region being changed one step at a time, with 4 control elements highlighted and using dotted lines to line them up at the bottom of the 10 bars. (b) shows the final bar model of the D N A with the pink control region containing two red regions labeled P E-2 and a P E-1 and to the right a yellow area labeled TATA box. In bacteria, regulation of transcription by a control element close to a promoter generally requires its precise localization relative to the transcription start site (TSS). For example, stimulation of E. coli lac operon transcription by CAP protein (cyclic AMP-regulated activator protein) is completely lost when two base pairs are inserted between the CAP protein binding site and the TSS. Extensive experimental analyses in E. coli have shown that this is because transcriptional activation by CAP requires highly specific direct interactions between CAP bound to its specific binding site in DNA and E. coli RNA polymerase bound to the lac promoter. Insertion of two base pairs between their binding sites rotates the CAP site 72° relative to the polymerase and moves it Å away, preventing the interactions between CAP and RNA polymerase required to stimulate transcription.
Distant Enhancers Often Stimulate Transcription by RNA Polymerase II
To test the spacing constraints on control elements in the HSV-I tk promoter region identified by analysis of linker scanning mutations, researchers prepared and assayed constructs containing small deletions and insertions between the elements. Changes in spacing between the promoter and promoter-proximal control elements of 20 bp or fewer had little effect. However, insertions of 30–50 bp between a HSV-I tk promoter-proximal element and the TATA box was equivalent to deleting the element. Similar analyses of other eukaryotic promoters have also indicated that considerable flexibility in the spacing between promoterproximal elements is generally tolerated, but that separations of several tens of base pairs may decrease transcription. Distant Enhancers Often Stimulate Transcription by RNA Polymerase II Transcription from many eukaryotic promoters can also be stimulated by control elements located thousands of base pairs away from the transcription start site. Such long-distance transcription-control elements, referred to as enhancers, are common in eukaryotic genomes but fairly rare in bacterial genomes. Procedures such as linker scanning mutagenesis have indicated that enhancers, usually on the order of 200 bp long, are, like promoter-proximal elements, composed of several functional sequence elements of about 6–12 bp each. As we will see, each of these regulatory elements is a binding site for a sequence-specific DNA-binding transcription factor.
Most Eukaryotic Genes Are Regulated by Multiple Transcription-Control Elements
Analyses of many different metazoan enhancers have shown that they can occur with equal probability upstream from a promoter or downstream from a promoter, where they are within an intron, or even downstream from the final exon of a gene, as in the case of the SALL1 gene (see Figure 8-5a). Many enhancers are cell-type-specific. For example, an enhancer controlling Pax6 expression in the retina is found in the intron between exons 4 and 5 (see Figure 8-4a), whereas an enhancer controlling Pax6 expression in the hormone-secreting cells of the pancreas is located in a roughly 200-bp region upstream of exon 0 (so named because it was discovered after the exon called “exon 1”). Most Eukaryotic Genes Are Regulated by Multiple Transcription-Control Elements Initially, enhancers and promoter-proximal elements were thought to be distinct types of transcription-control elements. However, as more enhancers and promoter-proximal elements were analyzed, the distinctions between them became less clear. For example, both types of elements can generally stimulate transcription even when inverted, and both types are often cell-type-specific. The consensus now is that a spectrum of control elements regulates transcription by RNA polymerase II. At one extreme are enhancers, which can stimulate transcription from a promoter tens of thousands of base pairs away. At the other extreme are promoter-proximal elements, such as the upstream elements controlling the HSV-I tk gene, which lose their influence when moved 30–50 bp farther from the
promoter. Researchers have identified a large number of transcriptioncontrol elements that can stimulate transcription from distances between these two extremes.
Figure 8-18a summarizes the locations of transcription-control sequences for a hypothetical mammalian gene with a promoter containing a TATA box. The transcription start site encodes the first ( ) nucleotide of the first exon of an mRNA, the nucleotide that is capped. In addition to the TATA box at about −31 to −26, promoter-proximal elements, which are relatively short ( bp), are located within the first 200 bp either upstream or downstream of the start site. Enhancers, in contrast, are usually about 50– 200 bp long and are composed of multiple elements of about 6–10 bp. Enhancers may be located up to 50 kb or more upstream or downstream from the start site or within an intron. Like the Pax6 gene, many mammalian genes are controlled by multiple enhancer regions that function in different types of cells.
FIGURE 8-18 General organization of control elements that regulate gene expression in multicellular eukaryotes and yeast. (a) Mammalian genes with a TATA box promoter are regulated by promoter-proximal elements and enhancers. The promoter elements shown in
Figure 8-11 position RNA polymerase II to initiate transcription at the start site and influence the rate of transcription. Enhancers may be either upstream or downstream and as far away as hundreds of kilobases from the transcription start site. In some cases, enhancers lie within introns. Promoter-proximal elements are found upstream and downstream of transcription start sites at equal frequency in mammalian genes. (b) For mammalian genes with a CpG island promoter, transcription initiates at several sites in both the sense and antisense directions from the ends of the CpG-rich region. Transcripts in the sense direction are elongated and are processed into mRNAs by RNA splicing. These genes express mRNAs with alternative exons determined by the transcription start site. Genes with CpG island promoters contain promoter-proximal control elements. Currently, it is not clear whether they are also regulated by distant enhancers. (c) Most S. cerevisiae genes contain only one regulatory region, called an upstream activating sequence (UAS), and a TATA box, which is about 90 bp upstream from the transcription start site. Description (a) A bar model showing several colored bars with the color legend at the bottom left of the illustration. This model highlights the position of a yellow TATA box halfway along the D N A bar with a rightward arrow. (b) Another bar model, this one does not have a yellow TATA box, but highlights a C p G island in light blue on the left side of the bars of this model. Arrows again indicate movement to the right. (c) A bar model about half the length of the first two models shows a green bar at the left labeled enhancer yeast U A S, then a blank space along the bar, a TATA box, another space and then the blue exon section of the gene.
Figure 8-18b summarizes the promoter region of a mammalian gene with a CpG island promoter. About 70 percent of mammalian genes are expressed from CpG island promoters, usually at much lower levels than genes with TATA box promoters. Multiple alternative transcription start sites are used, generating mRNAs with alternative ends for the first exon derived from each start site. Transcription occurs in both directions, but Pol II molecules transcribing in the sense direction are elongated to 3
DNase I Footprinting and EMSA Detect Protein-DNA Interactions
kb or more much more efficiently than transcripts in the antisense direction. In the model organism S. cerevisiae (budding yeast), genes are closely spaced (see Figure 7-4c), and few genes contain introns. In this organism, enhancers, which are referred to as upstream activating sequences (UASs), usually lie within 200 bp upstream of the promoters of the genes they regulate. Most yeast genes contain only one UAS. In addition, S. cerevisiae genes contain a TATA box about 90 bp upstream from the transcription start site (Figure 8-18c). DNase I Footprinting and EMSA Detect Protein-DNA Interactions The various transcription-control elements found in eukaryotic DNA are binding sites for regulatory proteins called transcription factors. The simplest eukaryotic cells encode hundreds of transcription factors, and the human genome encodes at least 1600. The transcription of each gene in the genome is independently regulated by combinations of specific transcription factors that bind to the gene’s transcription-control regions. The number of possible combinations of this many transcription factors is astronomical, sufficient to generate unique controls for every gene encoded in the genome. In yeast, Drosophila, and other genetically tractable eukaryotes, numerous genes encoding transcription activators and repressors have been
identified by classical genetic analyses like those described in Chapter 6. However, in mammals and other vertebrates, which are less amenable to such genetic analysis, most transcription factors have been detected initially and subsequently purified by biochemical techniques. In this approach, a DNA-regulatory element that has been identified by the kinds of mutational analyses described above is used to identify cognate proteins — those proteins that bind specifically to it. Two common techniques for detecting such cognate proteins are DNase I footprinting and the electrophoretic mobility shift assay. DNase I footprinting takes advantage of the fact that when a protein is bound to a region of DNA, it protects that DNA sequence from digestion by nucleases. As illustrated in Figure 8-19, samples of a DNA fragment that has been labeled with a radioactive molecule at one end of one strand are digested under carefully controlled conditions in the presence and absence of a DNA-binding protein. Then the DNA is purified away from all of the protein, denatured and electrophoresed, and the resulting gel is subjected to autoradiography. The region protected by the bound protein appears as a gap, or footprint, in the array of bands resulting from digestion in the absence of the protein. When footprinting is performed with a DNA fragment containing a known transcription-control element, the appearance of a footprint indicates the presence of a transcription factor that binds that control element in the protein sample being assayed. Footprinting also identifies the specific DNA sequence to which the transcription factor binds.
EXPERIMENTAL FIGURE 8-19 DNase I footprinting reveals the region of a DNA sequence where a transcription factor binds. (a) A DNA fragment known to contain a transcription-control element is labeled at one end with (red dot). Portions of the labeled DNA sample are then digested with DNase I in the presence and in the absence of protein samples containing a sequence-specific DNA-binding protein. DNase I hydrolyzes the phosphodiester bonds of DNA between the oxygen on the deoxyribose of one nucleotide and the phosphate of the next nucleotide. A low concentration of DNase I is used so that, on average, each DNA molecule is cleaved just once (vertical arrows). If the protein sample does not contain a protein that binds to a specific sequence in the labeled DNA, the DNA fragment is cleaved at multiple positions between the labeled and unlabeled ends of the original fragment, as in sample A (left). If the protein sample does contain such a protein, as in sample B (right), the protein binds to its cognate sequence in the DNA, thereby protecting a portion of the fragment from digestion. Following DNase treatment, the DNA is separated from protein, denatured to separate the strands, and electrophoresed. Autoradiography of the resulting gel detects only labeled strands and reveals fragments extending from the labeled end to the site of cleavage by DNase I. Cleavage fragments
containing the transcription-control element show up on the gel for sample A but are missing in sample B because the bound cognate protein has blocked cleavages within that sequence and thus production of the corresponding fragments. The missing bands on the gel constitute the footprint. (b) Footprints produced by increasing amounts of TBP (indicated by the triangle) and of TFIID on the strong adenovirus major late promoter. [Part (b) Republished with permission from Cold Spring Harbor Laboratory Press, from Q. Zhou et al., 1992, “Holo-TFIID Supports Transcriptional Stimulation by Diverse Activators and from a TATA-Less Promoter,” Genes Dev. 6(10):1964–1974.] Description (a) Six strands of D N A are depicted schematically. A protein binding sequence is represented by a box at the center of the strand. A 32-P radioactive label is at the start of the D N A strand. Under the title, 'sample A (D N A-binding protein absent)' , arrows indicate digestion points for D Nase that occur equidistantly along the length of the D N A. Under the title 'sample B (D N A-binding protein present)', the protein-binding sequence is covered by the binding protein. Arrows indicate the digestion sites, as in sample 'a'; however, digestion sites covered by the protein are no longer indicated. (b) Nine sample lanes are in a developed electrophoresis gel. Three lanes correspond to no protein. Four correspond to the presence of T B P. The increasing concentration of T B P is indicated by a wedge-shape, increasing in height from left to right. Two lanes correspond to T F-two-D. The lowering concentration of T F-two-D is indicated by a left to right decreasing wedge shape. The vertical scale is labeled 'base pairs from the transcription starting site'. For example, DNase I footprinting of the strong adenovirus late promoter shows a protected region over the TATA box when TBP is added to the labeled DNA before DNase I digestion (Figure 8-19b). DNase I does not digest all phosphodiester bonds in a duplex DNA at equal rate. Consequently, in the absence of added protein (lanes 1, 6, and 9), a particular pattern of bands is observed that depends on the DNA sequence and results from cleavage at some phosphodiester bonds and not others.
However, when increasing amounts of TBP are incubated with the endlabeled DNA before digestion with DNase I, TBP binds to the TATA box, and when sufficient TBP is added to bind all the labeled DNA molecules, it protects the region between about −35 and −20 from digestion (lanes 2– 5). In contrast, increasing amounts of TFIID (lanes 7 and 8) protect not only the TATA box region but also regions near −7 to +5, +10 to +15, and +20 from digestion, producing a footprint different from TBP’s. Results such as this tell us that other subunits of TFIID (the TBP-associated factors, or TAFs) also bind to the DNA in the region downstream from the TATA box. The electrophoretic mobility shift assay (EMSA), also called the gelshift or band-shift assay, is more useful than the footprinting assay for quantitative analysis of DNA-binding proteins. In general, the electrophoretic mobility of a DNA fragment is reduced when it is complexed with protein, causing a shift in the location of the fragment band. EMSA can be used to detect a transcription factor in protein fractions incubated with a radiolabeled DNA fragment (the probe) containing a known control element (Figure 8-20). As the amount of transcription factor added to the binding reaction is increased, the more labeled probe is shifted to the position of the DNA-protein complex. The results indicate that the concentration of this specific DNA-binding protein was highest in fraction 8, lower in fraction 7, still lower in fraction 9, and undetectable by this assay in the other fractions eluted from the column.
EXPERIMENTAL FIGURE 8-20 The electrophoretic mobility shift assay can be used to detect transcription factors during purification. In this example, protein fractions separated by column chromatography were assayed for their ability to bind to a radiolabeled DNA-fragment probe containing a known regulatory element. An aliquot of the protein sample that had been loaded onto the column (ON) and successive column fractions (numbers) were incubated with the labeled probe. The samples were then electrophoresed under conditions that do not disrupt protein-DNA interactions. The free probe not bound to protein migrated to the bottom of the gel. A protein in fractions 7 and 8 bound to the probe (as did protein in the unfractionated sample in column ON), forming a DNA-protein complex that migrated more slowly than the free probe. These fractions are therefore likely to contain the regulatory protein being sought. [Republished with permission of American Society for Biochemistry and Molecular Biology, from S. Yoshinaga et al., 1989, “Purification and Characterization of Transcription Factor IIIC2,” J. Biol. Chem. 264:10726; permission conveyed through Copyright Clearance Center, Inc.] Description The photo shows a dark row of 23 fractions at the bottom labeled "free probe." At the top, the fractions are numbered with the letters ON above the leftmost column. This
leftmost column is tall and is labeled "Bound probe," and fractions 7 and 8 show a taller column that is lighter in color than the ON column. In the biochemical isolation of a transcription factor, an extract of cell nuclei is commonly subjected sequentially to several types of liquid chromatography (see Chapter 3). Fractions eluted from the columns are assayed by DNase I footprinting or EMSA using DNA fragments containing an identified regulatory element (see Figure 8-17). Fractions containing a protein that binds to the regulatory element in these assays contain a putative transcription factor. A powerful technique that is commonly used for the final step in purifying transcription factors is sequence-specific DNA affinity chromatography, a particular type of affinity chromatography in which long DNA strands containing multiple copies of the transcription-factor-binding site are coupled to a column matrix. Once a transcription factor has been isolated and purified, its partial amino acid sequence can be determined and used to clone the gene or cDNA encoding it, as outlined in Chapter 6. The isolated gene can then be used to test the ability of the encoded protein to activate or repress transcription in an in vivo transfection assay (Figure 8-21).
EXPERIMENTAL FIGURE 8-21 An in vivo transfection assay measures transcription activity to evaluate proteins believed to be transcription factors. The assay system requires two plasmids. One plasmid contains the gene encoding the putative transcription factor (protein X). The second plasmid contains a reporter gene (e.g., luciferase) and one or more binding sites for protein X. Both plasmids are simultaneously introduced into cells that lack the gene-encoding protein X. The production of reporter-gene RNA transcripts is measured; alternatively, the activity of the encoded protein can be assayed. If reporter-gene transcription is greater in the presence of the X-encoding plasmid than in its absence, then
Activators Are Composed of Distinct Functional Domains
the protein is an activator; if transcription is less, then it is a repressor. By use of plasmids encoding a mutated or rearranged transcription factor, important domains of the protein can be identified. Description Two plasmids, labeled plasmid 1 and 2, are at the top, Plasmid 1 contains a gene coding protein X. Plasmid 2 contains a reporter gene and a binding site for protein X. A cell transfected by the plasmids, is depicted as a pink circle with downward arrows indicating the movement of the plasmids into the cell. The plasmids are inside the nucleus of the cell as circle 1 and circle 2. An arrow from circle 1 points toward protein X outside the nucleus. Another arrow from protein X pointing toward circle 2 indicates movement of protein X inside the nucleus, toward circle 2. Three blue wavy lines emerging from circle 2 indicate reporter gene transcripts. Activators Are Composed of Distinct Functional Domains Studies with a yeast transcription activator called Gal4 provided early insight into the domain structure of transcription factors. The gene encoding Gal4, which promotes expression of enzymes needed to metabolize galactose, was identified by complementation analysis of gal4 mutants that cannot form colonies on an agar medium in which galactose is the only source of carbon and energy (see Chapter 6). Directed mutagenesis studies, like those described previously, identified UASs for the genes activated by Gal4 (see Figures 8-17). Each of these UASs was found to contain one or more copies of a 17-bp sequence called . DNase I footprinting assays with recombinant Gal4 protein produced in E.
coli from the yeast GAL4 gene showed that Gal4 binds to sequences. When a copy of was cloned upstream of a TATA box followed by a β-galactosidase reporter gene, and that construct was introduced into yeast cells, expression of β-galactosidase was activated in galactose media in wild-type cells, but not in gal4 mutants. These results showed that is a transcription-control element activated by the Gal4 transcription factor in galactose media. A remarkable set of experiments demonstrated that the Gal4 transcription factor is composed of separable functional domains: an N-terminal DNAbinding domain, which binds to specific DNA sequences, and a C-terminal activation domain, which interacts with other proteins to stimulate transcription from a nearby promoter (Figure 8-22). When the N-terminal DNA-binding domain of Gal4 was fused directly to various portions of its own C-terminal region, deleting internal sequences, the resulting truncated proteins retained the ability to stimulate expression of a reporter gene in an in vivo assay like that depicted in Figure 8-21. Thus the internal portion of the protein is not required for the functioning of Gal4 as a transcription factor. Similar experiments with another yeast activator, Gcn4, which regulates genes required for the synthesis of many amino acids, indicated that it contains a roughly 50–amino acid DNAbinding domain at its C-terminus and a roughly 20–amino acid activation domain near the middle of its sequence.
EXPERIMENTAL FIGURE 8-22 Deletion mutants of the GAL4 gene in yeast with a reporter-gene construct demonstrate the separate functional domains in a transcription activator. (a) Diagram of DNA construct containing a lacZ reporter gene (encoding β-galactosidase) and TATA box ligated to , a regulatory element that contains several Gal4-binding sites. The reporter-gene construct and DNA encoding wildtype or mutant (deleted) Gal4 were simultaneously introduced into mutant (gal4) yeast cells, and the activity of β-galactosidase expressed from lacZ was assayed. Activity should be high if the introduced GAL4 DNA encodes a functional protein. (b) Schematic diagrams of wild-type Gal4 and various mutant forms. Small numbers refer to positions in the wild-type sequence. Deletion of 50 amino acids from the N-terminal end destroyed the ability of Gal4
to bind to and to stimulate expression of β-galactosidase from the reporter gene. Proteins with extensive deletions from the C-terminal end still bound to These results localize the DNA-binding domain to the N-terminal end of Gal4. The ability to activate β-galactosidase expression was not entirely eliminated unless somewhere between 126 and 189 or more amino acids were deleted from the C-terminal end. Thus the activation domain lies in the C-terminal region of Gal4. Proteins with internal deletions (bottom) were also able to stimulate expression of β-galactosidase, indicating that the central region of Gal4 is not crucial for its function in this assay. See J. Ma and M. Ptashne, 1987, Cell 48:847; I. A. Hope and K. Struhl, 1986, Cell 46:885; and R. Brent and M. Ptashne, 1985, Cell 43:729. Description (a) A bar model shows a reporter gene construct, labeled with a green rectangle of the U A S, a gap, a small yellow TATA box, another gap and a blue rectangle labeled lacZ gene. (b) An orange colored bar model labeled wild type with a highlighted area at the left labeled D N A binding domain and another area highlighted at the right end labeled activation domain. Below this are 10 bar model schematics in lighter orange. The first 7 are labeled N- and C- terminal deletion mutants. The bottom 3 are labeled internal deletion mutants. Each bar has a different length with numbers to indicate where on the gene they are located. The internal mutants are much shorter than the 7 mutants above. Further evidence for the existence of distinct activation domains in Gal4 and Gcn4 came from experiments in which their activation domains were fused to a DNA-binding domain from an entirely unrelated E. coli DNAbinding protein. When these fusion proteins were assayed in vivo, they activated transcription of a reporter gene containing the cognate site for the E. coli protein. Thus functional transcription factors can be constructed from novel combinations of bacterial and eukaryotic protein domains.
Studies such as these have now been carried out with many eukaryotic transcription factors. The structural model of eukaryotic activators that has emerged from these studies is a modular one. Specifically, one or more activation domains are connected to a sequence-specific DNA-binding domain by flexible, intrinsically disordered protein domains (Figure 8-23). In some cases, amino acids included in the DNA-binding domain also contribute to transcriptional activation. As discussed in a later section, activation domains function by binding other proteins involved in both the control of chromatin condensation and transcription. The presence of flexible, intrinsically disordered protein domains (see Figure 3-13) connecting the DNA-binding domain to the activation domains may explain why alterations in the spacing between control elements are so well tolerated in eukaryotic control regions. Thus even when the positions of transcription factors bound to DNA are shifted relative to each other, their activation domains may still be able to interact because they are attached to their DNA-binding domains through flexible protein regions. Also, as discussed in Section 8.4, some intrinsically disordered regions in transcription factors and other proteins involved in transcription interact through multiple low-affinity contacts to form condensates within the nucleus. These condensates concentrate proteins involved in transcription, increasing the rates with which they interact, thus greatly stimulating the rate of transcription.
FIGURE 8-23 Schematic diagrams illustrating the modular structure of eukaryotic transcription activators. Transcription factors may contain more than one activation domain but rarely contain more than one DNA-binding domain. Gal4 and Gcn4 are yeast transcription activators. The glucocorticoid receptor (GR) promotes transcription of target
Repressors Are the Functional Converse of Activators
genes when certain hormones are bound to the C-terminal activation domain. SP1 binds to GC-rich promoter elements (e.g., GCGGCGCGGC) in a large number of mammalian genes. Description Four eukaryotic transcription factors are depicted schematically. These are composed of a D N A binding domain represented by a blue oval, an activation domain represented by a green oval, and an intrinsically disordered protein domain represented by a wavy line that connects the ovals like beads. . The four examples are G A L 4, G C N 4, G R, and S P 1. Repressors Are the Functional Converse of Activators Eukaryotic transcription is regulated by repressors as well as activators. For example, geneticists have identified mutations in yeast that result in continuously high expression of certain genes. This type of unregulated, abnormally high expression, called constitutive expression, results from the inactivation of a repressor that normally inhibits the transcription of these genes. Similarly, mutants of Drosophila melanogaster and Caenorhabditis elegans have been isolated that are defective in embryonic development because they express genes in embryonic cells where those genes are normally repressed. The mutations in these mutants inactivate repressors, leading to abnormal development. Repressor-binding sites in DNA have been identified by systematic linker scanning mutation analyses similar to the one depicted in Figure 8-17. In
DNA-Binding Domains Can Be Classified into Numerous Structural Types
this type of analysis, whereas mutation of an activator-binding site leads to decreased expression of the linked reporter gene, mutation of a repressor-binding site leads to increased expression of a reporter gene. The repressor proteins that bind such sites can be purified and assayed for their ability to bind to the repressing DNA-control element using the same biochemical techniques described earlier for activator proteins. Eukaryotic transcription repressors are the functional converse of activators. They can inhibit transcription of a gene they do not normally regulate when their cognate binding sites are placed within tens of base pairs to many kilobases of the gene’s transcription start site. Like activators, most eukaryotic repressors are modular proteins that have two functional domains: a DNA-binding domain and a repression domain. Like activation domains, repression domains continue to function when fused to another type of DNA-binding domain. If binding sites for this second DNA-binding domain are inserted within a few hundred base pairs of a promoter, expression of the fusion protein inhibits transcription from the promoter. Also like activation domains, repression domains function by interacting with other proteins, as discussed later in this chapter. DNA-Binding Domains Can Be Classified into Numerous Structural Types To activate or repress transcription, transcription factors must bind to the specific DNA sequences of transcription control regions via their DNA-
binding domains. The DNA-binding domains of eukaryotic transcription factors are comprised of a variety of structural motifs that bind specific DNA sequences. The ability of DNA-binding proteins to bind to specific DNA sequences commonly results from noncovalent interactions between atoms in an α helix in the DNA-binding domain and atoms on the edges of the bases within the major groove in the DNA. Ionic interactions between positively charged residues arginine and lysine and negatively charged phosphates in the sugar-phosphate backbone, and in some cases, interactions with atoms in the DNA minor groove, also contribute to binding. The principles of specific protein-DNA interactions were first discovered during the study of bacterial repressors. Many bacterial repressors are dimeric proteins in which an α helix from each monomer inserts into the major groove in the DNA helix and makes multiple, specific interactions with the atoms there (Figure 8-24). This α helix is referred to as the recognition helix or sequence-reading helix because most of the amino acid side chains that contact bases in the DNA extend from this helix. The recognition helix, which protrudes from the surface of a bacterial repressor, is usually supported in the protein structure in part by hydrophobic interactions with a second α helix located just to the aminoterminal side of it. This entire structural element, which is present in many bacterial repressors, is called a helix-turn-helix motif (see Figure 8-24).
FIGURE 8-24 Interaction of bacteriophage 434 repressor with DNA. (a) Ribbon diagram of 434 repressor bound to its specific operator DNA. The recognition helices are green. The beginning of the α helix N-terminal to the recognition helix is yellow and the turn in the polypeptide backbone between the helices in the helix-turn-helix structural motif is red. (b) A space-filling model of the repressor-operator complex shows how the protein interacts intimately with one side of the DNA molecule over a length of 1.5 turns. [Data from A. K. Aggarwal et al., 1988, Science 242:899, PDB ID 2ori.] Description (a) The bacteriophage 434 has a green area labeled Helix (recognition) and a yellow area labeled Helix. Arrows and marks indicate how the bacteriophage has 1.5 turns as it interacts with the D N A. (b) A space filling 3-D model where the D N A is depicted as a black and grey twist of space, and two areas of the bacteriophage are depicted in orange and pink.
There are a number of structural motifs in eukaryotic transcription factors that present an α helix to the major groove of DNA. Because most of these motifs have characteristic consensus–amino acid sequences, potential transcription factors can be recognized among the cDNA sequences from various tissues that have been characterized in humans and other species. Here we introduce several common classes of DNA-binding proteins whose three-dimensional structures have been determined. In all of these examples, and in many other transcription factors, at least one α helix is inserted into the major groove of DNA. However, note that some transcription factors contain alternative structural motifs that interact with DNA (e.g., β strands and loops; see NFAT in Figure 8-28a as an example). Homeodomain Proteins Many eukaryotic transcription factors that function during development contain a conserved 60-residue DNA-binding motif, called a homeodomain, that is similar to the helix-turn-helix motif of bacterial repressors. These transcription factors were first identified in Drosophila mutants in which one body part was transformed into another during development (see Figure 8-2b). The conserved homeodomain sequence has also been found in vertebrate transcription factors, including those that have similar master-control functions required for the development of anatomical structures. Zinc-Finger Proteins
The DNA-binding domain found most often in vertebrate genomes is called a zinc finger. The polypeptide chain in this structural domain is folded around a central ion, producing a compact domain from a relatively short length of polypeptide ( amino acid residues). This structural motif was first recognized in DNA-binding domains, but is now known to occur in other proteins that do not bind to DNA. Here we describe two of the several classes of zinc-finger motifs that have been identified in eukaryotic transcription factors. The zinc finger is the most common DNA-binding motif encoded in the human genome and the genomes of other vertebrates and is also common in multicellular plants. This motif has a 23–26-residue consensus sequence containing two conserved cysteine (C) and two conserved histidine (H) residues, whose side chains bind one ion (see Figure 37c). The name “zinc finger” was coined because a two-dimensional diagram of the structure resembles a finger. When the three-dimensional structure was solved, it became clear that the binding of the ion by the two cysteine and two histidine residues folds the relatively short polypeptide sequence into a compact domain, which can insert its α helix into the major groove of DNA. zinc finger proteins contain at least two of these Zn-fingers, and many contain multiple zinc fingers, which interact with successive groups of base pairs, within the major groove, as the protein wraps around the DNA double helix (Figure 8-25a).
FIGURE 8-25 Eukaryotic DNA-binding domains that use an α helix to interact with the major groove of specific DNA sequences. (a) The GL1 DNA-binding domain is monomeric and contains five zinc fingers. The α helices are shown as cylinders, the ions as spheres. Finger 1 does not interact with DNA, whereas the other four fingers do. (b) The glucocorticoid receptor is a homodimeric zinc-finger protein. The α helices are shown as cylinders, the β strands as white arrows, and the ions as black spheres. Two α helices, one in each monomer, interact with the DNA. Like all zinc-finger homodimers, this transcription factor has twofold rotational symmetry. (c) In leucine-zipper proteins, basic residues in the extended α-helical regions of the monomers interact with the DNA backbone at adjacent sites in the major groove. The coiled-coil dimerization domain is stabilized by hydrophobic interactions between the monomers. (d) In bHLH proteins, the DNA-binding helices at the bottom (N-termini of the monomers) are separated by nonhelical loops from a leucine zipper–like region containing a coiled-coil dimerization domain.
[Part (a) Data from N. P. Pavletich and C. O. Pabo, 1993, Science 261:1701. Part (b) Data from B. F. Luisi et al., 1991, Nature 352:497. Part (c) Data from T. E. Ellenberger et al., 1992, Cell 71:1223, PDB ID 1ysa. Part (d) Data from A. R. Ferre-D’Amare et al., 1993, Nature 363:38, PDB ID 1an2.] Description (a) A double helix model of D N A with 5 green cylinders in a ribbon shape indicating zinc fingers, 5 black dots labeled Z n, and the ribbon structure interacting with the D N A model. (b) Double helix model of D N A with a ribbon model showing black dots labeled Z n and a green cylinder in the ribbon labeled binding domain 1 plus a yellow cylinder in the ribbon labeled binding domain 2. (c) The D N A double helix is on the right with a straight green ribbon and a straight yellow ribbon both going horizontally through the D N A model, with the ribbons being whole and crossing before entering the D N A model. (d) In the D N A model on the right, the horizontal green ribbon and yellow ribbon break apart before going into the D N A model. A second type of zinc-finger structure, designated the zinc finger (because it has four conserved cysteines in contact with the ), is found in some 50 human transcription factors. The first members of this class were identified as specific intracellular high-affinity binding proteins, or “receptors,” for steroid hormones, which led to the name steroid receptor superfamily. Because similar intracellular receptors for nonsteroid hormones were subsequently found, these transcription factors are now commonly called nuclear receptors. The characteristic feature of zinc fingers is the presence of two groups of four critical cysteines, one toward each end of the 55–56-residue domain. Although the zinc finger was initially named by analogy with the zinc finger, the three-dimensional structures of proteins containing these
DNA-binding motifs were later found to be quite distinct. A particularly important difference between the two is that zinc-finger proteins generally contain three or more repeating finger units and bind as monomers, whereas zinc-finger proteins generally contain only two finger units and generally bind to DNA as homodimers or heterodimers. Homodimers of zinc-finger DNA-binding domains have twofold rotational symmetry (Figure 8-25b). Consequently, homodimeric nuclear receptors bind to consensus DNA sequences that are inverted repeats. Leucine-Zipper Proteins Another structural motif present in the DNA-binding domains of a large class of transcription factors contains the hydrophobic amino acid leucine at every seventh position in the sequence. These proteins bind to DNA as dimers, and mutagenesis of the leucines has shown that they are required for dimerization. Consequently, the name leucine zipper was coined to denote this structural motif of a coiled coil of two α helices. The DNA-binding domain of the yeast Gcn4 transcription factor mentioned earlier is a leucine-zipper domain. X-ray crystallographic analysis of complexes between DNA and the Gcn4 DNA-binding domain has shown that the dimeric protein contains two extended α helices that grip the DNA molecule, much like a pair of scissors, at two adjacent sites in the major groove separated by about half a turn of the double helix (Figure 8-25c). The portions of the α helices contacting the DNA include positively charged (basic) residues that interact with phosphates in the
DNA backbone and additional residues that interact with specific bases in the major groove. Gcn4 forms dimers via hydrophobic interactions between the C-terminal regions of the α helices, forming a coiled-coil structure. This structure is common in proteins containing amphipathic α helices in which hydrophobic amino acid residues are regularly spaced alternately three or four positions apart in the sequence, forming a stripe down one side of the α helix. These hydrophobic stripes make up the interacting surfaces between the α-helical monomers in a coiled-coil dimer (see Figure 3-7a). Although the first leucine-zipper transcription factors to be analyzed contained leucine residues at every seventh position in the dimerization region, additional DNA-binding proteins containing other hydrophobic amino acids in these positions were subsequently identified. Like leucinezipper proteins, they form dimers containing a C-terminal coiled-coil dimerization region and an N-terminal DNA-binding domain. The term basic zipper (bZIP) is now frequently used to refer to all proteins with these common structural features. Many basic-zipper transcription factors are heterodimers of two different polypeptide chains, each containing one basic-zipper motif. Basic Helix-Loop-Helix (bHLH) Proteins The DNA-binding domain of another class of dimeric transcription factors contains a structural motif that is very similar to the basic-zipper motif except that a nonhelical loop of the polypeptide chain separates two α-
Structurally Diverse Activation and Repression Domains Regulate Transcription
helical regions in each monomer (Figure 8-25d). Termed a basic helixloop-helix (bHLH), this motif was predicted from the amino acid sequences of these proteins, which contain an N-terminal α helix with basic residues that interact with DNA, a middle loop region, and a C-terminal region, with hydrophobic amino acids spaced at intervals characteristic of an amphipathic α helix, that dimerizes into a coiled coil. As with basic-zipper proteins, different bHLH proteins can form heterodimers. Structurally Diverse Activation and Repression Domains Regulate Transcription Experiments with fusion proteins composed of the Gal4 DNA-binding domain and random segments of E. coli proteins demonstrated that a diverse group of amino acid sequences ( percent of all E. coli sequences) can function as activation domains, even though they evolved to perform other functions. Many transcription factors contain activation domains marked by an unusually high percentage of particular amino acids. Gal4, Gcn4, and most other yeast transcription factors, for instance, have activation domains that are rich in acidic amino acids (aspartic and glutamic acids). These so-called acidic activation domains are generally capable of stimulating transcription in nearly all types of eukaryotic cells — fungal, animal, and plant cells. Activation domains from some Drosophila and mammalian transcription factors are glutamine-rich, and some are proline-rich; still others are rich in the closely related amino
acids serine and threonine, both of which have hydroxyl groups. However, some strong activation domains are not particularly rich in any specific amino acid. Biophysical studies indicate that acidic activation domains have an unstructured, random-coil, intrinsically disordered conformation. These domains stimulate transcription when they are bound to a protein coactivator. The interaction with a co-activator causes the activation domain to assume a more structured α-helical conformation in the activation domain–co-activator complex. A well-studied example of a transcription factor with an acidic activation domain is the mammalian CREB protein, which is phosphorylated in response to increased levels of cAMP. This regulated phosphorylation is required for CREB to bind to its co-activator CBP (CREB binding protein), resulting in the transcription of genes whose control regions contain a CREB-binding site (see Figure 15-24). When the phosphorylated random-coil activation domain of CREB interacts with CBP, it undergoes a conformational change to form two α helices linked by a short loop, which wrap around the interacting domain of CBP (Figure 826a).
FIGURE 8-26 Activation domains may be random coils until they interact with coactivator proteins or folded protein domains. (a) The activation domain of CREB (cyclic AMP response element-binding protein) is activated by phosphorylation at serine 133. It is a random coil until it interacts with a domain of its co-activator, CBP (shown as a spacefilling surface model with negatively charged regions in red and positively charged regions in blue). When the CREB activation domain binds to CBP, it folds into two amphipathic α helices. Side chains in the activation domain that interact with the surface of the CBP domain are labeled. (b) The ligand-binding activation domain of the estrogen receptor is a folded-protein domain. When estrogen is bound to the domain, the green α helix interacts with the ligand, generating a hydrophobic groove in the ligand-binding domain (dark brown helices), which binds an amphipathic α helix in a co-activator subunit (blue). (c) The conformation of the estrogen receptor in the absence of hormone is stabilized by binding of the estrogen antagonist tamoxifen. In this conformation, the green helix of the receptor folds into a conformation that interacts with the co-activator–binding groove of the active receptor, sterically blocking binding of co-activators. [Part (a) Data from I. Radhakrishnan et al., 1997, Cell 91:741, PDB ID 1kdx. Parts (b) and (c) Data from A. K. Shiau et al., 1998, Cell 95:927, PDB ID 3erd and 3ert.] Description (a) A space filling 3-D model in red and blue. The top left area is labeled Domain of C B P, a green ribbon going through the structure is labeled C R E B activation domain. Along the green ribbon are numbers indicating different locations of C R E B. (b) A ribbon model in brown and gold colors, with a gray area in lower center labeled Estrogen (agonist). A blue section of ribbon above and to the right of this is labeled omega helix from interacting co-activator. (c) A ribbon model also colored in gold and brown, with a gray area in the low center of it labeled Tamoxifen (antagonist), the section of ribbon that was blue in model b is now green. Some activation domains are larger and more highly structured than acidic activation domains. For example, the ligand-binding domains of nuclear receptors function as activation domains when they bind their specific
Transcription Factor Interactions Increase Gene-Control Options
hormone ligand (Figure 8-26b, c). Binding of ligand induces a large conformational change in the nuclear receptor that allows the ligandbinding domain with bound hormone to interact with a short α helix in a co-activator; the resulting complex can then activate transcription of genes whose control regions bind the nuclear receptor. Thus the acidic activation domain in CREB and the ligand-binding activation domains in nuclear receptors represent two structural extremes. The CREB acidic activation domain is an intrinsically disordered random coil that folds into two α helices when it binds to the surface of a globular domain in a co-activator. In contrast, the nuclear-receptor ligand-binding activation domain is a structured globular domain that interacts with a short α helix in a co-activator, which probably is a random coil before it is bound. In both cases, however, specific protein-protein interactions between a co-activator and the activation domain permit the transcription factor to stimulate gene expression. Currently, less is known about the structure of repression domains. The globular ligand-binding domains of some nuclear receptors function as repression domains in the absence of their specific hormone ligand. Like activation domains, repression domains may be relatively short, comprising 15 or fewer amino acids. Biochemical and genetic studies indicate that repression domains also mediate protein-protein interactions and bind to co-repressor proteins, forming a complex that inhibits transcription initiation by mechanisms that are discussed later in the chapter.
Transcription Factor Interactions Increase Gene-Control Options Two types of DNA-binding proteins discussed previously — bZIP and bHLH proteins — often exist in alternative heterodimeric combinations of monomers. Other classes of transcription factors not discussed here also form heterodimeric proteins. In some heterodimeric transcription factors, each monomer recognizes the same sequence. In these cases, the formation of alternative heterodimers does not increase the number of different sites on which the monomers can act, but rather allows the activation domains associated with each monomer to be brought together in alternative combinations that bind to the same site (Figure 8-27a). As we will see later, and in subsequent chapters, the activities of individual transcription factors can be regulated by multiple mechanisms. Consequently, a single bZIP- or bHLH-binding DNA-regulatory element in the transcription-control region of a gene may elicit different transcriptional responses depending on which bZIP or bHLH monomers are expressed in the cell and how their activities are regulated.
FIGURE 8-27 Combinatorial possibilities due to formation of heterodimeric transcription factors. (a) In some heterodimeric transcription factors, the activation domain of each monomer recognizes the same DNA sequence. In the hypothetical example shown, transcription-factor monomers A, B, and C can all interact with one another, creating six different alternative combinations of activation domains that can all bind at the same site.
Each composite binding site is divided into two half-sites, and each heterodimeric factor contains the activation domains of its two constituent monomers. (b) When transcriptionfactor monomers recognize different DNA sequences, six alternative combinations of the transcription-factor monomers A, B, and C, each with a unique pair of activation domains, can bind to six different DNA sequences (sites 1–6). (c) Expression of an inhibitory factor (red) that interacts only with dimerization domain of A inhibits binding; hence transcriptional activation at sites 1, 4, and 5 is inhibited, but activation at sites 2, 3, and 6 is unaffected. Description (a) A box contains a key showing three transcription factors, A, B, and C each represented by a gray box with an attached circle. The circle represents the activation domain and the square represents the D N A binding domain. The transcription factors interact with the D N A. The possible combinations of transcription factors are A A, B B, C C, A b, A C, and B C. (b) A box contains a key with three transcription factors, A, B, C and an inhibitory factor each represented by a colored box with an attached circle. The circle represents the activation domain and the square represents the D N A binding domain. The D N A binding domain binds to different sites, indicated by different colors. The possible combinations are A A, B B, C C, A b, A C, and B C. (c) A box contains a key with three transcription factors, A, B, C and an inhibitory factor each represented by a colored box with an attached circle. The circle represents the activation domain and the square represents the D N A binding domain. The D N A binding domain binds to different sites, indicated by different colors. Binding to the inhibitory factor is also depicted, in which case binding to D N A does not occur. For example, A plus inhibitor equals no binding, B plus B binding, C plus C binding, A plus inhibitor to D N A site A B equals no binding. A plus inhibitor binding to D N A site A C equals no binding, and B plus C equals binding. In some heterodimeric transcription factors, however, each monomer has a different DNA-binding specificity. The resulting combinatorial possibilities increase the number of potential DNA sequences that a family of transcription factors can bind. Three different transcription-factor
monomers could theoretically combine to form six different homo- and heterodimeric transcription factors, as illustrated in Figure 8-27b. Four different monomers could form a total of ten dimeric factors; five monomers, sixteen dimeric factors; and so forth. In addition, inhibitory factors are known that bind to some bZIP and bHLH monomers, thereby blocking their binding to DNA. When these inhibitory factors are expressed, they repress transcriptional activation by the factors with which they interact (Figure 8-27c). Thus the rules governing the interactions of members of a heterodimeric transcription factor family are complex. This combinatorial complexity expands both the number of DNA sites from which these factors can activate transcription and the ways in which they can be regulated. Similar combinatorial transcription regulation is achieved through the interaction of structurally unrelated transcription factors bound to closely spaced binding sites in DNA. An example is the interaction of two transcription factors, NFAT and AP1, that bind to neighboring sites in a composite promoter-proximal element regulating the gene encoding interleukin-2 (IL-2). Expression of the IL-2 gene is critical to the immune response, but abnormal expression of IL-2 can lead to autoimmune diseases such as rheumatoid arthritis (see Chapter 24). Neither NFAT nor AP1 binds to its site in the IL-2 control region in the absence of the other protein. The affinities of these factors for these particular DNA sequences are too low for the individual factors to form a stable complex with DNA. However, when both NFAT and AP1 are present, protein-protein interactions between them stabilize the ternary complex composed of NFAT, AP1, and DNA (Figure 8-28a). Such cooperative DNA binding by
various transcription factors results in considerable combinatorial complexity of transcriptional control. As a result, the 1600 or so transcription factors encoded in the human genome can bind to DNA through a much larger number of cooperative interactions, resulting in unique transcriptional control for each of the roughly 20,000 human genes. In the case of IL-2, transcription occurs only when NFAT is activated, which results in its transport from the cytoplasm to the nucleus, and when the genes encoding the two subunits of AP1 are activated at the same time. These two events are controlled by distinct signal transduction pathways (see Chapters 15 and 16), allowing stringent control of IL-2 expression.
FIGURE 8-28 Cooperative binding of two unrelated transcription factors to neighboring sites in a composite control element. (a) By themselves, both monomeric NFAT and heterodimeric AP1 transcription factors have low affinity for their respective binding sites in the IL-2 promoter-proximal region. Protein-protein interactions between NFAT and AP1 add to the overall stability of the NFAT-AP1-DNA complex, so that the two proteins bind to the composite site cooperatively. (b) Cooperative DNA binding by dimeric SRF and monomeric SAP1 can occur when their binding sites are separated by 5–30 bp and when the SAP1 binding site is inverted because the domain of SAP1 that interacts with SRF is connected to the DNA-binding domain of SAP1 by a flexible linker region of the SAP1 polypeptide chain (dotted line). [Part (a) Data from L. Chen et al., 1998, Nature 392:42, PDB ID 1a02. Part (b) Data from M. Hassler and T. J. Richmond, 2001, EMBO J. 20:3018, PDB ID 1hbx.] Description Schematic a shows weak N F A T and weak A P 1 binding to D N A and cooperative binding of N F A T and A P 1 to D N A. Schematic b shows cooperative binding of S R F b and S R F a to S A P.(a) Two versions of a D N A model and two proteins. In the model at left, the D N A helix is horizontal at the bottom with a left side labeled weak N F A T binding site and the right side labeled weak A P 1 binding site. Above are enlarged ribbon models of each site and they are separate. In the model at the right, the two ribbon models have attached to each other, and under the horizontal D N A helix is the label: Cooperative Binding of N F A T and A P 1 (b) A horizontal D N A helix model with enlarged ribbon models of some binding sites. At the left is a purple ribbon labeled S A P 1 B-Box. This is attached to a brown ribbon labeled S R F b and a green ribbon labeled S R F a. After an unmarked gap, there is another purple ribbon area highlighted with the label S A P 1 E T S. Cooperative binding by NFAT and AP1 occurs only when their weak binding sites are positioned quite close to each other in DNA. The sites must be located at a precise distance from each other for effective binding. The requirements for cooperative binding are not so stringent in the case
Multiprotein Complexes Form on Enhancers
of some other transcription factors and transcription-control regions. For example, the EGR-1 control region contains a composite binding site to which the SRF and SAP1 transcription factors bind cooperatively (Figure 8-28b). Because SAP1 has a long, flexible domain that interacts with SRF, the two proteins can bind cooperatively when their individual sites in DNA are separated by any distance up to about 30 bp or when the sites are inverted relative to each other. Multiprotein Complexes Form on Enhancers Recall that enhancers generally range in length from about 50 to 200 bp and include binding sites for multiple transcription factors. Let’s look at the roughly 50-bp enhancer that regulates expression of β-interferon, an important protein in the defense against viral infections in vertebrates. The β-interferon enhancer binds several dimeric and single-subunit transcription factors. These can bind to specific transcription-factorbinding sites that constitute the enhancer (Figure 8-29). The term enhanceosome has been coined to describe large DNA-protein complexes, such as these, that assemble from transcription factors as they bind to the multiple binding sites in an enhancer.
FIGURE 8-29 Model of the enhanceosome that forms on the β-interferon enhancer. Two heterodimeric factors, Jun/ATF-2 and p50/RelA (NF-κB), and two copies each of the monomeric transcription factors IRF-3 and IRF-7, bind to the six overlapping binding sites in this enhancer. See D. Penne, T. Manniatis, and S. Harrison, 2007, Cell 129:1111. Description At the top is a detailed ribbon diagram of 6 binding sites and 2 factors. From left to right, the items are labeled as follows: blue coiled ribbon - Jun, red coiled ribbon -A T F-2, Green complex -I R F-3 A, yellow complex - I R F-7 B, red complex - I R F-3 C, blue complex - I R F-7 D, aqua complex - P 50, and brown complex - Rel A. Below this ribbon diagram is the complex written in rows of genetic letters, with segments that correspond to the colors in each section above.
Because of the presence of flexible regions connecting the DNA-binding domains and activation or repression domains in transcription factors (see
Figure 8-23), and because of the ability of interacting proteins bound to distant sites to produce loops in the DNA between their binding sites (Figure 8-30), considerable leeway in the spacing between regulatory elements in transcription-control regions is permissible. This tolerance for variable spacing between binding sites for specific transcription factors, and between promoter binding sites for the general transcription factors and for Pol II, probably contributed to rapid evolution of gene control in eukaryotes. Transposition of DNA sequences and recombination between repeated sequences over evolutionary time probably created new combinations of control elements that were subjected to natural selection and retained if they proved beneficial. The latitude in spacing between regulatory elements probably allowed many more functional combinations to be subjected to this evolutionary experimentation than would be the case if constraints on the spacing between regulatory elements were strict, as is true for most genes in bacteria.
EXPERIMENTAL FIGURE 8-30 Example of DNA looping between RNA polymerase and an activator protein from E. coli. DNA looping permits interaction of bound NtrC and –RNA polymerase. (a) Drawing (left) and electron micrograph (right) of DNA restriction fragment with phosphorylated, activated NtrC dimers bound to the enhancer region near one end of the restriction fragment and –RNA polymerase bound to the glnA promoter near the other end. (b) Drawing (left) and electron micrograph (right) of the same fragment preparation, showing NtrC dimers and – RNA polymerase bound to each other, with the intervening DNA forming a loop between them. See W. Su et al., 1990, Proc. Nat’l. Acad. Sci. USA 87:5505. Description (a) A schematic shows a chain of D N A, with a butterfly shaped area highlighted. The top "wings" are labeled "pair of phosphorylated N t r C dimers" and the bottom "wings" are labeled "Enhancer (negative 140 and negative 108). Down the chain is a blue oval with the top part labeled R N A polymerase and the bottom part labeled g l n A
promoter. (b) The same as a, but now the chain is looped so that the butterfly shape is connected to the blue oval. This also has a micrographic photo to the right. KEY CONCEPTS OF SECTION 8.3 Regulatory Sequences in Protein-Coding Genes and the Proteins Through Which They Function Expression of eukaryotic protein-coding genes is generally regulated through multiple protein-binding transcription-control regions that are located close to or distant from the transcription start site (see Figure 8-18). Promoters direct binding of RNA polymerase II to DNA, determine the site of transcription initiation, and influence the frequency of transcription initiation. Promoter-proximal elements occur within about 200 bp of a start site. Several such elements, containing 6–10 bp, may help regulate a particular gene. Enhancers, which contain multiple short control elements, may be located from 200 bp to tens of kilobases upstream or downstream from a promoter, within an intron, or downstream from the final exon of a gene. Promoter-proximal elements and enhancers are often cell-type-specific, functioning only in specific differentiated cell types. Transcription factors, which activate or repress transcription, bind to promoterproximal regulatory elements and enhancers in eukaryotic DNA. Transcription activators and repressors are generally modular proteins containing a single DNA-binding domain and one or a few activation domains (for activators) or repression domains (for repressors). The different domains are frequently linked by flexible intrinsically disordered polypeptide regions (see Figure 8-23). Among the most common structural motifs found in the DNA-binding domains of eukaryotic transcription factors are the homeodomain, zinc finger, basic zipper (leucine zipper), and basic helix-loop-helix (bHLH). All these and many other DNA-binding motifs contain one or more α helices that interact with the major groove in their cognate site in DNA. Activation and repression domains in transcription factors exhibit a variety of amino acid sequences and three-dimensional structures. In general, these functional domains interact with co-activators or co-repressors, which are critical to the ability of transcription factors to modulate gene expression. The transcription-control regions of most genes contain binding sites for multiple transcription factors. Transcription of such genes varies depending on the particular
repertoire of transcription factors that are expressed and activated in a particular cell at a particular time. Combinatorial complexity in transcriptional control results from alternative combinations of monomers that form heterodimeric transcription factors (see Figure 8-27) and from cooperative binding of transcription factors to composite control sites (see Figure 8-28). Binding of multiple transcription factors to multiple sites in an enhancer forms a large DNA-protein complex called an enhanceosome (see Figure 8-29).
8.4 Molecular Mechanisms of Transcription Repression and Activation
8.4 Molecular Mechanisms of Transcription Repression and Activation The repressors and activators that bind to specific sites in DNA and regulate expression of the associated protein-coding genes do so by three general mechanisms. First, these regulatory proteins act in concert with other proteins to modulate chromatin structure, inhibiting or stimulating the ability of general transcription factors to bind to promoters. Recall from Chapter 7 that the DNA in eukaryotic cells is not free, but is associated with a roughly equal mass of protein in the form of chromatin. The basic structural unit of chromatin is the nucleosome, which is composed of about 147 bp of DNA wrapped tightly around a disk-shaped core of histone proteins. Residues within the N-terminal region of each histone, and the C-terminal regions of histones H2A and H2B, called histone tails, extend from the surface of the nucleosome and can be reversibly modified (see Figure 7-26). Such modifications influence the relative condensation of chromatin and thus its accessibility to proteins required for transcription initiation. Second, activators and repressors interact with a large multiprotein complex called the mediator of transcription complex, or simply Mediator. This complex, in turn, binds to Pol II and directly regulates assembly of the preinitiation complex. In addition, some activation domains interact with TFIID-TAF subunits or other components of the preinitiation complex, and these interactions
Formation of Heterochromatin Silences Gene Expression at Telomeres, near Centromeres, and in Other Regions
contribute to preinitiation complex assembly. Finally, activation domains may also interact with the elongation factor P-TEFb (cyclin T-CDK9) and other as yet unknown factors to stimulate elongation by Pol II away from the promoter region. In this section, we review the current understanding of how repressors and activators control chromatin structure and preinitiation complex assembly. In the next section of the chapter, we discuss how the concentrations and activities of activators and repressors themselves are controlled, so that gene expression is precisely attuned to the needs of the cell and organism. Formation of Heterochromatin Silences Gene Expression at Telomeres, near Centromeres, and in Other Regions Inactive genes in eukaryotic cells are often associated with heterochromatin, regions of chromatin that are highly condensed and stain darkly with DNA dyes (see Figure 7-28a). In contrast, most transcribed genes are located in lightly staining euchromatin (see Figure 7-28a). Regions of chromosomes near the centromeres and telomeres, as well as additional specific regions that vary in different cell types, are organized into heterochromatin. The DNA in heterochromatin is less accessible to externally added proteins than is DNA in euchromatin and consequently is often referred to as “closed” chromatin. For instance, in an
experiment described in Chapter 7, the DNA of inactive genes was found to be far more resistant to digestion by DNase I than the DNA of transcribed genes (see Figure 7-27). Study of DNA regions in S. cerevisiae that behave like the heterochromatin of higher eukaryotes provided early insight into the chromatin-mediated repression of transcription. This yeast can grow either as haploid or diploid cells. Haploid cells exhibit one of two possible mating types, called a and α. Cells of different mating type can mate, or fuse, to generate a diploid cell (see Figure 1-24b). When a haploid cell divides by budding, the larger mother cell switches its mating type. Genetic and molecular analyses have revealed that three genetic loci on yeast chromosome III control the mating type of yeast cells (Figure 8-31). The central mating-type locus, termed MAT — the only one of the three that is actively transcribed — encodes transcription factors (a1, or α1 and α2) that regulate genes that determine the mating type. In any one cell, either an a or α DNA sequence is located at the MAT locus. The two additional loci, termed HML and HMR, near the left and right telomere, respectively, contain “silent” (nontranscribed) copies of the a or α genes. These sequences are transferred alternately from HMLα or HMRa into the MAT locus by a type of nonreciprocal recombination between homologous sequences during cell division. When the MAT locus contains the DNA sequence from HMLα, the cells behave as α cells. When the MAT locus contains the DNA sequence from HMRa, the cells behave like a cells.
FIGURE 8-31 Arrangement of mating-type loci on chromosome III in the yeast S. cerevisiae. Silent (unexpressed) mating-type genes (either a or α) are located at the HML locus. The opposite mating-type gene is present at the silent HMR locus. When the α or a sequences are present at the MAT locus, they can be transcribed into mRNAs whose encoded proteins specify the mating-type phenotype of the cell. The silencer sequences near HML and HMR bind proteins that are critical for repression of these silent loci. Haploid cells can switch mating types in a process that transfers the DNA sequence from HML or HMR to the transcriptionally active MAT locus. Description The model is labeled from left to right in this way: Telomere (circle on left end), H M L omega (pink rectangle), silencer (gray line area) centromere (circle in middle) M A T alpha and omega (rectangle with pink above and blue below) another silencer (gray area) H M R a (blue rectangle) and telomere (circle on end of model) Below this bar model the pink and blue rectangle are highlighted with the pink rectangle at left labeled omega sequences at M A T locus and showing wavy arrows below going out to the left and right from the center. The blue rectangle is labeled alpha sequences at M A T locus and shows only one arrow below going from center to right. Our interest here is in how transcription of the silent mating-type genes at HML and HMR is repressed. If these genes are expressed, as they are in yeast mutants with defects in the repressing mechanism, both a and α proteins are expressed, causing the cells to behave like diploid cells, which
cannot mate. The promoters and UASs controlling transcription of the a and α genes lie near the center of the DNA sequence that is transferred and are identical whether the sequences are at the MAT locus or at one of the silent loci. This arrangement indicates that the function of the transcription factors that interact with these sequences must somehow be blocked at HML and HMR, but not at the MAT locus. This repression of the silent loci depends on silencer sequences located next to the region of transferred DNA at HML and HMR (see Figure 8-31). If the silencer is deleted, the adjacent locus is transcribed. Remarkably, any gene placed near the yeast mating-type silencer sequence by recombinant DNA techniques is repressed, or “silenced,” even a tRNA gene transcribed by RNA polymerase III, which uses a different set of general transcription factors than RNA polymerase II uses, as discussed later. Several lines of evidence indicate that repression of the HML and HMR loci results from a condensed chromatin structure that sterically blocks transcription factors from interacting with the DNA. In one telling experiment, the gene encoding an E. coli enzyme that methylates adenine residues in the sequence GATC was introduced into yeast cells under the control of a yeast promoter so that the enzyme was expressed. Researchers found that GATC sequences within the MAT locus and most other regions of the genome in these cells were methylated but not those within the HML and HMR loci. These results indicate that the DNA of the silent loci is inaccessible to the E. coli methylase, and presumably to proteins in general, including transcription factors and RNA polymerase. Similar experiments conducted with various yeast histone mutants indicated that specific interactions involving the histone tails of H3 and H4 are required
for formation of a fully repressed chromatin structure. Other studies have shown that the telomeres of every yeast chromosome also behave like silencer sequences. For instance, when a gene is placed within a few kilobases of any yeast telomere, its expression is repressed. In addition, this repression is relieved by the same mutations in the H3 and H4 histone tails that interfere with repression at the silent mating-type loci. Genetic studies led to identification of several proteins, RAP1 and three SIR proteins, that are required for repression of the silent mating-type loci and the telomeres in yeast. RAP1 was found to bind within the DNAsilencer sequences associated with HML and HMR and to a sequence that is repeated multiple times at each yeast-chromosome telomere. Further biochemical studies showed that the SIR2 protein is a histone deacetylase; it removes acetyl groups on lysines of the histone tails. Furthermore, the RAP1 and SIR2, 3, and 4 proteins bind to one another, and SIR3 and SIR4 bind to the N-terminal tails of histones H3 and H4, which are maintained in a largely nonacetylated state by the deacetylase activity of SIR2. A series of experiments using fluorescence confocal microscopy on yeast cells either stained with fluorescent-labeled antibody to any one of the SIR proteins or RAP1 or hybridized to a labeled telomere-specific DNA probe revealed that these proteins form large, condensed telomeric nucleoprotein structures resembling the heterochromatin found in higher eukaryotes (Figure 8-32a, b, c).
EXPERIMENTAL FIGURE 8-32 Antibody and DNA probes colocalize SIR3 protein with telomeric heterochromatin in yeast nuclei. (a) Confocal micrograph 0.3 μm thick through three diploid yeast cells, each containing 68 telomeres. Telomeres were labeled by hybridization to a fluorescent telomere-specific probe (yellow). DNA was stained red to reveal the nuclei. The 68 telomeres coalesce into a much smaller number of regions near the nuclear periphery. (b, c) Confocal micrographs of yeast cells labeled with a telomerespecific hybridization probe (b) and a fluorescent-labeled antibody specific for SIR3 (c).
Note that SIR3 is localized in the repressed telomeric heterochromatin. Similar experiments with RAP1, SIR2, and SIR4 have shown that these proteins also colocalize with the repressed telomeric heterochromatin. (d) Schematic model of the silencing mechanism at yeast telomeres. (Top left) Multiple copies of RAP1 bind to a simple repeated sequence at each telomere region that lacks nucleosomes. SIR3 and SIR4 bind to RAP1, and SIR2 binds to SIR4. SIR2 is a histone deacetylase that deacetylates the tails on the histones neighboring the repeated RAP1-binding site. (Middle) The hypoacetylated histone tails are also binding sites for SIR3 and SIR4, which in turn bind additional SIR2, deacetylating neighboring histones. Repetition of this process results in spreading of the region of hypoacetylated histones with associated SIR2, SIR3, and SIR4. (Bottom) Interactions between complexes of SIR2, SIR3, and SIR4 cause the chromatin to condense and several telomeres to associate, as shown in (a)–(c). The higher order chromatin structure generated sterically blocks other proteins from interacting with the underlying DNA. See M. Grunstein, 1997, Curr. Opin. Cell Biol. 9:383. [Parts (a)–(c) Data from M. Gotta et al., 1996, J. Cell Biol. 134:1349–1363; https://doi.org/10.1083/jcb.134.6.1349.] Description (a) Confocal micrographs of three yeast diploid yeast cells. The telomeres are labeled with a fluorescent probe and appears as small green dots in several patches distributed through the cells. The green dots appear in a larger red region, corresponding to the nucleus. (b) Fluorescence staining for telomeres. The telomeres appear as several small dots localized in groups. (c) Fluorescence staining for S I R 3 regions rich in S I R 3 appear as several small dots localized in groups. The spots appear roughly in the same location as those corresponding to the telomeres. (d) Mechanism of silencing of yeast telomere. A sequence of three images shows the following. 1. Several nucleosomes are depicted. A region of nucleosome free D N A corresponding to telomeric D N A is covered in R a p 1 protein. The hypoacetylated histone N-terminal tails are indicated on the nucleosomes. An arrow indicates that S I R proteins bound to the R a p 1 protein are transferred to the nucleosomes. 2. The hypoacetylated histone n-terminal tails are bound to S I R 2, S i r 3, and S i r 4 proteins.
3. The nucleosomes condense and multiple telomeres associate.
Figure 8-32d depicts a model for the chromatin-mediated silencing at yeast telomeres based on these and other studies. Formation of heterochromatin at telomeres is nucleated by multiple RAP1 protein molecules bound to repeated sequences in a nucleosome-free region at the extreme end of a telomere. A network of protein-protein interactions involving telomere-bound RAP1, three SIR proteins (2, 3, and 4), and hypoacetylated histones H3 and H4 creates a nucleoprotein complex that includes several telomeres and in which the DNA is largely inaccessible to external proteins. Recall that nucleosomes in regions of heterochromatin have low levels of acetylation on lysines of the histone tails, while nucleosomes in euchromatin have histone tails that are acetylated on several lysines (see Figure 7-28b). One additional protein, SIR1, is also required for silencing of the mating-type loci. It binds to the silencer regions associated with HML and HMR together with RAP1 and other proteins to initiate assembly of a similar multiprotein-silencing complex that encompasses HML and HMR. An important feature of this model is the dependence of repression on hypoacetylation of the histone tails. This was demonstrated in experiments with yeast mutants in which lysines in histone N-termini were replaced with arginines, glutamines, or glycines. Arginine is positively charged, like lysine, but cannot be acetylated. Glutamine and glycine are neutral and simulate the neutral charge of acetylated lysine. Repression at telomeres and at the silent mating-type loci was defective in mutants with
Repressors Can Direct Histone Deacetylation at Specific Genes
glutamine or glycine substitutions for lysine in the H3 and H4 histone tails. Repression was normal in mutants with arginine substitutions due to the positive charge that arginine provides to the histone tails. Further, acetylation of H3 and H4 lysines interferes with binding by SIR3 and SIR4 and consequently prevents repression at the silent loci and telomeres. Finally, chromatin immunoprecipitation experiments (see Figure 8-12a) using antibodies against acetylated lysines at specific positions in the histone N-terminal tails (see Figure 8-26a) confirmed that histones in repressed regions near telomeres and at the silent mating loci are hypoacetylated but become hyperacetylated in sir mutants when genes in these regions are derepressed. Repressors Can Direct Histone Deacetylation at Specific Genes The importance of histone deacetylation in chromatin-mediated gene repression was further supported by studies of eukaryotic repressors that regulate genes within chromosome arms, distant from telomeres and centromeres. These repressor proteins act in part by causing deacetylation of histone tails in nucleosomes that encompass the TATA box and promoter-proximal region of the genes they repress. In vitro studies have shown that when promoter DNA is part of a nucleosome with nonacetylated histones, the general transcription factors cannot bind to the TATA box and promoter-proximal region. In nonacetylated histones, the N-terminal lysines are positively charged and may interact with phosphates in the DNA backbone. Nonacetylated histone tails also interact
with neighboring histone octamers and other chromatin-associated proteins, favoring the folding of chromatin into condensed regions (see Figures 7-24b and 7-27a). The net effect is that general transcription factors cannot assemble into a preinitiation complex on a promoter associated with hypoacetylated histones. In contrast, binding of general transcription factors is repressed much less by histones with hyperacetylated tails, in which the positively charged lysines are neutralized and electrostatic interactions within chromatin are eliminated. The connection between histone deacetylation and repression of transcription at specific yeast promoters became clearer when the cDNA encoding a human histone deacetylase was found to have high homology to the yeast RPD3 gene, known to be required for the normal repression of a number of yeast genes. Further work showed that the yeast Rpd3 protein has histone deacetylase activity. The ability of Rpd3 to deacetylate histones at a number of promoters depends on two other proteins: Ume6, a repressor that binds to a specific upstream regulatory sequence (URS1), and Sin3, which is part of a large multiprotein complex called Rpd3L that also contains Rpd3 (Figure 8-33a). Sin3 also binds to the repression domain of Ume6, thus positioning the Rpd3 histone deacetylase in the complex so that it can interact with nearby promoter-associated nucleosomes and remove acetyl groups from histone-tail lysines. Additional experiments, using the chromatin immunoprecipitation technique outlined in Figure 8-12a and antibodies to specific histone acetylated lysines, demonstrated that in wild-type yeast, one or two nucleosomes in the immediate vicinity of Ume6-binding sites are hypoacetylated. These sites include the promoters of genes repressed by
Ume6. In sin3 and rpd3 deletion mutants, not only were these promoters derepressed, but the nucleosomes near the Ume6-binding sites were hyperacetylated. All of these findings provide considerable support for the model of repressor-directed deacetylation shown in Figure 8-33a.
FIGURE 8-33 Proposed mechanism of histone deacetylation and hyperacetylation in yeast transcriptional control. (a) Repressor-directed deacetylation of histone N-terminal
tails. The DNA-binding domain (DBD) of the repressor Ume6 interacts with a specific upstream control element of the genes it regulates, called URS1. The Ume6 repression domain (RD) binds Sin3, a subunit of a multiprotein complex that includes Rpd3, a histone deacetylase. Deacetylation of histone N-terminal tails on nucleosomes in the region of the Ume6-binding site inhibits binding of general transcription factors at the TATA box, thereby repressing gene expression. (b) Activator-directed hyperacetylation of histone N-terminal tails. The DNA-binding domain of the activator Gcn4 interacts with specific upstream activating sequences (UAS) of the genes it regulates. The Gcn4 activation domain (AD) then interacts with a multiprotein histone acetylase complex that includes the Gcn5 catalytic subunit. Subsequent hyperacetylation of histone N-terminal tails on nucleosomes in the vicinity of the Gcn4-binding site facilitates access by the general transcription factors required for initiation. Repression and activation of many genes in higher eukaryotes occur by similar mechanisms. Description (a) The title reads, "repressor directed histone deacetylation," a ribbon model using 6 cylinders, with the third cylinder labeled T A T A. Between the second and the third cylinders, a space filling 3-D model is labeled R p d 3 L and connected to a blue oval labeled D B D. The D B D oval is attached to a blue rectangle labeled U R S 1 which is connected to the cylinders. (b) The title reads, "activator directed histone hyperacetylation," a ribbon model with 6 cylinders, the third cylinder is labeled T A T A. Between the second and the third cylinders the space filling 3-D model is labeled S A G A complex and is attached to the oval labeled D B D. The rectangle below the D B D is now labeled U A S. In yeast, the Sin3-Rpd3 complex (Rpd3L) functions as a co-repressor. Corepressor complexes containing histone deacetylases have also been found associated with many repressors from mammalian cells (see Repressors Are the Functional Converse of Activators). Some of these complexes contain the mammalian homolog of Sin3 (mSin3), which interacts with the repression domain of repressors, as in yeast (see Figure 8-33a). Other
Activators Can Direct Histone Acetylation at Specific Genes
histone deacetylase complexes identified in mammalian cells contain additional or different subunits that bind the repression domains of other eukaryotic repressors. These various repressor–co-repressor combinations mediate histone deacetylation at specific promoters by a mechanism similar to the yeast mechanism (see Figure 8-33a). In addition to repressing transcription through the formation of closed chromatin structures, some repression domains have also been found to inhibit the assembly of preinitiation complexes in experiments with purified general transcription factors in the absence of histones. This activity probably also functions in vivo, contributing to the repression of transcription by these repression domains. Activators Can Direct Histone Acetylation at Specific Genes Just as repressors function through co-repressors that bind to their repression domains, the activation domains of DNA-binding activators function by binding multisubunit co-activator complexes. One of the first co-activator complexes to be characterized was the yeast SAGA complex, which functions with the Gcn4 and Gal4 activator proteins described in Section 8.3. Early genetic studies indicated that full activity of the Gcn4 activator required a protein called Gcn5. The clue to Gcn5’s function came from biochemical studies of a histone acetylase purified from the protozoan Tetrahymena, the first histone acetylase to be purified. Sequence analysis revealed homology between the Tetrahymena protein and yeast Gcn5, which was soon shown to have histone acetylase activity as well.
Further genetic and biochemical studies revealed that Gcn5 is one subunit of the SAGA multiprotein co-activator complex. Another subunit of this histone acetylase complex binds to activation domains in multiple yeast activator proteins, including Gcn4. The model shown in Figure 8-33b is consistent with the observation that nucleosomes near the promoter region of a gene regulated by the Gcn4 activator are specifically hyperacetylated compared with most histones in the cell. This activator-directed hyperacetylation of nucleosomes near a promoter region facilitates binding of other proteins required for transcription initiation. In addition to leading to the decondensation of chromatin, the acetylation of specific histone lysines generates binding sites for proteins containing bromodomains. A bromodomain is a sequence of about 110 amino acids that folds into a domain, which binds acetylated lysine. Bromodomains are found in several chromosome-associated proteins that contribute to transcriptional activation. For example, a subunit of the general transcription factor TFIID contains two bromodomains, which bind with high affinity to acetylated nucleosomes. Recall that TFIID binding to a promoter initiates assembly of an RNA polymerase II preinitiation complex (see Figure 8-13). Nucleosomes at promoter regions of virtually all active genes have acetylated lysines in their H3 and H4 histone tails. A similar activation mechanism operates in higher eukaryotes. Mammalian cells contain multisubunit histone acetylase co-activator complexes that are homologous to the yeast SAGA complex. Mammalian cells also express two related 300-kDa, multidomain proteins called CBP and p300, which acetylate histone tail lysines. As noted earlier, one
Chromatin-Remodeling Complexes Help Activate or Repress Transcription
domain of CBP binds the phosphorylated acidic activation domain in the CREB transcription factor (Figure 8-26a). Other domains of CBP interact with activation domains in other activators. CBP also has histone acetylase activity and the ability to associate with additional multisubunit histone acetylase complexes. CREB and many other mammalian activators function in part by directing CBP and p300 and their associated histone acetylase complexes to specific nucleosomes, where they acetylate histone tails, thereby facilitating the interaction of general transcription factors with promoter DNA. Chromatin-Remodeling Complexes Help Activate or Repress Transcription In addition to histone acetylase complexes, multiprotein chromatinremodeling complexes are required for activation at many promoters. The first of these complexes to be characterized was the yeast SWI/SNF chromatin-remodeling complex. One of the SWI/SNF subunits has homology to DNA helicases, enzymes that use energy from ATP hydrolysis to disrupt interactions between base-paired nucleic acids or between nucleic acids and proteins. The SWI/SNF complex is thought to pump or push DNA into the nucleosome so that DNA bound to the surface of the histone octamer transiently dissociates from the surface and translocates, causing the nucleosomes to slide along the DNA. This chromatin remodeling facilitates binding of transcription factors to specific DNA sequences in chromatin. Many activation domains bind to
chromatin-remodeling complexes, which stimulate in vitro transcription from chromatin templates. Thus the SWI/SNF complex represents another type of co-activator complex. The experiment shown in Figure 8-34 demonstrates dramatically how an activation domain can cause decondensation of a region of chromatin. This decondensation results from association of the activation domain with chromatin-remodeling and histone acetylase complexes. EXPERIMENTAL FIGURE 8-34 Expression of fusion proteins demonstrates chromatin decondensation in response to an activation domain. A cultured hamster cell line was engineered to contain multiple copies of a tandem array of E. coli lac operator sequences
integrated into a chromosome in a region of heterochromatin. (a) When an expression vector for the lac repressor (LacI) was transfected into these cells, lac repressor bound to the lac operator sites could be visualized in a region of condensed chromatin using an antibody against the lac repressor (red). DNA was visualized by staining with DAPI (blue), revealing the nucleus. A diagram of condensed chromatin is shown below. (b) When LacI fused to an activation domain was transfected into these cells, staining as in (a) revealed that the activation domain causes this region of chromatin to decondense into a thinner chromatin fiber that fills a much larger volume of the nucleus. A diagram of a region of decondensed chromatin with bound LacI fusions to the VP16 activation domain (AD) and associated chromatin remodeling and histone acetylase complexes is shown below. [From T. Tumbar, G. Sudlow, and A. S. Belmont, 1999, J. Cell. Biol. 145(7):1341–1354: https://doi.org/10.1083/jcb.145.7.1341] Description (a) A fluorescence image of a hamster cell engineered to have multiple copies of the E coli lac operon. The image has the title 'condensed chromatin' and the condensed chromatin corresponding to lac operator sites is depicted as a small, localized red spot. Underneath the photo, a schematic shows condensed chromatin binding the lac repressor. (b) A fluorescence image of a hamster cell engineered to have multiple copies of the E coli lac operon. The image has the title decondensed chromatin' and the condensed chromatin corresponding to lac operator sites is depicted as a diffuse collection of many red spots. A schematic underneath shows decondensed chromatin and the lacl repressor and V P 16 activation domain bound to the D N A. A label corresponding to this region states 'histone acetylase and chromatin-remodeling complexes. Chromatin-remodeling complexes are required for many processes involving DNA in eukaryotic cells, including transcriptional control, DNA replication, recombination, and DNA repair. Several types of chromatin- remodeling complexes are found in eukaryotic cells, all with homologous DNA helicase domains. SWI/SNF complexes and related chromatin-
Pioneer Transcription Factors Initiate the Process of Gene Activation During Cellular Differentiation
remodeling complexes in multicellular organisms contain subunits with bromodomains that bind to acetylated histone tails. Consequently, SWI/SNF complexes continue to associate with activated, acetylated regions of chromatin, presumably maintaining them in a decondensed conformation. Chromatin-remodeling complexes can also participate in transcriptional repression. These complexes bind to the repression domains of repressors and contribute to repression, presumably by folding chromatin into condensed structures. Much remains to be learned about how this important class of proteins alters chromatin structure to influence gene expression and other processes. Pioneer Transcription Factors Initiate the Process of Gene Activation During Cellular Differentiation As cells differentiate during embryogenesis and during differentiation from stem cells in adult organisms (see Chapter 22), many of the genes induced during the process are initially in repressed regions of heterochromatin in undifferentiated progenitor cells. Activation of these genes requires that the chromatin environment of their transcriptioncontrol regions become decondensed so that transcription factors can bind to enhancers and promoter-proximal control elements and so that the general transcription factors and Pol II can bind to promoters. In many cases, this decondensation is initiated by special pioneer transcription factors that can bind to their cognate binding sites in DNA even when those sites are within repressed heterochromatic regions of chromatin.
These pioneer transcription factors bind to the surface of both the DNA and the histones in a nucleosome, and in some cases, such as for Sox2, use the binding energy to begin to unwrap the DNA from the nucleosome surface (Figure 8-35). This allows these pioneer factors to bind to their specific binding sites while the DNA is wrapped around a histone octamer with the opposite side of the DNA against the surfaces of histones.
FIGURE 8-35 Structure of the Sox11-nucleosome complex. Like Sox2, the closely related transcription factor Sox11 can bind its cognate-binding sites even when they are wrapped around the surface of a nucleosome. Left: Model of a nucleosome with two Sox11-binding sites, one inside the beginning of the DNA 1 2/3 wraps around the surface of the nucleosome, and the other near the end of the DNA wrap around the nucleosome. Histone α helices are shown as cylinders with H2A subunits yellow; H2Bs red; H3s blue; and H4s green. Right: When Sox11 binds its two DNA-binding sites in this nucleosome, it unwinds the DNA from the surface of the nucleosome, making it available for interacting with other proteins. Description The model on the left shows a nucleosome with D N A wrapped around it, and an arrow indicating the action of S O X 11. The model on the right shows a nucleosome - S o x 2 with D N A spreading away from the ribbon model in the center (two purple ribbons labeled S o x).
The Mediator Complex Forms a Molecular Bridge Between Activation Domains and Pol II
An example of pioneer transcription factors that activate transcription from a promoter in condensed chromatin involves the liver-specific gene Alb1, encoding serum albumin, a major constituent of blood serum that is secreted into the blood by hepatocytes, the major cell type in the liver. In the developing mouse, the FoxA and GATA-4 or GATA-6 transcription factors are the first to bind to an Alb1 enhancer in undifferentiated gut endodermal cells destined to develop into the liver. FoxA has a winged helix DNA-binding domain that binds to one side of the DNA helix containing the FoxA-binding site. GATA factors are also able to bind to their specific sites in DNA when those sites are included in nucleosomal DNA wrapped around a histone octamer. The FoxA and GATA-4/6 activation domains may then interact with chromatin remodeling complexes and histone acetylase complexes to decondense the chromatin of the 120-bp Alb1 enhancer, allowing the observed subsequent binding of four additional transcription factors in the nascent liver bud that develops later. The Mediator Complex Forms a Molecular Bridge Between Activation Domains and Pol II Once the interaction of activation domains with histone acetylase complexes and chromatin-remodeling complexes decondense the chromatin of a promoter region to an “open” structure that allows the binding of general transcription factors, activation domains of the transcription factors bound to DNA control elements interact with another
multisubunit co-activator complex, the Mediator complex (Figure 8-36). Activation domain–Mediator interactions stimulate assembly of a preinitiation complex on a promoter. Recent cryoelectron microscopy studies show that the head and middle domains of the Mediator complex interact directly with Pol II. Several Mediator subunits bind to activation domains in various activator proteins. Thus Mediator can form a molecular bridge between an activator bound to its cognate site in DNA and Pol II bound to a promoter.
FIGURE 8-36 Structure of yeast and human Mediator complexes. (a) Subunits of the S. cerevisiae and human Mediator complexes. The subunits constituting the head, middle, and tail modules of Mediator are indicated, as well as the subunits of the CDK8-kinase module (CKM) that associates with some Mediator complexes, blocking Pol II binding. (b) Cryoelectron microscopic structure of the yeast Mediator without the CKM. (Left) The head, middle, and tail modules composed of the subunits listed above are color-coded. (Right) The structure of a complex of Mediator with Pol II, called the holoenzyme, suggests that the Mediator modules rotate relative to one another as shown to create a surface that binds Pol II.
[Part (b) Republished with permission from Elsevier, from K. L. Tsai, 2014, “Subunit Architecture and Functional Modular Rearrangements of the Transcriptional Mediator Complex.” Cell, 157(6): 1430–1444; permission conveyed through Copyright Clearance Center, Inc.] Description (a) Yeast and human mediator complexes divided by protein subunit. The following tables list the different structures of yeast and human mediators in the head, middle, tail, and CKM. Yeast: The column headers read, head, middle, tail, and C K M. The data in the table reads as follows: Head- Med 6; Middle- Med 1; Tail- Med 2; C K M- Med 12. Head- Med 8; Middle- Med 4; Tail- Med 3; C K M- Med 13. Head- Med 11; Middle- Med 7; Tail- Med 5; C K M- C d k 8. Head- Med 17; Middle- Med 9; Tail- Med 14; C K M- C y c C. Head- Med 18; Middle- Med 10; Tail- Med 15. Head- Med 20; Middle- Med 19; Tail- Med 16. Head- Med 22; Middle- Med 21, Med 31. Human: Head- Med 6; Middle- Med 1; Tail- Med 14; C K M- Med 12/12 L. Head- Med 8; Middle- Med 4; Tail-Med 15; C K M- Med 13/13 L. Head- Med 11; Middle- Med 7; Tail- Med 16; C K M- C d k 8/ C D K 19. Head- Med 17; Middle- Med 9; Tail- Med 23; C K M- C y c C. Head- Med 18; Middle-Med 10; Tail- Med 24. Head- Med 20; Middle- Med 19; Tail- Med 25.
Head- Med 22; Middle- Med 21. Head- Med 27; Middle- Med 31. Head- Med 28; Middle- 26. Head- Med 29. Head- Med 30. (b) Structure of mediator complex and holoenzyme formed by interaction of f R N A polymerase two with the mediator. The middle, head, and tail sections are indicated. Experiments with temperature-sensitive yeast mutants indicate that some Mediator subunits are required for transcription of virtually all yeast genes. These subunits help maintain the overall structure of the Mediator complex or bind to Pol II. In contrast, other Mediator subunits are required for activation or repression of specific subsets of genes. RNA-seq analysis (see Chapter 6) has been used to examine gene expression in yeast mutants with defects in nonessential Mediator subunits. Results indicate that each mutation influences transcription of 3–10 percent of all genes, meaning that the deletion either increases or decreases mRNA expression by a factor of twofold or more. In many cases, these Mediator subunits interact with specific activation domains. Thus when one Mediator subunit is defective, transcription of genes regulated by activators that bind to that subunit is severely depressed, but transcription of other genes is unaffected. Recent cryoelectron microscopy studies suggest that when activation domains interact with Mediator, the head, middle, and tail domains depicted in Figure 8-36b rotate relative to one another, creating a binding surface for RNA polymerase II. The polymerase-Mediator
complex is referred to as the holoenzyme. The surfaces of the polymerase that interact with general transcription factors in the preinitiation complex (see Figure 8-13) remain exposed in the proposed model of the polymerase-Mediator complex. The various experimental results indicating that individual Mediator subunits bind to specific activation domains suggest that multiple activators may influence transcription from a single promoter by interacting with a Mediator complex simultaneously or in rapid succession (Figure 8-37). Activators bound at enhancers or promoter-proximal elements can interact with Mediator associated with a promoter because chromatin, like DNA, is flexible and can form a loop, bringing the regulatory regions and the promoter close together (see Figure 8-30). The multiprotein complexes that form on eukaryotic promoters may comprise more than 100 polypeptides with a total mass of 3–5 megadaltons (MDa), which is as large as a ribosome.
Transcriptional Condensates Greatly Increase the Rate of Transcription Initiation
FIGURE 8-37 Model of several DNA-bound activators interacting with a single Mediator complex. The ability of different Mediator subunits to interact with specific activation domains may contribute to the integration of signals from several activators at a single promoter. See the text for discussion. Description A space filling 3-D model of a mediator complex interacting with D N A. The complex is labeled Pol 2 with a gray area below labeled T A Fs and a blue area to the right labeled G T Fs. At the left, a long loop of chromatin splits up with one part of the loop going upward to the right, the other downward to the right. The loop to the top attaches to the complex and is labeled Activators bound to enhancers. The loop to the bottom attaches to the same complex and is labeled Promoter proximal activators Transcriptional Condensates Greatly Increase the Rate of Transcription
Initiation Recently developed high resolution microscopic methods have revealed that proteins involved in transcription, such as Mediator, often co-localize in nuclei in puncta that are on the order of 0.5–0.1 µm in diameter — far larger than the diameter of a chromatin fiber. BRD4, a protein with four bromodomains that stimulates transcription elongation in promoter proximal regions where histones are highly acetylated, also forms similar puncta in vivo (Figure 8-38a). These regions of high protein concentrations contain hundreds to thousands of Mediator and BRD4 molecules. The punctate structures are not delimited by a membrane but are continuous with the surrounding nucleoplasm. Their formation is dependent on intrinsically disordered regions (IDRs) of nuclear proteins, including transcriptional activators, repressors, and co-activators (see
Figure 8-23). Multiple short regions of polypeptide in these IDRs form weak interactions with short peptides in the IDRs of other nuclear proteins, causing what is referred to as “condensation” of multiple proteins into a “transcriptional condensate” (diagrammed in Figure 838b). These interactions are transient, but the large number of these possible multivalent interactions causes the proteins to associate in a liquid-like state. Consequently, the process that forms these protein concentrates has been called a “liquid-liquid phase separation.”
EXPERIMENTAL FIGURE 8-38 Phase separation of co-activators compartmentalizes and concentrates the transcription apparatus. (a) Immunofluorescence (IF) imaging of BRD4 and MED1 in mouse embryonic stem cells (mESCs). Fluorescence signal is shown alone (left) and merged with Hoechst stain for DNA (right). (b) Super-enhancers are clusters of enhancers (red) bound by master transcription factors (grey ovals) that concentrate high densities of co-activators (blue circles) and the transcription apparatus to drive robust expression of genes that play prominent roles in cell identity. This is achieved by the phase separation of co-activators, which is driven in part by high-valency and low-affinity interactions of intrinsically disordered regions (blue lines). (c) The indicated mEGFP or
mCherry fusion proteins were mixed at 10 mM each in a buffer containing 10 percent Ficoll-400 and 125 mM NaCl. Indicated fluorescence channels are presented for each mixture. Illustrations summarizing results are shown on the right. [Republished with permission of American Association for the Advancement of Science, from B. R. Sabari et al., 2018, “Coactivator Condensation at Super-Enhancers Links Phase Separation and Gene Control,” Science 361(6400): eaar3958; permission conveyed through Copyright Clearance Center, Inc.] Description (a) Four photos labeled live cell imaging. The top left photo shows green dots and has the labels m E G F P and m E G F P-B R D 4. The top right shows bright blue areas around the green dots and has the labels m E G F P and D N A. The bottom left shows dim green dots and has the labels m E G F P-M E D 1. The bottom right shows brighter blue areas connected to top right and has labels m E G F P and D N A. (b) Schematic diagram of bottom right photo shows blue circles with tails in center surrounded by gray coils connected by red and gray chains. (c) Six photos labeled illumination, showing red, and green dots in each are shown in two rows of three each. Two schematics correspond to the six micrographs. The schematic on top shows a circle with numerous red dots with gray tails within. There is one green dot with a blue tail. Outside the circle there are many green dots and a few red dots with gray tails. The schematic below shows a circle with numerous red and green dots with gray and blue tails respectively. Outside the circle there are red and green dots with blue and gray tails respectively. It has been possible to observe and study the formation of these protein condensates in vitro with purified proteins. Figure 8-38c shows an experiment with a purified fusion protein consisting of an amino acid–serine-rich IDR in the largest subunit of Mediator (MED1) fused to the red fluorescent protein called mCherry to allow the fusion protein to be detected by fluorescence microscopy. When incubated along with greenfluorescent protein that was not fused to an IDR in a buffer that promotes
protein condensation, the mCherry-MED1-IDR became concentrated in droplets similar in size to the condensates observed in vivo (Figure 8-38c, top), while GFP was not concentrated in the droplets. On the other hand, when the same mCherry-MED1-IDR fusion protein was incubated with GFP that was fused to an IDR from BRD4, the two fusion proteins were included in the same droplets (Figure 8-38c, bottom). This result shows that proteins with different IDRs can be concentrated in the same protein condensates. Further immunofluorescent staining has shown that condensates formed in a nuclear extract visualized with GFP-BRD4 and GFP-MED1 as in Figure 8-38a also contain hundreds to thousands of copies of many other proteins involved in transcription including RNA polymerase II with a hypo-phosphorylated CTD, the form of Pol II that can assemble into a preinitiation complex (see Figure 8-13). When IDRs required for formation of transcriptional condensates are deleted from an activator, the transcriptional activation function of the mutant activator is greatly diminished. Super-Enhancers Characterization of all the enhancers in cultured mammalian cells revealed that a small fraction of them are associated with regions containing multiple, closely spaced enhancers associated with highly acetylated histones over a region of 10 or more kilobases. These regions termed super-enhancers include percent of all enhancers, depending on the cell type. Unlike typical enhancers, super-enhancers contain longer regions of DNA bound by transcription factors and their associated co-activators. This long region of bound transcription factors,
many with IDRs, promotes the formation of transcriptional condensates on super-enhancers. This leads to concentrations of proteins involved in transcription initiation within the condensate that are twenty- to a hundredfold higher than in other regions of the nucleoplasm, resulting in a huge increase in the rate of assembly of the multicomponent preinitiation complex, contributing greatly to the high rate of transcription induced by super-enhancers. Super-enhancers often activate key cell identity genes expressed at high level that are important for normal mammalian development. For example, in fibroblasts, which secrete extremely high levels of collagens to provide tensile strength and flexibility to the extracellular matrix (see
Chapter 20), a super-enhancer of kb forms over the collagen 1A1 gene (COL1A1) and its upstream region (Figure 8-39a). The closely related histone acetylase co-activators p300 and CBP associate with chromatin throughout this region, presumably by interacting with multiple activators bound to their specific cognate-binding sequences. CBP/p300 acetylate histone H3 lysines (K in the one letter amino acid code) at positions 18 and 27. Acetylation at H3K27 was detected by chromatin immunoprecipitation with antibodies specific for H3 acetylated at K27 (Figure 8-39a, top). The length of the acetylated region associated with COL1A1 was much longer than other regions of H3K27ac in this region. In contrast to fibroblasts, which express high levels of COL1A1, airway epithelial cells do not express high levels of COL1A1 and do not form a super-enhancer over the COL1A1 gene (Figure 8-39a, top). Rather, in these epithelial cells, a super-enhancer encompassing a 13-kb region of chromatin formed over the KRT5 gene, resulting in high level expression
of this protein that gives tensile strength and flexibility to a sheet of epithelial cells (see Chapter 20). A broad region of H3K27 acetylation was also associated with the KRT6A gene, expressed at lower but still substantial level in these cells, and small peaks of H3K27ac were associated with the KRT6B and KRT6C genes expressed at low level. None of the other keratin genes in this gene cluster were expressed in these cells, and consistently, they did not have peaks of H3K27ac associated with their TSSs, indicating that these promoters were not active in these cells (Figure 8-39b).
EXPERIMENTAL FIGURE 8-39 The COL1A1 and KRT 5 and 6A super-enhancers. (a) Bottom: Map of genes on human chromosome 17 between 48,200,000 and 48,400,000 base pairs from the left end, represented by the horizontal line demarcated in 50,000 basepair intervals. Genes transcribed to the right are represented above the line; genes transcribed to the left, below the line. Exons are represented by vertical lines, with arrowheads indicating the exon. Dashed vertical lines indicate the positions of transcription start sites (TSS) for genes expressed in airway epithelial cells. Top: Chromatin immunoprecipitation data (see Figure 8-12) for histone H3 lysine 27 acetylation (H3K27ac) from cultured human fibroblasts or airway epithelial cells, as indicated at the left. The data is reported as the number of times a sequence in each 50-bp interval along the chromosome
Transcription Occurs in Bursts
was observed in cross-linked chromatin fragments immunoprecipitated with antibody specific for an H3 peptide acetylated at lysine 27. Note that most peaks of H3K27ac were <5 kb in length. In contrast, COL1A1 is associated with a much longer, -kb region of chromatin extensively acetylated on H3K27. This unusually long region of H3K27ac identifies this as a super-enhancer. (b) Bottom: Map of genes on human chromosome 12 between 52,800,000 and 53,000,000 base pairs from the left end. Dashed vertical lines indicate positions of TSSs for genes expressed in fibroblasts. Top: Chromatin immunoprecipitation data for histone H3K27ac from cultured human fibroblasts or airway epithelial cells. [Data from R. Ferrari et al., 2014, Cell Host Microbe 16:663–676.] In situ hybridization experiments have shown that transcriptional condensates (see Figure 8-38a) associate with the super-enhancers that are active in a particular cell type. Presumably, the high concentration of proteins involved in transcription initiation within these transcriptional condensates results in the very high rates of transcription initiation associated with super-enhancers. Transcription Occurs in Bursts High-resolution video microscopy recently revealed that many genes expressed at high level are not continuously transcribed at high rates. Rather, transcription initiation from highly transcribed genes occurs in bursts of multiple initiation events separated by periods of no transcription between transcriptional bursts. This was observed in Drosophila embryos containing constructs of reporter genes attached to multiple copies of engineered stem loops in their -untranslated sequence. The stem loops bind to bacteriophage coat proteins with very high affinity and specificity.
In the experiment presented in Figure 8-40, 24 copies of the binding site for the bacteriophage MS2-coat protein were inserted immediately downstream of the promoter region of the Drosophila snail (sna) gene, which is expressed in the early Drosophila embryo. When transgenic flies were generated containing this reporter inserted into one site on one chromosome, no expression of the transgene was detected. But transcription was detected when the inserted DNA contained an enhancer downstream of the reporter gene, an enhancer that activates expression of sna in the early Drosophila embryo (Figure 8-40b). Transcription was detected by expressing MS2-coat protein fused to GFP (green fluorescent protein) in the same cells in which the reporter gene construct was inserted. When the -end of the reporter gene was transcribed, MS2-coat protein-GFP bound to the 24 MS2-coat protein-binding sites, generating a signal that was visible by confocal fluorescence microscopy (Figure 840a). A video of images of the embryo during the 14th nuclear cycle ( min long) revealed one region of GFP fluorescence in each cell at the site of the transcribed, inserted reporter gene. But the intensity of the GFP signal in each cell was not continuous. Rather, the intensity of each spot of fluorescence increased and decreased over several minutes (Figure 8-40d and associated movie, whose link is in the Figure 8-40 legend).
EXPERIMENTAL FIGURE 8-40 Highly expressed genes are transcribed in bursts. (a) Transcriptional focus detected by binding of MS2-coat protein-yellow fluorescent protein (MCP-YFP) to the 24 coat protein binding sites at the -end of the RNA transcribed from
the reporter gene. (b) Top: Schematic representation of reporter gene containing 100-bp of the sna promoter spanning the transcription start site and 24× MS2 RNA stem loops within the UTR. The strong 1.5-kb sna “shadow” enhancer was placed 7.5 kb downstream. Bottom: Trace of fluorescence intensity over time of signal in an individual nucleus. (c) Same as part (b) but with the rho NE enhancer substituted for the sna shadow enhancer. (d) Frames from movies of transcriptional bursting. “ sna shadow” (right) shows yellow fluorescence bursts (which appear green) in living Drosophila embryos in which all cells have the integrated reporter gene indicated in part (b). The time shown (23 minutes and 20 seconds) is the time elapsed since the 14th nuclear division. “Enhancer deletion” (left) is the reporter construct in (b) but with no enhancer inserted. “ sna shadow” (middle) has the sna shadow enhancer inserted 1 kb upstream of the sna promoter. To watch the movie, go to https://www.cell.com/cms/ 10.1016/j.cell.2016.05.025/attachment/ 2184326d-3b6c- 47d6-8121-c00c36c3ebeb/mmc2. The movie starts at nuclear cycle (nc) 14 of embryogenesis and continues until gastrulation. The cells also express a fusion of RFP to histone H2A shown in blue, as a marker for the nucleus. Anterior is to the left and ventral is facing up. [Republished with permission by Elsevier, from T. Fukaya, B. Lim, and M. Levine (2016) Enhancer Control of Transcriptional Bursting. Cell 166 (2): 358–368; permission conveyed through Copyright Clearance Center, Inc.] Description (a) Microphoto of a cell with dim green color and a small area of bright green (b) Bar model of s n a P r with a green rectangle at left, a bent line moving to the right to a yellow rectangle and a blue rectangle at the end labeled enhancer (s n a shadow). (c) Same as (b) but the blue rectangle has this label: enhancer rho N E E (d) graphs showing fluorescence intensity over time in nuclear cycle. The two graphs show many peaks and valleys, with the left graph, labeled "s n a shadow," having higher height and more peaks than the right graph. Above the right graph it says "rho N E E weaker" (d) Three microphotos showing blue circles with different amounts of bright blue dots. Left photo is labeled enhancer deletion, center photo is labeled 5-prime s n a shadow and right photo is labeled 3-prime s n a shadow.
The intensity of a single fluorescent focus in one nucleus was plotted versus time for this construct with the strong sna “shadow” enhancer and for a second construct with the weaker rho NEE enhancer (Figures 8-40b and c, respectively). Bursts of fluorescence were observed extending for variable periods of time averaging min (the width of the peaks). Based on the fluorescence intensity, each burst is thought to have resulted from 20–100 transcription initiation events over the min period of a single transcriptional burst. For the construct with the strong sna shadow enhancer, bursts occurred frequently; for the construct with the weaker rho NEE enhancer, bursts of approximately the same height resulting from 20– 100 transcription initiations also were observed, but the bursts occurred less frequently (Figure 8-40b, c). Similar observations have been made for other Drosophila enhancers. In most cases, the strength of an enhancer is related primarily to how frequently transcriptional bursts are initiated. Additional research is needed to fully understand the mechanism(s) underlying transcriptional bursting and its regulation by enhancers. However, in vitro transcription experiments with yeast extracts indicate that after the first round of transcription from an added template DNA, TBP and possibly other general transcription factors (GTFs) remain associated with promoter DNA forming a partially assembled preinitiation complex (PIC) scaffold that allows very rapid assembly of the next preinitiation complex and subsequent initiation by Pol II. These observations and other in vitro transcription experiments with purified factors have led to the model that an interaction between enhancer-bound factors, Mediator, and transcription factors bound to promoter-proximal elements promotes the
assembly of a Pol II preinitiation complex that initiates, leaving behind a scaffold of TBP bound to the promoter that can reassemble and initiate transcription up to 100 times before the scaffold dissociates from the promoter. This is postulated to result in the observed bursts of transcription. Strong enhancers are proposed to increase the frequency of these bursts by stimulating the rate of assembly of general transcription factors into the first PIC that initiates the transcriptional burst, while weak enhancers are proposed to cause the assembly of PICs on the regulated promoter at a lower frequency. KEY CONCEPTS OF SECTION 8.4 Molecular Mechanisms of Transcription Repression and Activation Eukaryotic transcription activators and repressors exert their effects largely by binding to multisubunit co-activators or co-repressors that influence the assembly of preinitiation complexes either by modulating chromatin structure or by interacting with Pol II and general transcription factors. The DNA in condensed regions of chromatin (heterochromatin) is relatively inaccessible to transcription factors and other proteins, so that gene expression in these regions is repressed. The interactions of several proteins with one another and with the hypoacetylated N-terminal tails of histones H3 and H4 are responsible for the chromatin-mediated repression of transcription that occurs in the telomeres and the silent mating-type loci in S. cerevisiae (see Figure 8-32). Some repression domains function by interacting with co-repressors that are histone deacetylase complexes. The subsequent deacetylation of histone N-terminal tails in nucleosomes near the repressor-binding site inhibits interaction between the promoter DNA and general transcription factors, thereby repressing transcription initiation (see
Figure 8-33a). Activation domains function by binding multiprotein co-activator complexes such as histone acetylase complexes. The subsequent hyperacetylation of histone N-terminal tails in nucleosomes near the activator-binding site facilitates interactions between the
promoter DNA and general transcription factors, thereby stimulating transcription initiation (see Figure 8-33b). SWI/SNF chromatin-remodeling factors constitute another type of co-activator. These multisubunit complexes can transiently dissociate DNA from histone cores in an ATPdependent reaction and may also decondense regions of chromatin, thereby promoting the binding of DNA-binding proteins needed for transcription initiation. The Mediator complex, another type of co-activator, is a roughly 30-subunit complex that forms a molecular bridge between activation domains and RNA polymerase II by binding directly to the polymerase and activation domains. By binding to several different activators either simultaneously or in rapid succession, Mediator probably helps integrate the effects of multiple activators on a single promoter (see Figure 837). Activators bound to a distant enhancer can interact with transcription factors bound to a promoter because chromatin is flexible and the intervening chromatin can form a large loop.
8.5 Regulation of Transcription-Factor Activity
8.5 Regulation of TranscriptionFactor Activity We have seen in the preceding discussion how combinations of transcription factors binding to specific DNA regulatory sequences control transcription of eukaryotic genes. Consequently, the nuclear concentrations and activities of the transcription factors that interact with the transcription-control regions of a gene are crucial to determining whether a specific gene in a multicellular organism is expressed in a particular cell at a particular time during development or in differentiated cells. As we have seen, local chromatin structure also contributes to transcription regulation in eukaryotes, as in the case of Sir protein repression at telomeres and the silent mating-type loci in yeast (see Figure 8-32). In the next section, we discuss other examples of chromatinmediated control that can result in transcriptional memory. Here we discuss regulation of transcription-factor expression and activity. Which transcription factors are expressed in a particular cell type is determined by previous interactions between other transcription factors and control regions in transcription-factor genes that occur during development and differentiation of that cell type. We now have a highresolution view of how transcription-factor binding changes during development and differentiation of multiple human cell types. This
DNase I Hypersensitive Sites Reflect the Developmental History of Cellular Differentiation
understanding is due to the identification of DNase I hypersensitive sites on a genomic scale. DNase I Hypersensitive Sites Reflect the Developmental History of Cellular Differentiation In Chapter 7, we learned that an expressed gene is far more sensitive to digestion by the nuclease DNase I than when the gene is not expressed (see
Figure 7-27). In addition to this general increase in DNase I sensitivity over the length of a gene, researchers have found that specific short regions of the genome are extremely sensitive to DNase I digestion compared to the vast majority of the DNA in chromatin. These stretches of DNA are on the order of a hundred base pairs in length, and are the first regions cut when isolated nuclei are treated with low levels of DNase I. These cut regions are known as DNase I hypersensitive sites (DHSs). High-throughput sequencing methods have allowed mapping of DHSs across the genome in multiple differentiated and embryonic cell types. Briefly, after digestion of isolated nuclei with low levels of DNase I, DNA is isolated from the treated chromatin. Oligonucleotide linkers of a known sequence are ligated to the DNA ends generated by DNase I digestion. The DNA is sheared into small fragments by sonication, amplified by PCR, and sequenced. Using this approach, human DNA sequences adjacent to the oligonucleotide linker sequence were thus identified as DHSs.
Figure 8-41a shows plots of the number of times a DHS was sequenced in samples from the human cell types indicated at the left. The frequency at which genomic DNA within an interval of 1 kb along the length of a chromosome is observed by this method is a measure of the DNase sensitivity of this 1 kb region of the genome. The height of each vertical bar represents the degree of sensitivity of the DNA sequence at that position to digestion in nuclei isolated from each of the cell types. A roughly 600-kb region of the genome on chromosome 9 is shown.
FIGURE 8-41 Maps of DNase I hypersensitive sites in embryonic and adult cells reflect their developmental history. (a) DHSs from each of the human cell types shown at the left
are mapped in an interval on chromosome 9. The height of each vertical bar in the figure represents the number of times a sequence in a 50-bp interval at that position was sequenced and represents DNase sensitivity. The plots are color-coded according to the embryonic tissue from which they developed. (b) Dendrogram showing the relationships among the DHS maps for each cell type across the entire genome. The embryonic tissue from which each of these cell types develops is shown at the right. Embryonic stem cells form the root of the dendrogram. The DHS maps for all other cell types are derived from those for the embryonic stem cell by loss of some DHSs and the acquisition of other DHSs. The dendrogram, based on how closely DHS maps from two cell types are related, parallels the developmental relationships among the cell types. [Republished with permission from Elsevier, from A. B. Stergachis et al., 2013, “Developmental Fate and Cellular Maturity Encoded in Human Regulatory DNA Landscapes,” Cell, 154:888–903; permission conveyed through Copyright Clearance Center, Inc.] DHSs appear to be sites where sequence-specific binding proteins, such as transcription factors, bind to DNA. Consequently, the DHS pattern in a region of chromatin indicates the positions of bound transcription factors, although the transcription factors bound are not directly identified. In Figure 8-41a, the type of tissue from which the DHS data were determined is shown on the left, and the embryonic tissues from which these tissue types developed are color-coded as indicated in Figure 8-41b. It is apparent that more closely related cell types, such as fibroblasts from different regions of the body, or endothelial cells that line the inner surfaces of blood vessels from different organs, have more similar DHSs than more distantly related cell types. With computer methods, it is possible to compare the similarity of the DHS maps for each of these cell types across the entire genome. With these computational methods, a
dendrogram can be generated showing how closely the DHS map from one cell type resembles those of other cell types (see Figure 8-41b). This dendrogram is similar to the dendrograms used to show the relatedness, and hence the evolution, of gene sequences (see Figure 6-24b). Importantly, the DHS pattern of embryonic stem cells is at the root of the DHS dendrogram for all cell types (see Figure 8-41b). These cells from the inner cell mass of the early mammalian embryo (discussed in Chapter 22; see Figure 22-4) are the progenitors of all cells in the adult organism. Embryonic stem cells have the largest number of DHSs, suggesting that they have the most complex transcriptional control of all cells: about 257,000 DHSs in one study, compared with 90,000–150,000 in differentiated cells. This difference probably reflects the developmental potential of embryonic stem cells. Approximately 50,000–100,000 DHSs that are not found in embryonic stem cells arise during development. Note that for each adult cell type, a different set of new DHSs arises. These DHS patterns reveal the complexity of the combinations of transcription factors that regulate each gene. Approximately a million distinct DHSs were characterized in the cell types shown in Figure 8-41. Since DHSs include clustered transcriptionfactor binding sites typical of enhancers, these results suggest that on average, combinations of four or five enhancers regulate the transcription of each of the roughly 19,000 genes in the human genome. The maps of DHSs reveal where binding of early embryonic transcription factors is lost and where new cell-type-specific combinations of transcription factors bind as a cell differentiates. Even this estimate fails to capture the
Nuclear Receptors Are Regulated by Lipid-Soluble Hormones
complexity of transcriptional control, since many transcription-factorbinding sites detected as one DHS are, in fact, bound by related transcription factors with similar DNA-binding domains in different cell types. The related transcription factors regulate the appropriate level of transcription for that cell type. Nuclear Receptors Are Regulated by Lipid-Soluble Hormones In addition to controlling the expression of transcription factors, cells also regulate the activity of many of their transcription factors once they have been expressed. For example, the activity of many transcription factors is regulated by signals received from other cells. Interactions between extracellular domains of transmembrane-receptor proteins on the surface of the cell and specific protein ligands for these receptors secreted by other cells, or expressed on the surface of neighboring cells, activate intracellular domains of the transmembrane proteins. The result is that the signal received on the outside of the cell is transduced to a signal on the inside of the cell. The intracellular signal regulates the activities of enzymes that modify transcription factors by post-translational protein modifications, such as phosphorylation, acetylation, and proteosomal degradation (see Figure 3-32). These post-translational modifications activate or inhibit transcription factors in the nucleus. In Chapters 15 and 16, we describe the major types of cell-surface receptors, the protein ligands they bind, and the intracellular signaling pathways that regulate transcription-factor activity.
Nuclear-Receptor Response Elements Contain Inverted or Direct Repeats
Description The six transcription factors are depicted for Estrogen receptor, progesterone receptor, glucocorticoid receptor, thyroxine receptor, retinoic acid receptor, and a general primary structure model. The green variable region at the left of each model varies in length from 100-500 a a. The D N A binding area (blue) are all 68 a a. The ligand binding domains vary from 225-285 a a. All areas are arranged in the same order in each model. Nuclear-Receptor Response Elements Contain Inverted or Direct Repeats The DNA sites to which nuclear receptors bind are called response elements. The nucleotide sequences of several response elements have been determined. The consensus sequences of response elements for two steroid hormone receptors, the glucocorticoid receptor response element (GRE) and the estrogen receptor response element (ERE) are 6-bp inverted repeats separated by any three base pairs (Figure 8-44a, b). This finding suggested that the cognate steroid hormone receptors would bind to DNA as symmetric dimers. This was confirmed by x-ray crystallographic analysis of the homodimeric glucocorticoid receptor’s zinc-finger DNA-binding domain (see Figure 8-25b).
FIGURE 8-44 Consensus sequences of DNA response elements that bind five nuclear receptors. (a, b) The glucocorticoid and estrogen receptors are twofold symmetric dimers that bind, respectively, to the glucocorticoid receptor response element (GRE) and the estrogen receptor response element (ERE). Each of these response elements contains inverted repeats separated by three base pairs. (c–e) The heterodimeric nuclear receptors each contain one RXR subunit associated with another nuclear-receptor subunit that defines the hormone response. RXR-VDR mediates responses to vitamin by binding to a direct repeat separated by three base pairs (a VDRE). RXR-TR mediates responses to thyroid hormone by binding to the same DNA bases in a direct repeat separated by four base pairs (a TRE). Similarly, RXR-RAR mediates a response to retinoic acid by binding to the same direct repeat separated by five base pairs, comprising a RARE. The repeat sequences bound by the reading helices of these receptors are indicated by red arrows. (f) Crystal structures of the glucocorticoid receptor bound to DNA containing a GRE (top) and of the RXR-TR heterodimer bound to DNA containing a TRE (bottom). Red arrows indicate the orientation from N to C of the reading helices. Note that in the twofold symmetric glucocorticoid receptor, the reading helices are inverted relative to each other so that they “read” an AGAACA on the top strand of the left half-site and on the bottom strand of the right halfsite, separated by 3 base pairs. Consequently, the binding site for the glucocorticoid receptor and other twofold symmetric homodimers such as the estrogen receptor is an inverted repeat [see (a) and (b)]. In contrast, the reading helices in the RXR-TR heterodimer are in the same orientation. Consequently, they read an AGGTCA sequence in the same orientation in the two-half sites separated by four base pairs, a direct-repeat binding site. The interface between the RXR subunit and the vitamin receptor (VDR) subunit bound to a VDRE brings the two reading helices closer together so that they bind to the same halfsites separated by three rather than four base pairs. Similarly, the interface between the RXR and RAR subunits bound to a RARE positions the two reading helices in the heterodimer farther apart than in the RXR-TR, so that they bind the same AGGTCA sequences separated by five base pairs. See K. Umesono et al., 1991, Cell 65:1255, and A. M. Naar et al., 1991, Cell 65:1267. [Part (f) Data from F. Rastinejad et al., 1995, Nature 375:203.] Description
(a) Consensus sequence labeled G R E from 5-prime to three-prime (and complementary strand): A G A A C A (N) subscript 3 T G T T C T. (b) Consensus sequence labeled E-R-E from 5-prime to three-prime (and complementary strand): A G G T C A (N) subscript three A C T G G A. (c) Consensus sequence labeled V-D-R-E from 5-prime to three-prime (and complementary strand): A G G T C A (N) subscript four A G G T C A. (d) Consensus sequence labeled T-R-E from 5-prime to three-prime (and complementary strand): A G G T C A (N) subscript 4 A G G T C A. (e) Consensus sequence labeled R-A-R-E from 5-prime to three-prime (and complementary strand): A G G T C A (N) subscript 5 A G G T C A. (f) Two X-ray crystallographic models of glucocortoid receptors interacting with D N A. In the top image, the receptors face away from each other, with the N and C terminals facing opposite ends of the D N A strand. Two pink arrows indicate these opposing directions. Immediately underneath is a second 3-D model that shows both receptors oriented in the same direction, left to right, as indicated by arrows. Some nuclear-receptor response elements, such as those for the receptors that bind nonsteroids such as vitamin , thyroid hormone, and retinoic acid, are direct repeats of the same sequence that is recognized by the estrogen receptor, separated by three, four, or five base pairs (Figure 844c–e). The specificity of these response elements is determined by the spacing between the repeats. The nuclear receptors that bind to these direct-repeat response elements do so as heterodimers, all of which share a monomer called RXR. The vitamin response element (VDRE), for example, is bound by the RXR-VDR heterodimer, and the retinoic acid response element (RARE) is bound by RXR-RAR. The monomers composing these heterodimers interact with each other in such a way that the two DNA-binding domains lie in the same orientation, allowing the RXR heterodimers to bind to direct repeats of the binding site for each monomer (Figure 8-44f). In contrast, the monomers in homodimeric nuclear receptors (e.g., GRE and ERE) have an inverted orientation.
Hormone Binding to a Nuclear Receptor Regulates Its Activity as a Transcription Factor
Hormone Binding to a Nuclear Receptor Regulates Its Activity as a Transcription Factor The mechanism by which hormone binding controls the activity of nuclear receptors differs between heterodimeric and homodimeric receptors. Heterodimeric nuclear receptors (e.g., RXR-VDR, RXR-TR, and RXR- RAR) are located in the nucleus. In the absence of their hormone ligand, they repress transcription when bound to their cognate sites in DNA. They do so by directing histone deacetylation at nearby nucleosomes by associating with histone deacetylase complexes, as described earlier for other repressors (see Figure 8-33a). When a heterodimeric nuclear receptor binds its ligand, the receptor undergoes a conformational change, and as a consequence, it dissociates from histone deacetylase complexes and binds histone acetylase complexes, thereby reversing its own repressing effects. In the presence of ligand, the ligand-bound conformation of the receptor also binds Mediator, stimulating preinitiation complex assembly. In contrast to heterodimeric nuclear receptors, homodimeric receptors are found in the cytoplasm in the absence of their hormone ligands. When a hormone binds to its receptor, the hormone-receptor complex translocates into the nucleus. The hormone-dependent translocation of the homodimeric glucocorticoid receptor (GR) was demonstrated in the experiments shown in Figure 8-45a–c. The GR hormone-binding domain alone mediates this transport. Subsequent studies showed that in the
absence of hormone, GR cannot be transported into the nucleus because its ligand-binding domain is partially unfolded and associates reversibly with Hsp70, a major cellular protein chaperone that assists folding of nascent polypeptides in the cytoplasm (see Figure 3-19a). As long as the receptor is confined to the cytoplasm, it cannot interact with target genes and hence cannot activate transcription. Hormone binding promotes an exchange of GR from Hsp70 to Hsp90 (see Figure 3-19b), which, with coupled hydrolysis of ATP, refolds the GR ligand-binding domain, increasing the affinity for hormone and releasing GR from Hsp70 so that it can enter the nucleus. Once in the nucleus in the conformation induced by ligand binding, the GR can bind to response elements associated with target genes (Figure 8-45d). Once the receptor with bound hormone binds to a response element, it activates transcription by interacting with chromatinremodeling and histone acetylase complexes and Mediator.
EXPERIMENTAL FIGURE 8-45 Fusion proteins from expression vectors demonstrate that the hormone-binding domain of the glucocorticoid receptor mediates translocation to the nucleus in the presence of hormone. Cultured animal cells were transfected with expression vectors encoding the proteins diagrammed in part (d). Immunofluorescence with a labeled antibody specific for β-galactosidase was used to detect the expressed proteins in transfected cells. (a) In cells that expressed β-galactosidase alone, the enzyme was localized to the cytoplasm in the presence and absence of the glucocorticoid hormone dexamethasone (Dex). (b) In cells that expressed a fusion protein consisting of β-galactosidase and the entire glucocorticoid receptor (GR), the fusion protein was present in the cytoplasm in the absence of hormone but was transported to the nucleus in the presence
Metazoans Regulate the RNA Polymerase II Transition from Initiation to Elongation
of hormone. (c) Cells that expressed a fusion protein composed of β-galactosidase and only the GR ligand-binding domain (light purple) also exhibited hormone-dependent transport of the fusion protein to the nucleus. (d) Model of hormone-dependent gene activation by a homodimeric nuclear receptor. In the absence of hormone, the receptor is kept in the cytoplasm by interaction between its ligand-binding domain (LBD) and chaperone proteins. When hormone is present, it diffuses through the plasma membrane and binds to the ligandbinding domain, causing a conformational change that releases the receptor from the chaperone proteins. The receptor with bound ligand is then translocated into the nucleus, where its DNA-binding domain (DBD) binds to response elements, allowing the ligandbinding domain and an additional activation domain (AD) at the N-terminus to stimulate transcription of target genes. [Parts (a)–(c) Republished with permission of John Wiley & Sons — Books, from D. Picard and K. R. Yamamoto, 1987, “Two Signals Mediate Hormone-Dependent Nuclear Localization of the Glucocorticoid Receptor,” EMBO J., 6(11): 3333–3340, Fig. 3; permission conveyed through Copyright Clearance Center, Inc.] Description (a) Photos of cells with dye making galactosidase glow. The glow shows the cytoplasm more than the nucleus. (b) Photos of cells with dye for glucocorticoid receptors and the glow is at the top in the cytoplasm, and in the bottom in the nucleus only. (c) Photos of cells with dye for G L ligand binding domain. The top photo shows glow in cytoplasm and the bottom photo shows nucleus glow. Below each set of photos is a bar model for each item that glowed. (d) A schematic model of a cell with a nucleus. The cytosol is labeled, and a hormone is labeled outside the cell. The actions shown in the photos are depicted in the cytosol and in the nucleus. Metazoans Regulate the RNA Polymerase II Transition from Initiation to Elongation
A recent unexpected discovery that resulted from application of the chromatin immunoprecipitation technique is that a large fraction of genes in metazoans have a paused elongating RNA polymerase II within about 50–100 bp of the transcription start site. Thus expression of the encoded protein is controlled not only by transcription initiation but also by transcription elongation early in the transcription unit. The first genes discovered to be regulated by control of transcription elongation were heat-shock genes (e.g., hsp70), which encode molecular chaperones that refold denatured proteins and other proteins that help the cell deal with the effects of heat shock. When heat shock occurs, the heat-shock transcription factor (HSF1) is activated (see Chapter 21). Binding of activated HSF1 to specific sites in the promoter-proximal region of heatshock genes stimulates the paused polymerase to continue chain elongation and promotes rapid reinitiation by additional Pol II molecules, leading to many transcription initiations per minute. This mechanism of transcriptional control permits a rapid response: these genes are always paused in a state of suspended transcription and therefore, when an emergency arises, no time is required to remodel and acetylate chromatin at the promoter and assemble a transcription preinitiation complex. Another transcription factor known to regulate transcription elongation is MYC, which functions in the regulation of cell growth and division. MYC is often expressed at high levels in cancer cells and is a key transcription factor in the reprogramming of somatic cells into pluripotent stem cells capable of differentiation into any cell type. The ability to induce differentiated cells to convert to pluripotent stem cells has elicited enormous research interest because of its potential for the development of
Termination of Transcription Is Also Regulated
therapeutic treatments for traumatic injuries to the nervous system and degenerative diseases (see Chapter 22). Termination of Transcription Is Also Regulated Once Pol II has transcribed about 50 nucleotides from the transcription start site, elongation through most genes is highly processive. Chromatin immunoprecipitation with antibody to Pol II, however, indicates that the amount of Pol II at various positions in a transcription unit in a population of cells varies greatly (see Figure 8-12b, right). This finding indicates that the enzyme can elongate through some regions much more rapidly than others. In most cases, Pol II does not terminate transcription until after a sequence is transcribed that directs cleavage and polyadenylation of the RNA at the end of the encoded mRNA. Pol II can then terminate transcription at multiple sites located 0.5–2 kb beyond this poly(A) addition site. Experiments with mutant genes show that termination is coupled to the process that cleaves and polyadenylates the end of a transcript, which is discussed in the next chapter. KEY CONCEPTS OF SECTION 8.5 Regulation of Transcription-Factor Activity The activities of many transcription factors are indirectly regulated by binding of extracellular proteins and peptides to cell-surface receptors. These receptors activate intracellular signal transduction pathways that regulate specific transcription factors through a variety of mechanisms discussed in Chapter 16.
Nuclear receptors constitute a superfamily of dimeric zinc-finger transcription factors that bind lipid-soluble hormones and interact with specific response elements in DNA (see Figures 8-41 and 8-43). Hormone binding to nuclear receptors induces conformational changes that modify the interactions of these receptors with other proteins (see Figure 8-26b, c). Heterodimeric nuclear receptors (e.g., those for retinoids, vitamin D, and thyroid hormone) are found only in the nucleus. In the absence of hormone, they repress transcription of target genes with the corresponding response element. When bound to their ligands, they activate transcription. Steroid hormone receptors are homodimeric nuclear receptors. In the absence of hormone, they are trapped in the cytoplasm by molecular chaperones. When bound to their ligands, they can translocate to the nucleus and activate transcription of target genes (see Figure 8-44). In metazoans, RNA polymerase II often pauses during elongation within approximately 50–100 base pairs from the transcription start site. Release from this pause contributes to the regulation of gene transcription. Termination by RNA polymerase II is coupled to cleavage of transcripts at the end of the final exon followed by polyadenylation. Cleavage and polyadenylation are considered further in Chapter 9.
8.6 Epigenetic Regulation of Transcription
8.6 Epigenetic Regulation of Transcription The term epigenetics refers to the study of inherited changes in the phenotype of a cell that do not result from changes in DNA sequence. For example, during the differentiation of bone marrow stem cells into the several different types of blood cells, a hematopoietic stem cell divides into two daughter cells, one of which continues to have the properties of a hematopoietic stem cell, including the potential to differentiate into all the different types of blood cells. But the other daughter cell becomes a type of progenitor cell that normally can differentiate into lymphocytes or myeloid cells (see Figure 22-18). Lymphoid progenitor cells generate daughter cells that differentiate into lymphocytes, which perform many of the functions involved in immune responses to pathogens (see Chapter 24). Myeloid progenitor cells divide into daughter cells that are committed to differentiating into red blood cells, different kinds of phagocytic white blood cells, or the cells that generate platelets involved in blood clotting. Lymphoid and myeloid progenitor cells both have the same DNA sequence as the zygote (generated by fertilization of an egg cell by a sperm cell) from which they developed, but they have restricted developmental potential because of epigenetic differences between them. Such epigenetic changes are initially the consequence of the expression of specific master-transcription factors that are regulators of cellular
DNA Methylation Regulates Transcription
differentiation, controlling the expression of other genes that encode transcription factors and proteins involved in cell-cell communication in complex networks of gene control. Understanding these networks is currently the subject of intense investigation. Changes in gene expression initiated by transcription factors are often reinforced and maintained over multiple cell divisions by post-translational modifications of histones and methylation of DNA at position 5 of the cytosine pyrimidine ring (see
Figure 2-17). These changes to chromatin are maintained and propagated to daughter cells when cells divide. Consequently, the term epigenetic marks is used to refer to such post-translational modifications of histones and 5-methyl C modification of DNA. DNA Methylation Regulates Transcription Recall that most promoters in mammals fall into the CpG island class. Active CpG island promoters have unmethylated cytosines in their CG sequences. Unmethylated CpG island promoters have reduced affinity for histone octamers. But nucleosomes immediately neighboring the unmethylated promoters are methylated at histone H3 lysine 4. These methylated nucleosomes are associated with Pol II molecules that have paused during transcription of both the sense and antisense template-DNA strands (see Figures 8-12 and 8-13). Recent research indicates that methylation of histone H3 lysine 4 occurs in mouse cells because a protein named Cfp1 (CXXC finger protein 1) binds unmethylated CpG-rich DNA through a zinc-finger domain (CXXC) and associates with a histone
methylase (Setd1) specific for histone H3 lysine 4. Chromatin-remodeling complexes and the general transcription factor TFIID, which initiates Pol II preinitiation complex assembly (see Figure 8-13), associate with nucleosomes bearing the H3 lysine 4 trimethyl mark, thus promoting Pol II transcription initiation. In differentiated cells, a small percentage of specific CpG island promoters, depending on the cell type, have CpGs marked by 5-methyl C. A family of proteins binds to DNA that is rich in 5-methyl C–modified CpGs. Once bound, these methyl CpG-binding proteins, or MBDs, associate with histone deacetylases and repressive chromatin-remodeling complexes that condense chromatin, resulting in transcriptional repression. The 5-methyl C is added to the CpGs by DNA methyl transferases named DNMT3a and DNMT3b. They are referred to as de novo DNA methyl transferases because they methylate Cs in a region where there is no 5-methyl C in either DNA strand. Much remains to be learned about how DNMT3a and b are directed to specific CpG islands. But once they have methylated a DNA sequence, methylation at that C is passed on through DNA replication through the action of the ubiquitous maintenance methyl transferase DNMT1 (red indicates daughter strands): Description The left two lines are labeled C M 5 -G on the top line, and G- C M 5 on the bottom line. There is an arrow next labeled D N A replication. The middle lines are the daughter cells in red. There are four lines. The top line says C m 5-G, the second line
Methylation of Specific Histone Lysines Is Linked to Epigenetic Mechanisms of Gene Repression
says G-C, the third line says C-G, and the bottom line says G-C m 5. A new arrow goes to the right and is labeled D N M T 1. The last set of four lines all show the C m 5 wherever the C base was. As a consequence, once a CpG island promoter is methylated by DNMT3a or b, it continues to be methylated by DNMT1 in subsequent daughter cells. Consequently, the promoter remains repressed in all subsequent daughter cells through interactions with MBDs, even after the stimulus for the initial C-methylation by DNMT3a or b has ceased. Therefore, repression of C-methylated promoters is inherited through cell division. This mechanism of epigenetic repression is being intensely investigated because tumor-suppressor genes encoding proteins that function to suppress the development of cancer are often inactivated in cancer cells by abnormal CpG methylation of their promoter regions. This is discussed further in Chapter 25. Methylation of Specific Histone Lysines Is Linked to Epigenetic Mechanisms of Gene Repression
Figure 7-26b summarized the major different types of post-translational modifications that are found on histones, including acetylation and methylation of lysines. The acetylation state at a specific histone lysine on a particular nucleosome results from a dynamic equilibrium between acetylation and deacetylation by histone acetylases and histone deacetylases. Acetylation of histones in a localized region of chromatin
predominates when local DNA-bound activators transiently bind histone acetylase complexes. Deacetylation predominates when repressors transiently bind histone deacetylase complexes. Pulse-chase radiolabeling experiments have shown that acetyl groups on histone lysines turn over rapidly through the sequential actions of these competing enzymes. In contrast, methyl groups on histones are much more stable. Methylation of lysine occurs on the nitrogen atom of the terminal ε-amino group of the lysine side chain (see Figure 2-14). Lysines can be modified by the addition of one, two, or three methyl groups to this terminal nitrogen atom, generating mono-, di-, and trimethylated lysine, all of which carry a single positive charge. Histone lysine methyl groups can be removed by histone lysine demethylases. But the resulting turnover of histone lysine methyl groups is much slower than the turnover of histone lysine acetyl groups, which makes methylation a more appropriate post-translational modification for propagating epigenetic information. Three other common post-translational modifications of histones have been characterized (see Figure 7-26b). Through study of these histone modifications and their effects on transcription and other processes like the formation of mitotic chromosomes, a picture of chromatin has emerged. We know that the histone tails extending as random coils from the chromatin fiber are modified to generate one of many possible combinations of modifications that regulate chromatin-based processes by affecting the binding of a large number of different protein complexes. This control of protein interactions with specific regions of chromatin that results from the combined influence of post-translational modifications of
histones has been called a histone code. Some of these modifications, such as histone lysine acetylation, are rapidly reversible, whereas others, such as histone lysine methylation, can be epigenetically inherited. Table 8-2 summarizes the post-translational modifications that make up the histone code.
TABLE 8-2 • Histone Post-Translational Modifications Associated with Active and Repressed Genes Modification Sites of Modification Effect on Transcription Acetylated lysine H3 (K9, K14, K18, K23, K27) Activation H4 (K5, K8, K12, K16) Activation H2A (K5, K8, K13) Activation H2B (K5, K12, K15, K20) Activation Hypoacetylated lysine Repression Phosphorylated serine/threonine H3 (T3, S10, T11, S28) Activation H2A (S1, T120) Activation H2B (S14) Activation Methylated arginine H3 (R2, R17, R26) Activation H4 (R3) Activation Methylated lysine H3 (K4) Me3 in promoter region Activation H3 (K4) Me1 in enhancers Activation
H3 (K36, K79) in transcribed region Elongation H3 (K9, K27) Me2/3 Repression H4 (K20) Me2/3 Repression Ubiquitinylated lysine H2B (K120 in mammals, K123 in S. cerevisiae) Activation H2A (K119 in mammals) Repression Histone H3 Lysine 9 Methylation in Heterochromatin In most eukaryotes, some co-repressor complexes contain histone methyl transferase subunits that methylate histone H3 at lysine 9, generating diand trimethyl lysines. These methylated lysines are binding sites for isoforms of HP1 protein, which functions in the condensation of heterochromatin, as discussed in Chapter 7 (see Figure 7-28). For example, the KAP1 co-repressor complex functions with a class of more than 200 zinc-finger–transcriptional repressors encoded in the human genome. The co-repressor complex includes a subunit with H3 lysine 9 methyl transferase activity that methylates nucleosomes over the promoter regions of genes targeted for repression by these zinc-finger repressors. This results in HP1 binding to these promoter regions, chromatin condensation, and transcriptional repression. An integrated transgene in cultured mouse fibroblasts that was repressed through the action of the KAP1 co-repressor was associated with heterochromatin in most cells,
whereas the active form of the same transgene was associated with euchromatin (Figure 8-46). Chromatin immunoprecipitation assays showed that the repressed gene was associated with histone H3 methylated at lysine 9 and with HP1, whereas the active gene was not. EXPERIMENTAL FIGURE 8-46 Association of a repressed transgene with heterochromatin. Mouse fibroblasts were stably transformed with a transgene that contained binding sites for an engineered repressor. The repressor was a fusion between a DNA-binding domain, a repression domain that interacts with the KAP1 co-repressor complex, and the ligand-binding domain of a nuclear receptor that allows the nuclear import of the fusion protein to be controlled experimentally (see Figure 8-45). DNA was stained blue with the dye DAPI. Brighter-staining regions are regions of heterochromatin, where the DNA concentration is higher than in euchromatin. The transgene was detected by hybridization of a fluorescently labeled complementary probe (green). When the recombinant repressor was retained in the cytoplasm, the transgene was transcribed (left) and was associated with euchromatin in most cells. When hormone was added so that the recombinant repressor entered the nucleus, the transgene was repressed (right) and associated with heterochromatin. Chromatin immunoprecipitation assays (see Figure 8-12) showed that the repressed gene was associated with histone H3 methylated at lysine 9 and HP1, whereas the active gene was not.
[Republished with permission from Cold Spring Harbor Laboratory Press, from K. Ayyanathan et al., 2003, “Regulated Recruitment of HP1 to a Euchromatic Gene Induces Mitotically Heritable, Epigenetic Gene Silencing: A Mammalian Cell Culture Model of Gene Variegation,” Genes Dev., 17:1855–1869; Fig. 6.] Description Heterochromatin is visible as a light blue stain. A transgene is visible as a green spot. In the image of the active gene, the transgene is outside the nucleus; in the repressed cell, the transgene is inside the nucleus. Importantly, H3 lysine 9 methylation is maintained following chromosome replication by the mechanism diagrammed in Figure 8-47. When a methylated region of DNA is replicated in S phase, the nucleosomes associated with the parent DNA are randomly distributed to the daughter DNA molecules. New histone octamers that are not methylated on H3 lysine 9 also associate randomly with the new daughter chromosomes to reestablish the density of nucleosomes before DNA replication, but since the parent nucleosomes are associated with both daughter chromosomes, approximately half of the daughter chromosomes’ nucleosomes are methylated on lysine 9. The repressor complex also contains a subunit with a chromo domain that binds histone H3 trimethylated at lysine 9 (H3K9me3). This causes the co-repressor complex to associate with the newly replicated chromatin in which about half the nucleosomes contain H3K9me3. As a result, the methylase subunit of the co-repressor complex is brought into sufficiently close proximity to the H3 histone N-terminal tails of the newly assembled histone octamers that they methylate all the H3 N-termini associated with that region of chromatin, leading to HP1 association and chromatin condensation (see Figure 7-28). Repetition of
this process with each cell division results in maintenance of H3 lysine 9 methylation of this region of the chromosome.
FIGURE 8-47 Maintenance of histone H3 lysine 9 methylation during chromosome replication. When chromosomal DNA is replicated, the parent histones randomly associate with the two daughter chromosomes, while unmethylated histones synthesized during S phase are assembled into other nucleosomes in those same daughter chromosomes. Association of histone H3 lysine 9 methyl transferases (H3K9 HMT) with parent nucleosomes bearing the histone 3 lysine 9 di- or trimethylation mark methylates the newly added unmodified nucleosomes. Consequently, histone H3 lysine 9 methylation marks are maintained during repeated cell divisions unless they are specifically removed by a histone demethylase.
Epigenetic Control by Polycomb and Trithorax Complexes
Description Two schematic illustrations show D N A and the M e 3 complex. The top schematic shows a strand with four M e 3 cylinders in a row, then an arrow labeled replication pointing to the right. At the right there are two rows of D N A and the M e 3 are depicted on every other cylinder in both strands. The second schematic shows two lines of cylinders with M e 3 on every other cylinder and the other cylinders are labeled H 3 K 9 H M T. Then an arrow to the right is labeled methylation. The two new strands are each four cylinders long and all cylinders have M e 3 on them. Epigenetic Control by Polycomb and Trithorax Complexes A critical type of epigenetic mark found in multicellular animals and plants involves a set of proteins known collectively as Polycomb and a counteracting set of proteins known as Trithorax. These names were derived from the phenotypes of mutations in the genes encoding these proteins in Drosophila, in which they were first discovered. Polycomb is essential for maintaining the repression of genes in specific types of cells, and in all of the cells that descend from them, throughout the life of an organism. Important genes that are repressed by Polycomb proteins include the Hox genes, which encode master regulatory transcription factors. Different combinations of Hox transcription factors help to direct the development of specific tissues and organs in a developing embryo. Early in embryogenesis, expression of Hox genes is controlled by typical activator and repressor proteins. However, the expression of these activators and repressors stops at an early point in embryogenesis. Correct
expression of Hox genes in the descendants of early embryonic cells is maintained for the remainder of embryogenesis and into adult life by Polycomb and Trithorax proteins. Polycomb proteins maintain the repression of specific Hox genes in all cells that descend from early embryonic cells where the Hox gene was repressed in the early embryo. Trithorax proteins perform the opposite function; they maintain the expression of Hox genes in the descendants of early embryonic cells that expressed the Hox gene. Polycomb and Trithorax proteins control thousands of genes, including genes that regulate cell growth and division. Polycomb and Trithorax genes are often mutated in cancer cells, contributing to the abnormal properties of these cells (see Chapter 25). Remarkably, virtually all cells in the developing embryo and adult express a similar set of Polycomb and Trithorax proteins, and all cells contain the same set of Hox genes. Yet only the Hox genes in descendants of cells where they were initially repressed in early embryogenesis remain repressed, even though the same Hox genes in other cells in a neighboring region of the embryo remain active in the presence of the same Polycomb proteins. Consequently, as in the case of the yeast silent mating-type loci (see Section 8.4), the expression of Hox genes is regulated by a process that involves more than specific DNA sequences interacting with proteins that diffuse through the nucleoplasm. A current model for repression by Polycomb proteins is depicted in Figure 8-48. Most Polycomb proteins are subunits of one of two classes of multiprotein Polycomb repressive complexes: PRC1 and PRC2. The PRC2 complexes are thought to act initially by associating with the repression
domains of specific repressors bound to their cognate DNA sequences early in embryogenesis, or with ribonucleoprotein complexes containing long noncoding RNAs, which will be discussed in the next section. The PRC2 complexes contain histone deacetylases that inhibit transcription. They also contain a subunit [E(z) in Drosophila, EZH2 in mammals] with a SET domain, which is the catalytic domain of several histone methyl transferases. The SET domain in PRC2 methylates histone H3 on lysine 27, generating di- and trimethyl lysines (H3K27me2 and H3K27me3). A PRC1 complex then binds the nucleosomes with H3K27me2 and 3 through dimeric Pc subunits (CBXs in mammals), each containing a methyl lysine–binding chromodomain specific for methylated H3 lysine 27. It has been proposed that binding of the dimeric Pc to neighboring nucleosomes condenses the chromatin into a structure that inhibits transcription. This proposal is supported by electron microscopy studies showing that PRC1 complexes cause nucleosomes to associate in vitro (see Figure 8-48d, e).
FIGURE 8-48 Model for repression by Polycomb complexes. (a) During early embryogenesis, repressors associate with the PRC2 complex. (b) This association results in methylation (Me) of neighboring nucleosomes on histone H3 lysine 27 (K27) by the SET domain–containing subunit E(z). (c) The PRC1 complex binds nucleosomes methylated at H3 lysine 27 through a dimeric, chromodomain-containing subunit Pc. The PRC1 complex condenses the chromatin into a repressed chromatin structure. PRC2 complexes associate with PRC1 complexes to maintain H3 lysine 27 methylation of neighboring histones. As a consequence, PRC1 and PRC2 association with the region is maintained when expression of the repressor proteins in (a) ceases. (d, e) Electron micrograph of a 1-kb fragment of DNA bound by four nucleosomes in the absence (d) and presence (e) of one PRC1 complex per five nucleosomes. See A. H. Lund and M. van Lohuizen, 2004, Curr. Opin. Cell Biol. 16:239; and N. J. Francis, R. E. Kingston, and C. L. Woodcock, 2004, Science 306:1574. [Part (d)–(e) Republished with permission from AAAS, from N. J. Francis et al., 2004, “Chromatin Compaction by a Polycomb Group Protein Complex, “ Science 306(5701):1574–1577; permission conveyed through Copyright Clearance Center, Inc.] Description (a) A schematic illustration shows a D N A strand with P R C 2 labeled at the top and a repressor depicted as a blue oval labeled near the beginning of the strand. All cylinders are labeled K 27. An arrow goes to the right to (b) The same illustration but the cylinders now are labeled K 27 M e. Another arrow to the right goes to (c) The cylinders are lined tightly together with a green bar shape on top and bottom and labeled P R C 1 complex. The P R C 1 complexes are connected using the M e from the cylinders. (d) A microphoto in black and white labeled nucleosomes in D N A. There are four little white blobs in a curved row. (e) Two photos are labeled: nucleosomes plus P R C 1 complex on D N A. The little blobs are now gathered into a pile. PRC1 complexes also repress transcription through additional mechanisms. The PRC1 complex contains a ubiquitin ligase that monoubiquitinylates histone H2A at lysine 119 in the H2A C-terminal tail (see Figure 7-26b). This modification of H2A blocks elongation by
inhibiting a histone chaperone that removes histone octamers from DNA as Pol II transcribes through a nucleosome and then replaces them as the polymerase passes. PRC1 also associates with a histone demethylase that specifically removes methyl groups from lysine 4 of histone H3, an activating mark discussed below with Trithorax proteins. PRC2 complexes associate with nucleosomes bearing the histone H3K27me3 mark, maintaining methylation of H3 lysine 27 in nucleosomes in the region. This methylation results in association of chromatin with PRC1 and PRC2 complexes even after expression of the initial repressor proteins shown in Figure 8-48a, b has ceased. This association maintains H3 lysine 27 methylation by a mechanism analogous to that diagrammed in Figure 8-47. This mechanism is a key feature of Polycomb repression, which is maintained through successive cell divisions for the life of an organism ( years for some vertebrates and 5000 years for a bristle cone pine!). Trithorax proteins counteract the repression mechanism of Polycomb proteins, as shown in studies of expression of the Hox transcription factor Abd-B in the Drosophila embryo (Figure 8-49). Abd-B is normally expressed only in posterior segments of the developing embryo. When the Polycomb system is defective, Abd-B is expressed in all cells of the embryo. When the Trithorax system is defective and cannot counteract repression by the Polycomb system, Abd-B is repressed in most cells, except those in the very posterior of the embryo. Trithorax complexes include a histone methyl transferase that trimethylates histone H3 lysine 4, a histone methylation that is associated with the promoters of actively
transcribed genes. This histone modification creates a binding site for histone acetylase and for chromatin-remodeling complexes that promote transcription, as well as for TFIID, the general transcription factor that initiates preinitiation-complex assembly (see Figure 8-13). Nucleosomes with H3 lysine 4 methylation are also binding sites for specific histone demethylases that remove H3 histone lysine 9 and lysine 27 methylation, preventing the binding of HP1 and the Polycomb repressive complexes. Nucleosomes marked with H3 lysine 4 methylation are also thought to be distributed to both daughter DNA molecules during DNA replication, resulting in maintenance of this epigenetic mark by a strategy similar to that diagrammed in Figure 8-47.
FIGURE 8-49 Opposing influence of Polycomb and Trithorax complexes on expression of the Hox transcription factor Abd-B in Drosophila embryos. At the stage of Drosophila embryogenesis shown, Abd-B is normally expressed only in posterior segments of the developing embryo, as shown at the top (wt) by immunostaining with a specific anti–Abd-B antibody. In embryos with homozygous mutations of Scm, a Polycomb gene (PcG) encoding a protein associated with the PRC1 complex, Abd-B expression is derepressed in all embryo segments. In contrast, in homozygous mutants of trx, a Trithorax gene (trxG),
Long Noncoding RNAs Direct Epigenetic Repression in Metazoans
Abd-B repression is increased so that the protein is expressed at high concentrations only in the most posterior segment. [Republished with permission from John Wiley & Sons — Books, from T. Klymenko and J. Muller, 2004, “The Histone Methyltransferases Trithorax and Ash1 Prevent Transcriptional Silencing by Polycomb Group Proteins,” EMBO Rep. 5(4):373–377; permission conveyed through Copyright Clearance Center, Inc.] Description The embryo is depicted as an oval. Anterior and posterior parts of the embryo are marked on the left and the right sides of the image, respectively. Immunostaining shows expression of the A b d-B protein. In the image labeled w t, a dark color, indicating staining, is only present in the posterior. In the image labeled S C M minus (p c g), the staining is present throughout the whole embryo. In the image labeled t r x minus, the staining is localized to the posterior portion, and the staining is much smaller than that seen in w t. Long Noncoding RNAs Direct Epigenetic Repression in Metazoans Complexes have been discovered that are composed of multiple proteins that function to repress transcription bound to long RNAs. These RNAs, which can be many kilobases in length, lack long open reading frames and are consequently called long noncoding RNAs or lncRNAs. In some cases, these lncRNA-protein complexes repress genes on the same chromosome from which the RNA is transcribed, as in the case of Xchromosome inactivation in female mammals. In other cases, these RNAprotein complexes act in trans, repressing genes on chromosomes other than those from which the lncRNA is transcribed.
X-Chromosome Inactivation in Mammals X-chromosome inactivation in female mammals (see Chapter 7) is one of the most intensely studied examples of epigenetic repression mediated by a lncRNA. X inactivation is controlled by an -kb domain on the X chromosome called the X-inactivation center. Remarkably, this region encodes several lncRNAs required for the random inactivation of one entire X chromosome early in the development of female mammals. The functions of these lncRNAs are only partially understood. Some are transcribed from complementary DNA strands near the middle of the Xinactivation center: the 40-kb Tsix lncRNA and the Xist RNA. The latter is spliced and polyadenylated into an RNA of about 17 kb that remains in the nucleus (Figure 8-50a).
EXPERIMENTAL FIGURE 8-50 The Xist long noncoding RNA encoded in the X- inactivation center coats the inactive X chromosome in cells of mammalian females, repressing transcription of most genes on the inactive X. (a) The region of the human X- inactivation center encoding the noncoding RNAs Xist (transcribed from the inactive X), and Tsix (transcribed from the active X). Numbers are bp from the left end of the X- chromosome. (b) A cultured fibroblast from a human female was analyzed by in situ hybridization with a probe complementary to Xist RNA labeled with a red fluorescent dye (left), a chromosome paint set of probes for the X chromosome labeled with a green fluorescent dye (center), and an overlay of the two fluorescent micrographs. The condensed inactive X chromosome is associated with Xist RNA. (c) Model for the spreading of the Xist lncRNA-protein complex on the inactive X chromosome during early differentiation of female embryonic stem cells. See E. Heard and A.-V. Gendrel, 2014, Annu. Rev. Cell Dev. Biol. 30:561. (d) Proteins associated with Xist lncRNA. Question marks indicate that it is not yet known how PRC2 complexes (yellow) associate with HDAC3 and the RNA-binding protein SHARP although this might be due to formation of transcriptional condensates. See C. A. McHugh et al., 2015, Nature 521:232. [Part (b) C. M. Clemson et al., 1996, J. Cell Biol. 132(3):259–275. https://doi.org/10.1083/jcb.132.3.259.] Description (a) Two bar diagrams. The one on top shows a green rectangle labeled T S I X moving toward the right. The one at the bottom shows a red rectangle labeled X I S T moving toward the left . (b) Three fluorescence images of a female human fibroblast. The first shows a small red spot, in the upper right of the cell. The second shows a green color throughout the cell with two bright spots at the upper right and lower right of the cell. The third image shows an overlay. The upper right spot is yellow. (c )A schematic shows the interaction of X I S T with sites on the female X chromosome . When folded, the interactions sites in the linear D N A sequence are spatially close. (d) A schematic shows the interaction between Xist, which is tethered to H N R N P U/S A F-A, and proteins. S M R T, S H A R P, H D A C 3 interact. This cluster is linked to a cluster of four proteins, R B A P 48, S U Z 12, E E D, and E Z H 2, by question marks.
In differentiated female cells, the inactive X chromosome is associated with 50–100 multimolecular Xist RNA-protein complexes dispersed along most of the length of the X-chromosome (Figure 8-50b, c). Proteins associated with these complexes include co-repressors and their associated histone deacetylase complexes, repressive chromatin remodeling complexes and polycomb complexes discussed earlier (Figure 8-48). These proteins are thought to associate through multiple weak interactions between their intrinsically disordered regions forming a repressive transcriptional condensate by the same principles discussed earlier for the formation of activating transcriptional condensates (see Figure 8-48). These repressive transcriptional condensates scattered along the Xchromosome are thought to condense the inactive X-chromosome into a chromatin structure that inhibits transcription. Targeted deletion of the Xist gene in cultured embryonic stem cells showed that it is required for X inactivation. Unlike most protein-coding genes on the inactive X chromosome, the Xist gene is actively transcribed. The Xist RNA-protein complexes do not diffuse to interact with the active X or other chromosomes, but remain associated with the inactive X chromosome. In contrast to Xist, Tsix is transcribed from the active X chromosome, not from the inactive X chromosome. In the early female embryo, made up of embryonic stem cells capable of differentiating into all cell types (see Chapter 22), genes on both X chromosomes are transcribed, and the 40-kb Tsix lncRNA (Figure 8-50a) is transcribed from both copies of the X chromosome. Experiments employing engineered deletions in the X-inactivation center showed that Tsix transcription prevents significant transcription of the Xist RNA from
the complementary DNA strand. Later in development, as cells begin to differentiate, Tsix transcription is repressed on one of the X chromosomes. This repression occurs randomly in different cells on either of the X chromosomes. This inhibition of Tsix transcription determines which of the X chromosomes will be inactivated as the cells differentiate further, because inhibition of Tsix transcription allows transcription of Xist lncRNA to occur on that chromosome. Recent studies indicate that Xist lncRNA-protein complexes first associate with regions of the X chromosome localized near the X-inactivation center in the three-dimensional, folded structure of the future inactive X (Figure 8-50c), as shown by chromosome conformation capture assays (see Figure 7-30). These initial sites of Xist association are in gene-rich regions of the X chromosome and are postulated to serve as entry sites where additional copies of the Xist lncRNA-protein complexes first bind and then spread to neighboring regions. The mechanism of spreading is not currently understood. The inactive X chromosome also becomes associated with PRC2 complexes, which catalyze the trimethylation of histone H3 lysine 27. This methylation results in association of the PRC1 complex and transcriptional repression, as discussed in the previous section. These mechanisms of transcriptional repression must be redundant, however, because repression still occurs in the absence of the Polycomb proteins essential for the assembly of PRC1 and PRC2. At the same time, transcription of Tsix continues from the active X chromosome, which is associated with repression of Xist transcription from that X chromosome, and consequently prevents Xist-mediated repression of the active X. Xist and PRC1 and 2 complexes are then observed to associate with gene-poor
regions of the inactive X chromosome as well as with gene-rich regions, silencing genes on the inactive X chromosome. Xist RNA-protein complexes were isolated from cultured mouse embryonic stem cells undergoing the initiation phase of X inactivation. This was done by hybridizing several biotinylated oligonucleotides complementary to regions of Xist to nuclear extracts prepared from these cells, and then binding to a column with covalently bound streptavidin, a bacterial protein with very high affinity for biotin. Proteins eluted from this affinity column were analyzed by mass spectrometry (see Chapter 3) to identify proteins associated with Xist lncRNA as diagrammed in Figure 8-50d. Thus the Xist RNA is postulated to function as a large molecular scaffold for the assembly of a multiprotein complex. One of the proteins identified in the complex was SMRT, a co-repressor of the thyroid hormone nuclear receptor. During X inactivation, SMRT also interacts with the histone deacetylase HDAC3. Subsequent knockdown experiments with siRNAs directed against SMRT and HDAC3 showed that they are required for X inactivation, as are other RNA and chromatin-binding proteins, such as SHARP, that link SMRT to Xist RNA (Figure 8-50d). These proteins are also required for the association of Xist RNA with the inactive X chromosome. These studies of Xist have led to the suggestion that other stable lncRNAs may function similarly as scaffolds for the assembly of other multiprotein-RNA complexes. Shortly after X inactivation by histone deacetylation and polycomb complexes, the DNA of the inactive X chromosome becomes methylated at most of its CpG island promoters. In addition, specialized histone
octamers in which histone H2A is replaced by a paralog of H2A called macroH2A also associate with the inactive X chromosome. DNA methylation and macroH2A contribute to the stable repression of the inactive X chromosome throughout embryogenesis and adult life. Cis Activation by Long Noncoding RNAs Examples of lncRNAs involved in gene activation have been characterized recently. For example, HOTTIP lncRNA, which is transcribed from the end of the HOXA locus, is proposed to coordinate the activation of HOXA genes by binding to a histone H3 lysine 4 methylase. In addition, nascent transcripts of lncRNA genes have been reported to activate transcription from promoters several kilobases away by interacting with the Mediator complex and delivering it to the promoter by looping of the intervening chromatin. In humans, but not in mice, the lncRNA called XACT associates with multiple sites along the entire length of the active X chromosome. XACT may contribute to maintenance of gene activity on that chromosome. XACT is also remarkable for being one of the longest characterized RNAs: 252 kb! It is mostly unspliced. In Drosophila, equal expression of genes encoded on the X chromosome in males and females (dosage compensation) does not result from inactivating one X chromosome in females. Rather, a generalized twofold increase in transcriptional activation of genes on the single X chromosome in males is controlled by two lncRNAs, roX1 and roX2, transcribed from
the X chromosome only in males. The roX1 and roX2 RNAs associate with several proteins encoded by MSL (male-specific-lethal) genes and spread over the X chromosome specifically, much as Xist lncRNA-protein complexes spread over the inactive X in mammals. Recently, sequencing of total cellular RNA in multiple types of human cells identified roughly 15,000 human lncRNAs. Many of these lncRNAs have sequences that are evolutionarily conserved in most mammals, while about 5000 are found only in primates. This conservation of sequence strongly suggests that these lncRNAs, like Xist, have important functions. Many lncRNAs are expressed only in specific cell types at specific times during development. For example, multiple lncRNAs are expressed primarily in differentiating red blood cells. Knockdown (see Figure 6-41 and Chapter 9) of several of these lncRNAs inhibits normal red blood cell development, but precisely how these lncRNAs perform their essential functions is not yet clear. The study of these conserved long noncoding RNAs and how they influence gene expression is another area of intense current investigation. ENCODE (Encyclopedia of DNA Elements) encompasses a consortium of international research groups organized and funded by the US National Human Genome Research Institute with the goal of building a comprehensive, publicly available database of functional elements in the human genome
These elements include DNA control elements and the transcription factors that bind to them, histone post-translational modifications mapped by chromatin immunoprecipitation/next-gen sequencing (ChIP-seq) and related methods, DNase I hypersensitive sites, and regulatory lncRNAs and their sites of association in the genome, as well as newly discovered regulatory elements that control cells and circumstances in which a gene is active. Data sets from human cells and cells of model organisms that are too large to be published are also made publicly available at a site called GEO (Gene Expression Omnibus) maintained by the US National Center for Bioinformatics (NCBI). Most journals that publish research based on genomic methods such as RNA-seq and ChIP-seq require that authors upload their original data to GEO. Worldwide public access to these data sets is greatly accelerating the pace of discovery in the area of gene regulation. KEY CONCEPTS OF SECTION 8.6 Epigenetic Regulation of Transcription Epigenetic control of transcription refers to repression or activation that is maintained after cells replicate as the result of DNA methylation or post-translational modification of histones, especially histone methylation. Methylation of CpG sequences in CpG island promoters in mammals generates binding sites for a family of methyl-binding proteins (MBDs) that associate with histone deacetylases, inducing hypoacetylation of the promoter regions and transcriptional repression. Histone H3 lysine 9 di- and trimethylation creates binding sites for the heterochromatin-associated protein HP1, which results in condensation of chromatin and transcriptional repression. These post-translational modifications are perpetuated following chromosome replication because the methylated histones randomly associate with the daughter DNA molecules and associate with histone H3 lysine 9
methyl transferases that methylate histone 3 lysine 9 on newly synthesized histone octamers assembled on the daughter DNA. Polycomb complexes maintain repression of genes initially repressed by sequencespecific repressors expressed early during embryogenesis. One class of Polycomb complexes, PRC2 complexes, associates with these repressors in early embryonic cells, resulting in methylation of histone H3 lysine 27. This methylation creates binding sites for subunits in the PRC2 complex as well as for PRC1 complexes, which condense chromatin, inhibit the assembly of preinitiation complexes, and inhibit elongation. Since parent histone octamers with H3 methylated at lysine 27 are distributed to both daughter DNA molecules following DNA replication, PRC2 complexes that associate with these nucleosomes maintain histone H3 lysine 27 methylation through cell division. Trithorax complexes oppose repression by Polycomb complexes by methylating H3 at lysine 4 and maintaining this activating mark through chromosome replication. X-chromosome inactivation in female mammals requires a long noncoding RNA (lncRNA) called Xist that is transcribed from the X-inactivation center of one X chromosome and then spreads along the length of the same chromosome. Xist interacts with a co-repressor that binds a histone deacetylase and PRC2 complexes at an early stage of embryogenesis, initiating X inactivation. X inactivation is maintained throughout the remainder of embryogenesis and adult life by continued association with Polycomb complexes and DNA methylation of CpG island promoters on the inactive X. Some lncRNAs cause repression of genes in trans (i.e., on other chromosomes), as opposed to the cis inactivation imposed by Xist. Repression is initiated by their interaction with PRC2 complexes. Some lncRNAs are associated with gene activation. Much remains to be learned about how lncRNAs are targeted to specific chromosomal regions, but the discovery of about 15,000 nuclear lncRNAs expressed in various human cells during specific stages of their differentiation suggests that lncRNAs are central to widely used mechanisms of transcription regulation.
Transcription Initiation by Pol I and Pol III Is Analogous to That by Pol II
8.7 Other Eukaryotic Transcription Systems We conclude this chapter with a brief discussion of transcription initiation by the other two eukaryotic nuclear RNA polymerases, Pol I and Pol III. Although these systems, and particularly their regulation, are less thoroughly understood than transcription by RNA polymerase II, they are equally fundamental to the life of eukaryotic cells. The polymerases that transcribe mitochondrial and chloroplast DNA will be discussed in
Chapter 12. Transcription Initiation by Pol I and Pol III Is Analogous to That by Pol II The formation of transcription initiation complexes involving Pol I and Pol III is similar in some respects to assembly of Pol II initiation complexes (see Figure 8-13). However, each of the three eukaryotic nuclear RNA polymerases requires its own polymerase-specific general transcription factors and each recognizes different DNA control elements. Moreover, neither Pol I nor Pol III requires ATP hydrolysis by a DNA helicase to help melt the DNA template strands to initiate transcription, whereas Pol II does. As we discuss in Chapter 21, transcription initiation by Pol I, which synthesizes pre-rRNA, and by Pol III, which synthesizes
tRNAs, 5S rRNA, and other small stable RNAs (see Table 8-1), is tightly coupled to the rate of cell growth and proliferation. Initiation by Pol I The regulatory elements directing Pol I initiation are similarly located relative to the transcription start site in yeast and in mammals. A core element spanning the transcription start site from −40 to +5 is essential for Pol I transcription. An additional upstream control element extending from roughly −155 to −60 increases in vitro Pol I transcription tenfold. In humans, assembly of the Pol I preinitiation complex (Figure 8-51) is initiated by the cooperative binding of UBF (upstream binding factor) and SL1 (selectivity factor), a multisubunit factor containing TBP and four Pol I–specific TBP-associated factors ( ), to the Pol I promoter region. The subunits interact directly with Pol I–specific subunits, directing this specific nuclear RNA polymerase to the transcription start site. TIF1A, the mammalian homolog of S. cerevisiae RRN3, is another required factor, as are the abundant nuclear protein kinase CK2 (casein kinase 2), nuclear actin, nuclear myosin, the protein deacetylase SIRT7, and topoisomerase I, which prevents DNA supercoils (see Figure 5-8) from forming during rapid Pol I transcription of the 14-kb transcription unit.
FIGURE 8-51 Transcription of the rRNA precursor RNA by RNA polymerase I. Top: Electron micrograph of RNA-protein complexes transcribed from repeated rRNA genes. Middle: A single Pol I transcription unit. Enhancers that stimulate Pol I transcription from a single transcription start site are represented by blue boxes. Pol I transcription termination sites ( , ) bound by the Pol I–specific termination factor TTF-1 are shown as red rectangles. pRNA indicates transcription of the noncoding pRNA required for transcriptional silencing. The black arrow indicates the start site of the primary transcript. Regions of DNA shown as parallel black lines are contained in the primary transcript, but are removed and degraded during rRNA processing. Bottom: The core promoter element and upstream control element are shown with the location of Pol I and its general transcription factors UBF, SL1, and TIF-1A represented, as well as other proteins required for Pol I elongation and control.
Description Several gene enhancers are represented by blue boxes. The enhancers are followed by a transcription termination site and a T zero site. Following this, are the 18 S R N A coding region, the 5.8 S coding region, and the 28-S coding region. Following the final coding region, the transcription termination sites labeled one through ten are located. A red arrow at the start of the sequence indicates p R N A transcription. A black arrow after T-zero indicates the transcription start site. An enlarged schematic shows the gene region ranging from the T-zero transcription termination site to just before the 18-s R N A coding region. Several proteins interact with the D N A strand. General transcription factors T T F-1 interact with T-zero, U B F with U C E, T I F-1 A with S L 1, and polymerase 1 interacts with the core promoter element. Several addition proteins required for elongation and control are indicated, such as C K 2, S I R t 7, Topo 1, Actin, and N M 1. Transcription of the 14-kb precursor of 18S, 5.8S, and 28S rRNAs (see
Chapter 9) is regulated to coordinate ribosome synthesis with cell growth and division. This coordination is achieved in several ways: regulation of the activities of Pol I initiation factors by post-translational modifications, including phosphorylation and acetylation; control of the rate of Pol I elongation; and control of the number of rRNA genes that are transcriptionally active by epigenetic mechanisms that assemble inactive copies into heterochromatin. At active rRNA genes, transcription terminates at terminator sequencs and , , , … , positioned as shown in Figure 8-51. This nonsymmetrical sequence functions to terminate Pol I transcription only when it is in the correct orientation. The terminator sequences are bound by a termination factor that causes termination and Pol I release from the template.
Switching between the active and heterochromatic silent states of rRNA genes is accomplished by a multisubunit chromatin-remodeling complex called NoRC (No for nucleolus, the site of rRNA transcription within nuclei). NoRC localizes a nucleosome over the Pol I transcription start site, blocking preinitiation complex assembly. It also interacts with a DNA methyl transferase that methylates a critical CpG in the upstream control element, thus inhibiting binding by UBF. NoRC also interacts with histone deacetylases and with histone methyl transferases that di- and trimethylate histone H3 lysine 9, creating binding sites for heterochromatic HP1. Moreover, a roughly 250-nt noncoding RNA called pRNA (promoterassociated RNA) transcribed by Pol I from about 2 kb upstream of the rRNA transcription unit (red arrow in Figure 8-51) is bound by a subunit of NoRC and is required for transcriptional silencing by assembly of the gene into heterochromatin. The pRNA is believed to target NoRC to Pol I promoter regions by forming an RNA:DNA triplex with the terminator sequence. This creates a binding site for the DNA methyl transferase DNMT3b, which methylates the critical CpG in the upstream promoter element. Initiation by Pol III Unlike promoters for protein-coding genes and pre-rRNA genes, the promoter regions of tRNA and 5S-rRNA genes lie entirely within the transcribed sequence (Figure 8-52a, b). Two such internal promoter elements, termed the A box and the B box, are present in all tRNA genes. These highly conserved sequences not only function as promoters but also encode two invariant portions of eukaryotic tRNAs that are required for
protein synthesis. In 5S-rRNA genes, a single internal control region, the C box, acts as a promoter.
FIGURE 8-52 Transcription-control elements in genes transcribed by RNA polymerase III. Both tRNA (a) and 5S-rRNA (b) genes contain internal promoter elements (yellow)
located downstream from the start site and named A, B, and C boxes, as indicated. Assembly of transcription initiation complexes on these genes begins with the binding of Pol III–specific general transcription factors TFIIIA, TFIIIB, and TFIIIC to these control elements. Green arrows indicate strong, sequence-specific protein-DNA interactions. Blue arrows indicate interactions between general transcription factors. Purple arrows indicate interactions between general transcription factors and Pol III. (c) Transcription of the U6 snRNA gene in mammals is controlled by an upstream promoter with a TATA box bound by the TBP subunit of a specialized form of TFIIIB with an alternative BRF subunit and an upstream regulatory element called the PSE bound by a multisubunit factor called . See L. Schramm and N. Hernandez, 2002, Genes Dev. 16:2593. Description (a) A space filling 3-D model of a Pol 3 complex with R N A going through it. The Pol 3 is depicted as an orange circle. Inside of it is a green oval labeled T F I I I B and a purple extended oval labeled T F I I I C. Arrows show how R N A is to move through them. (b) An illustration shows a complex with a light blue oval inside the purple one labeled TRIIIA. (c) An illustration shows Pol 3, but not like the previously labeled ovals. A new blue oval is outside to the left of the Pol 3 and is labeled S N A P c with a yellow rectangle below labeled P S E. A green oval is attached to this and inside of the Pol 3 and this is labeled IIIB-Like and it has a yellow TATA box below it. Three general transcription factors are required for Pol III to initiate transcription of tRNA and 5S-rRNA genes in vitro. Two multimeric factors, TFIIIC and TFIIIB, participate in initiation at both tRNA and 5SrRNA promoters, while a third factor, TFIIIA, is required for initiation at 5S-rRNA promoters. As with assembly of Pol I and Pol II initiation complexes, the Pol III general transcription factors bind to promoter DNA in a defined sequence.
The N-terminal half of one TFIIIB subunit, called BRF (for TFIIB-related factor), is similar in sequence to TFIIB (a Pol II factor). This similarity suggests that BRF and TFIIB perform a similar function in initiation, namely, to assist in separating the template DNA strands at the transcription start site. Once TFIIIB has bound to either a tRNA or a 5SrRNA gene, Pol III can bind and initiate transcription in the presence of ribonucleoside triphosphates. The BRF subunit of TFIIIB interacts specifically with one of the polymerase subunits unique to Pol III, accounting for initiation by this specific nuclear RNA polymerase. Another of the three subunits composing TFIIIB is TBP, which we can now see is a component of a general transcription factor for all three eukaryotic nuclear RNA polymerases. The finding that TBP participates in transcription initiation by Pol I and Pol III was surprising, since the promoters recognized by these enzymes often do not contain TATA boxes. Nonetheless, in the case of Pol III transcription, the TBP subunit of TFIIIB interacts with DNA about 30 bp upstream of the transcription start site. The protein-DNA interaction is similar to the way TBP interacts with TATA boxes. Pol III also transcribes genes for small stable RNAs with upstream promoters containing a TATA box. One example is the gene for U6 snRNA, which is involved in pre-mRNA splicing (see Chapter 9). In mammals, this gene contains an upstream promoter element called the PSE in addition to the TATA box (Figure 8-52c). The PSE is bound by a multisubunit complex called , while the TATA box is bound by the
TBP subunit of a specialized form of TFIIIB containing an alternative BRF subunit. MAF1 is a specific inhibitor of Pol III transcription that functions by interacting with the BRF subunit of TFIIIB and with Pol III. Its function is regulated by controlling its import from the cytoplasm into the nucleus. MAF1 transport into the nucleus is activated by phosphorylations of MAF1 in response to the mTORC1 protein kinase that responds to cell stress and nutrient deprivation (see Chapters 16 and 25). In mammals, Pol III transcription is also repressed by the tumor suppressors p53 and the retinoblastoma (Rb) family of proteins. In humans, there are two genes encoding the Pol III subunit RPC32. One of these is expressed specifically in replicating cells, and its forced expression can contribute to oncogenic transformation of cultured human fibroblasts, suggesting that altered regulation of transcription by Pol III with this subunit is oncogenic. KEY CONCEPTS OF SECTION 8.7 Other Eukaryotic Transcription Systems The process of transcription initiation by Pol I and Pol III is similar to that by Pol II but requires different general transcription factors, is directed by different promoter elements, and does not require hydrolysis of ATP β-γ phosphodiester bonds to separate the DNA strands at the start site as Pol II transcription does. Pol I transcribes only a single RNA, the 45S precursor of 18S, 5.8S, and 28S rRNA, from multiple copies of the pre-rRNA gene. Pol III transcribes tRNAs from promoters within the genes that encode the tRNA regions common to all tRNAs. This internal promoter is bound by transcription factor TFIIIC, which in turn binds TFIIIB, a multisubunit factor that includes the TATA box– binding protein, TBP, which associates with the tRNA gene about 30 bp upstream of the transcription start site.
Pol III transcribes 5s rRNA directed by a promoter within the 5S-rRNA coding region that is bound by transcription factor TFIIIA. TFIIIA then associates with TFIIIC and TFIIIB, which interact with Pol III in a manner similar to their interactions in tRNA transcription. Additional small stable RNAs, several with as yet unknown functions, are transcribed by Pol III as directed by TBP-containing transcription factors that bind immediately upstream of the genes (see Figure 8-52). Pol III transcription is regulated by a specific inhibitor, MAF1, whose transport from the cytoplasm into the nucleus is controlled in response to nutrient availability.
Key Terms
End of Chapter Visit Achieve to access study tools and to learn more about the content in this chapter. Perspectives for the Future Analyze the Data 8-1: Coordination of Eukaryotic Polymerases Chapter References Additional study tools, including videos, animations, and quizzes Key Terms activation domain activator basic helix-loop-helix (bHLH) bromodomain carboxy-terminal domain (CTD) chromatin chromatin immunoprecipitation chromatin-mediated repression co-activator constitutive co-repressor CpG island DNA-binding domain DNase I footprinting
downstream electrophoretic mobility shift assay (EMSA) elongation enhanceosome enhancer epigenetics euchromatin gene control heat-shock gene helicase heterochromatin histone deacetylation homeodomain initiation initiator leucine zipper long noncoding RNA (lncRNA) Mediator nuclear receptor nucleosome promoter promoter-proximal element reporter gene repression domain repressor RNA polymerase II silencer sequence SWI/SNF chromatin- remodeling complex
Review the Concepts
Tat TATA box TATA box–binding protein (TBP) termination transcription-control region transcription factor upstream upstream activating sequence (UAS) zinc finger Review the Concepts 1. What types of genes are transcribed by RNA polymerases I, II, and III? Design an experiment to determine whether a specific gene is transcribed by RNA polymerase II. 2. The CTD of the largest subunit of RNA polymerase II can be phosphorylated at multiple serine residues. What are the conditions that lead to the phosphorylated versus nonphosphorylated RNA polymerase II CTD? 3. What do TATA boxes, initiators, and CpG islands have in common? Which was the first of these to be identified? Why? 4. Describe the methods used to identify the location of transcription-control elements in promoter-proximal regions of genes. 5. What is the difference between a promoter-proximal element and a distal enhancer? What are the similarities?
6. Describe the methods used to identify the location of DNAbinding proteins in the regulatory regions of genes. 7. Describe the structural features of transcription activator and repressor proteins. 8. Give two examples of how gene expression may be repressed without altering the coding sequence. 9. Using CREB and nuclear receptors as examples, compare and contrast the structural changes that take place when these transcription factors bind to their co-activators. 10. What general transcription factors associate with an RNA polymerase II promoter in addition to the polymerase? In what order do they bind in vitro? What structural change occurs in the DNA when an “open” transcription initiation complex is formed? 11. Expression of recombinant proteins in yeast is an important tool for biotechnology companies that produce new drugs for human use. In an attempt to get a new gene X expressed in yeast, a researcher has integrated gene X into the yeast genome near a telomere. Will this strategy result in good expression of gene X? Why or why not? Would the outcome of this experiment differ if the experiment had been performed in a yeast line containing mutations in the H3 or H4 histone tails? 12. You have isolated a new protein called STICKY. You can predict from comparisons with other known proteins that STICKY contains a bHLH domain and a Sin3-interacting domain. Predict the function of STICKY and explain the importance of these domains in STICKY function.
13. Lower eukaryotes such as yeast have transcription-control elements called upstream activating sequences. What are the comparable sequences found in higher eukaryotic species? 14. You are curious to identify the region of the gene X sequence that serves as an enhancer for gene expression. Design an experiment to investigate this issue. 15. Some organisms have mechanisms in place that will override transcription termination. One such mechanism using the Tat protein is employed by the HIV retrovirus. Explain why Tat is therefore a good target for HIV vaccination. 16. Upon identification of the DNA-regulatory sequence responsible for translating a given gene, you note that it is enriched with CG sequences. Is the corresponding gene likely to be a highly expressed transcript? 17. Name four major classes of DNA-binding proteins that are responsible for controlling transcription, and describe their structural features.