Introduction
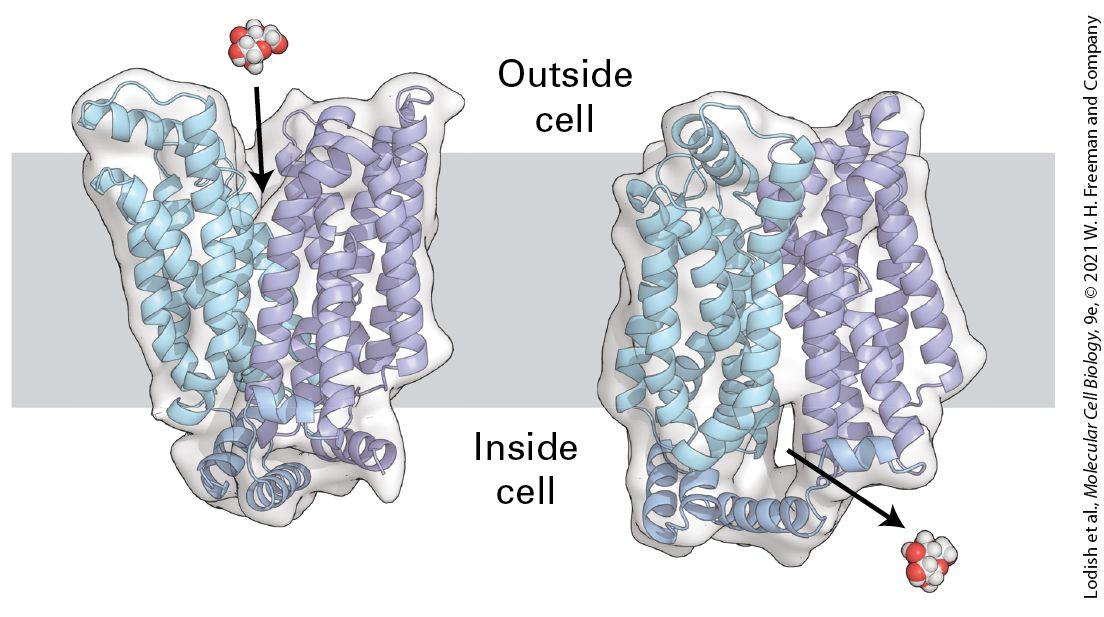
Chapter 11 Transmembrane Transport of Ions and Small Molecules Transmembrane, side view of the human glucose transporter GLUT1. Like other glucose transporters, GLUT1 transports glucose across the cell’s plasma membrane by alternating between an outward-facing and an inward-facing state. In the outward-facing state, a molecule of glucose binds to GLUT1. Glucose binding changes the conformation of the transporter such that it is now open to the inside of the cell, releasing glucose into the cytoplasm. [Data from D. Deng et al., 2014 Nature 510:121–125, PDB ID 4PYP.]
11.3 ATP-Powered Pumps and the Intracellular Ionic Environment
11.4 Nongated Ion Channels and the Resting Membrane Potential
11.6 Transcellular Transport In all cells, the plasma membrane forms the barrier that separates the cytoplasm from the exterior environment, thus defining a cell’s physical and chemical boundaries. By preventing the unimpeded movement of molecules and ions into and out of the cell, the plasma membrane maintains essential differences between the composition of the fluid inside the cell (the cytosol) and the fluid outside the cell (the extracellular fluid). For example, the concentration of sodium ion in the cytosol of animal cells is about 15 mM, while the concentration of sodium chloride (NaCl) in extracellular fluids, including blood, of animals is tenfold higher, about 150 mM. Conversely, the potassium ion concentration is tenfold higher in the cytosol of animal cells than in the extracellular fluid. As we describe in Section 11.4, these differences in the distribution of ions across the plasma membrane are critical to establishing and maintaining the membrane potential of the cell. Organelle membranes, which separate the cytosol from the interior of the organelle, also form permeability barriers. For example, the proton
concentration in the lysosome interior, pH 5, is about a hundredfold greater than that in the cytosol, and many specific metabolites accumulate at higher concentrations in the interior of other organelles, such as the endoplasmic reticulum or the Golgi complex, than in the cytosol. All cellular membranes, both plasma membranes and organelle membranes, consist of a bilayer of phospholipids in which other lipids and specific types of proteins are embedded. It is this combination of lipids and proteins that gives cellular membranes their distinctive permeability qualities. If cellular membranes were pure phospholipid bilayers (see
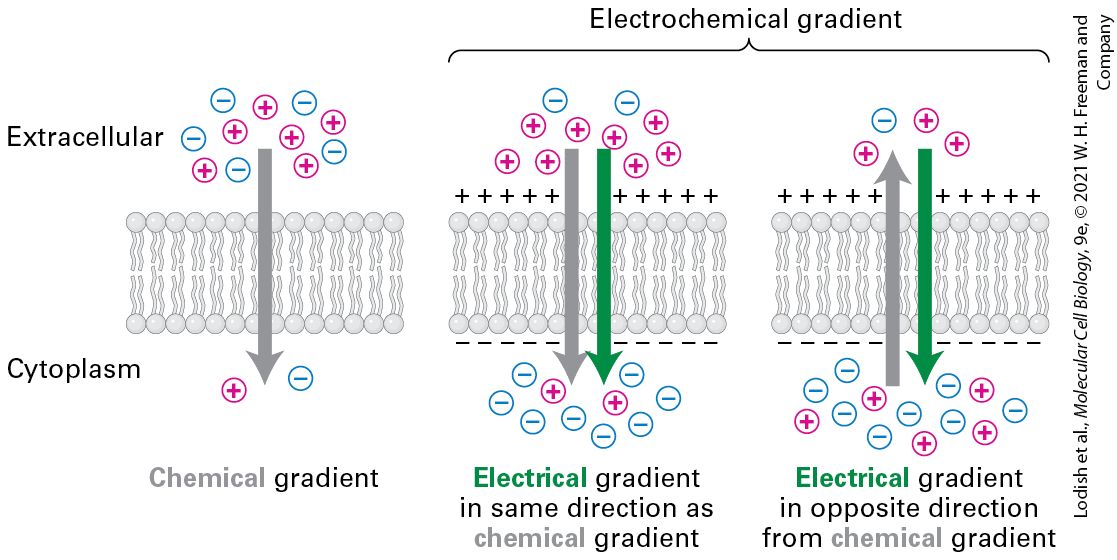
Figure 9-5), they would be excellent chemical barriers, impermeable to virtually all ions, amino acids, sugars, and other water-soluble molecules. In fact, only a few gases and small, uncharged, water-soluble molecules can readily diffuse across a pure phospholipid bilayer (Figure 11-1). Cellular membranes must serve not only as barriers but also as conduits, selectively transporting molecules and ions from one side of the membrane to the other. Energy-rich glucose, for example, must be imported into the cell, and wastes must be shipped out.
FIGURE 11-1 Relative permeability of a pure phospholipid bilayer to various molecules and ions. A pure phospholipid bilayer is permeable to many gases and to small, uncharged, water-soluble (polar) molecules. It is slightly permeable to water, and essentially impermeable to ions and to large polar molecules. Description The illustration shows five types of molecules listed on the left, examples listed in the center, and a schematic of a phospholipid membrane on the right along with arrows to show if the molecules are permeable through it. The first row shows gases, examples are C O subscript 2, N subscript 2, O subscript 2. These are all permeable. The second
row shows small-uncharged polar molecules, examples are ethanol, water, and urea. Ethanol is permeable and the other two are slightly permeable. The third row shows large uncharged polar molecules, examples are glucose and fructose, and all are impermeable. The fourth row shows ions, examples are K superscript plus, Mg superscript 2 plus, Ca superscript 2 plus, Cl superscript minus, H C O subscript 3 minus, H P O subscript 4 superscript 2 minus, and all are impermeable. The last row shows charged polar molecules, examples are amino acids, A T P, glucose 6 phosphate, proteins, nucleic acids, and all are impermeable. Movement of virtually all small molecules and ions across cellular membranes is mediated by membrane transport proteins — integral membrane proteins with multiple transmembrane domains embedded in cellular membranes. These membrane-spanning proteins act as shuttles, channels, or pumps for transporting molecules and ions through a membrane’s hydrophobic interior. In some cases, these proteins transport molecules or ions from a higher to a lower concentration, a thermodynamically favored process powered by an increase in entropy. Examples include the transport of water or glucose from the blood into most body cells. In other cases, a transport protein pumps molecules or ions from a lower to a higher concentration, a thermodynamically unfavorable process that can occur only when an external source of energy is available to push the molecules uphill against a concentration gradient. An example of such a process is the movement of protons into lysosomes to generate a low pH in the lumen. Often the required energy is provided by mechanistic coupling of the energy-releasing hydrolysis of ATP with the movement of a molecule or ion across the membrane. Other transport proteins couple the movement of one molecule or ion against its concentration gradient with the movement of another down its gradient,
using the energy released by the downhill movement of one molecule or ion to drive the uphill movement of another. Proper functioning of any cell relies on a precise balance between the import and export of various molecules and ions. We begin our discussion of membrane transport proteins by reviewing some of the general principles of transport across membranes and distinguishing among three major classes of such proteins. In subsequent sections, we describe the structure and operation of specific examples of each class and show how members of families of homologous transport proteins have different properties that enable different cell types to function appropriately. We also explain how specific combinations of transport proteins in both the plasma membrane and organelle membranes enable cells to carry out essential physiological processes, including the maintenance of cytosolic pH, the direction of the flow of water in both plant and animal cells, and the transport of sugar and amino acids into cells. The identification of many disease-causing mutations in membrane transporters underscores the importance of this class of molecules to human health. Mutations in these proteins cause a range of diseases, including cystic fibrosis and long QT syndrome (a potentially fatal form of cardiac arrhythmia) as well as specific forms of epilepsy, migraine, ataxia, polycystic kidney disease, and congenital hearing loss. As highlighted throughout this chapter, channels, transporters, and pumps are the targets of a growing number of therapeutic drugs. Recent advances in powerful new imaging technologies, such as cryo-electron microscopy
(cryo-EM, see Figure 4-34), have given rise to an explosion of discoveries about the structure and function of many of these membrane proteins. These discoveries in turn promise to lead to the development of new, lifesaving therapies. Our increased understanding of channel structure and function has also led to the development of heterologously expressed channels that can be activated by light (optogenetic) or drugs (chemogenetic). These have become powerful tools to control biochemical processes (described in Chapter 4) and neural circuits (described in
Chapter 23). Note that in this chapter we cover only transport of small molecules and ions; transport of larger molecules, such as proteins and oligosaccharides, is covered in Chapters 13 and 14.
Only Gases and Small Uncharged Molecules Cross Membranes by Simple Diffusion
11.1 Overview of Transmembrane Transport In this section, we briefly describe the factors that influence the permeability of lipid membranes to molecules, then briefly describe the three major classes of membrane transport proteins that allow molecules and ions to cross them. Different kinds of membrane-embedded proteins accomplish the task of moving molecules and ions in different ways. Only Gases and Small Uncharged Molecules Cross Membranes by Simple Diffusion With its dense hydrophobic core, a phospholipid bilayer is largely impermeable to water-soluble molecules and ions. Only gases, such as and , and small uncharged polar molecules, such as urea and ethanol, can readily move across an artificial membrane composed of pure phospholipid or of phospholipid and cholesterol (see Figure 11-1). Such molecules can also diffuse across cellular membranes without the aid of transport proteins. No metabolic energy is expended during simple diffusion because movement is from a high to a low concentration of the molecule, down its chemical concentration gradient. Such movements are spontaneous because they have a positive value (increase in entropy)
and thus a negative (decrease in free energy). The diffusion rate of any substance across a pure phospholipid bilayer is proportional to its concentration gradient across the bilayer and to its hydrophobicity and size. If a substance carries a net charge, its movement across a membrane is influenced by both its concentration gradient and the membrane potential, the electric potential (voltage) across the membrane. The combination of these two forces, called the electrochemical gradient, determines the energetically favorable direction of movement of a charged molecule across a membrane (Figure 11-2). The electric potential that exists across most cellular membranes results from a small imbalance in the concentrations of positively and negatively charged ions on the two sides of the membrane. In Section 11.4, we discuss how this ionic imbalance, and the resulting potential, arise and are maintained.
Three Main Classes of Membrane Proteins Transport Molecules and Ions Across Cellular Membranes
FIGURE 11-2 Electrochemical gradients. Ions form a chemical gradient when there is a concentration difference across the membrane. Ions also form an electrical gradient across the membrane, created by the asymmetric distribution of positively and negatively charged ions across the membrane. The electrical gradient can be in the same or opposite direction from the chemical gradient. Together, they form an electrochemical gradient that serves as a force driving the transport of ions across the membrane. Description The illustration shows three cell membranes along with the labels extracellular above and cytoplasm below the membrane. In the first membrane, a gray arrow represents the direction of the chemical gradient and points from extracellular to the cytoplasm. The chemical gradient shows 6 circles with plus signs, and 5 circles with minus signs outside the cell, and one plus and one minus sign inside the cell. The next two cell membranes show two types of electrochemical gradients. In each, the green arrow indicates the direction of the electrical gradient, and the gray arrow indicates a chemical gradient. In the second cell membrane, both arrows point into the cell. There are 8 plus and 2 minus circles outside the cell and 8 minus and 2 plus circles inside the cell. In the third cell membrane, the gray arrow points out of the cell and the green arrow points into the cell. There are 3 plus circles and 1 minus circle outside and 5 plus circles and 8 minus circles inside of the cell. Three Main Classes of Membrane Proteins Transport Molecules and Ions Across Cellular Membranes As is evident from Figure 11-1, very few molecules and no ions can cross a pure phospholipid bilayer at appreciable rates by simple diffusion. Thus transport of most molecules into and out of cells requires the assistance of specialized membrane proteins. Even in the cases of some small
uncharged polar molecules (e.g., urea, fatty acids) and certain gases, such as (carbon dioxide) and (ammonia), transport is frequently accelerated by specific proteins because simple diffusion is too slow to meet cellular needs. All membrane transport proteins are transmembrane proteins containing multiple membrane-spanning segments that are generally α helices. By forming a protein-lined pathway across the membrane, transport proteins are thought to allow hydrophilic substances to move through the membrane without coming into contact with its hydrophobic interior. Here we introduce the three main types of membrane transport proteins covered in this chapter (Figure 11-3).
FIGURE 11-3 Overview of membrane transport proteins. Gradients are indicated by triangles with the tip pointing toward lower concentration, electric potential, or both. 1 Channels permit movement of specific ions (or water) down their electrochemical gradient. 2 Transporters, which fall into three groups, facilitate movement of specific small molecules or ions. Uniporters transport a single type of molecule down its concentration gradient 2A . Cotransport proteins (symporters, 2B , and antiporters, 2C ) catalyze the movement of one molecule against its concentration gradient (black circles), driven by movement of one or more ions down an electrochemical gradient (red circles). 3 Pumps use the energy released by ATP hydrolysis to power movement of specific ions or small molecules (red circles) against their electrochemical gradient. Differences in the
mechanisms of transport by these three major classes of proteins account for their varying rates of solute movement. Description The illustration shows three classes of membrane transport proteins, the number of ions or molecules transported, and the direction of the concentration gradient, against or along the direction of transport indicated by triangles. 1. Ion channels (10 power 7 to 10 power 8 ions per second). The diagram shows the gate; open and closed. The ions are transported into the cell through the open gate. 2. Transporters (10 power 2 to 10 power 4 molecules per second). There are three examples of transporters. A. Uniporter moves molecules along a concentration gradient in one direction only. B. Symporter moves molecules into the cell against a concentration gradient, powered by transporting a second molecule in the same direction as the target molecule along the concentration gradient of the second molecule. C. Antiporter transports molecules against a concentration gradient, powered by moving molecules along a concentration gradient and can transport into and out of the cell. 3. A T P-powered pumps (10 power 0 to 10 power 3 ions per second). These transporters move ions from the cytosol to the exterior against a concentration gradient, powered by A T P. Channels transport water, specific ions, or small hydrophilic molecules across membranes down their concentration or electric potential gradients. Because this process requires transport proteins but not energy, it is sometimes referred to as passive transport or facilitated diffusion, but it is more properly called facilitated transport. Channels form a hydrophilic tube or passageway across the membrane through which multiple water molecules or ions move simultaneously, single file, at a very rapid rate. Some channels are open much of the time; they are referred to as nongated channels. Most ion channels, however, open only in response to specific chemical or electrical signals. These channels are referred to as gated channels because a protein “gate” alternatively blocks the channel or
moves out of the way to open the channel (see Figure 11-3). Like all transport proteins, channels are very selective for the type of molecule they transport. Transporters (also called carriers) move a wide variety of ions and molecules across cellular membranes, but at a much slower rate than channels. Three types of transporters have been identified. Uniporters transport a single type of molecule down its concentration gradient. Glucose and amino acids cross the plasma membrane into most mammalian cells with the aid of uniporters. Collectively, channels and uniporters are sometimes called facilitated transporters, indicating movement down a concentration or electrochemical gradient. In contrast, antiporters and symporters couple the movement of one type of ion or molecule against its concentration gradient with the movement of one or more different ions down its concentration gradient, in the same (symporter) or different (antiporter) directions. These proteins are often called cotransporters because of their ability to transport two or more different solutes simultaneously. ATP-powered pumps (or simply pumps) are ATPases, enzymes that catalyze hydrolysis of the terminal phosphoanhydride bond of ATP to produce ADP and Pi. These pumps use the energy of ATP hydrolysis to move ions or small molecules across a membrane against a chemical concentration gradient, an electric potential, or both. This process, referred to as active transport, is an example of a coupled chemical reaction (see
Chapter 2). In this case, transport of ions or small molecules uphill against
an electrochemical gradient, which requires energy, is coupled to the hydrolysis of ATP, which releases energy. The overall reaction — ATP hydrolysis and the uphill movement of ions or small molecules — is energetically favorable. Both cotransporters and pumps rely on coupled reactions in which an energetically unfavorable reaction (i.e., the uphill movement of one type of molecule or ion) is coupled to an energetically favorable reaction (i.e., the downhill movement of another). Note, however, that the nature of the energy-supplying reaction driving active transport by these two classes of proteins differs. ATP pumps use energy from hydrolysis of ATP, whereas cotransporters use the energy stored in an electrochemical gradient. The latter process is sometimes referred to as secondary active transport. Conformational changes are essential to the function of all transport proteins. Whereas channels switch between open and closed states, transporters and ATP-powered pumps undergo a cycle of conformational change exposing a binding site (or sites) to one side of the membrane in one conformation and to the other side in a second conformation, a process that has been termed the alternating access model. Determination of the high-resolution structures of transporters has revealed distinct molecular mechanisms by which alternating access is achieved. Because each cycle of conformational change within transporters and pumps results in the movement of only one substrate molecule (or, at most, a few), these proteins are characterized by relatively slow rates of transport, ranging from to ions or molecules per second (see Figure 11-3). In contrast, many ions can pass through an open channel without any further
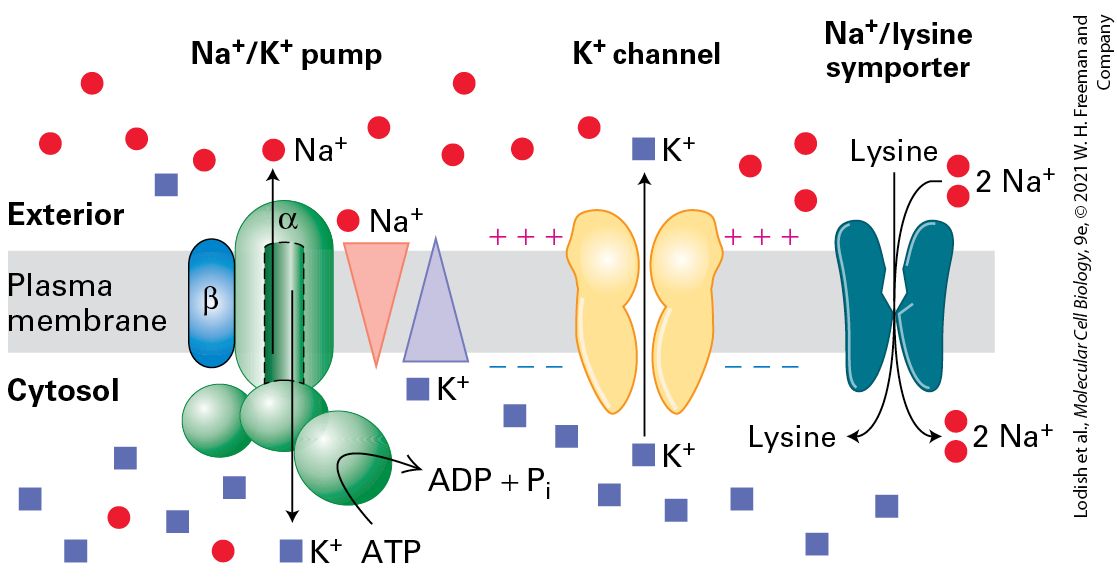
conformational change. For this reason, channels are characterized by very fast rates of transport, up to ions per second. Usually several different types of transport proteins work in concert within the plasma membrane of cells to achieve a physiological function. An example is seen in Figure 11-4, where an ATPase pumps out of the cell and inward; this pump, which is found in virtually all metazoan cells, establishes the oppositely directed concentration gradients of and ions across the plasma membrane (relatively high concentrations of inside and of outside cells). These concentration gradients are used, for example, to power the import of amino acids by cotransporters. The human genome encodes hundreds of different types of transport proteins that use the energy stored across the plasma membrane in the concentration gradient and its associated electric potential to transport a wide variety of molecules into cells against their concentration gradients.
FIGURE 11-4 Multiple membrane transport proteins function together in the plasma membrane of metazoan cells. Gradients are indicated by triangles with the tip pointing toward lower concentration. The ATPase in the plasma membrane uses energy released by ATP hydrolysis to pump (red circles) out of the cell and (blue squares) into the cell; its action creates a concentration gradient of that is greater outside the cell than inside, and one of that is greater inside than outside. Movement of positively charged ions out of the cell through membrane channels creates an electric potential across the plasma membrane — the cytosolic face is negative with respect to the extracellular face. A transporter, a typical sodium/amino acid cotransporter, moves two ions together with one lysine from the extracellular medium into the cell. “Uphill” movement of the amino acid is powered by “downhill” movement of ions, which in turn is powered both by the outside-greater-than-inside concentration gradient and by the negative charge on the inside of the plasma membrane, which attracts the positively charged ions. The ultimate source of the energy to power amino acid uptake comes from the ATP hydrolyzed by the ATPase, since this pump creates both the ion concentration gradient and, via the channels, the membrane potential, which together power the influx of ions. Description The illustration shows the sodium-potassium pump, potassium channel, and sodiumlysine symporter in the plasma membrane of metazoan cells. The sodium-potassium pump uses A T P to pump sodium against its concentration gradient to the exterior of the cell; at the same time, potassium is pumped into the cell against its concentration gradient. Meanwhile, potassium channels transport potassium to the exterior of the cell, along its concentration gradient. The sodium-lysine symporter pumps both lysine and two ions of sodium along the sodium concentration gradient into the cytosol.
Table 11-1 summarizes the four mechanisms by which small molecules and ions are transported across cellular membranes. In the next section, we consider some of the simplest membrane transport proteins, the uniporter
responsible for the transport of glucose and the channel responsible for the transport of water.
TABLE 11-1 • Mechanisms for Transporting Ions and Small Molecules Across Cellular Membranes Property Simple Diffusion Facilitated Transport Cotransport Active Transport Requires specific protein − + + + Solute transported against its gradient − − + + Coupled to ATP hydrolysis − − − + Driven by movement of a cotransported ion down its gradient − − + − Examples of molecules transported , , steroid hormones, many drugs Glucose and amino acids (uniporters); ions and water (channels) Glucose and amino acids (symporters); various ions and sucrose (antiporters) Ions, small hydrophilic molecules, lipids (ATPpowered pumps) i
Also called secondary active transport. KEY CONCEPTS OF SECTION 11.1 Overview of Transmembrane Transport Cellular membranes regulate the traffic of molecules and ions into and out of cells and their organelles. The rate of simple diffusion of a substance across a membrane is proportional to its concentration gradient and hydrophobicity. With the exception of gases (e.g., and ) and small, uncharged, water-soluble molecules, most molecules cannot diffuse across a pure phospholipid bilayer at rates sufficient to meet cellular needs. Membrane transport proteins provide a hydrophilic passageway for molecules and ions to travel through a membrane that has a hydrophobic interior. Three classes of transmembrane proteins mediate transport of ions, sugars, amino acids, and other metabolites across cellular membranes: channels, transporters, and ATP-powered pumps (see Figure 11-2). Channels form a hydrophilic tube through which water or ions move down a concentration gradient, a process known as facilitated transport. Some channels are ungated, or open all the time, while other channels are gated, and open only in response to specific electrical or chemical signals (or to light in the case of the light-activated channels used in optogenetics, described in Chapters 4 and 23). Transporters fall into three groups. Uniporters transport a molecule down its concentration gradient (facilitated transport); symporters and antiporters couple movement of a substrate against its concentration gradient to the movement of a second substrate down its concentration gradient, a process known as secondary active transport or cotransport (see Table 11-1). ATP-powered pumps couple the movement of a substrate against its concentration gradient to ATP hydrolysis, a process known as active transport. Conformational changes are essential to the function of all membrane transport proteins; speed of transport depends on the number of substrate molecules or ions that can pass through a protein at once. The alternating access model describes the conformational changes that many transporters and pumps use to transport molecules across the membrane. i
Uniport Transport Is Faster and More Specific than Simple Diffusion
11.2 Facilitated Transport of Glucose and Water Most animal cells use glucose as a substrate for ATP production; they usually employ a glucose uniporter to take up glucose from the blood or other extracellular fluid. Many cells use channel-like membrane transport proteins called aquaporins to increase the rate of water movement across their plasma membranes. Here we discuss the structure and function of these and other facilitated transporters. Uniport Transport Is Faster and More Specific than Simple Diffusion The transport of a single type of molecule, such as glucose or another small hydrophilic molecule, down a concentration gradient across a cellular membrane through a transport protein is known as uniport. Several features distinguish uniport from simple diffusion: 1. The rate of substrate movement by uniporters is far higher than simple diffusion through a pure phospholipid bilayer. 2. Because the transported molecule never enters the hydrophobic core of the phospholipid bilayer, its solubility in the lipid membrane is irrelevant.
3. Transport occurs via a limited number of uniporter molecules. Consequently, there is a maximum transport rate, , which depends on the number of uniporters in the membrane. is achieved when the concentration gradient across the membrane is very large and each uniporter is working at its maximal rate. 4. Transport is reversible, and the direction of transport changes if the direction of the concentration gradient changes. 5. Transport is specific. Each uniporter transports only a single type of molecule or a single group of closely related molecules. A measure of the affinity of a transporter for its substrate is the Michaelis constant, , which is the concentration of substrate at which transport is half . These properties also apply to transport mediated by the other classes of proteins depicted in Figure 11-3. One of the best understood uniporters is the glucose transporter called GLUT1, found in the plasma membrane of most mammalian cells. GLUT1 is especially abundant in the erythrocyte (red blood cell) plasma membrane. Because erythrocytes have a single membrane and no nucleus or other internal organelles (see Figure 10-7), it is relatively simple to isolate and purify the transport proteins in their plasma membranes. As a result, the properties of GLUT1 and many other transport proteins from mature erythrocytes have been extensively studied. In addition, the threedimensional structure of human GLUT1 was solved in 2014, providing further insights into the molecular details of GLUT1 function (see chapter opening image and Figure 11-6).
Figure 11-5 shows that glucose uptake by erythrocytes and liver cells exhibits kinetics similar to those of a simple enzyme-catalyzed reaction involving a single substrate. The kinetics of transport reactions mediated by other types of proteins are more complicated than those for uniporters. Nonetheless, all protein-assisted transport reactions occur faster than simple diffusion across the bilayer, are substrate-specific, and exhibit a maximal rate ( ). EXPERIMENTAL FIGURE 11-5 Cellular uptake of glucose mediated by GLUT proteins exhibits simple enzyme kinetics. The initial rate of glucose uptake, v (measured as micromoles per milliliter of cells per hour), in the first few seconds is plotted as a percentage of the maximum rate, , against increasing glucose concentration in the extracellular medium. In this experiment, the initial concentration of glucose in the cells is always zero. Both GLUT1, expressed by erythrocytes, and GLUT2, expressed by liver cells, catalyze glucose uptake. Like enzyme-catalyzed reactions, GLUT-facilitated uptake of glucose exhibits a maximum rate ( ). is the concentration at which the rate of
The Low Km of the GLUT1 Uniporter Enables It to Transport Glucose into Most Mammalian Cells
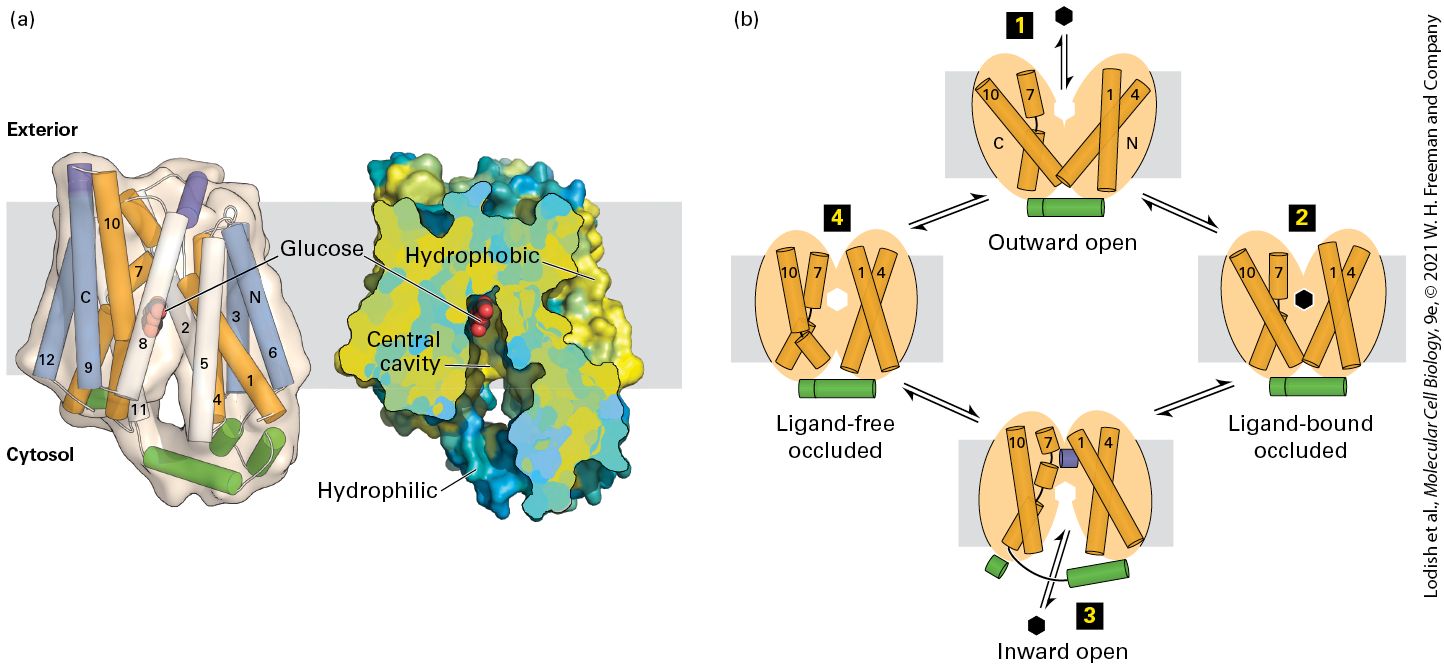
glucose uptake is half maximal. GLUT2, with a of about 20 mM (not shown), has a much lower affinity for glucose than GLUT1, with a of about 1.5 mM. Description In the graph, the horizontal axis represents the external concentration of glucose in micromoles and ranges from 0 to 14 in increments of 1. The vertical axis represents the initial rate of glucose uptake, v, as a percentage of the maximum rate, V max and ranges from 0 to 500 in increments of 500. Two curves represent G L U T 1 in erythrocytes and G L U T 2 in liver cells. Both curves are hyperbola, but the line corresponding to G L U T 1 rises more steeply and reaches a greater maximum value than that corresponding to G L U T 2. A horizontal dotted line at 500 is marked as V max and another horizontal dotted line at 250 is marked as half V max. A vertical dotted line from 1.5 of horizontal axis labeled K m meets the curve corresponding to G L U T 1 and half V max. The Low of the GLUT1 Uniporter Enables It to Transport Glucose into Most Mammalian Cells Like other uniporters, GLUT1 alternates between two conformational states: in one, a glucose-binding site faces the outside of the cell; in the other, a glucose-binding site faces the cytosol. The latter conformation has been solved at high resolution, as shown Figure 11-6a. Since the glucose concentration is usually higher in the extracellular medium (blood, in the case of erythrocytes) than in the cell, the GLUT1 uniporter generally catalyzes the net import of glucose from the extracellular medium into the cell. Figure 11-6b depicts the sequence of events during the unidirectional
transport of glucose from the cell exterior inward to the cytosol as described by the alternating access model; note the conformational changes in several of the membrane-spanning α helices during this process. GLUT1 can also catalyze the net export of glucose from the cytosol to the extracellular medium when the glucose concentration is higher inside the cell than outside. In the transition between the inwardand outward-facing states, the transporter is in an occluded conformation, in which the glucose-binding site is inaccessible to either the cytoplasm or the extracellular space.
FIGURE 11-6 The human GLUT1 uniporter transports glucose across cellular membranes. (a) Structural model (side view) of the full-length human GLUT1 protein in an inward-open conformation. The transporter consists of 12 transmembrane α-helical segments, which are organized into amino-terminal and carboxy-terminal domains, each of which consists of a pair of three transmembrane α helices, colored in orange, white, and blue. The amino-terminal and carboxy-terminal domains are connected by intracellular and extracellular α helices, which are colored green and purple, respectively. A section of a cutopen view of the surface electrostatic potential highlights the central cavity that transports glucose (red) across the membrane. The colors represent the hydrophobicity of the amino acids, with hydrophobic in yellow and hydrophilic in blue. (b) A working model for
GLUT1. In this alternating access model, the outward-open conformation of GLUT1 binds glucose (step 1 ) and moves to a ligand-bound occluded conformation (step 2 ) before changing to its inward-open conformation (step 3 ) when it delivers glucose to the cytoplasm, then moves through a ligand-free occluded conformation (step 4 ) before beginning another round of glucose transport from outside to inside the cell. If the concentration of glucose is higher inside the cell than outside, the cycle will work in reverse (step 4 → step 1 ), resulting in net movement of glucose out of the cell. The orange helices correspond to helices 1, 4, 7, and 10 in (a). The actual conformational changes are probably smaller than those depicted here. [Part (a) data from D. Deng et al., 2014, Nature 510:121–125, PDB ID 4pyp.] Description The illustration labeled (a) shows a ribbon diagram of G L U T 1 transporter along with the cross-sectional view of G L U T 1. At the center of both views is a ball and stick model of glucose molecules. A gray band behind these is the cell membrane and cytosol is labeled below and exterior above the cell membrane. In the cross-sectional view, the hydrophilic areas are labeled toward the inside of the cell, and hydrophobic areas are labeled closer to the outer surface of the membrane. The illustration labeled (b) shows a close-up of the ribbon diagram of G L U T 1 with the transporter opening and closing with glucose. Step 1 labeled outward open to the outside of the cell and a glucose molecule outside the cell is represented in a black hexagon. Step 2 labeled ligand-bound occluded shows the glucose molecule in the center of the ribbons. Step 3 labeled inward open shows the conformational change in the transporter and glucose moves into the cell. Step 4 labeled ligand-free occluded shows the ribbons closed together with an empty spot for more glucose to come in. The kinetics of the unidirectional transport of glucose from the outside of a cell inward via GLUT1 can be described by the same type of equation used to describe a simple enzyme-catalyzed chemical reaction. For simplicity, let’s assume that the substrate (glucose), S, is present initially only on the outside of the cell; this can be achieved experimentally by first
incubating cells in a medium lacking glucose so that their internal stores are depleted. In this case, we can write where represents GLUT1 in the outward-facing conformation with a bound glucose. This equation is similar to the one describing the path of a simple enzyme-catalyzed reaction in which the protein binds a single substrate and then transforms it into a different molecule. Here, however, no chemical modification of the GLUT1-bound glucose molecule occurs; rather, it is moved across a cellular membrane. Nonetheless, the kinetics of this transport reaction are similar to those of simple enzyme-catalyzed reactions, and we can use the same derivation as that of the Michaelis–Menten equation in Chapter 3 to derive the following expression for , the initial transport rate for S into the cell catalyzed by GLUT1: (11-1) where C is the concentration of (initially, the concentration of ). , the rate of transport when all molecules of GLUT1 contain a bound S, occurs at an infinitely high concentration. The lower the value of , the more tightly the substrate binds to the transporter. Equation 11-1 describes the curve for glucose uptake by erythrocytes shown in Figure 11-4 as well as similar curves for other uniporters.
For GLUT1 in the human erythrocyte membrane, the for glucose transport is 1.5 mM. Thus when the extracellular glucose concentration is 1.5 mM, roughly half the GLUT1 transporters with outward-facing binding sites will have a bound glucose, and transport will occur at 50 percent of the maximal rate. Blood glucose is normally 5 mM, so the erythrocyte glucose transporter is usually functioning at 77 percent of its maximal rate, as can be seen from Equation 11-1. The GLUT1 transporter (or the very similar GLUT3 glucose transporter) is expressed by all body cells that need to take up glucose from the blood continuously at high rates. The rate of glucose uptake by such cells remains high regardless of small changes in the concentration of blood glucose because the blood concentration remains much higher than the and the intracellular glucose concentration is kept low as a result of active metabolism. Of note, GLUT1 expression is elevated in many malignant cancers, consistent with the need for glucose as a source of energy for rapidly dividing cancer cells. In addition to transporting glucose, GLUT1 transports the isomeric sugars D-mannose and D-galactose, which differ from D-glucose in their configuration at only one carbon atom, at measurable rates. However, the for glucose (1.5 mM) is much lower than it is for D-mannose (20 mM) or D-galactose (30 mM). Thus GLUT1 is quite specific, having a much higher affinity (indicated by a lower ) for its normal substrate Dglucose than for other substrates. GLUT1 accounts for 2 percent of the protein in the plasma membrane of erythrocytes. After glucose is transported into the erythrocyte, it is rapidly
The Human Genome Encodes a Family of Sugar-Transporting GLUT Proteins
phosphorylated, forming glucose-6-phosphate, which cannot leave the cell. Because this reaction, the first step in the metabolism of glucose (see
Figure 12-3), is rapid and occurs at a constant rate, the intracellular concentration of glucose is kept low even when glucose is imported from the extracellular environment. Consequently, the concentration gradient of glucose (outside greater than inside the cell) is kept sufficiently high to support continuous, rapid import of additional glucose molecules and provide sufficient glucose for cellular metabolism. The Human Genome Encodes a Family of Sugar-Transporting GLUT Proteins The human genome encodes at least 14 highly homologous GLUT proteins, GLUT1–GLUT14. All are thought to contain 12 membranespanning α helices, suggesting that they evolved from a single ancestral transport protein. In the human GLUT1 protein, the transmembrane α helices are predominantly hydrophobic; several helices, however, bear amino acid residues (e.g., serine, threonine, asparagine, and glutamine) whose side chains can form hydrogen bonds with the hydroxyl groups on glucose. These residues are thought to form the inward-facing and outward-facing glucose-binding sites in the interior of the protein (see
Figure 11-5). The structures of all GLUT isoforms are thought to be quite similar, and all of them transport sugars. Nonetheless, the isoforms differ in their
expression in various cell types, in the regulation of their numbers on cell surfaces, and in their functional properties. By using isoforms with different properties, different body cells are able to regulate glucose metabolism differently and at the same time allow a constant concentration of glucose in the blood to be maintained. For instance, GLUT3 is found in neuronal cells of the brain. Neurons depend on a constant influx of glucose for metabolism, and the low of GLUT3 for glucose (1.5 mM), like that of GLUT1, ensures that these cells incorporate glucose from brain extracellular fluids at a high and constant rate. GLUT2, expressed in liver cells and in the insulin-secreting β islet cells of the pancreas, has a of about 13 times higher than the of GLUT1. As a result, when blood glucose rises after a meal from its basal level of 5 mM to 10 mM or so, the rate of glucose influx will almost double in GLUT2-expressing cells, whereas it will increase only slightly in GLUT1-expressing cells (see Figure 11-5). In the liver, the excess glucose brought into the cell is stored as the polymer glycogen. In β islet cells, the rise in glucose triggers secretion of the hormone insulin (see
Figure 21-1b), which in turn lowers blood glucose by increasing glucose uptake and metabolism in muscle (see Figure 15-32) and by inhibiting glucose production in the liver. Indeed, inactivation of GLUT2 in pancreatic β islet cells prevents insulin secretion even when levels of glucose are high and disrupts the regulated expression of glucose-sensitive genes in liver cells (hepatocytes). Another GLUT isoform, GLUT4, is expressed only in fat and muscle cells. These cells respond to insulin by increasing their uptake of glucose,
Transport Proteins Can Be Studied Using Artificial Membranes and Recombinant Cells
thereby removing glucose from the blood. In the absence of insulin, GLUT4 resides in intracellular membranes, not the plasma membrane, and is unable to facilitate glucose uptake from the extracellular fluid. By a process detailed in Figure 21-2, insulin causes these GLUT4-rich internal membranes to fuse with the plasma membrane, increasing the number of GLUT4 molecules present on the cell surface and thus the rate of glucose uptake. This is one principal mechanism by which insulin lowers blood glucose; defects in the movement of GLUT4 to the plasma membrane are one of the causes of adult-onset, or type II, diabetes, a disease marked by continuously high blood glucose. GLUT5 is the only GLUT protein with a high specificity (preference) for fructose. Its principal site of expression is the apical membrane of intestinal epithelial cells, where it transports dietary fructose from the intestinal lumen to the inside of the cells. Transport Proteins Can Be Studied Using Artificial Membranes and Recombinant Cells There are a variety of approaches to studying the intrinsic properties of transport proteins, such as the and parameters and the key residues responsible for binding. Most cellular membranes contain many different types of transport proteins but a relatively low concentration of any particular one, which makes functional studies of a single protein difficult. To facilitate such studies, researchers use two approaches to
Osmotic Pressure Causes Water to Move Across Membranes
enrich a transport protein of interest so that it predominates in the membrane: purification and insertion into artificial membranes and overexpression in recombinant cells. In the first approach, a specific transport protein is extracted from its membrane with detergent and purified. Although transport proteins can be isolated from membranes and purified, their functional properties (i.e., their role in the movement of substrates across membranes) can be studied only when they are associated with a membrane. Thus the purified proteins are usually reincorporated into membranes composed of a pure phospholipid bilayer, such as liposomes (see Figure 10-3). The rate of substrate transport across such membranes can be readily measured. Alternatively, the gene encoding a specific transport protein can be expressed at high levels in a cell type that normally does not express it. The difference between the transport rate of a substance by the transfected cells and by control nontransfected cells will be due to the expressed transport protein. In these systems, the functional properties of the various membrane proteins can be examined without ambiguity caused, for instance, by partial protein denaturation during isolation and purification procedures. As an example, overexpressing GLUT1 in lines of cultured fibroblasts increases their rate of uptake of glucose severalfold, and expression of mutant GLUT1 proteins with specific amino acid alterations can identify residues important for substrate binding.
Osmotic Pressure Causes Water to Move Across Membranes The life of all organisms depends on the movement of water into and out of cells. The aquaporins are a family of membrane channel proteins that allow water and a few other small uncharged molecules, such as glycerol, to cross cellular membranes efficiently. Before discussing these transport proteins, we need to review osmosis, the force that powers the movement of water across membranes. Water spontaneously moves downhill across a semipermeable membrane from a solution of lower solute concentration (relatively high water concentration) to one of higher solute concentration (relatively low water concentration), a process termed osmosis, or osmotic flow. In effect, osmosis is equivalent to diffusion of water across a semipermeable membrane. Osmotic pressure is defined as the hydrostatic pressure required to stop the net flow of water across a membrane separating solutions of different water concentrations (Figure 11-7). In other words, osmotic pressure balances the entropy-driven thermodynamic force of the water concentration gradient. In this context, a “membrane” may be a layer of cells or a plasma membrane that is permeable to water but not to the solutes it contains. The osmotic pressure is directly proportional to the difference in the concentrations of the total numbers of solute molecules on the two sides of the membrane. For example, a 0.5 M NaCl solution is actually 0.5 M ions and 0.5 M ions and has a similar osmotic pressure as a 1 M solution of glucose or sucrose.
FIGURE 11-7 Osmotic pressure. Solutions A and B are separated by a membrane that is permeable to water but impermeable to all solutes. If (the total concentration of solutes in solution B) is greater than , water will tend to flow across the membrane from solution A to solution B. Osmotic pressure π is the hydrostatic pressure that would have to be applied to solution B to prevent this water flow. From the van’t Hoff equation, osmotic pressure is given by , where R is the gas constant and T is the absolute temperature. Description The illustration shows a two-sided beaker with a water-permeable membrane between the two areas. The left side is labeled solution A, C subscript A and the right side is labeled solution B, C subscript B. A right arrow from solution A points to solution B.
The right arrow is labeled water flow if C subscript B is greater than C subscript A. An arrow on the top of the solution B is labeled hydrostatic pressure required to prevent net water flow. The movement of water across the plasma membrane determines the volume of an individual cell, which must be regulated to avoid damage to the cell. Small changes in extracellular osmotic conditions cause most animal cells to swell or shrink rapidly. When placed in a hypotonic solution (i.e., one in which the concentration of non-membranepenetrating solutes is lower than in the cytosol), animal cells swell owing to the osmotic flow of water inward. Conversely, when placed in a hypertonic solution (i.e., one in which the concentration of nonmembrane-penetrating solutes is higher than in the cytosol), animal cells shrink as cytosolic water leaves the cell by osmotic flow. Consequently, cultured animal cells must be maintained in an isotonic medium, which has a solute concentration, and thus osmotic strength, similar to that of the cell cytosol.
In vascular plants, water and minerals are absorbed from the soil by the roots and move up the plant through conducting tubes (the xylem); water loss from the plant, mainly by evaporation from the leaves, drives this movement of water. Unlike animal cells, plant, algal, fungal, and bacterial cells are surrounded by a rigid cell wall, which resists the expansion of the volume of the cell when the intracellular osmotic pressure increases. Without such a wall, animal cells expand when internal osmotic pressure increases; if that pressure rises too much, the cells burst like overinflated balloons. Because of the cell wall, the osmotic influx of water that occurs when plant cells are placed in a hypotonic solution (even pure water) leads to an increase in intracellular pressure, but not in cell volume. In plant cells, the concentration of solutes (e.g., sugars and salts) is usually higher in the vacuole (see Figure 1-13a) than in the cytosol, which in turn has a higher solute concentration than the extracellular space. The osmotic pressure generated by the entry of water into the cytosol and then into the vacuole, called turgor pressure, pushes the cytosol and the plasma membrane against the resistant cell wall. Plant cells can harness this pressure to help them stand upright and grow. Cells elongate during growth by means of a process induced by hormones: a defined region of the cell wall loosens and then water flows into the vacuole, increasing its size and thus the size of the cell. Although most protozoans (like animal cells) do not have a rigid cell wall, many contain a contractile vacuole that permits them to avoid bursting
Aquaporins Increase the Water Permeability of Cellular Membranes
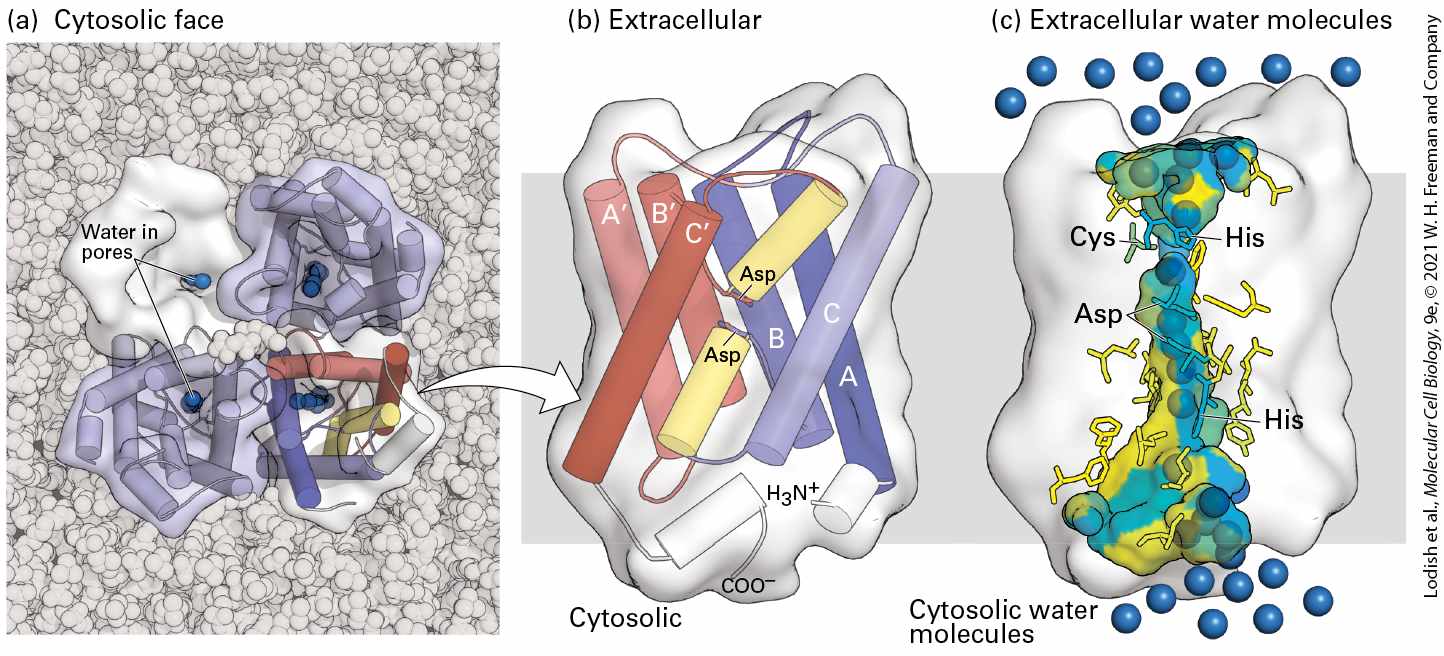
from osmotic pressure. A contractile vacuole takes up water from the cytosol and, unlike a plant vacuole, periodically discharges its contents through fusion with the plasma membrane. Thus even though water continuously enters the protozoan cell by osmotic flow, the contractile vacuole prevents too much water from accumulating in the cell and swelling it to the bursting point. Aquaporins Increase the Water Permeability of Cellular Membranes The natural tendency of water to flow across cellular membranes as a result of osmotic pressure raises an obvious question: Why don’t the cells of freshwater animals burst in water? Frogs, for example, lay their eggs in pond water (a hypotonic solution), but frog oocytes and eggs do not swell with water even though their internal salt (mainly KCl) concentration is comparable to that of other cells ( KCl). These observations were what first led investigators to suspect that the plasma membranes of most cell types, but not of frog oocytes, contain water-channel proteins that accelerate the osmotic flow of water. The finding that injection of the mRNA encoding the aquaporin channel protein into frog eggs caused them to burst in fresh water demonstrated that aquaporins are sufficient to increase the permeability of cells to water. Aquaporin channels are selective for water molecules, which they transport in either direction depending on the osmotic gradient. A tetramer of identical 28-kDa subunits (Figure 11-8a), each subunit contains six
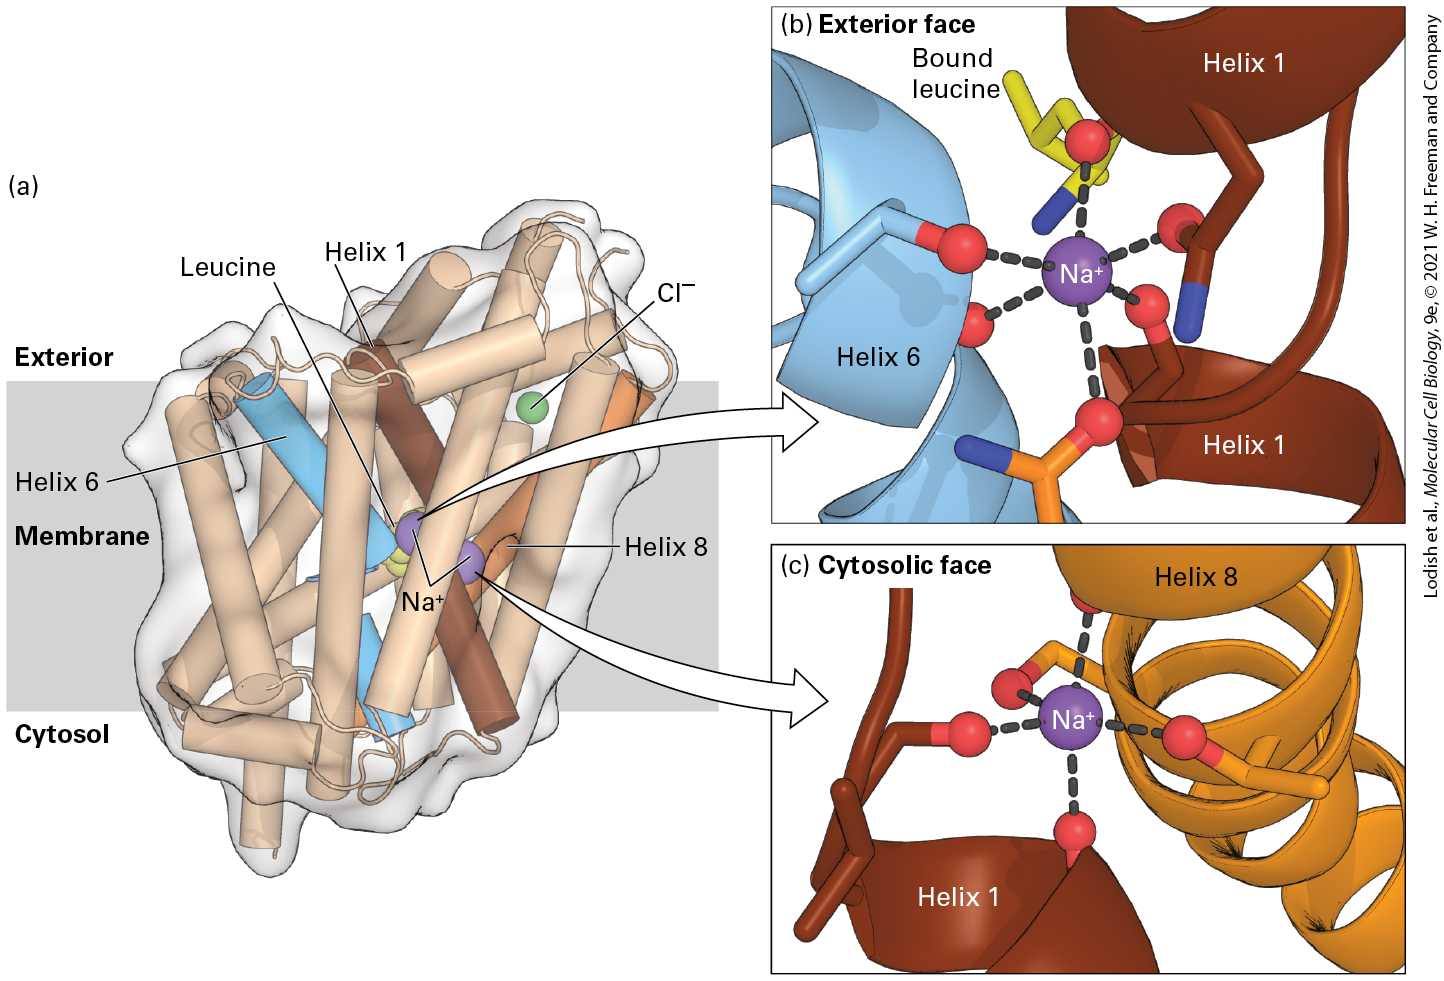
membrane-spanning α helices that form a central pore through which water can move (Figure 11-8b, c). The channel, or pore, at the center of each monomer is only 0.28 nm in diameter — only slightly larger than the diameter of a water molecule. The molecular sieving properties of the channel are determined by several conserved, hydrophilic amino acid residues whose side-chain and carbonyl groups extend into the middle of the channel and by a relatively hydrophobic wall that lines one side of the channel. Several water molecules can move simultaneously through the channel, each molecule sequentially forming specific hydrogen bonds with the channel-lining amino acids and displacing another water molecule downstream. Aquaporins do not undergo conformational changes during water transport, so they transport water orders of magnitude faster than GLUT1 transports glucose. The formation of hydrogen bonds between the oxygen atom of water and the amino groups of two amino acid side chains ensures that only uncharged water (i.e., , but not ) passes through the channel; the orientations of the water molecules in the channel prevent protons from jumping from one to the next and thus prevent the net movement of protons through the channel. As a consequence, ionic gradients are maintained across membranes even when water is flowing across them through aquaporins.
FIGURE 11-8 Structure of an aquaporin. (a) Structural model of the tetrameric protein comprising four identical subunits. Each subunit forms a water channel, as seen in this view looking down on the protein from the exoplasmic side. One of the monomers is shown as a water-accessible surface model, in which the pore entrance can be seen. (b) Schematic diagram of the topology of a single aquaporin subunit in relation to the membrane. Three pairs of homologous transmembrane α helices (A and , B and , and C and ) are oriented in the opposite direction with respect to the membrane and are connected by two hydrophilic loops containing short non-membrane-spanning helices and conserved asparagine (Asn) residues. The loops bend into the cavity formed by the six transmembrane helices, meeting in the middle to form part of the water-selective gate. (c) Side view of the pore in a single aquaporin subunit, in which several water molecules (blue spheres) are seen within the 2-nm-long water-selective gate that separates the water-filled cytosolic and extracellular vestibules. The gate contains highly conserved hydrophilic amino acid residues whose side chains form hydrogen bonds with transported water molecules. The amino acids lining the pore are colored from hydrophilic (blue) to hydrophobic (yellow). The arrangement of these hydrogen bonds and the narrow pore diameter of 0.28 nm prevent passage of protons (i.e., ) or other ions. [Data from H. Sui et al., 2001, Nature 414:872, PDB ID 1j4n.] Description The illustration labeled (a) Cytosolic face shows the tetrameric structure of the aquaporin with water molecules in the pores at the center of each subunit. The
illustration labeled (b) extracellular shows the magnified view of one subunit of the ribbon structure. The alpha helices that runs through the membrane are labeled A, B, and C. A second set, symmetry-related set are labeled with primes. Two central alpha helices with asparagine residue are highlighted. The illustration labeled (c) extracellular water molecules highlights only the surface and the pore surface of the protein. The highlight shows the pore available for the passage of water molecules through the subunit. Cysteine, histidine, and asparagine residues are highlighted, and the pore surface is color-coded according to its hydrophobicity. Water molecules are represented in blue spheres. Mammals express a family of aquaporins; 14 such genes are known in humans. Aquaporin 1 is expressed in abundance in erythrocytes, and the homologous aquaporin 2 is found in the kidney epithelial cells that resorb water from the urine, thus controlling the amount of water in the body. The activity of aquaporin 2 is regulated by vasopressin, also called antidiuretic hormone, in a manner that resembles the regulation of GLUT4 activity in fat and muscle. When the cells are in their resting state and water is being excreted to form urine, aquaporin 2 is sequestered in intracellular vesicle membranes and so is unable to import water into the cell. When the polypeptide hormone vasopressin binds to the cell-surface vasopressin receptor, it activates a signaling pathway using cAMP as the intracellular signal (detailed in Chapter 15) that causes these aquaporin 2– containing vesicles to fuse with the plasma membrane, increasing the rate of water uptake and return to the circulation. Inactivating mutations in either the vasopressin receptor or the aquaporin 2 gene cause diabetes insipidus, a disease marked by excretion of large volumes of dilute urine.
This finding demonstrates that the level of aquaporin 2 is rate limiting for water resorption from urine being formed by the kidney. Other members of the aquaporin family transport hydroxyl-containing molecules such as glycerol rather than water. Human aquaporin 3, for instance, transports glycerol and is similar in amino acid sequence and structure to the Escherichia coli glycerol transport protein GlpF. KEY CONCEPTS OF SECTION 11.2 Facilitated Transport of Glucose and Water Protein-catalyzed transport of biological solutes across a membrane occurs much faster than simple diffusion, exhibits when the limited number of transporter molecules are saturated with substrate, and is highly specific for substrate (see Figure 11-4). Uniport proteins, such as the glucose transporters (GLUTs), are thought to shuttle between two conformational states, one in which the substrate-binding site faces outward and one in which the binding site faces inward (see Figure 11-5). All members of the GLUT protein family transport sugars and have similar structures. Differences in their values, expression in different cell types, and substrate specificities are important for proper sugar metabolism in the body. Two common experimental systems for studying the functions of transport proteins are liposomes containing a purified transport protein and cells transfected with the gene encoding a particular transport protein. Most cellular membranes are semipermeable, more permeable to water than to ions or most other solutes. Water moves by osmosis across membranes from a solution of lower solute concentration to one of higher solute concentration. The rigid cell wall surrounding plant cells prevents their swelling and leads to generation of turgor pressure in response to the osmotic influx of water. Aquaporins are water-channel proteins that specifically increase the permeability of cellular membranes to water (see Figure 11-8). Aquaporin 2 in the plasma membrane of certain kidney cells is essential for resorption of water from urine being formed; the absence of aquaporin 2 leads to the medical condition diabetes insipidus.
There Are Four Main Classes of ATP-Powered Pumps
11.3 ATP-Powered Pumps and the Intracellular Ionic Environment In the previous sections, we focused on transport proteins that move molecules down their concentration gradients (facilitated transport). Here we focus our attention on the class of proteins — the ATP-powered pumps — that use the energy released by hydrolysis of the terminal phosphoanhydride bond of ATP to transport ions and various small molecules across membranes against their concentration gradients. All ATP-powered pumps are transmembrane proteins with one or more binding sites for ATP located on subunits or segments of the protein that face the cytosol. These proteins are ATPases, but they normally do not hydrolyze ATP into ADP and unless ions or other molecules are simultaneously transported. Because of this tight coupling between ATP hydrolysis and transport, the energy stored in the phosphoanhydride bond is not dissipated as heat, but rather is used to move ions or other molecules uphill against an electrochemical gradient. There Are Four Main Classes of ATPPowered Pumps The general structures of the four classes of ATP-powered pumps are depicted in Figure 11-9, with specific examples in each class listed below the figure. Note that the members of three of the classes (P, F, and V)
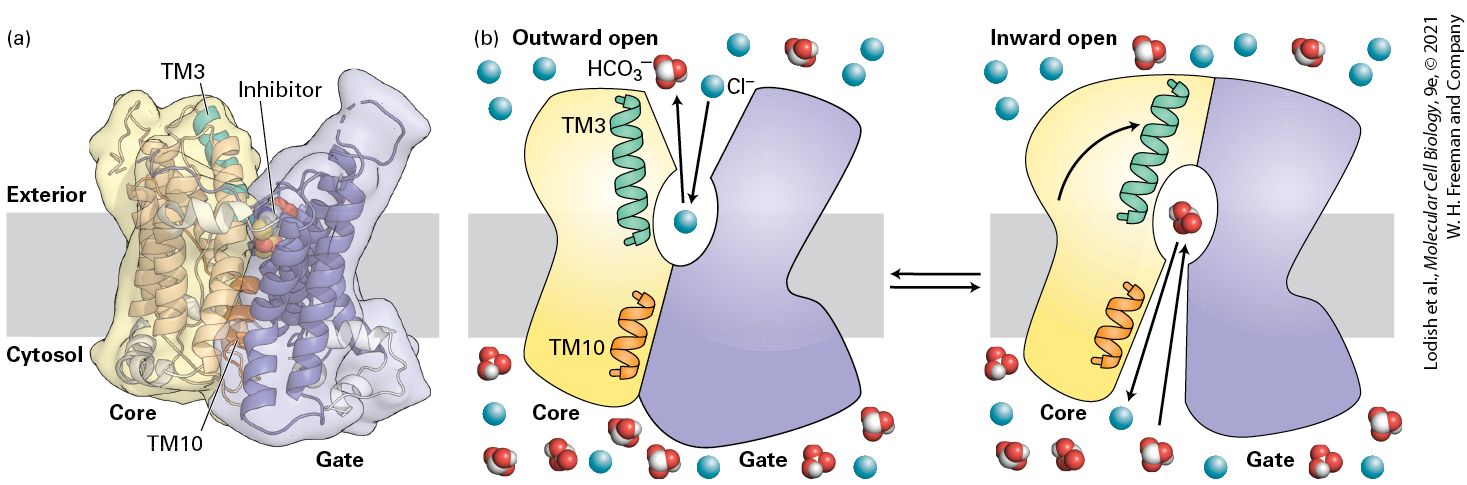
transport only ions, as do some members of the fourth class, the ABC superfamily. Most members of the ABC superfamily, however, transport small molecules such as amino acids, sugars, peptides, lipids, and many types of drugs.
FIGURE 11-9 The four classes of ATP-powered transport proteins. The locations of specific examples are indicated below each class. (a) P-class pumps are composed of two catalytic α subunits, which become phosphorylated as part of the transport cycle. Two β subunits, present in some of these pumps, may regulate transport. Only one α and one β subunit are depicted here, from ATPase, with the three red circles representing ion binding sites and the two light green squares representing ion binding sites. (b, c) V-class and F-class pumps are not phosphorylated, and almost all transport only protons. V-class pumps couple ATP hydrolysis to transport protons against a concentration gradient, whereas F-class pumps normally operate in the reverse direction and use the energy in a proton concentration or voltage gradient to synthesize ATP. (d) All members of the large ABC superfamily of proteins contain two transmembrane (T) domains and two cytosolic ATP-binding (A) domains, which couple ATP hydrolysis to solute movement.
These core domains are present as separate subunits in some ABC proteins (as depicted here) but are fused into a single polypeptide in other ABC proteins. [Information from S. Sharma et al., 2019, J. Biol. Chem. 294:6439; C. Toyoshima et al., 2000, Nature 405:647; D. McIntosh, 2000, Nat. Struct. Biol. 7:532; and H. Okamoto and M. Futai, 2013, Encyclopedia of Biophysics, https://doi.org/10.1007/978-3-642-16712- 6_203.] Description The illustration labeled (a) P-class, shows the cell membrane with the exterior labeled above and cytosol labeled below. A green three-dimensional structure shows four parts, the longest part passes through the cell membrane. Next to this is a light blue oval- shaped structure labeled beta. Inside the cytosol is three green spheres with a phosphate molecule attached to the center sphere and an arrow from A T P passes through one of the spheres and ends with A D P. The illustration labeled (b) V-class shows the cell membrane, the exterior is also labeled lumen. This three-dimensional structure has five oval-shaped green pores labeled C. Next to this are orange structures with only a small part passes through the membrane and the greater part is in the cytosol below the green pore. This structure is labeled with several letters, an arrow from A T P goes in, and A D P plus P comes out of the orange structure in the cytosol. The illustration labeled (c) F-class is very similar to (b), except the section of the orange structures that pass through the membrane is larger and the green pore is smaller. An arrow from A D P plus P subscript i goes in and A T P comes out of the orange structure in the cytosol. The illustration labeled (d) A B C superfamily shows the cell membrane with the exterior labeled above and cytosol labeled below. A light blue three-dimensional diagram shows four parts, the two longest part passes through the cell membrane, attached near the exterior, and labeled T. Each T structure has an oval-shaped structure labeled A. An arrow from A T P passes through the structure A and ends with A D P plus P subscript i. All P-class pumps possess two identical catalytic α subunits, each of which contains an ATP-binding site. Most also have two smaller β subunits, which usually have regulatory functions. During transport, at
least one of the α subunits becomes phosphorylated (hence the name “P” class), and the transported ions move through the phosphorylated subunit. The amino acid sequences around the phosphorylated residues are homologous in different pumps. This class includes the ATPase in the plasma membrane, which generates the low cytosolic and high cytosolic concentrations typical of animal cells (see Figure 11-3). Certain ATPases pump ions out of the cytosol into the external medium; others pump from the cytosol into the endoplasmic reticulum or into the specialized ER called the sarcoplasmic reticulum (SR) that is found in muscle cells. Another member of the P class, the gastric proton pump, is found in acid-secreting cells of the mammalian stomach; the gastric proton pump transports protons ( ions) out of and ions into the cell. The recently solved crystal structure of this pump yielded important insights into the binding sites of drugs that are used to treat diseases of damage caused by gastric acid such as gastric ulcers and reflux esophagitis. The structures of V-class and F-class pumps are similar to one another but are unrelated to, and more complicated than, those of P-class pumps. Vand F-class pumps contain several different transmembrane and cytosolic subunits. Virtually all known V and F pumps transport only protons and do so in a process that does not require phosphorylation. V-class pumps generally function to generate the low pH of plant vacuoles and of lysosomes and other acidic vesicles in animal cells by pumping protons from the cytosolic to the exoplasmic face of the membrane against a proton electrochemical gradient. In contrast, the proton pumps that
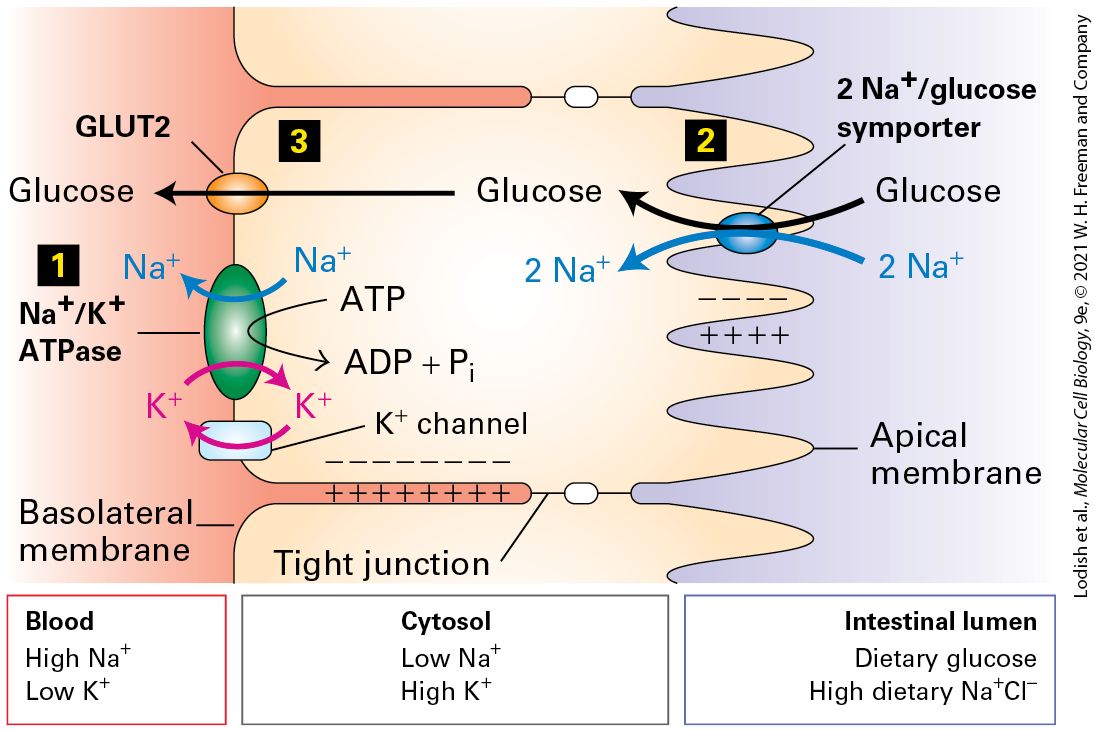
generate and maintain the electric potential across the plasma membrane in plant, fungal, and many bacterial cells belong to the P-class pumps. F-class pumps are found in bacterial plasma membranes and in mitochondria and chloroplasts. In contrast to V-class pumps, they generally function as reverse proton pumps, in which protons move from the exoplasmic to the cytosolic face of the membrane down the proton electrochemical gradient, in the energetically favored direction. The energy released is used to power the energetically unfavorable synthesis of ATP from ADP and . Because of their importance in ATP synthesis in chloroplasts and mitochondria, F-class proton pumps, commonly called ATP synthases, are treated separately in Chapter 12 (see Figure 12-27). The final class of ATP-powered pumps is a large family with multiple members that are more diverse in function than those of the other classes. Referred to as the ABC (ATP-binding cassette) superfamily, this class includes several hundred different transport proteins found in organisms ranging from bacteria to humans. As detailed below, some of these transport proteins were first identified as multidrug-resistance proteins that, when overexpressed in cancer cells, export anticancer drugs and render tumors resistant to their action. Each ABC protein is specific for a single substrate or group of related substrates, which may be ions, sugars, amino acids, phospholipids, cholesterol, peptides, polysaccharides, or even proteins. All ABC membrane transport proteins share a structural organization consisting of four core domains: two transmembrane (T) domains, which form the passageway through which transported molecules cross the membrane, and two cytosolic ATP-binding (A)
ATP-Powered Ion Pumps Generate and Maintain Ionic Gradients Across Cellular Membranes
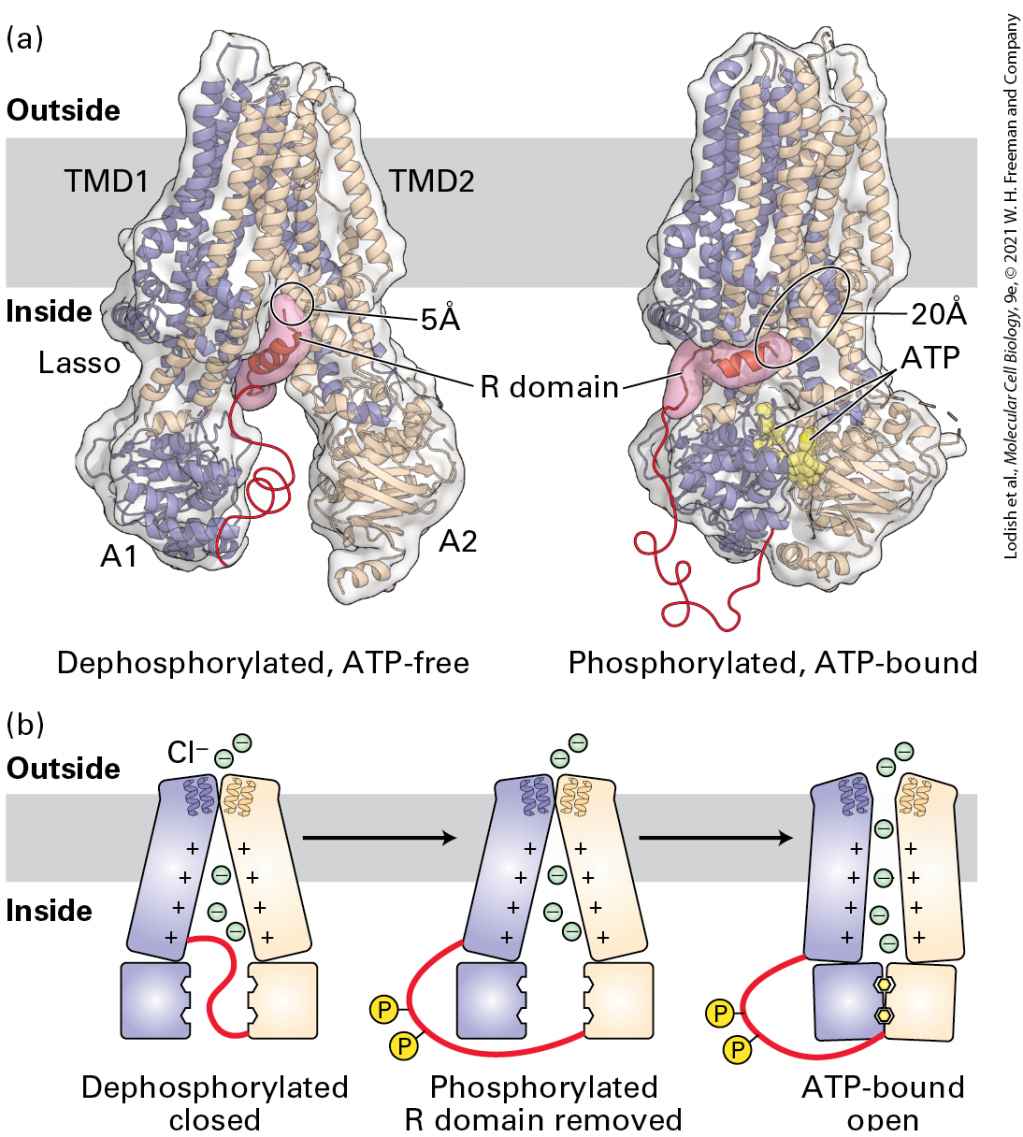
domains. In some ABC proteins, mostly those in bacteria, the core domains are present as four separate polypeptides; in others, the core domains are fused into one or two multidomain polypeptides. ATP binding and hydrolysis drives the transport process in most ABC membrane transporters. However, the energy from ATP binding and hydrolysis can also be used to regulate the opening and closing of a continuous channel, as described below for the cystic fibrosis transmembrane conductance regulator protein (CFTR). ATP-Powered Ion Pumps Generate and Maintain Ionic Gradients Across Cellular Membranes The specific ionic composition of the cytosol usually differs greatly from that of the surrounding extracellular fluid. In virtually all cells — including microbial, plant, and animal cells — the cytosolic pH is kept near 7.2 regardless of the extracellular pH. In the most extreme case, there is a 1-million-fold difference in concentration between the cytosol of the epithelial cells lining the stomach and the stomach contents after a meal. Furthermore, the cytosolic concentration of is much higher than that of . In both invertebrates and vertebrates, the concentration of is 20–40 times higher in the cytosol than in the blood, while the concentration of is 8–12 times lower in the cytosol than in the blood (Table 11-2).
TABLE 11-2 • Typical Intracellular and Extracellular Ion
Concentrations Ion Cell (mM) Seawater (mM) Squid Giant Axon (marine invertebrate) 40–150 0.0003 300–400 5–10 Mammalian Cell (vertebrate) Cell (mM) Blood (mM) 0.8 1.5 1.8 The large nerve axon of the squid has been widely used in studies of the mechanism of conduction of electric impulses. represents proteins, which have a net negative charge at the neutral pH of blood and cells. i ii i ii
Some in the cytosol is bound to the negatively charged groups in ATP and in proteins and other molecules, but it is the concentration of unbound (or “free”) that is critical to its functions in signaling pathways and muscle contraction. The concentration of free in the cytosol is generally less than 0.2 micromolar ( ), a thousand or more times lower than that in the blood. Plant cells and many microorganisms maintain similarly high cytosolic concentrations of and low concentrations of and , even if the cells are cultured in very dilute salt solutions. The ion pumps discussed in this section are largely responsible for establishing and maintaining the typical ionic gradients observed across the plasma and intracellular membranes. In carrying out this task, cells expend considerable energy. For example, up to 25 percent of the ATP produced by nerve and kidney cells is used for ion transport, and human erythrocytes consume up to 50 percent of their available ATP for this purpose; in both cases, most of this ATP is used to power the pump (see Figure 11-3). In neurons, the pump maintains and gradients that are essential for conducting electrical signals rapidly and efficiently, as we detail in Chapter 23. Certain enzymes required for protein synthesis in all cells require a high concentration and are inhibited by high concentrations of ; these enzymes would cease to function without the operation of the pump. In cells treated with poisons that inhibit the production of ATP (e.g., 2,4-dinitrophenol in aerobic cells), the pumping stops, and the ion concentrations inside the cell gradually approach those of the exterior environment as ions spontaneously move through channels in the plasma membrane down their
Muscle Relaxation Depends on Ca2+ ATPases That Pump Ca2+ from the Cytosol into the Sarcoplasmic Reticulum
electrochemical gradients. Eventually the treated cells die, partly because protein synthesis requires a high concentration of ions and partly because, in the absence of a gradient across the plasma membrane, a cell cannot import certain nutrients such as amino acids (see Figure 11-3). Studies on the effects of such poisons provided early evidence for the existence and significance of ion pumps. Muscle Relaxation Depends on ATPases That Pump from the Cytosol into the Sarcoplasmic Reticulum In skeletal muscle cells, ions are concentrated and stored in the sarcoplasmic reticulum (SR), a specialized type of endoplasmic reticulum (ER). The release (via ion channels) of stored ions from the SR lumen into the cytosol causes muscle contraction, as discussed in Chapter 17. A P-class ATPase located in the SR membrane pumps from the cytosol back into the lumen of the SR, thereby inducing muscle relaxation. The activity of the muscle ATPase increases as the free concentration in the cytosol rises. In the cytosol of muscle cells, the free concentration ranges from (resting cells) to more than (contracting cells), whereas the total concentration in the SR lumen can be as high as 10 mM. The lumen of the SR contains two abundant
The Mechanism of Action of the Ca2+ Pump Is Known in Detail
proteins, calsequestrin and the so-called high-affinity -binding protein, each of which binds multiple ions at high affinity. By binding much of the in the SR lumen, these proteins reduce the concentration of “free” ions inside the SR. This reduction, in turn, reduces the concentration gradient between the cytosol and the SR lumen and consequently reduces the energy needed to pump ions into the SR from the cytosol. In skeletal muscle cells, the calcium pump in the SR membrane works in concert with a similar pump located in the plasma membrane to ensure that the cytosolic concentration of free in resting muscle remains at or below . As the pump in the SR membrane moves into the SR lumen, the pump in the plasma membrane moves out of the cell. The activity of plasma-membrane ATPases is regulated by calmodulin, a cytosolic -binding protein (see Figure 334). A rise in cytosolic induces the binding of ions to calmodulin, which triggers activation of the ATPase. In this way, free ion concentration is coordinately regulated in the muscle cell cytoplasm and the SR lumen. The Mechanism of Action of the Pump Is Known in Detail Because the calcium pump constitutes more than 80 percent of the integral membrane protein in muscle SR membranes, it is easily purified and has been studied extensively. The three-dimensional structure of this protein
has been determined in several conformational states, representing different steps in the pumping process. These structures have revealed much about its mechanism of action, which serves as a model for understanding many P-class ATPases. The current model for the mechanism of action of the ATPase in the SR membrane proposes that the ATPase passes through multiple conformational states. The ATPase has two binding sites for , located in the center of the membrane-spanning domain. For simplicity, we group the multiple conformation states into E1 states, in which the two binding sites face the cytosol, and E2 states, in which these binding sites face the exoplasmic face of the membrane, pointing into the lumen of the SR. The coupling of ATP hydrolysis with ion pumping requires several conformational changes in the protein that must occur in a defined order, as shown in Figure 11-10. When the protein is in the E1 conformation, two ions bind to two high-affinity binding sites accessible from the cytosolic side; even though the cytosolic concentration is low (see
Table 11-2), calcium ions still fill these sites. Next an ATP binds to a site on the cytosolic surface (step 1 ). The bound ATP is hydrolyzed to ADP in a reaction that requires , and the liberated phosphate is transferred to a specific aspartate residue in the protein, forming the high-energy acyl phosphate bond denoted by (step 2 ). The protein then undergoes a conformational change that generates E2, in which the affinity of the two -binding sites is reduced (shown in detail in the next figure) and in which these sites are now accessible to the SR lumen (step 3 ). The free energy of hydrolysis
of the aspartyl-phosphate bond in is greater than that in E2–P, and this reduction in the free energy of the aspartyl-phosphate bond can be said to power the conformational change. The ions spontaneously dissociate from the binding sites to enter the SR lumen because even though the concentration there is higher than in the cytosol, it is lower than the for binding in the low-affinity state (step 4 ). Finally, the aspartyl-phosphate bond is hydrolyzed (step 5 ). This dephosphorylation, coupled with subsequent binding of cytosolic to the high-affinity E1 -binding sites, stabilizes the E1 conformational state relative to E2; furthermore, it can be said to power the conformational change (step 6 ). Now E1 is ready to transport two more ions. Thus the cycle is complete, and hydrolysis of one phosphoanhydride bond in ATP has powered the pumping of two ions against a concentration gradient into the SR lumen. Much structural and biophysical evidence supports the model depicted in
Figure 11-10. For instance, the muscle calcium pump has been isolated with phosphate linked to the key aspartate residue, and spectroscopic studies have detected slight alterations in protein conformation during the conversion. The two phosphorylated states can also be distinguished biochemically; addition of ADP to phosphorylated E1 results in synthesis of ATP, the reverse of step 2 , whereas addition of ADP to phosphorylated E2 does not. Each principal conformational state of the reaction cycle can also be characterized by a different susceptibility to various proteolytic enzymes such as trypsin.
FIGURE 11-10 Operational model of the ATPase in the SR membrane of skeletal muscle cells. Only one of the two catalytic α subunits of this P-class pump is depicted. E1 and E2 are alternate conformations of the protein in which the -binding sites are accessible from the cytosolic and exoplasmic (SR lumen) faces of the membrane, respectively. An ordered sequence of steps, as diagrammed here, is essential for coupling ATP hydrolysis with the transport of ions across the membrane. In the figure, indicates a high-energy aspartyl-phosphate bond; –P indicates a low-energy bond. Because the affinity of for the cytosolic-facing binding sites in E1 is 1000-fold greater than its affinity for the exoplasmic-facing sites in E2, this pump transports unidirectionally from the cytosol to the SR lumen. See the text and Figure 11-11 for more detail. See C. Toyoshima and G. Inesi, 2004, Annu. Rev. Biochem. 73:269–292. Description The P-class pump is embedded in the sarcoplasmic reticulum (S R). The concentration of calcium ions is higher in the S R lumen than in the cytosol. The pump is composed of an alpha unit, embedded in the membrane, and three domains protruding into the cytosol. Two calcium-binding sites are in the alpha subunit. One of the cytosolic subunits is an A T P binding site, and another contains a phosphorylated aspartate residue. The steps involved in the cycle are as follows: Step 1. Starting in the E 1 conformation, calcium and A T P are bound from the cytosol. Step 2. Aspartate is phosphorylated, and A D P leaves the A T P binding site. Step 3. A conformational change from E 1 to E 2 is induced. The membrane protein is now open to the S R lumen. Step 4. Calcium is released to the SR lumen. Step 5. Dephosphorylation of
aspartate occurs. Step 6. A conformational change from E 2 to E 1 occurs, and the cycle repeats.
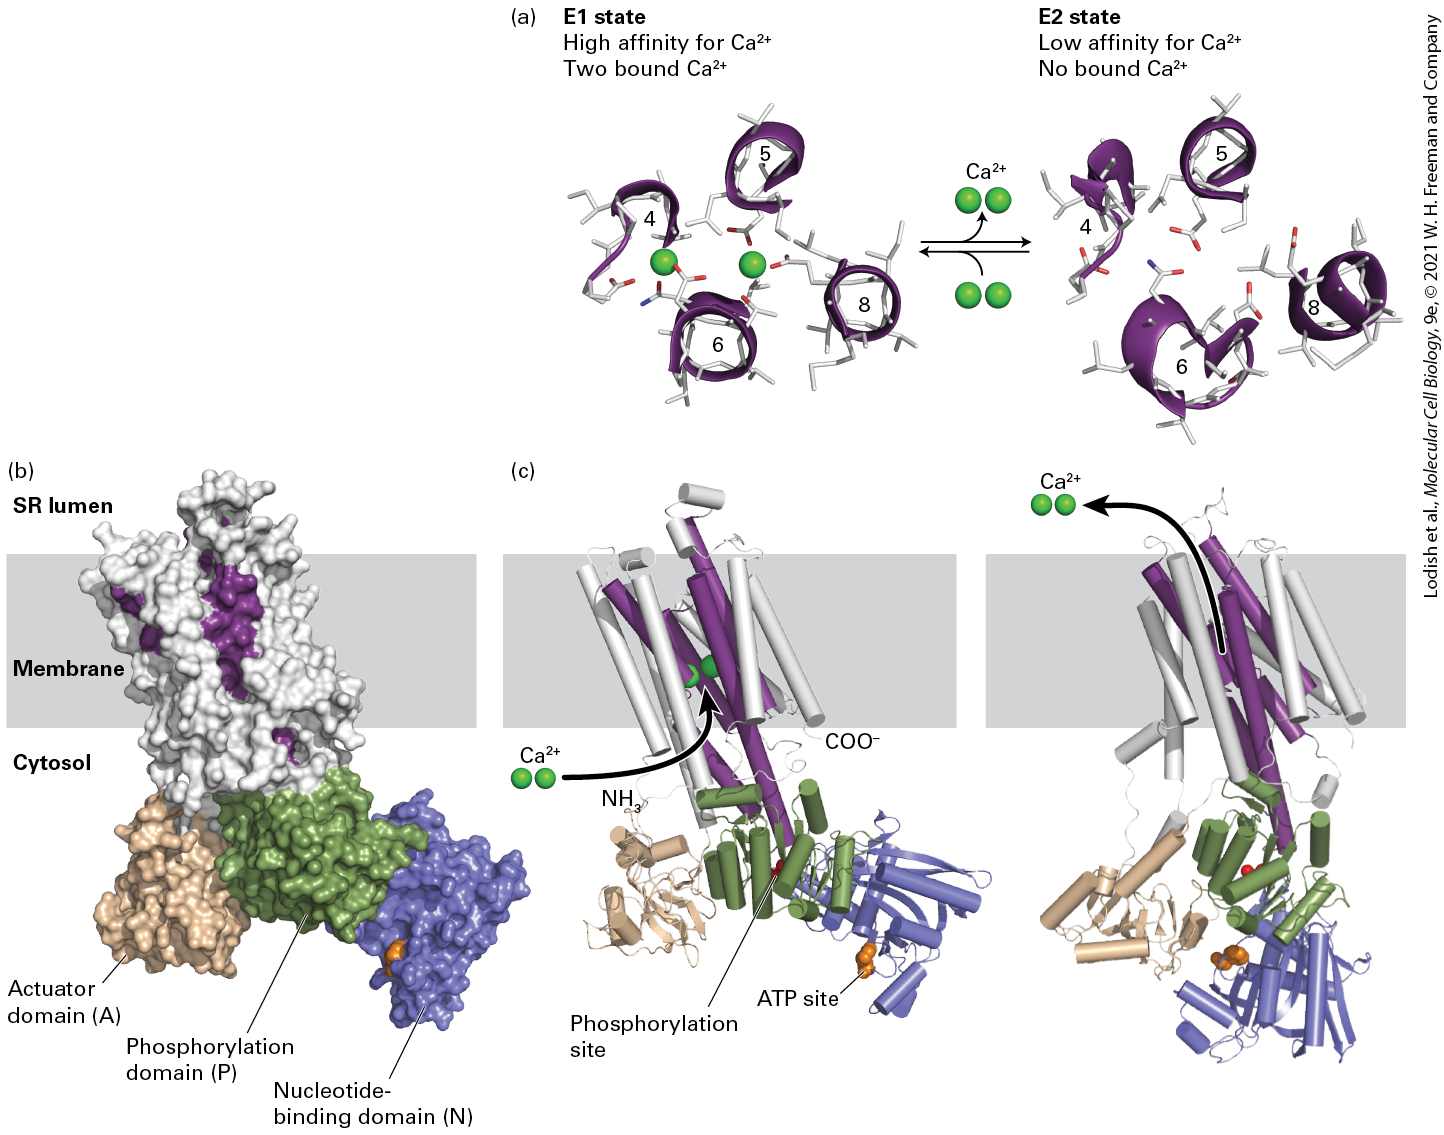
Figure 11-11b shows the three-dimensional structure of the pump in the E1 state. As can be seen in Figure 11-11c, the 10 membrane-spanning α helices in the catalytic subunit form the passageway through which ions move. Amino acids in four of these helices form the two high-affinity E1 -binding sites (Figure 11-11a, left). One site is formed from negatively charged oxygen atoms from the carboxyl groups ( ) of glutamate and aspartate side chains, as well as from bound water molecules. The other site is formed from side- and main-chain oxygen atoms. Thus as ions bind to the pump, they lose the water molecules that normally surround a ion in aqueous solution (see
Figure 2-7), but these water molecules are replaced by oxygen atoms with a similar geometry that are part of the transport protein. In contrast, in the E2 state (Figure 11-11a, right), several of these binding side chains have moved fractions of a nanometer and are unable to interact with bound ions, accounting for the low affinity of the E2 state for ions.
FIGURE 11-11 Structure of the catalytic α subunit of the muscle ATPase. (a) -binding sites in the E1 state (left), with two bound calcium ions, and the low-affinity E2 state (right), without bound ions. Side chains of key amino acids are white, and the oxygen atoms on the glutamate and aspartate side chains are red. In the high-affinity E1 conformation, ions bind at two sites between helices 4, 5, 6, and 8 inside the membrane. One site is formed out of negatively charged oxygen atoms from glutamate and aspartate side chains and from water molecules (not shown), and the other is formed out of side- and main-chain oxygen atoms. Seven oxygen atoms surround the ion in both sites. (b) Three-dimensional model of the protein in the E1 state based on the structure determined by x-ray crystallography. There are 10 transmembrane α helices, four of which (purple) contain residues that participate in binding. The cytosolic segment forms three domains: the nucleotide-binding domain (N, blue), the phosphorylation domain (P, green), and the actuator domain (A, beige), which connects two of the membrane-spanning helices. (c) Models of the pump in the E1 state (left) and in the E2 state (right). Note the differences between the E1 and E2 states in the conformations of the N and A domains.
Movements of these domains power the conformational changes of the membrane-spanning α helices (purple) that constitute the -binding sites, converting them from a conformation in which the -binding sites are accessible from the cytosolic face (E1 state) to one in which the now loosely bound ions gain access to the exoplasmic face (E2 state). [Data from C. Toyoshima and G. Inesi, 2004, Annu. Rev. Biochem. 73:269–292, PDB ID 1su4; and K. Obara et al., 2005, Proc. Nat'l. Acad. Sci. USA 102:14489–14496, PDB ID 1agv.] Description The illustration labeled (a) shows a reversible reaction between two ribbon diagrams. The first part is labeled E 1 State High affinity for Ca superscript 2 plus, two bound Ca superscript 2 plus. There are four spirals of ribbons connected with 2 green circles representing Ca superscript 2 plus ions. The four spirals are labeled, clockwise from left as 4, 5, 8, 6. In the second part, the same spirals are now separated and labeled with the same numbers. The label says E 2 State Low affinity for Ca superscript 2 plus, No bound Ca superscript 2 plus. The illustration labeled (b) shows a space-filling threedimensional model of the P-class pump. A rectangular bar with the label S R lumen above it and Cytosol below represents the cell membrane. The part of the structure that passes through the cell membrane is not labeled, but three differently colored structures are labeled in the cytosol. At left, a brown area is labeled Actuator domain (A). A green center area is labeled Phosphorylation domain (P) and a blue area to the right is labeled Nucleotide-binding domain (N). The illustration labeled (c) shows a two-part ribbon diagram of the P-class pump. The colors are the same as that of the space-filling threedimensional model. In the first ribbon diagram, the Ca superscript 2 plus ions travels from the cytosol to the center of the membrane area, N H subscript 3 is labeled in the brown area, phosphorylation site is labeled in the green area and A T P site is on the blue area. In the second ribbon diagram of the same subunit, Ca superscript 2 plus is in the S R lumen area outside of the cell membrane. The binding of ions to the pump illustrates a general principle of ion binding to membrane transport proteins that we will encounter
repeatedly in this chapter: as ions bind, they lose most of their waters of hydration, but interact with oxygen atoms in the transport protein that have a geometry similar to that of the water oxygen atoms that are bound to them in aqueous solution. This reduces the thermodynamic barrier for ion binding to the protein and allows the ion to bind tightly even from solutions of relatively low concentrations. The cytosolic region of the pump consists of three domains that are well separated from one another in the E1 state (see Figure 11-11b). Each of these domains is connected to the membrane-spanning helices by short segments of amino acids. Movements of these cytosolic domains during the pumping cycle cause movements of the connecting segments, which are transmitted into movements of the attached membrane-spanning α helices. For example, the phosphorylated residue, Asp 351, is located in the phosphorylation (P) domain. The adenosine moiety of ATP binds to the nucleotide-binding (N) domain, but the γ phosphate of ATP binds to specific residues on the P domain, requiring movements of both the N and P domains. Thus following ATP and binding, the γ phosphate of the bound ATP sits adjacent to the aspartate on the P domain that is to receive the phosphate. Although the precise details of these and other protein conformational changes are not yet clear, the movements of the N and P domains are transmitted by lever-like motions of the connecting segments into rearrangements of several membrane-spanning α helices. These changes are especially apparent in the four helices that contain the two -binding sites: the changes prevent the bound ions from moving back into the cytosol when released, but enable them to dissociate into the exoplasmic space (lumen).
The Na+/K+ ATPase Maintains the Intracellular Na+ and K+ Concentrations in Animal Cells
All P-class ATP-powered pumps, regardless of which ion they transport, are phosphorylated on a highly conserved aspartate residue during the transport process. As deduced from cDNA sequences, the catalytic α subunits of all the P-class pumps examined to date have similar amino acid sequences and thus are presumed to have similar arrangements of transmembrane α helices and cytosol-facing A (actuator), P, and N domains (see Figure 11-11). These findings strongly suggest that all such proteins evolved from a common precursor, although they now transport different ions. This suggestion is borne out by the finding that the threedimensional structures of the membrane-spanning segments of the ATPase and the pump are highly similar; the molecular structures of the three cytosolic domains are also very similar. Thus the operational model in Figure 11-11 is generally applicable to all of the Pclass ATP-powered pumps. The ATPase Maintains the Intracellular and Concentrations in Animal Cells An important P-class pump that is present in the plasma membranes of all animal cells is the ATPase. This ion pump is a tetramer of subunit composition and shares structural homology with the pump. The small, glycosylated β-transmembrane polypeptide apparently is not involved directly in ion pumping. During its catalytic cycle, the ATPase moves three ions out of and two ions into the cell per ATP molecule hydrolyzed.
The mechanism of action of the ATPase, outlined in Figure 1112, is similar to that of the muscle SR calcium pump, except that ions are pumped in both directions across the membrane, with each ion moving against its concentration gradient. In its E1 conformation, the ATPase has three high-affinity -binding sites and two low-affinity - binding sites accessible from the cytosolic surface of the protein. The for binding of to these cytosolic sites is 0.6 mM, a value considerably lower than the intracellular concentration of ; as a result, ions normally fully occupy these sites. Conversely, the affinity of the cytosolic -binding sites is low enough that ions, transported inward through the protein, dissociate from E1 and enter the cytosol despite the high intracellular concentration. During the transition, the three bound ions gain access to the exoplasmic face, and simultaneously, the affinity of the three -binding sites drops. The three ions, now bound to low-affinity sites, dissociate one at a time and enter the extracellular medium despite the high extracellular concentration. Transition to the E2 conformation also generates two highaffinity sites accessible from the exoplasmic face. Because the for binding to these sites (0.2 mM) is lower than the extracellular concentration (4 mM), these sites will fill with ions as the ions dissociate. Similarly, during the subsequent transition, the two bound ions are transported inward and then released into the cytosol.
FIGURE 11-12 Operational model of the plasma-membrane ATPase. Only one of the two catalytic α subunits of this P-class pump is depicted. It is not known whether just one or both subunits in a single ATPase molecule transport ions. Ion pumping by the ATPase involves phosphorylation, dephosphorylation, and conformational changes similar to those in the muscle ATPase (see Figure 11-11). In this case, hydrolysis of the E2–P intermediate powers the conformational change and concomitant transport of two ions inward. ions are indicated by red circles; ions, by purple squares; high-energy acyl phosphate bond, by ; low-energy phosphoester bond, by –P. Description The illustration shows a rectangular bar with the label exterior above it, and Cytosol below represents the cell membrane. A pink triangle on the cell membrane denotes a higher concentration of Na plus ions in the exterior of the membrane, and a blue triangle denotes a higher concentration of K plus ions in the cytosol. A threedimensional model of the P class subunit is represented in green (alpha subunit) next to the triangles. A blue oval labeled beta is next to the alpha subunit. Three Na plus ions is in the cytosol. The steps involved in the transport of ions between the cell membrane are as follows:
V-Class H+ ATPases Maintain the Acidity of Lysosomes and Vacuoles
Step 1. Na plus binding and A T P binding. A T P passes through the subunit from the cytosol and 3 Na plus ions with an arrow points to the spots where they will bind in the subunit. Step 2. Phosphorylation of aspartate. A D P leaves the A T P binding site. A yellow circle with letter P that represents phosphate attaches to the bottom of the alpha subunit in the cytosol. Step 3. Conformational change. The alpha subunit opens toward the exterior. 2 K plus ions pass through the alpha subunit. Step 4. Na plus release, K plus binding. The 3 Na plus ions leave the alpha subunit and enter the exterior and K plus ions bind to their respective binding site. Step 5. Dephosphorylation and conformational change. The alpha subunit opens toward the cytosol. The inorganic phosphate molecule leaves the subunit. Step 7. K plus release. The 2 K plus ions leave the alpha subunit and enter the cytosol. Certain drugs (e.g., ouabain and digoxin) bind to the exoplasmic domain of the plasma-membrane ATPase and specifically inhibit its ATPase activity. The resulting disruption in the balance of cells is strong evidence for the critical role of this ion pump in maintaining the normal and ion concentration gradients. Classic Experiment 11-1 describes the discovery of this important pump, which is required for life. V-Class ATPases Maintain the Acidity of Lysosomes and Vacuoles All V-class ATPases transport only ions. These proton pumps, present in the membranes of lysosomes, endosomes, and plant vacuoles, function to acidify the lumina of these organelles. The pH of the lysosomal lumen can be measured precisely in live cells by use of particles labeled with a pH-sensitive fluorescent dye. When these particles are added to the extracellular fluid, the cells engulf and internalize them (phagocytosis; see
Figure 1-19 and Chapter 17), ultimately transporting them into lysosomes. The lysosomal pH can be calculated from the spectrum of the fluorescence emitted. Alternatively, the DNA encoding a naturally fluorescent protein whose fluorescence depends on the pH can be modified (by adding DNA segments encoding “signal sequences,” detailed in Chapters 13 and 14) such that the protein is targeted to the lysosome lumen; fluorescence measurements can then be used to determine the pH in the organelle lumen. These measurements reveal that a hundredfold or more proton gradient is maintained between the lysosomal lumen (pH ) and the cytosol (pH ). The low lysosomal pH is necessary for optimal function of the many proteases, nucleases, and other hydrolytic enzymes in the lumen; on the other hand, a cytosolic pH of 5 would disrupt the functions of many proteins optimized to act at pH 7 and lead to death of the cell. Maintenance of the proton gradient depends on a V-class ATPase and thus on ATP production by the cell. Relatively few protons need to be pumped to acidify an intracellular vesicle. To understand why, recall that a solution of pH 4 has an ion concentration of moles per liter, or moles of ions per milliliter. There are atoms of H per mole (Avogadro’s number), so a milliliter of a pH 4 solution contains ions. Thus at pH 4, a primary spherical lysosome with a volume of ml (diameter of ) would contain just 252 protons. At pH 7, the same organelle would have an average of only 0.2 protons in its lumen, and thus
pumping of only about 250 protons would be necessary for lysosome acidification. By themselves, V-class proton pumps cannot acidify the lumen of an organelle (or the extracellular space) because these pumps are electrogenic; that is, a net movement of electric charge occurs during transport. Pumping of just a few protons causes a buildup of positively charged ions on the exoplasmic (inside) face of the organelle membrane. For each pumped across, a negative ion (e.g., or ) will be left behind on the cytosolic face, causing a buildup of negatively charged ions there. These oppositely charged ions attract each other on opposite faces of the membrane, generating a charge separation, or electric potential, across the membrane. The lysosome membrane thus functions as a capacitor in an electric circuit, storing opposing charges (anions and cations) on opposite sides of a barrier impermeable to the movement of charged particles. As more and more protons are pumped and build up excess positive charge on the exoplasmic face, the energy required to move additional protons against this rising electric potential gradient increases dramatically and prevents pumping of additional protons long before a significant transmembrane concentration gradient is established (Figure 11-13a). In fact, this is the way that P-class proton pumps generate a cytosolnegative potential across plant and yeast plasma membranes.
FIGURE 11-13 Effect of V-class proton pumps on concentration gradients and electric potential gradients across cellular membranes. (a) If an intracellular organelle contains only V-class pumps, proton pumping generates an electric potential across the membrane (the cytosolic face becomes negative and the luminal face positive) but no significant change in the intraluminal pH. (b) If the organelle membrane also contains channels, anions passively follow the pumped protons, resulting in an accumulation of and ions in the lumen (low luminal pH) but no electric potential across the membrane.
Description The illustration labeled (a) shows the lumen of an organelle and the cytosol. A V-class pump is represented with a sphere on a square and it is embedded in the membrane. The proton pump pumps protons into the lumen using A T P as a power source and generates an electric potential due to the difference in concentration of positively charged protons inside the lumen and negatively charged chloride in the cytosol. The pH remains neutral. The illustration labeled (b) shows the lumen and the cytosol. A Vclass proton pump and a chloride ion channel are embedded in the membrane. Using A T P as a power source, protons are pumped into the lumen, at the same time the chloride ions also enter the lumen, resulting in an acidic pH without electric potential. In order for an organelle lumen or an extracellular space (e.g., the lumen of the stomach) to become acidic, movement of protons must be accompanied either by (1) movement of an equal number of anions (e.g., ) in the same direction or by (2) movement of equal numbers of a different cation in the opposite direction. The first process occurs in lysosomes and plant vacuoles, whose membranes contain V-class ATPases and anion channels through which accompanying ions move (Figure 11-13b). The second process occurs in the lining of the stomach, which contains a P-class ATPase that is not electrogenic and pumps one outward and one inward. Operation of this pump is discussed later in the chapter. The V-class proton pumps in lysosomal and vacuolar membranes have been solubilized, purified, and incorporated into liposomes for further study. As shown in Figure 11-14, these pumps consist of two discrete domains: a soluble hydrophilic domain ( ) on the cytosolic side, and a ringlike transmembrane domain ( ). and are linked by three
peripheral stalk structures. The and domains each function as rotary motors. ATP hydrolysis by the domain is coupled to proton translocation through the membrane by means of the rotation of both domains. More specifically, ATP hydrolysis triggers conformational changes that drive the rotation of by 120° per molecule of ATP hydrolyzed. The rotation of in turn generates a torque that drives the rotation of the c-subunits against the a subunits in , resulting in proton translocation across the membrane.
FIGURE 11-14 Eukaryotic V-ATPase: rotation of and domains drive proton transport across the membrane. (a) The structure of yeast vacuolar V-ATPase as determined by cryo-electron microscopy reveals separate cytosolic and transmembrane domains. (b) Cartoon of the pump. (c) Top: Cross-sectional view of . The three nucleotide binding sites in exist in three distinct conformations: tight, with ATP bound; loose, with ADP bound; and open, without any nucleotide bound. Each hydrolysis of ATP triggers a 120° rotation of relative to . Bottom: Rotation of the c subunits in against the a subunit drives proton translocation from the cytosol to the lumen via a series of protonation and deprotonation of glutamate and aspartate residues. [Data from J. Zhao et al., 2015, Nature 521:241.]
Description The illustration labeled (a) shows a detailed ribbon diagram of a eukaryotic v pump in yeast. The top two-thirds of the diagram is labeled V subscript 1 and the bottom onethird is labeled V subscript 0. The differently colored areas within the ribbon diagram are labeled with letters that match the letter labels of the schematic below. The illustration labeled (b) shows a schematic of the v pump in yeast, represented by ovals for each labeled part of the unit, with colors matched to the ribbon diagram above. The cell membrane is with the label Matrix (cytosolic) above it and Intermembrane space (exoplasmic) labeled below the membrane. The bottom one-third of the diagram is in the cytosol area. This area has a large arrow pointing to a highlight of it in part (c). An arrow from the section above the membrane also has an arrow to a highlight. The illustration labeled (c) shows a close-up view of the structure above matrix with two diagrams labeled Rotary catalysis in V subscript 1 region. The diagrams are like sixpetaled flowers. The left flower shape is labeled clockwise from top left: open, loose (with A D P), and tight (with A T P) the right flower shape is labeled clockwise from top left: Tight (with A T P) open, loose (with A D P). In a separate box, a close up from the cytosol area of the unit is labeled Proton translocation through V subscript 0 region. This shows a circular view from the top of the subunit. There are 12 divisions in the circle, each labeled with a purple circle with a plus sign in it. Attached to the right side of this circular pattern is an orange area at which the purple plus circles is released. The second part of the view shows the green circle again and an arrow pointing toward left indicates the direction of movement of the unit. Recent cryo-electron microscopy structures of the subunit of a yeast vacuolar V-ATPase has yielded molecular insights into how protons are translocated through the membrane by . These studies revealed the presence of two negatively charged cavities: one gives access to the cytosolic side of the membrane and the other to the luminal side. Positively charged amino acid residues form a barrier in the middle of the membrane that separates the two cavities. Protons enter the cavity on the cytosolic side, and conserved glutamates or aspartates undergo a cycle of
ABC Proteins Export a Wide Variety of Drugs and Toxins from the Cell
protonation and deprotonation as the protons translocate through the pore into the lumen of the vacuole (Figure 11-14b). The rotation of the subunits closes access to the cytoplasm and traps the proton within the pump, and further rotation then releases the protons to the lumen of the vacuole. ABC Proteins Export a Wide Variety of Drugs and Toxins from the Cell About 50 different mammalian ABC proteins are now recognized, and mutations in these proteins have been linked to many human diseases (Table 11-3). In eukaryotic cells, ABC proteins localize not only to the plasma membrane but also to the membranes of many intracellular organelles. Several are expressed in abundance in the liver, intestines, and kidneys — sites where natural toxic and waste products are removed from the body. Substrates for these ABC proteins include sugars, amino acids, cholesterol, bile acids, phospholipids, peptides, proteins, toxins, and foreign substances. The normal function of ABCB1 most likely is to transport various natural and metabolic toxins into the bile or intestinal lumen for excretion or into the urine being formed in the kidney. During the course of its evolution, ABCB1 appears to have acquired the ability to transport drugs whose structures are similar to those of these endogenous toxins. Tumors derived from MDR-expressing cell types, such as hepatomas (liver cancers), are frequently resistant to virtually all chemotherapeutic agents and are thus difficult to treat, presumably because the tumors exhibit increased expression of ABCB1 or a related ABC protein.
TABLE 11-3 • Selected Human ABC Proteins Protein Tissue Expression Function Disease Caused by Defective Protein
(MDR1) Many epithelia, blood-brain barrier Exports glucosylceramides and lipophilic drugs Inflammatory bowel disease
(MDR2) Liver Exports phosphatidylcholine into bile
Liver Exports bile salts into bile Progressive familial intrahepatic cholestasis
Exocrine tissue Transports Cl ions Cystic fibrosis
Ubiquitous in peroxisomal enzyme Influences activity of peroxisomal enzyme that oxidizes very long chain fatty acids Adrenoleukodystrophy (ADL)
Liver, intestine Exports cholesterol and other sterols β-Sitosterolemia
Ubiquitous Exports cholesterol and phospholipid for uptake into high-density lipoprotein (HDL) Tangier’s disease
Retina Transports N-retinylphosphatidylethanolamine Stargardt’s disease in photoreceptor cells (juvenile macular degeneration)
Brain, kidney, heart, lung Exports cholesterol Alzheimer’s disease
Lung Exports surfactant lipids Surfactant metabolism dysfunction 3
Liver Exports long-chain phosphatidylcholines Progressive familial intrahepatic cholestasis 3
Liver, kidney, intestines Exports bilirubin, bile salts Dubin-Johnson
Ubiquitous Exports very long chain fatty acids Adrenoleukodystrophy
Liver, intestine Exports cholesterol, plant sterols Sitosterolemia
Liver, intestine Exports cholesterol, plant sterols Sitosterolemia, gallstones As noted earlier, all members of the very large and diverse ABC superfamily of membrane transport proteins contain two transmembrane (TM) domains and two cytosolic ATP-binding (A) domains (see Figure 119). The TM domains, each built of 10 membrane-spanning α helices, form the pathway through which the transported substance (substrate) crosses the membrane (Figure 11-15a) and determine the substrate specificity of each ABC protein. The sequences of the A domains are approximately 30–
40 percent homologous in all members of this superfamily, indicating a common evolutionary origin.
FIGURE 11-15 The multidrug transporter ABCB1 (MDR1): Structure and model of ligand export. (a) Cross-sectional view through the center of an ABCB1 protein bound to two molecules of a drug analog, qz59-sss (black), reveals the central location of the ligandbinding site in relation to the phospholipid bilayer: the central ligand-binding cavity is close to the leaflet-leaflet interface of the membrane. During transport, this binding cavity is alternately exposed to the exoplasmic and the cytosolic surface of the membrane. Serines 289 and 290 affect the ligand specificity of the transporter; they are shown as red spheres to highlight their juxtaposition to the bound ligand. Surface residues are colored yellow to denote hydrophobic and blue to denote hydrophilic amino acids. (b) Three-dimensional structure of ABCB1 with its ligand-binding site facing inward toward the cytosol. In this conformation, a hydrophilic ligand can bind directly from the cytosol. A more hydrophobic ligand can enter into the inner leaflet of the plasma membrane bilayer and then enter the ligand-binding site through a gap in the protein that is accessible directly from the hydrophobic core of the inner leaflet. (c) Model for the structure of ABCB1 with its ligandbinding site facing outward, based on the structures of homologous bacterial ABC proteins. When the protein assumes this conformation, the ligand can either diffuse into the exoplasmic leaflet or directly into the aqueous extracellular medium. (d) Cryo-electron microscopy structure of human ABCG2 in the ADP-bound, inward-facing state, revealing a large cavity facing the cytosol into which the substrate can enter. (e) ions, which are important for ATP binding and activity, are shown as light green spheres. ATP (yellow spheres) binding triggers rotation of the α helices, compression of the large cavity, and extrusion of the substrate outside of the cell. [Data from S. G. Aller et al., 2009, Science 323:1718–1722, PDB ID 3g61; and I. Manolaridis et al., 2018, Nature 563:426–430, PDB ID 6FEQ.] Description The illustration shows a sliced view of the transmembrane protein. The protein has an upside-down V shape, where the apex points slightly out of the exterior of the membrane. The illustration labeled (a) shows two A T P binding domains in the interior of the cell. Near the mutual regions of the two leaflets, are a bound molecule of q z 59s s s and two close by serine residues (289 and 290). The cell membrane is represented as a gray rectangle with the protein going through it. Outside the cell membrane is the label transmembrane domains. Inside of the membrane is the label A T P-binding
domains. The illustration labeled (b) shows the two space-filling three-dimensional models of the same protein. The protein looks like an upside-down V, arrows are labeled Gap, and two red circles are going from inside the membrane to the cytosol. The illustration labeled (c) shows the V-shaped protein. The gap is labeled, and the red circles are moving from the upper membrane to outside of the membrane. The illustration labeled (d) shows a ribbon diagram of the same protein. In this diagram, the left side of the protein is blue, the right side, pink, and the red circle is inside the gap and labeled E 1 S. The labels near and above the E 1 S reads, plug and external cavity. The illustration labeled (e) shows the same protein with the external cavity labeled E 1 S, which is in the outside of the cell membrane. Inside of the protein is labeled A T P and M g superscript 2 plus. Below both illustrations (d) and (e) is a shared arrow labeled 2 A D P plus 2 P subscript i. The first eukaryotic ABC protein to be recognized was discovered during studies on tumor cells and cultured cells that exhibited resistance to several drugs with unrelated chemical structures. Such cells were eventually shown to express elevated levels of a multidrug-resistance (MDR) transport protein originally called MDR1 and now known as ABCB1. This protein uses the energy derived from ATP hydrolysis to export a large variety of drugs from the cytosol to the extracellular medium. The Mdr1 gene is frequently amplified in multidrug-resistant cells, resulting in a large overproduction of the ABCB1 protein. In contrast to bacterial ABC proteins, which are built of four discrete subunits, all four domains of mammalian ABCB1 are fused into a single 170-kDa protein. The substrates of mammalian ABCB1 are primarily planar, lipid-soluble molecules with one or more positive charges; they all compete with one another for transport, which suggests that they bind to the same or
overlapping sites on the protein. Many drugs transported out of the cell by ABCB1 have earlier diffused into the cell cytosol from the extracellular medium across the plasma membrane, unaided by transport proteins. Once in the cell, they block various cellular functions. Two such drugs, used to treat certain cancers, are colchicine and vinblastine, which block assembly of microtubules (see Chapter 18). ATP-powered export of such drugs by MDR1 reduces their concentration in the cytosol. As a result, a much higher extracellular drug concentration is required to kill cells that express ABCB1 than those that do not. That ABCB1 is an ATP-powered smallmolecule pump has been demonstrated with liposomes containing the purified protein. Different drugs enhance the ATPase activity of these liposomes in a dose-dependent manner corresponding to their ability to be transported by ABCB1. The three-dimensional structure of ABCB1, together with those of homologous bacterial and eukaryotic ABC proteins, revealed the protein’s mechanism of transport as well as the key to its ability to bind and transport a wide array of hydrophilic and hydrophobic substrates (see
Figure 11-15). The two TM domains form a binding site in the center of the membrane that alternates between an inward-facing (Figure 11-15b) and an outward-facing (Figure 11-15c) orientation, conforming to the alternating access model. The alternation between these two conformational states is powered by ATP binding to the two A subunits and its subsequent hydrolysis to ADP and . The substrate-binding cavity formed by ABCB1 is large. Some of the amino acids that line the cavity — mainly tyrosine and phenylalanine —
have aromatic side chains, allowing ABCB1 to bind multiple types of hydrophobic ligands. Other segments of the cavity are lined with hydrophilic residues, allowing hydrophilic or amphipathic molecules to bind. In the inward-facing conformation, the binding site is open directly to the surrounding aqueous solution, allowing hydrophilic molecules to enter the binding site directly from the cytosol. In addition, a gap in the protein is accessible directly from the hydrophobic core of the inner leaflet of the membrane bilayer; through this gap hydrophobic molecules can enter the binding site directly from the inner leaflet (see Figure 1115b). After the ATP-powered change to the outward-facing conformation, molecules can exit the binding site into the outer membrane leaflet or directly into the extracellular medium (see Figure 11-15c). The human ABCG2 structure has recently been determined in substrateand ATP-bound states. This structure provided additional insights into the mechanisms underlying ATP-driven substrate translocation (Figure 1115d, e). ABCG2 is also known as the Breast Cancer Resistance Protein and its expression levels are correlated with a poor outcome in breast as well as other cancers. A clever experimental strategy made use of a mutant form of ABCG2 that exhibits decreased rates of transport and of ATP hydrolysis. High-resolution cryo-electron microscopy was used to capture the transporter bound to the substrate in the internal facing, pretranslocation state and bound to ATP in the post-translocation state. These studies revealed a large substrate-binding cavity in the internal-facing state, with a plug creating a smaller cavity toward the external-facing part of the protein. ATP binding triggered rotation of the α helices of the A domains, compressing the substrate-binding cavity and extruding the
Certain ABC Proteins “Flip” Phospholipids and Other Lipid-Soluble Substrates from One Membrane Leaflet to the Other
substrate through the plug to the external cavity, with release of the substrate to the outside. While not clear, ATP hydrolysis may be required to return the protein transporter to the inward-facing state. Certain ABC Proteins “Flip” Phospholipids and Other LipidSoluble Substrates from One Membrane Leaflet to the Other As shown in Figure 11-15, ABCB1 and ABCG2 can move, or “flip,” a hydrophobic or amphipathic substrate molecule from the inner leaflet of the membrane to the outer leaflet. This otherwise energetically unfavorable reaction is powered by the ATPase activity of the protein, and is required for maintaining the asymmetric distribution of phospholipids across the cytoplasmic and exoplasmic membrane leaflets (Chapter 10) and for transporting lipids across cellular membrane. Support for this socalled flippase model of transport by ABCB1 comes from experiments on ABCB4 (originally called MDR2), a protein homologous to ABCB1 that is present in liver cells in the region of the plasma membrane that faces the thin tubes (canaliculi) that collect bile. ABCB4 moves phosphatidylcholine from the cytosolic to the exoplasmic leaflet of the plasma membrane for subsequent release into the bile in combination with cholesterol and bile acids, which themselves are transported by other ABC superfamily members. Still other ABC superfamily members are also
flippases that export various lipids from cells, presumably by mechanisms similar to that of ABCB1 (see Table 11-3). The flipping of lipids across membranes is required for the generation of glycoproteins within the endoplasmic reticulum in eukaryotic cells or the periplasm of prokaryotes (see Chapter 13). This process provides a way to get the hydrophilic oligosaccharides needed to form glycoproteins across the hydrophobic membrane. In this process, oligosaccharides are added to the cytosolic side of long polyisoprenol membrane lipids to form lipidlinked oligosaccharides (LLOs). These LLOs are then flipped across the membrane into the endoplasmic reticulum (or into the periplasm in prokaryotes) so that the oligosaccharides can be transferred to membrane and secreted proteins to generate glycoproteins. Recent x-ray crystal structures of a dimeric ABC transporter from Campylobacter jejuni (a bacteria that commonly causes food poisoning) that mediates flipping of LLOs across the membrane captured the transporter in inward- and outward-facing states. These structures revealed a novel lipid-flipping mechanism (Figure 11-16d). Initially, the lipid tail of a lipid-linked oligosaccharide (LLO) binds the extracellular-facing helix of one of the flippase subunits (step 1 ). Its binding promotes exchange of ATP for ADP, triggering the dimer to convert to an outward-open state (step 2 ) that allows the hydrophilic oligosaccharide head of the LLO to enter the positively charged pore of the transporter (step 3 ). ATP hydrolysis drives the return of the dimer to an inward-open conformation, squeezing the LLO head to the outward side of the membrane (step 4 ). The LLO lipid tail then dissociates from the flippase and extends into the cytosolic side of the membrane. In this mechanism, the transporter protects the
hydrophilic oligosaccharide head of the LLO from the hydrophobic milieu of the membrane, allowing the lipid tails to flip from one side of the membrane to the other.
FIGURE 11-16 An ABC transporter from Campylobacter jejuni flips lipid-linked oligosaccharides across the membrane. (a) The inward-facing structure of the PglK ABC transporter, with a larger cavity facing the cytosol. Subunits are shown in peach and purple, with the extracellular-facing helix (EH) labeled. (b) The ADP-bound, outward-facing structure in which the cytosolic cavity is occluded. (c) The conversion of inward- to outward-facing states is associated with conformational changes. (d) In the proposed model for the flippase mechanism, the PglK subunits are shown as cartoon-like structures in peach and purple, with the EH labeled. The lipid tail of the LLO is yellow and the oligosaccharide head light purple. The lipid tail interacts with the EH (step 1 – 2 ); ATP replaces ADP, which opens the cytosolic cavity (step 2 ), into which the large oligosaccharide head of the LLO enters (step 3 ); ATP hydrolysis triggers conformational changes that achieve occlusion of the cytosolic cavity, dislodging and ejecting the oligosaccharide head into the periplasm (step 4 ) and flipping the direction of the lipid tail within the membrane. [Information from C. Perez et al., 2015, Nature 524:433–438.] Description The illustration labeled (a) shows a ribbon diagram of the transporter with an upsidedown V shape. The cell membrane is represented as a gray rectangle with the ribbon diagram going through it. The bottom of the v shape outside the membrane is labeled E H on both parts. Below the diagram is the label Apo-inward-1. The illustration labeled (b) shows the same transporter but the angles of the v are close together. A D P is labeled in yellow toward the bottom inside the cell. The label reads A D P-bound outward-occluded. The illustration labeled (c) shows a V shaped ribbon diagram, where the V shape is turned and shows the third leg. The leftmost leg is labeled T M 5, T M 4. An arrow moving from this leg to the middle one is labeled 40 degrees. The right side has a label, T M 6. The illustration labeled (d) shows a cycle diagram of the protein in action. Step 1 is labeled with the cell membrane and the E H labels. It has 2 A D P at the bottom. There is a yellow ribbon separate from this transporter with an arrow indicates that it is moving toward the transporter. In step 2, the V has opened at the outside of the membrane and the two A D P ovals are converted into A T P. Between steps 1 and 2 is an arrow labeled 2 A T P to 2 A D P. The yellow ribbon has moved downward into the transporter. Step 3 shows the yellow ribbon moving out of the
The ABC Cystic Fibrosis Transmembrane Regulator Is a Chloride Channel, Not a Pump
transporter. No new labels. Step 4 shows the yellow ribbon coming out of the transporter and the two ovals are converted into A D P. The ABC Cystic Fibrosis Transmembrane Regulator Is a Chloride Channel, Not a Pump Several human genetic diseases are associated with defective ABC proteins (see Table 11-3). The most common (1 in 2500 births) is cystic fibrosis (CF), caused by a mutation in the gene encoding the cystic fibrosis transmembrane regulator (CFTR, also called ABCC7). Like other ABC proteins, CFTR has two transmembrane TM domains and two cytosolic ATP-binding domains (A domains). CFTR contains an additional R (regulatory) domain on the cytosolic face; R links the two homologous halves of the protein, creating an overall domain organization of TM1– A1–R–TM2–A2. CFTR is a channel that opens upon phosphorylation and ATP binding to allow anions to flow down their electrochemical gradient. It is expressed in the apical plasma membranes of epithelial cells in the lungs, sweat glands, pancreas, and other tissues, and mutations in the protein decrease the capacity of these membranes to transport For instance, CFTR protein is important for reuptake into the cells of sweat glands of lost by sweating; babies with cystic fibrosis, if licked, often taste salty because this reuptake is inhibited. Over time, as a result of disrupted salt and water homeostasis, patients with cystic fibrosis accumulate dehydrated mucus in their lungs and other tissues, leading to
chronic respiratory infections and digestive system disorders, which can ultimately result in organ failure. Until recently, our understanding of CFTR channel structure and function was derived from biochemical and biophysical studies, along with x-ray crystal structures of fragments of the CFTR protein. In 2017, however, the high-resolution structures of the full-length zebrafish and human CFTR channels were solved using cryo-electron microscopy (Figure 11-17). While it was known that the channel was gated by phosphorylation and ATP binding, comparison of the structure of open and closed CFTR channels revealed the major conformational changes produced by phosphorylation and ATP binding to open the channel. These structures show that channel gating is regulated by two processes: phosphorylation of the cytosolic R domain by cAMP-dependent protein kinase (PKA, discussed in Chapter 15), followed by binding of ATP to the cytosolic A domains. In the unphosphorylated state, the R domain is wedged between transmembrane α helices, keeping the A1 and A2 domains apart and blocking the anion channel. Phosphorylation by PKA triggers a conformational change that moves the R domain away from the A1 and A2 interface, and, following ATP binding, the two A domains dimerize, narrowing (but not closing) the opening of the channel on the cytosolic side and widening it on the extracellular side of the membrane, allowing the anions to flow through the channel. The ion channel pathway is lined with positively charged amino acids, making the channel specific for conductance of anions.
FIGURE 11-17 Structure and function of the cystic fibrosis transmembrane regulator (CFTR). (a) Ribbon structures of the human CFTR in the dephosphorylated, ATP-free state on the left and in the phosphorylated, ATP-bound state on the right. The unresolved regions of the structure are shown as thin red lines, and unstructured regions within the R domain are shown in pink. Phosphorylation of the R domain moves it out of the ATP-binding region and allows ATP binding and dimerization of the two ATP-binding (A) domains. This narrows the opening on the cytosolic side, with a widening of the pore on the extracellular
side of the membrane. (b) A cartoon of the CFTR, with each subunit of the dimer shown in purple and peach. In the unphosphorylated, ATP-free state, the R-domain (shown as a red line) is wedged between the two subunits. Phosphorylation of R moves it out of the region between the two subunits, ATP binds and the two ATP-binding (A) sites dimerize. Dimerization narrows the channel on the cytosolic face and opens the channel on the extracellular face so that the chloride ions can travel through the pore (lined with positively charged amino acid residues) down its electrochemical gradient. [Data from Z. Zhang et al., 2017, Cell 170:483; and Z. Zhang et al., 2018, Proc. Nat'l Acad. Sci. USA 115:12757.] Description The illustration labeled (a) shows ribbon diagrams of the transmembrane regulator. The cell membrane is represented as a gray rectangle with the ribbon diagram going through it. Outside is labeled above the cell membrane and inside is labeled below the cell membrane. The ribbon structure is labeled T M D 1 on the left and T M D 2 on the right. Also labeled in the cytosol area of this regulator on the left is Lasso and A 1. On the right side, 5 angstroms are labeled along with the R domain and A 2. Text below the diagram reads, dephosphorylated, A T P free. Right side of the illustration shows the same structure with the R domain labeled and 20 angstroms. The ATP is yellow and labeled. Text below the diagram reads, phosphorylated, A T P bound. A red tiny ribbon comes out of the R domain on both diagrams. The illustration labeled (b) shows a three-step pattern of action for this regulator. Outside is labeled above the cell membrane and inside is labeled below the cell membrane. In the left diagram, there is the label Dephosphorylated closed. There are circles with negative charges, 3 inside the inverted V shape, and 3 above it with the label C l minus. The tiny red ribbon is between the halves of the inverted V inside the cytosol. The center diagram is labeled phosphorylated R domain removed. The tiny red ribbon is now moving around the outside of one leg to the other one and has two yellow circles labeled P on it. The last diagram shows the inverted V closed up with the top split open to the outside of the cell. It is labeled A T P-bound open.
About two-thirds of all CF cases can be attributed to a single mutation in CFTR: deletion of Phe 508 (F508del) in the ATP-binding A1 domain. At body temperature, the mutant protein fails to fold properly and to move to the cell surface, where it normally functions. Interestingly, if cells expressing the mutant protein are incubated at room temperature, the protein folds and accumulates normally on the plasma membrane, where it functions nearly as well as the wild-type CFTR channel. Recently, a series of small molecules have been chemically synthesized that bind to this mutant CFTR protein in CF patients and stabilize the folded form at 37 °C, allowing it to traffic normally to the cell surface and partially reverse the effects of the disease. These molecules are known as CFTR correctors. They only promote the cell surface trafficking of a fraction of CFTR channels and thus only partially reverse the effects of the disease. Another CFTR mutation, Gly 551 to Asp (G551D), accounts for approximately 5 percent of CF cases and results in a channel that folds normally and accumulates normally on the plasma membrane but is defective in transport because the mutation disrupts ATP binding. In 2012, a small molecule drug called Ivacaftor, which increases the flow of ions through the mutant channel, was approved by the U.S. Food and Drug Administration (FDA) to treat CF patients whose disease is caused by this mutation. This drug, known as a CFTR potentiator, represents one of the first successful personalized therapies resulting from a molecular understanding of the disease-causing protein. Recently, the FDA has approved treatment of F508del cystic fibrosis patients with a combination of CFTR correctors and the CFTR potentiator Ivacaftor, which increases the flow of ions through those channels that do reach the plasma
membrane. This drug combination exemplifies the use of targeted combination drug therapies resulting from detailed molecular understanding of how specific mutations cause disease. KEY CONCEPTS OF SECTION 11.3 ATP-Powered Pumps and the Intracellular Ionic Environment Four classes of transmembrane proteins couple the energy-releasing hydrolysis of ATP with the energy-requiring transport of substances against their concentration gradients: P-, V-, and F-class pumps and ABC proteins (see Figure 11-9). The combined action of P-class ATPases in the plasma membrane and homologous ATPases in the plasma membrane or SR creates the usual ionic milieu of animal cells: high , low , and low in the cytosol; low , high , and high in the extracellular fluid. In P-class pumps, phosphorylation of the α (catalytic) subunit and changes in conformational states are essential for coupling ATP hydrolysis to transport of , , , or ions (see Figures 11-10 through 11-13). V- and F-class ATPases, which transport protons exclusively, are large, multisubunit complexes with a proton-conducting channel in the transmembrane domain and ATPbinding sites in the cytosolic domain. V-class proton pumps in animal lysosomal and endosomal membranes and plant vacuolar membranes are responsible for maintaining a lower pH inside the organelles than in the surrounding cytosol (see Figure 11-14). V- and F-class ATPases transport protons across the membrane using a rotary motor mechanism. All members of the large and diverse ABC superfamily of membrane transport proteins contain four core domains: two transmembrane domains, which form a pathway for solute movement and determine substrate specificity, and two cytosolic ATP-binding domains (see Figure 11-15). The two T domains of the multidrug transporter ABCB1 form a ligand-binding site in the middle of the plane of the membrane; ligands can bind directly from the cytosol or from the inner-membrane leaflet through a gap in the protein. The ABC superfamily includes about 50 mammalian proteins (e.g., ABCB1, ABCA1) that transport a wide array of substrates, including toxins, drugs, phospholipids, peptides, and proteins, into or out of the cell.
Biochemical experiments directly demonstrate that ABCB4 (MDR2) possesses phospholipid flippase activity (see Figure 11-16). High resolution cryo-electron microscopy of a flippase from Campylobacter jejuni reveals a novel mechanism by which an ABC transporter flips a lipid-linked oligosaccharide across the membrane. CFTR, an ABC protein, is a channel, not a pump. Channel opening is triggered by protein phosphorylation and by binding of ATP to the two A domains (see Figure 11-17). Mutations in CFTR cause cystic fibrosis; small molecules targeting these mutations, classified as CFTR correctors and CFTR potentiators, are used to treat cystic fibrosis patients.
11.4 Nongated Ion Channels and the Resting Membrane Potential
11.4 Nongated Ion Channels and the Resting Membrane Potential We have just seen that ATP-powered ion pumps transport ions against their concentration gradients. In addition, the plasma membrane contains channel proteins that allow the principal cellular ions ( , , , and ) to move through them down their concentration gradients. Ion pumps and channels work together to generate a difference in voltage, or electric potential, across the plasma membrane. ATP-powered ion pumps generate differences in ion concentrations across the plasma membrane, and ions move selectively through ion channels down these concentration gradients (see Figure 11-3). All channel proteins have transmembrane domains that create a hydrophilic passage or pore for ions to travel through in order to cross the membrane. The size of the pore and the composition of the amino acids that line the pore determine which ions are transported through the channel. By allowing the passage of selective ions across the membrane, channels function to generate a tightly controlled electric potential across the membrane. In all cells, the magnitude of this electric potential is generally between 60 and 90 millivolts (mV), with the inside cytosolic face of the plasma membrane always negative with respect to the outside exoplasmic face. This value does not seem like much until we consider that the thickness of the plasma membrane is only . Thus the voltage gradient across
Selective Movement of Ions Creates a Transmembrane Electric Gradient
the plasma membrane is 0.07 V per cm, or 200,000 volts per centimeter! (To appreciate what this means, consider that high-voltage transmission lines for electricity use gradients of about 200,000 volts per kilometer, -fold less!) The ionic gradients and electric potential across the plasma membrane play crucial roles in many biological processes. As noted previously, and as described more fully in Chapter 15, a rise in the cytosolic concentration is an important regulatory signal, initiating contraction in muscle cells and triggering in many cells secretion of proteins, such as digestive enzymes from pancreatic cells. In many animal cells, the combined force of the concentration gradient and the membrane electric potential drives the uptake of amino acids and other molecules against their concentration gradients by symporters and antiporters (see
Figure 11-3 and Section 11.5). Furthermore, electrical signaling by neurons depends on the opening and closing of ion channels in response to changes in the membrane electric potential (see Chapter 23). Here we discuss the origin of the membrane electric potential in resting non-neuronal cells (often called the cell’s resting membrane potential). We also examine how ion channels mediate the selective movement of ions across a membrane and consider useful experimental techniques for characterizing the functional properties of channel proteins. We address the role of ion channels in electrical signaling in neuronal cells in Chapter 23.
Selective Movement of Ions Creates a Transmembrane Electric Gradient To help explain how an electric potential across the plasma membrane can arise, we first consider a set of simplified experimental systems in which a membrane separates a 15 mM NaCl/150 mM KCl solution in the cytosol (Figure 11-18a, left) from a 150 mM NaCl/15 mM KCl solution in the extracellular fluid (Figure 11-18a, right). A potentiometer (voltmeter) is connected to both solutions to measure any electric potential across the membrane. Initially, both solutions contain an equal number of positive and negative ions. If the membrane is impermeable to all ions, no ions will flow across it. Furthermore, there will be no difference in voltage, or electric potential gradient, across the membrane, as shown in Figure 1118a.
EXPERIMENTAL FIGURE 11-18 Generation of a transmembrane electric potential (voltage) depends on the selective movement of ions across a semipermeable membrane. In this experimental system, a membrane separates a 15 mM NaCl/150 mM KCl solution in the cytosol (left) from a 150 mM NaCl/15 mM KCl solution in the extracellular fluid (right); these ion concentrations are similar to those in cytosol and blood, respectively. If the membrane separating the two solutions is impermeable to all ions (a), no ions can move across the membrane, and no electric potential is registered on the potentiometer connecting the two solutions. If the membrane is selectively permeable only to (b) or only to (c), then diffusion of these ions through their respective channels leads to a separation of charge across the membrane. At equilibrium, the membrane potential caused by the charge separation becomes equal to the Nernst potential or registered on the potentiometer. In (b) and (c), the and cations are denoted by the pink plus signs and the anions are denoted by the light blue minus signs. See the text for further explanation. Description The illustration labeled (a) shows a beaker containing two solutions, one with a similar concentration of ions to the cytosol and the other to that of the extracellular medium. The solutions are separated by a membrane-impermeable to sodium, chloride, and potassium. The face of the membrane facing the cytosol-like solution is labeled cytosolic face, and that facing the extracellular medium is labeled the exoplasmic face. The concentration of the cell cytosol is 15 millimolar sodium chloride and 150 millimolar potassium chloride. The extracellular medium has the following concentrations: 150 millimolar sodium chloride and 15 millimolar potassium chloride. A potentiometer is connected across the two solutions. Two extremes are labeled on the potentiometer plus 60 and minus 60 millivolts. The membrane electric potential is zero. The illustration labeled (b) shows the membrane is permeable to potassium, and potassium ions and move from the cytosolic medium to the extracellular medium. This movement leads to a charge separation across the membrane, with a negative charge building up on the cytosolic face. The electric potential is equal to minus 59 millivolts. The illustration labeled (c) shows that the membrane is permeable to sodium, and sodium ions and move from the extracellular medium to the cytosolic medium. This
movement leads to a charge separation across the membrane, with positive charge building up on the cytosolic face. The electric potential is equal to plus 59 millivolts. Now suppose that the membrane contains channels that accommodate ions but exclude and ions (Figure 11-18b). ions then tend to move down their concentration gradient from the cytosol (left) to the extracellular fluid (right), leaving an excess of negative ions (light blue) compared with ions (pink) on the cytosolic (left) side and generating an excess of positive ions compared with ions on the extracellular (right) side. The excess in the extracellular (right) side and on the cytosolic (left) side remain near the respective surfaces of the membrane because the excess positive charges on one side of the membrane are attracted to the excess negative charges on the other side. The resulting separation of charge across the membrane constitutes an electric potential, or voltage, and the cytosolic (left) side of the membrane has excess positive charge with respect to the extracellular (right) side. As more and more ions move through channels across the membrane, the magnitude of this charge difference (i.e., voltage) increases. However, continued cytosol (left) to extracellular (right) movement of the ions is eventually inhibited by the mutual repulsion between the excess positive ( ) charges accumulated on the extracellular (right) side of the membrane and by the attraction of ions to the excess negative charges built up on the cytosolic (left) side. The system soon reaches an equilibrium point at which the two opposing factors that determine the movement of ions — the membrane electric potential and the ion concentration gradient — balance each other out. At equilibrium, there is
no net movement of ions across the membrane. Thus this membrane, like all cellular membranes, acts as a capacitor — a device consisting of a thin sheet of nonconducting material (the hydrophobic interior) surrounded on both sides by electrically conducting material (the polar phospholipid head groups and the ions in the surrounding aqueous solution) that can store positive charges on one side and negative charges on the other. If a membrane is permeable only to ions, then at equilibrium, the measured electric potential across the membrane equals the potassium equilibrium potential in volts, . The magnitude of is given by the Nernst equation, which is derived from basic principles of physical chemistry: (11-2) where R (the gas constant) = 8.28 joules/(degree ⋅ mol); T (the absolute temperature in degrees Kelvin) = 293 °K at 20 °C; Z (the charge, also called the valence) is here equal to ; F (the Faraday constant) = 96,500 coulombs/(mol ⋅ V); and and are the concentrations on the left and right sides, respectively, at equilibrium. By convention, the potential is expressed as the cytosolic face of the membrane relative to the exoplasmic face, and the equation is written with the ion concentration of the extracellular solution (here the right side of the membrane) placed in the numerator and that of the cytosol in the denominator.
The Resting Membrane Potential in Animal Cells Depends Largely on the Outward Flow of K+ Ions Through Open K+ Channels
At 20 °C (room temperature), Equation 11-2 reduces to (11-3) If , a tenfold ratio of concentrations as in Figure 1118b, then (or ), with the left, cytosolic side negative with respect to the right, exoplasmic side. If the membrane is permeable only to ions and not to or ions, then a similar equation describes the sodium equilibrium potential : (11-4) The magnitude of the membrane electric potential is the same (59 mV, for a tenfold difference in ion concentrations), but the cytosolic (left) side is now positive with respect to the extracellular (right) side (Figure 11-18c), so the polarity is opposite to that obtained across a membrane selectively permeable to ions. The Resting Membrane Potential in Animal Cells Depends Largely on the Outward Flow of Ions Through Open Channels
The plasma membranes of animal cells contain many open channels but few open , , or channels. As a result, the major ionic movement across the plasma membrane is the movement of from the inside outward, powered by the concentration gradient. This movement leaves an excess of negative charge on the cytosolic face of the plasma membrane and creates an excess of positive charge on the exoplasmic face, as in the experimental system shown in Figure 11-18b. This outward flow of ions is the major determinant of the insidenegative membrane potential. The channels through which the ions flow, called resting channels, alternate, like all channels, between an open and a closed state (see Figure 11-2), but since their opening and closing is not affected by the membrane potential or by small signaling molecules, these channels are referred to as nongated. In contrast, the various gated channels in neurons and other excitable cells (see Chapter 23) open only in response to specific ligands or to changes in membrane potential. Quantitatively, the usual resting membrane potential of approximately –60 mV is relatively close to the potassium equilibrium potential, calculated from the Nernst equation and the concentrations in cells and surrounding media (see Table 11-2; also note that the resting membrane potential can vary in different cell types from –60 to –90 mV). Usually the resting membrane potential is slightly lower (less negative) than that calculated from the Nernst equation because of the presence of a few open channels. These channels allow the net inward flow of ions, making the cytosolic face of the plasma membrane more positive — that is, less negative — than predicted by the Nernst equation for .
The ion would not flow inward at all if it were not for the presence of the concentration gradient. The concentration gradient that drives the flow of ions through resting channels is generated by the ATPase described previously (see Figures 11-3 and 11-12). In the absence of this pump, or when it is inhibited, the concentration gradient cannot be maintained, the membrane potential falls to zero, and the cell eventually dies. Although resting channels play the dominant role in generating the electric potential across the plasma membranes of animal cells, this is not the case in bacterial, plant, and fungal cells. The inside-negative membrane potential in plant and fungal cells is generated by transport of positively charged protons ( ) out of the cell by ATP-powered proton pumps, a process similar to what occurs in lysosomal membranes lacking channels (see Figure 11-13a): each pumped out of the cell leaves behind a ion, generating an inside-negative electric potential across the membrane. In aerobic bacterial cells, an inside-negative potential is generated by outward pumping of protons during electron transport, a process similar to proton pumping in mitochondrial inner membranes that will be discussed in detail in Chapter 12 (see Figure 12-19). The electric potential across the plasma membrane of a cell can be measured with a microelectrode inserted into the cell and a reference electrode placed in the extracellular fluid. The two electrodes are connected to a potentiometer capable of measuring small potential differences (Figure 11-19). The potential across the plasma membrane of most animal cells generally does not vary with time. In contrast, neurons
and muscle cells — the principal types of electrically active cells — undergo controlled changes in their membrane potential, as we discuss in
Chapter 23. EXPERIMENTAL FIGURE 11-19 The electric potential across the plasma membrane of a live cell can be measured. A microelectrode, constructed by filling a glass tube of extremely small diameter with a conducting fluid such as a KCl solution, is inserted into a cell in such a way that the plasma membrane seals itself around the tip of the electrode. A reference electrode is placed in the extracellular medium. A potentiometer connecting the two electrodes registers the potential — in this case, –60 mV, with the cytosolic face negative with respect to the exoplasmic face of the membrane. A potential difference is registered only when the microelectrode is inserted into the cell; no potential is registered if the microelectrode is in the extracellular fluid.
Ion Channels Are Selective for Certain Ions by Virtue of a Molecular Selectivity Filter
Description The illustration shows a plasma membrane as a gray line with positive charges above it and negative charges below it. A potentiometer is attached with one end to the cytosol below the plasma membrane and one end in the extracellular medium above the plasma membrane. The end inside the cytosol is labeled microelectrode filled with conducting salt solution. The end on the extracellular medium is labeled reference electrode in contact with the extracellular medium. The electrodes are connected to the potentiometer, and the reading points to minus 60. Ion Channels Are Selective for Certain Ions by Virtue of a Molecular Selectivity Filter All ion channels exhibit specificity for particular ions: channels allow ions, but not closely related ions, to enter them, whereas channels admit , but not . channels can be divided into four classes on the basis of their structure and function: the tandem-pore domain channels (constitutively open, e.g., the resting channel); ligand-activated channels; inwardly rectifying channels (transport positive ions more easily in the inward direction, into the cell), and voltage-gated channels (which we discuss in Chapter 23 in the context of their role in electrical signaling in neurons). All channels possess transmembrane helices that span the lipid bilayer, and all channels can be divided into a pore-forming domain and a regulatory domain. ions are transported through the pore-forming domain, whereas the regulatory domain opens or closes the pore in response to distinct stimuli. The
regulatory domain differs between classes, but the pore-forming domain is similar in all channels. Determination of the three-dimensional structure of a bacterial channel first revealed how the exquisite ion selectivity of channels is achieved, using a mechanism that has been shown to be conserved in the many bacterial and eukaryotic channel structures that have been solved in recent years. The similarity of the structural features that are used to generate ion selectivity suggest that all channels derived from a single type of channel protein. Like all other channels, bacterial channels are built of four identical transmembrane subunits symmetrically arranged around a central pore (Figure 11-20a, b). Each subunit contains two membrane-spanning α helices and a short P (pore) segment that partly penetrates the membrane bilayer from the exoplasmic surface. In the tetrameric channel, the eight transmembrane α helices (two from each subunit) form an inverted cone, generating a water-filled cavity called the vestibule in the central portion of the channel that extends halfway through the membrane toward the cytosolic side. Four extended loops that are part of the four P segments form the actual selectivity filter in the narrow part of the pore near the exoplasmic surface, above the vestibule.
FIGURE 11-20 Structure of a resting channel from the bacterium Streptomyces lividans. All channels are tetramers comprising four identical subunits, each containing two conserved membrane-spanning α helices, and a shorter P, or pore, segment. The gated channels have additional α helices and are described in Chapter 23. (a) Side view of the KcsA channel, with each monomer consisting of two transmembrane α helices and a pore that is selective for ions (purple spheres). (b) Top view of the channel, revealing its fourfold symmetry, with a ion in the pore. (c) Electronic density map of two diagonal subunits, showing the orientation of the carbonyl oxygen atoms (red) in coordinating the ions. (d) Four conserved Thr-Val-Gly-Tyr-Gly residues form the selectivity filter, with dehydrated ions stabilized by the negatively charged carbonyl groups so that they can translocate through the pore in single file. (e) The ions are in two conformations, either in S2 and S4, or in S1 and S3 during translocation, with water molecules (red spheres) in the vacant positions. [Data from Y. Zhou et al., 2001, Nature 414:43, PDB ID 1k4c; D. Naranjo, 2016, J. Gen. Physiol. 148:277; and Q. Kuang et al., 2015, Cell. Mol. Life Sci. 72:3677.] Description The illustration labeled (a) shows the tetrameric K plus channel. The ribbon diagram shows the purple colored K plus ions in the center of the channel. The cell membrane is represented as a gray rectangle with the K channel. On the left is labeled a pore helix, and in the center near the K plus ions is labeled selectivity filter. The illustration labeled (b) Exterior face, shows a top view of the K plus channel, with one purple circle in its center. The sensitivity filter is near the center and the pore helix is on the right side. The illustration labeled (c) K plus ions in the pore of a K plus channel (side view), shows a schematic with a detailed sensitivity filter and a pore helix on the left, a column of purple K plus circles down the middle. The right side shows the same parts with the label D 80 near the top of the sensitivity model and E 71 labeled at the top of the pore helix. Water molecules are represented as red circles and are at the top and the bottom of the diagram. The illustration labeled (d) Ion movement through selectivity filter, shows a closer view of the sensitivity filter with the area on the right labeled from top to bottom D 80, G 79, Y 78, G 77, V 76, T 75. A separate small view shows a K plus ions surrounded by water molecules. The illustration labeled (e) Ion movement through the selectivity filter, shows the exploded view of illustration (d). The left side of the filter labeled S 0, S 2, S 4 each with a K plus blue circle and between the exploded center
parts of the filter are the numbers G 79, Y 78, G 77, V 76, T 75, each pointing to a location on both sides from top to bottom. On the right side of this center area, the K plus ions are labeled S ext, S 1, S 3. Several related pieces of evidence support the role of P segments in ion selection. First, the amino acid sequences of the P segments in all known channels are highly homologous and are different from those in other ion channels. Second, mutations of certain amino acids in this segment alter the ability of a channel to distinguish from Finally, replacing the P segment of a bacterial channel with the homologous segment from a mammalian channel yields a chimeric protein that exhibits normal selectivity for over other ions. Thus all channels are thought to use the same mechanism to distinguish from other ions. The selectivity filter in channels is able to select over due mainly to the backbone carbonyl oxygen atoms on residues located in a Thr-Val-Gly-Tyr-Gly sequence that is found in an analogous position in the P segment in every known channel (note that in some channels, the Tyr residue is a Phe). As a ion enters the selectivity filter, it passes into the narrow space between the filter sequences of the four P-segments contributed by the four adjacent subunits. There the ion loses its eight waters of hydration, but is bound in the same geometry to eight backbone carbonyl oxygen atoms of the Thr-Val-Gly-Tyr-Gly sequence, two from the extended loop in each of the four P segments lining the channel (Figure 11-20c, d). These carbonyl oxygen atoms form four evenly spaced ion binding sites which can bind to four ions. These protein oxygen atoms mimic the oxygen in water, and as such, the activation
energy required for passage of ions into the channel from an aqueous solution is low. The ease of passage into the channel in turn raises the question of how ions are released from their binding sites in the P-segment to allow rapid transport. Analysis of ion occupancy revealed that only two ions are present in the P segment at a time, either in the S1 and S3 conformation, or in the S2 and S4 conformation (Figure 11-20e), with two water molecules occupying the other, vacant sites. The finding that ions move through the channel at near the diffusion limit suggests that the binding of to the sites in P segment is weak, with repulsion of the two ions in the P segment promoting their transport through the pore. ions are smaller than ions. How, then, can a channel protein exclude smaller , yet allow passage of larger ? The answer to this question is simple and elegant. A dehydrated ion is too small to bind to all eight carbonyl oxygen atoms that line the selectivity filter with the same geometry as a ion surrounded by its normal eight water molecules in aqueous solution. As a result, ions “prefer” to remain in water rather than enter the selectivity filter, and thus the change in free energy for entry of ions into the channel is relatively high (Figure 1121a, right). This difference in free energies favors passage of ions through the channel over ions by a factor of 1000. Like , the dehydrated ion is smaller than the dehydrated ion and cannot interact properly with the oxygen atoms in the selectivity filter. Furthermore, because a ion has two positive charges and binds water oxygen atoms more tightly than does a single positive or ion,
more energy is required to strip the waters of hydration from than from or .
FIGURE 11-21 Mechanism of ion selectivity and transport in resting channels. (a) Schematic diagrams of and ions hydrated in solution and in the pore of a channel. As ions pass through the selectivity filter, they lose their bound water molecules and become bound instead to eight backbone carbonyl oxygen atoms (four of which are shown) that are part of the conserved amino acid sequence in the channel-lining selectivity filter loop of each P segment. The smaller ions, with their tighter shell of water molecules, cannot perfectly bind to the channel oxygen atoms and therefore pass through the channel only rarely. (b) Overlay of the selectivity filters in the KcsA channel (pink) and the NavAb channel (yellow). The selectivity pore in the NavAb channel is wider and shorter than the selectivity filter in the KcsA channel. See C. Armstrong, 1998, Science 280:56. [Data from R. F. Stephens et al., 2015, Front. Physiol. 6:153.] Description The illustration labeled (a), K plus and Na plus ions in the pore of a K plus channel (top view) shows the ions (purple K plus on the left and red Na plus on the right) surrounded by water molecules. In the top diagrams for each ion labeled K plus and Na plus in water, the H from water is represented as 2 white circles, and O as red circles and in the bottom diagrams for each ion labeled K plus and Na plus in pore, the H disappears and two oxygen from Na plus dissociates. The illustration labeled (b), Overlay of Na plus and K plus selectivity filters shows three-dimensional stick models. The stick model on the left is labeled site H F S E 177, site C E N L 176, Site I N T 175, and on the right is labeled K plus channel, N a v A b, S 3, S 4. The first three-dimensional crystal structure of a bacterial voltage-gated channel was determined in late 2011. This structure showed that the channel contains an ion selectivity filter that is slightly larger than the filter in channels, and that it transports hydrated rather than dehydrated ions (Figure 11-21b). The structures of multiple eukaryotic voltage-gated channels have been solved in recent years.
Patch Clamps Permit Measurement of Ion Movements Through Single Channels
We will examine these structures and their function in electrical signaling in neurons in more detail in Chapter 23. Patch Clamps Permit Measurement of Ion Movements Through Single Channels Once it was realized that there are only one or a few ion channels per square micrometer of plasma membrane in most cells, it became possible to record ion movements through single ion channels, using a technique known as patch clamping. This technique measures the rates at which these channels open and close and conduct specific ions. As illustrated in
Figure 11-22a and b, a tiny glass pipette is tightly sealed, using suction, to the surface of a cell; the segment of the plasma membrane within the tip of the pipette will contain only one or a few ion channels. The only current that crosses through the patch of membrane must pass through these channels as ions flow. An electrical recording device detects this ion flow, measured as electric current, through the channels; this ion flow usually occurs in small bursts when a channel is open (Figure 11-22c). The electrical device also “clamps” or locks the electric potential across the membrane at a predetermined value (hence the term patch clamping). The inward or outward movement of ions across a patch of membrane is quantified from the amount of electric current needed to maintain the membrane potential at a particular clamped value (see Figure 11-22a).
EXPERIMENTAL FIGURE 11-22 Current flow through individual ion channels can be measured by patch clamping. (a) Basic experimental arrangement for measuring current flow through individual ion channels in the plasma membrane of a live cell. The patch electrode, filled with a current-conducting saline solution, is applied, with a slight suction, to the plasma membrane. The -diameter tip covers a region that contains only one or a few ion channels. A recording device measures current flow only through the channel or channels in that region. (b) Photomicrograph of the cell body of a cultured neuron and the tip of a patch pipette touching the plasma membrane. (c) Current traces from patchclamp experiments measuring activity of a single voltage-gated channel. Patches of membrane containing a voltage-gated channel were clamped at a negative membrane potential and voltage steps were applied while measuring the changes in current. The top row shows the voltage applied to the membrane; first the membrane is held at a negative
Novel Ion Channels Can Be Characterized by a Combination of Oocyte Expression and Patch Clamping
potential and then voltage steps are applied to hold (“clamp”) the membrane potential at 0 mV (A) or mV (B). The voltage traces below show channel opening by an increase in the current trace and the channel closing by the rapid decrease in the current trace. The amplitude of the current trace is greater and the channel opening is quicker when the membrane is more depolarized compared to when it is clamped at 0 mV. [Part (c) Data from W. N. Zagotta, M. S. Brainard, and R. W. Aldrich, 1988, J. Neurosci. 8:4765–4779.] Description The illustration labeled (a) shows a green tip shaped patch electrode touching the ion channels on the cell membrane of an intact cell, with cytosol below. The patch electrode is filled with conducting salt solution. An arrow from the patch electrode pointing to a text box and reads, device to maintain a constant voltage across the membrane and to measure the current flow across the membrane at tip of a patch electrode. The micrograph labeled (b) shows the point of the patch electrode touching the cell membrane. The illustration labeled (c) shows 2 line graphs of the electrical activity. The one on the left is labeled 0 millivolts on a raised area that is matched to an electrogram with an area labeled OPEN in the raised area. The right graph shows the OPEN part of the electrogram more to the left and taller, with the raised part of the line graph labeled 50 millivolts. Novel Ion Channels Can Be Characterized by a Combination of Oocyte Expression and Patch Clamping The current traces in Figure 11-22c illustrate the use of the single-channel patch clamp technique to study the properties of voltage-gated
channels. These types of channels are critical for multiple physiological functions including regulating neuron excitability and cardiac muscle activity. Here a portion of membrane containing a single potassium channel is clamped at a negative membrane potential (a voltage at which these channels are closed), and then a voltage that depolarizes the membrane — that is, reverse the charge across the membrane. This voltage is applied in two steps; the first raises the membrane potential from the initial potential to 0 mV and the second raises it to 50 mV. Each depolarization results in the channel opening for ms to allow ions to flow out of the cell. The efflux of ions through a single channel can be visualized by the transient rise of the current traces in Figure 11-22c. This experiment illustrates the voltage-dependence of these channels; the channel opens more rapidly and shows greater current efflux when the depolarization is greater (step to mV) compared to when the depolarization is weaker (step to 0 mV). Cloning of human-disease-causing genes and sequencing of the human genome have identified many genes encoding putative channel proteins, including 79 putative channels and 23 putative channels. One way of characterizing the function of these proteins is to transcribe a cloned cDNA in a cell-free system to produce the corresponding mRNA. Injecting this mRNA into frog oocytes and taking patch-clamp measurements of the newly synthesized channel protein can often reveal its function (Figure 1123). This experimental approach is especially useful because frog oocytes normally do not express any channel proteins on their plasma membranes, so only the channel under study is present in the membrane. In addition,
because of the large size of frog oocytes, patch-clamping studies are technically easier to perform on them than on smaller cells. EXPERIMENTAL FIGURE 11-23 The oocyte expression assay is useful in comparing the function of normal and mutant forms of a channel protein. An oocyte from the follicle of a frog is first treated with collagenase to remove the surrounding follicle cells, leaving a denuded oocyte, which is then microinjected with mRNA encoding the channel protein under study. [Data from T. P. Smith, 1988, Trends Neurosci. 11:250.]
Description The illustration shows the experimental set up of oocyte expression and patch clamping in three steps. Step 1. m R N A is microinjected into an oocyte. The m R N A codes for a protein of interest. The diagram shows a circular cell with the needle entering it. Step 2. The oocyte is incubated for 24 to 48 hours for protein synthesis and the movement of the channel proteins to the plasma membrane. The newly synthesized channel proteins are embedded in the plasma membrane as pink lines in 5 places around the cell membrane. Step 3. A patch electrode is attached to the membrane around the membrane pore, and the activity of the channel is measured by patch clamping. KEY CONCEPTS OF SECTION 11.4 Nongated Ion Channels and the Resting Membrane Potential An inside-negative electric potential (voltage) of between 60 and 90 mV exists across the plasma membrane of all cells. The electric potential generated by the selective flow of ions across a membrane can be calculated using the Nernst equation (see Equation 11-2). The resting membrane potential in animal cells is the result of the combined action of the ATP-powered pump, which establishes and concentration gradients across the membrane, and resting channels, which permit selective movement of ions back down their concentration gradient to the external medium (see Figure 11-3). Unlike the more common gated ion channels, which open only in response to various signals, the nongated resting channels are usually open. In plants and fungi, the membrane potential is maintained by the ATP-driven pumping of protons from the cytosol to the exterior of the cell. channels are assembled from four identical subunits, each of which has at least two conserved membrane-spanning α helices and a nonhelical P segment that lines the ion pore and forms the selectivity filter (see Figure 11-20). The ion specificity of channels is due mainly to binding of the dehydrated ion with eight carbonyl oxygen atoms of specific amino acids in the P segments,
which lowers the activation energy for the passage of compared with or other ions (see Figure 11-21). The pore in channels is wider than in channels and transports partially hydrated ions. Patch-clamping techniques, which permit measurement of ion movements through single channels, are used to determine the ion conductivity of a channel and the effect of various reagents on its activity (see Figure 11-22). Recombinant DNA techniques and patch clamping allow the expression and functional characterization of channel proteins in frog oocytes (see Figure 11-23).
11.5 Cotransport by Symporters and Antiporters
11.5 Cotransport by Symporters and Antiporters In previous sections, we saw how ATP-powered pumps generate ion concentration gradients across cellular membranes and how channels use the concentration gradient to establish an electric potential across the plasma membrane. In this section, we see how cotransporters use the energy stored in electric potentials and concentration gradients of or ions to power the uphill movement of another substance, which may be a small organic molecule such as glucose, or an amino acid, or a different ion. An important feature of such cotransport is that neither substance can move alone; movement of both substances together is obligatory, or coupled. Cotransporters share features with uniporters such as the GLUT proteins. The two types of transporters exhibit certain structural similarities, operate at equivalent rates, and undergo cyclical conformational changes during transport of their substrates. They differ in that uniporters can only accelerate thermodynamically favorable transport down a concentration gradient, whereas cotransporters can harness the energy released when one substance moves down its concentration gradient to drive the movement of another substance against its concentration gradient.
Na+ Entry into Mammalian Cells Is Thermodynamically Favored
When the transported molecule and cotransported ion move in the same direction, the process is called symport; when they move in opposite directions, the process is called antiport (see Figure 11-2). Some cotransporters transport only positive ions (cations), while others transport only negative ions (anions). Yet other cotransporters mediate movement of both cations and anions together. Cotransporters are present in all organisms, including bacteria, plants, and animals. In this section, we describe the operation and function of several physiologically important symporters and antiporters. Entry into Mammalian Cells Is Thermodynamically Favored Mammalian cells express many types of -linked symporters. The human genome encodes literally hundreds of different types of transporters that use the energy stored in the concentration gradient and in the inside-negative electric potential across the plasma membrane to transport a wide variety of molecules into cells against their concentration gradients. To see how such transporters allow cells to accumulate substrates against a considerable concentration gradient, we first need to calculate the change in free energy ( ) that occurs during entry. As mentioned earlier, two forces govern the movement of ions across a selectively permeable membrane: the voltage across the membrane and the ion concentration gradient across the membrane. The sum of these forces constitutes the electrochemical gradient. To calculate the free-energy change, , corresponding to the transport of any ion
across a membrane, we need to consider the independent contributions from each of these forces to the electrochemical gradient. For example, when moves from the outside to the inside of a cell, the free-energy change generated from the concentration gradient is given by (11-5) At the concentrations of and shown in Figure 11-24, which are typical for many mammalian cells, , the change in free energy due to the concentration gradient, is Joules for transport of 1 mole of ions from the outside to the inside of a cell, assuming there is no membrane electric potential. Note that the free energy is negative, indicating spontaneous movement of into the cell down its concentration gradient.
FIGURE 11-24 Transmembrane forces acting on ions. As with all ions, the movement of ions across the plasma membrane is governed by the sum of two separate forces: the ion concentration gradient and the membrane electric potential. At the internal and external concentrations typical of mammalian cells, these forces usually act in the same direction, making the inward movement of ions energetically favorable.
Description The illustration on the top left shows a diagram with a gray rectangle vertical for cell membrane and pink triangle for concentration gradient. In the ion concentration gradient, the concentration of sodium ions inside the cell is 12 millimolar; outside, 145 millimolar. The free energy change due to the concentration gradient is minus 1.45 kilocalories per mole. On the right, the triangle is labeled minus 70 millivolts, with a higher concentration toward the outside of the cell membrane. The free energy change due to the membrane electric potential is minus 1.61 kilocalories per mole. A bracket joins these two diagrams and is labeled Free energy change during transport of Na plus from outside to inside. Below is the cell membrane with both triangles and below that is the equation; Change G equals Change G c + Change G m equals minus 3.06 kilocalories per mole. The free-energy change generated from the membrane electric potential is given by (11-6) where F is the Faraday constant [ ]; and E is the membrane electric potential. If then , the free-energy change due to the membrane potential, is –6755 Joules for transport of 1 mole of ions from the outside to the inside of a cell, assuming there is no concentration gradient. Since both forces do in fact act on ions, the total is the sum of the two partial values: In this example, the concentration gradient and the membrane electric potential contribute almost equally to the total for transport of ions. Since is less than 0, the inward movement of ions is
Na+-Linked Symporters Enable Animal Cells to Import Sugars Including Glucose and Galactose as Well as Amino Acids Against High Concentration Gradients
thermodynamically favored. As we will see next, the inward movement of is used to power the uphill movement of other ions and several types of small molecules into or out of animal cells. The rapid, energetically favorable movement of ions through gated channels is also critical in generating action potentials in neurons and muscle cells, as discussed in Chapter 23. -Linked Symporters Enable Animal Cells to Import Sugars Including Glucose and Galactose as Well as Amino Acids Against High Concentration Gradients Most body cells import glucose from the blood down a concentration gradient of glucose, using GLUT proteins to facilitate this transport. However, certain cells need to import glucose from extracellular fluids against a very large concentration gradient. For example, the cells lining the small intestine and the kidney tubules need to import glucose from digestive products or urine against a very large concentration gradient because glucose concentration is higher inside the cell. Such cells use a two- /one-glucose symporter, a protein that couples the import of one glucose molecule to the import of two ions:
Quantitatively, the free-energy change for the symport of two ions and one glucose molecule can be written (11-7) Thus the for the overall reaction is the sum of the free-energy changes generated by the glucose concentration gradient (1 molecule transported), the concentration gradient (2 ions transported), and the membrane potential (2 ions transported). As illustrated in Figure 1125, the movement of ions into a mammalian cell down their electrochemical gradient has a free-energy change, , of about Joules per mole of transported. Thus the for the transport of two moles of inward would be twice this amount, or about Joules. This negative free-energy change for sodium import is coupled to the uphill transport of glucose, a process with a positive . We can calculate the glucose concentration gradient (inside greater than outside) that can be established by the action of this -powered symporter by realizing that at equilibrium for -linked glucose import, . By substituting the values for sodium import into Equation 11-7 and setting , we see that and we can calculate that at equilibrium, the ratio of . Thus the inward flow of two moles of can generate an intracellular glucose concentration that is times
greater than the exterior concentration. If only one ion were imported ( of approximately Joules/mol) per glucose molecule, then the available energy could generate a glucose concentration gradient (inside/outside) of only about 170-fold. Thus by coupling the transport of two ions to the transport of one glucose molecule, the two- /oneglucose symporter permits cells to accumulate a very high concentration of glucose relative to the external concentration. This means that glucose that is present even at very low concentrations in the lumen of the intestine or in the kidney tubules can be efficiently transported into the cells of the lining and not lost from the body. The high-resolution crystal structure of a bacterial galactose symporter was solved in 2008; it provides a model for the function of sugar symporters. In this particular symporter (and in select other symporters), the stoichiometry of ions to sugar molecules is 1:1 rather than 2:1. As shown in Figure 11-25, the galactose symporter contains 14 transmembrane (TM) α helices, with TM domains 2-6 and 711 as inverted repeat structures within the membrane. Both N- and C-termini extend into the periplasm, the gel-like matrix in the space between the inner cytosolic membrane and the bacterial outer membrane. The galactose and ions interact with specific side chains of the TM α helices that are present in their binding sites. Substrates enter from the periplasm through an extracellular cavity in the transporter. Upon substrate binding, the extracellular cavity closes and a cavity on the cytosolic side opens, releasing and galactose into the cytoplasm. All substrates must bind to their sites on the extracellular domain before the protein undergoes the change that converts the substrate-binding sites
from the outward- to the inward-facing conformation; this ensures that inward transport of galactose and ions are coupled. Figure 11-25c shows a model comparing the alternating access model of the glucose symporter with a glucose uniporter, which does not require a cotransported ion (compare with Figure 11-5).
FIGURE 11-25 Structure and mechanism of transport by the galactose symporter vSGLT from Vibrio parahaemolyticus. (a) Topology of vSGLT showing TM domains in rainbow colors from N-terminus (blue) to C-terminus (red). TMs 2-6 and TMs 711 form inverted repeats, which are highlighted by the gray trapezoids. (b) Outward-facing model through the membrane plane revealing the extracellular cavity in blue highlighting, to which (red sphere) and galactose (red and black spheres) bind, triggering a conformational change to an inward-facing structure on the right, with the intracellular cavity (blue highlighting), releasing and galactose into the cytoplasm. The conformational change involves structural rearrangements of TM helices. (c) A model of the pore of a -glucose symporter (SGLT1) and a glucose uniporter (GLUT2), which function together to transport glucose across the intestinal epithelium (see Figure 11-30). In the -glucose symporter, the rotation of TM helices underlies an alternating access mechanism in which the pore alternates between being closed (gated) on the extracellular and intracellular sides of the membrane; in the glucose uniporter, rotation of the two domains of the transporter against each other alternately exposes the substrate-binding site to the intracellular and extracellular sides of the membrane (see Figure 11-5). [Data from S. Faham, 2008, Science 321:810–814; and N. K. Karpowich and D. N. Weng, 2008, Science 321:781–782.] Description The illustration labeled (a) periplasm, shows the ribbon structure of v S G L T. At the left is an end of the ribbon labeled N terminus. Then the black line follows through a numbered set of bars, 1 through 6, followed by a bar labeled E L H 6. This line continues into another section to the right, which is connected, to the left side with a red hexagon labeled galactose. The line follows through 7 E, 7 I, E L 8 H a, E L 8 H b, 9, 10, 11, 12, 13, and 14 to C-terminus. The illustration labeled (b) shows a ribbon diagram of the area in the cell membrane between the periplasm and the cytoplasm. At the left is a view with a red circle Na plus and a galactose group highlighted entering into the ribbon diagram, the right side view shows the same Na plus and galactose exiting the ribbon into the cytoplasm. The illustration labeled (c) shows the apical membrane of the epithelial cell at the top in light purple, and cytoplasm layer in orange with a very wavy top, and a darker pink layer labeled basolateral membrane across the bottom. At the top left is a blue rectangle labeled S G L T 1, which helps in the transport of glucose from the outside of the cell to G L U T 2 in the basolateral
A Bacterial Na+/Amino Acid Symporter Reveals How Symport Works
membrane. G L U T 2 transport glucose into the blood. At the top right, another S G L T 1 with the area close toward the cytoplasm is ready to accept the glucose and Na plus approaching toward it from the apical membrane. There are two human symporters. SGLT1 is found in the absorptive cells lining the small intestine as well as in the epithelial cells lining part of the kidney tubules. SGLT2 is found only in kidney tubules, where, together with SGLT1, it resorbs glucose into the blood from the forming urine. Inhibition of SGLT2 leads to excretion of glucose in the urine and a reduction in blood glucose levels; therefore, SGLT2 inhibitors have potential use in the treatment of type II diabetes. Indeed, several drug candidates that selectively inhibit SGLT2 and not SGLT1 have been developed or are currently undergoing clinical trials, including several that have been approved by the FDA for use in the United States and Canada. Cells use -powered symporters to transport substances other than glucose into the cell against high concentration gradients. For example, several types of acid symporters allow cells to import many amino acids. As another example, symporters couple the import of to the reuptake and recycling of neurotransmitters, and they are the targets of many therapeutic drugs, including many antidepressants. They are also the targets of several drugs of abuse, including cocaine and amphetamines.
A Bacterial Acid Symporter Reveals How Symport Works Until recently, no three-dimensional structure had been determined for any mammalian -linked symporter, but the structures of several homologous bacterial symporters, such as the bacterial symporter, have provided considerable insights into the mechanisms of symporter function. The structure of the bacterial twosymporter has served as a particularly useful model for understanding how antidepressants work, since the bacterial symporter is closely related to the human neurotransmitter transporters that are the targets of many antidepressant drugs. As shown in Figure 11-26a, the bacterial twosymporter consists of 12 membrane-spanning α helices. Two of the helices (numbers 1 and 6) have nonhelical segments in the middle of the membrane that form part of the leucine-binding site. The amino acid residues involved in binding the leucine and the two ions are located in the middle of the membrane-spanning segment and are close together in three-dimensional space. This proximity suggests that the coupling of amino acid and ion transport in these transporters is the consequence of direct or nearly direct physical interactions of the substrates. Indeed, one of the ions is bound to the carboxyl group of the transported leucine (Figure 11-26b). Thus neither substance can bind to the transporter without the other. Each of the two ions is bound to six oxygen atoms in the transporter. One of the two ions, for example, is bound to carbonyl oxygens of several
transporter amino acids as well as to carbonyl oxygens and the hydroxyl oxygen of one threonine. Equally importantly, there are no water molecules surrounding either of the bound atoms, as is the case for ions in potassium channels (see Figure 11-20). Thus as the ions lose their water of hydration in binding to the transporter, they bind to six oxygen atoms with a similar geometry. This reduces the energy change required for the binding of ions and prevents other ions, such as , from binding in place of .
FIGURE 11-26 Three-dimensional structure of the two- /one-leucine symporter from the bacterium Aquifex aeolicus. (a) The bound L-leucine, two ions, and a ion are shown in yellow, purple, and green, respectively. The three membrane-spanning α helices that bind the or the leucine are colored brown, blue, and orange. (b, c) Binding of the two ions to carbonyl main-chain or carboxyl side-chain oxygen atoms
A Na+-Linked Ca2+ Antiporter Regulates the Strength of Cardiac Muscle Contraction
(red) that are part of helices 1 (brown), 6 (blue), or 8 (orange). It is important that one of the ions is also bound to the carboxyl group of the transported leucine (b). [Data from A. Yamashita et al., 2005, Nature 437:215, PDB ID 2a65.] Description The illustration labeled (a) shows a ribbon diagram of a symporter. The cell membrane is represented as a gray rectangle with the ribbon diagram going through it. Labeled from left top area to right top area are; Helix 6, leucine, Helix 1, Cl minus, and Helix 8. Two Na plus is in the center of the ribbon structure. The illustration labeled (b) exterior face, shows a close-up of one of the Na plus with Helix 6, a blue ribbon at the left, and to Helix 1 on the right, a ribbon in dark red. The illustration labeled (c) cytosolic Face, shows a close-up of another Na plus with Helix 1 at the bottom left in dark red, and Helix 8 at the right in orange. One striking feature of the structure depicted in Figure 11-26 is that the bound ions and leucine are occluded — that is, they cannot diffuse out of the protein to either the surrounding extracellular or cytoplasmic media. This structure represents an intermediate in the transport process in which the transporter appears to be changing from a conformation with an exoplasmic-facing to one with a cytosolic-facing binding site. A -Linked Antiporter Regulates the Strength of Cardiac Muscle Contraction In all muscle cells, a rise in the cytosolic concentration triggers contraction. Thus when muscle is resting, the cytosolic concentration
must be low. In cardiac muscle cells, a three- /oneantiporter, rather than the plasma-membrane ATPase discussed earlier, plays the principal role in maintaining a low concentration of in the cytosol. The transport reaction mediated by this cation antiporter can be written as Note that the inward movement of three ions is required to power the export of one ion from the cytosol, which has a [ ] of , to the extracellular medium, which has a [ ] of — a concentration gradient of some 10,000-fold (higher on the outside). By lowering cytosolic , operation of the antiporter reduces the strength of heart muscle contraction. The ATPase in the plasma membrane of cardiac muscle cells, as in other body cells, creates the concentration gradient necessary for export of by the -linked antiporter. As mentioned earlier, inhibition of the ATPase by the drugs ouabain and digoxin lowers the cytosolic concentration and, more importantly here, simultaneously increases cytosolic . The resulting reduced electrochemical gradient across the membrane causes the -linked antiporter to function less efficiently. As a result, fewer ions are exported, and the cytosolic concentration increases, causing the muscle to contract more strongly. Because of their ability to increase the force of heart muscle contractions, drugs such as ouabain and digoxin that inhibit the ATPase are widely used in the treatment of congestive heart failure.
Several Cotransporters Regulate Cytosolic pH
Several Cotransporters Regulate Cytosolic pH The anaerobic metabolism of glucose yields lactic acid, and aerobic metabolism yields , which combines with water to form carbonic acid ( ). These weak acids dissociate, yielding ions (protons); if these excess protons were not removed from cells, the cytosolic pH would drop precipitously, endangering cellular functions. Two types of cotransporters help remove some of the excess protons generated during metabolism in animal cells. One is a antiporter, which imports one ion, together with one , in exchange for export of one ion. The cytosolic enzyme carbonic anhydrase catalyzes the hydration of carbon dioxide and the dehydration of bicarbonate to convert water and carbon dioxide to carbonic acid, which dissociates to create and bicarbonate. Carbonic anhydrase is a zinc metalloenzyme, and zinc binding causes deprotonation of water to create a zinc-hydroxide intermediate that attacks carbon dioxide to generate bicarbonate. Thus the overall action of this enzyme is to consume cytosolic ions, thereby raising the cytosolic pH. Also important in raising cytosolic pH is a antiporter, which couples the movement of one ion into the cell down its concentration gradient to the export of one ion.
An Anion Antiporter Is Essential for Transport of CO2 by Erythrocytes
Under certain circumstances, the cytosolic pH can rise beyond the normal range of 7.2–7.5. To cope with the excess ions associated with elevated pH, many animal cells use an anion antiporter that catalyzes a one-for-one exchange of for across the plasma membrane. At high pH, this antiporter exports one molecule of (which can be viewed as a “complex” of and ) in exchange for the import of one molecule of , thus lowering the cytosolic pH. The movement of down its concentration gradient ( see Table 11-2) powers the export of . The activity of all three of these antiporters is regulated by the cytosolic pH, providing cells with a finely tuned mechanism for controlling cytosolic pH. The two antiporters that operate to increase cytosolic pH are activated when the pH of the cytosol falls. Similarly, a rise in pH above 7.2 stimulates the antiporter, leading to a more rapid export of and a drop in the cytosolic pH. In this manner, the cytosolic pH of growing cells is maintained very close to pH 7.4. An Anion Antiporter Is Essential for Transport of by Erythrocytes Transmembrane anion exchange is essential for an important function of erythrocytes: the transport of waste from peripheral tissues to the lungs for exhalation. Waste released from cells into the capillary blood freely diffuses across the erythrocyte membrane (Figure 11-27a). In its gaseous form, dissolves poorly in aqueous solutions such as the
cytosol or blood plasma, as is apparent to anyone who has opened a bottle of a carbonated beverage. However, the large amount of the potent enzyme carbonic anhydrase in the erythrocyte combines with hydroxyl ions ( ) to form water-soluble bicarbonate ( ) anions. This process occurs while erythrocytes are in systemic (tissue) capillaries and releasing oxygen into the blood plasma. The release of oxygen from hemoglobin induces a change in its conformation that enables a histidine side chain of a globin polypeptide to bind a proton. Thus when erythrocytes are in systemic capillaries, water is split into a proton that binds hemoglobin and an that reacts with to form an anion.
FIGURE 11-27 Carbon dioxide transport in blood requires a antiporter. (a) In systemic capillaries, carbon dioxide gas diffuses across the erythrocyte plasma membrane and is converted into soluble by the enzyme carbonic anhydrase; at the same time, oxygen leaves the cell and hemoglobin binds a proton. The anion antiporter AE1 (purple) catalyzes the reversible exchange of and ions across the membrane. The overall reaction causes to be released from the cell, which is essential for maximal transport from the tissues to the lungs and for maintaining pH neutrality in the erythrocyte. (b) In the lungs, where carbon dioxide is excreted, the overall reaction is reversed. See text for additional discussion.
Description The illustration labeled (a) In systemic capillaries, High C O subscript 2 pressure, Low O subscript 2 pressure shows erythrocytes, an elongated oval with pinched sides. The outer layer is labeled erythrocyte plasma membrane. C O subscript 2 enters the cell and joins with O H minus, an arrow from this labeled carbonic anhydrase leads to H C O subscript 3 minus. The H C O subscript 3 minus leaves the cell through an A E 1 protein represented as a small blue oval and C l minus enters the cell through the same protein. The water molecule inside the erythrocyte cell breaks down into O H minus and H plus ions, which joins to histidine residues with carbons and nitrogens attached to hemoglobin. An arrow from hemoglobin points to oxygen representing the release of oxygen from the cell. The illustration labeled (b) In pulmonary capillaries, Low C O subscript 2 pressure, High O subscript 2 pressure shows erythrocytes, an elongated oval with pinched sides. Oxygen from outside the erythrocyte cell reaches the hemoglobin that is attached to the histidine residue. C l minus leaves the cell through A E 1 protein and H C O 3 subscript minus enters the cell through the same protein. An arrow labeled carbonic anhydrase from H C O subscript 3 minus leads to C O subscript 2 plus O H minus. Arrows from H plus ions of the histidine residue and O H minus ions lead to H subscript O. The formed C O subscript 2 is released out of the cell. In a reaction catalyzed by the antiporter Anion Exchanger 1 (AE1), also known as Band 3 anion transporter, cytosolic is transported out of the erythrocyte in exchange for an entering anion: (see Figure 11-27a). The entire anion-exchange process is completed within 50 milliseconds (ms). If anion exchange did not occur, then during periods such as exercise, when much is generated, would accumulate inside the erythrocyte to toxic levels, as the cytosol would become alkaline. The exchange of (equal to ) for causes the cytosolic pH to remain nearly neutral. Normally, about 80
percent of the in blood is transported as generated inside erythrocytes; anion exchange allows about two-thirds of this to be transported by blood plasma external to the cells, increasing the amount of that can be transported from tissues to the lungs. In the lungs, where leaves the body, the overall direction of this anion-exchange process is reversed (Figure 11-27b). AE1 catalyzes the precise one-for-one sequential exchange of anions on opposite sides of the plasma membrane required to preserve electroneutrality in the cell; only once every 10,000 or so transport cycles does an anion move from one side of the membrane to the other without another anion moving across the membrane in the opposite direction. AE1 is the most abundant membrane protein in erythrocytes, with nearly one million molecules per cell. The recently solved crystal structure of human erythrocyte AE1 reveals that it has 14 transmembrane α helices and a cytosolic-facing domain that anchors certain cytoskeletal proteins, including ankyrin (see Figure 17-21), to the membrane. The 14 transmembrane α helices form two structurally distinct domains within the membrane, defined as the core and the gate (Figure 11-28a). The core and the gate are divided by a cleft, which, in the outward-facing conformation of the protein whose structure was solved, is on the extracellular side of the protein. The anion binding site (for chloride) is formed by positively charged dipoles between two of the α helices within the core domain. Comparison of the AE1 structure to the structures of related transporters, such as the leucine transporter shown in Figure 11-26, suggests that the antiporter uses an alternating access mechanism: the chloride ion binds the anion binding site in the outward-facing protein, triggering
conformational changes such that the core domain rotates against the gate domain to form an inward-facing structure. The chloride ion diffuses out to be replaced by bicarbonate, followed by a reversal of this process.
FIGURE 11-28 The antiporter Anion Exchanger 1 (AE1) transports out of the cell and into the cell. (a) Topology of Human AE1, with 14 transmembrane domains (TMs) drawn as cylinders viewed in the plane of the membrane, showing the core domain in yellow and the gate in blue. The putative binding site is located between TM domain 3 (cyan) and TM 10 (orange). (b) and bind in the anion binding site between TMs 3 and 10. The anions are transported across the membrane via an alternating access mechanism triggered by the relative movements of the core and gate domains. Description The illustration labeled (a) shows the ribbon structure of the antiporter anion exchanger 1 (A E 1). The cell membrane is represented as a gray rectangle with the ribbon diagram passing through it. At the top of the diagram, the yellow left side has the label T M 3 and the blue side to the right has the label Inhibitor. Inside the cytosol at the bottom, the yellow side of the antiporter is labeled Core and the blue side is labeled Gate. There is a red ribbon in the center labeled T M 10. The illustration labeled (b) has two diagrams of this antiporter. The left diagram is labeled Outward open, and the two sides of the antiporter are yellow on left and blue on right. At the top, the T M 3 ribbon in the yellow part is green, and the T M 10 ribbon is orange. The top shows the yellow and blue apart from each other with H C O subscript 3 minus moves out of A E 1 and C l minus enters into A E 1. The core and gate are labeled below. The right diagram
Numerous Transport Proteins Enable Plant Vacuoles to Accumulate Metabolites and Ions
shows the antiporter open at the cytosol side at the bottom. It is labeled Inward open, and shows H C O subscript 3 minus enters into A E 1 and C l minus moves out to the cytosol. Numerous Transport Proteins Enable Plant Vacuoles to Accumulate Metabolites and Ions The lumen of a plant vacuole is much more acidic (pH 3–6) than is the cytosol (pH 7.5). The acidity of vacuoles is maintained by a V-class ATPpowered proton pump (see Figure 11-9) and by a pyrophosphate-powered proton pump that is unique to plants. Both of these pumps, located in the vacuolar membrane, import ions into the vacuolar lumen against a concentration gradient. The vacuolar membrane also contains and channels that transport these anions from the cytosol into the vacuole. The proton pumps generate an inside-positive electric potential that drives the entry of these anions against their concentration gradients. The combined operation of these proton pumps and anion channels produces an inside-positive electric potential of about 20 mV across the vacuolar membrane as well as a substantial pH gradient (Figure 11-29).
FIGURE 11-29 Concentration of ions and sucrose by the plant vacuole. The vacuolar membrane contains two types of proton pumps (orange): a V-class ATPase (left) and a pyrophosphate-hydrolyzing proton pump (right) that differs from all other ion pumps and is probably unique to plants. These pumps generate a low luminal pH as well as an insidepositive electric potential across the vacuolar membrane by their inward pumping of ions. The inside-positive potential powers the movement of and from the cytosol through separate channel proteins (purple). Proton antiporters (green), powered by the gradient, accumulate , , and sucrose inside the vacuole. See B. J. Barkla and O. Pantoja, 1996, Annu. Rev. Plant Phys. 47:159–184; and P. A. Rea et al., 1992, Trends Biochem. Sci. 17:348. Description The illustration shows the lumen of the plant vacuole with a pH of between 3 and 6. The pH of the cytosol is 7.5. Two types of proton pumps are on one side of the
membrane, and three types of proton antiporter protons are on the other side of the membrane. In proton pumps, the pump on the left allows 2 H plus ions into the cell. During this transport, A T P is converted into A D P plus P subscript i. The pump on the right allows H plus ion into the cell, during this transport inorganic pyrophosphate (P P subscript i) is converted into 2 inorganic phosphate molecules (P subscript i). In proton antiport proteins, the H plus ions are transported out of the cell whereas, sodium, calcium, and sucrose are transported into the cell. A concentration gradient of protons inside the cell represents that the concentration of protons is greater inside the lumen. In addition, chloride ion channels and nitrate channels are present. The proton electrochemical gradient across the plant vacuole membrane is used in much the same way as the electrochemical gradient across the animal-cell plasma membrane: to power the selective uptake or extrusion of ions and small molecules by various antiporters. In the leaf, for example, excess sucrose generated by photosynthesis during the day is stored in the vacuole; during the night, the stored sucrose moves into the cytoplasm and is metabolized to and with concomitant generation of ATP from ADP and . A proton/sucrose antiporter in the vacuolar membrane operates to accumulate sucrose in plant vacuoles. The inward movement of sucrose is powered by the outward movement of , which is favored by its concentration gradient (lumen > cytosol) and by the cytosolic-negative potential across the vacuolar membrane (see Figure 11-29). Uptake of and into the vacuole from the cytosol against their concentration gradients is similarly mediated by proton antiporters. Our understanding of the transporters in plant vacuolar membranes has the potential for increasing agricultural production in soils with a high salt (NaCl) concentration, which are found throughout the world. Because
most agriculturally useful crops cannot grow in such saline soils, agricultural scientists have long sought to develop salt-tolerant plants by traditional breeding methods. With the availability of the cloned gene encoding the vacuolar antiporter, researchers can now produce transgenic plants that overexpress this transporter, leading to increased sequestration of in the vacuole. For instance, transgenic tomato plants that overexpress the vacuolar antiporter can grow, flower, and produce fruit in the presence of soil NaCl concentrations that kill wildtype plants. Interestingly, although the leaves of these transgenic tomato plants accumulate large amounts of salt, the fruit has a very low salt content. KEY CONCEPTS OF SECTION 11.5 Cotransport by Symporters and Antiporters The electrochemical gradient across a semipermeable membrane determines the direction of ion movement through transmembrane proteins. The two forces constituting the electrochemical gradient — the membrane electric potential and the ion concentration gradient — may act in the same or opposite directions (see Figure 11-25). Cotransporters use the energy released by movement of an ion (usually or ) down its electrochemical gradient to power the import or export of a small molecule or different ion against its concentration gradient. The galactose symporter provides a model for glucose and other sugar transporters. Binding of and galactose causes specific TM helices to rotate, creating a gating mechanism that provides alternate access to the substrates on the extracellular and cytoplasmic sides of the membrane. The cells lining the small intestine and kidney tubules contain symporters that couple the energetically favorable entry of to the import of glucose against its concentration gradient (see Figure 11-26). Amino acids also enter cells by means of -linked symporters.
The molecular structure of a bacterial /amino acid symporter reveals how binding of and leucine are coupled and provides a snapshot of an occluded transport intermediate in which the bound substrates cannot diffuse out of the protein (see Figure 11-27). In cardiac muscle cells, the export of is coupled to and powered by the import of by a cation antiporter, which transports three ions inward for each ion exported. Two cotransporters that are activated at low pH help maintain the cytosolic pH in animal cells very close to 7.4 despite metabolic production of carbonic and lactic acids. One, a antiporter, exports excess protons. The other, a cotransporter, imports , which dissociates in the cytosol to yield pH-raising ions. A antiporter that is activated when the cytosolic pH rises above normal decreases pH by exporting . AE1, a antiporter in the erythrocyte membrane, increases the ability of blood to transport from tissues to the lungs (see Figure 11-28). The structure of human erythrocyte AE1 has been solved, revealing that anions are transported across the membrane by means of an alternating access mechanism triggered by the relative movements of the core and gate domains. Uptake of sucrose, , , and other substances into plant vacuoles is carried out by proton antiporters in the vacuolar membrane. Ion channels and proton pumps in the membrane are critical in generating a large enough proton concentration gradient to power these proton antiporters (see Figure 11-29).
11.6 Transcellular Transport
11.6 Transcellular Transport The previous sections have illustrated how several types of transporters function together to carry out important cellular functions. Here we extend this concept by focusing on the transport of several types of molecules and ions across polarized cells, which are cells that are asymmetric (have different “sides”) and thus have biochemically distinct regions of the plasma membrane. A particularly well-studied class of polarized cells includes many of the epithelial cells that form sheet-like layers (epithelia) covering most external and internal surfaces of body organs. (Epithelial cells are discussed in greater detail in Chapter 20.) Like many epithelial cells, an intestinal epithelial cell that absorbs nutrients from the gastrointestinal tract has a plasma membrane organized into two major discrete regions: the surface that faces the outside of the organism, called the apical, or top, surface, and the surface that faces the inside of the organism (or the bloodstream-facing side), called the basolateral surface, which is composed of the basal and lateral surfaces of the cell (see Figure 20-11). Specialized regions of the epithelial-cell plasma membrane, called tight junctions, separate the apical and basolateral membranes and prevent many, but not all, water-soluble substances on one side from moving across to the other side through the extracellular space between cells. For this reason, many nutrients are absorbed from the intestinal lumen across the epithelial cell layer and eventually into the blood by a two-stage
process called transcellular transport: molecules are imported through the plasma membrane on the apical side of the cells and exported through the plasma membrane on the basolateral (blood-facing) side (Figure 1130, also see Figure 11-25d). The apical portion of the plasma membrane, which faces the intestinal lumen, is specialized for absorption of sugars, amino acids, and other molecules that are produced from food by multiple digestive enzymes.
FIGURE 11-30 Transcellular transport of glucose from the intestinal lumen into the blood. The ATPase in the basolateral surface membrane generates and concentration gradients (step 1 ). The outward movement of ions through nongated channels generates an inside-negative membrane potential across the entire plasma membrane. Both the concentration gradient and the membrane potential are used to drive the uptake of glucose from the intestinal lumen by the two- /one-glucose symporter located in the apical surface membrane (step 2 ). Glucose leaves the cell via
Multiple Transport Proteins Are Needed to Move Glucose and Amino Acids Across Epithelia
facilitated transport catalyzed by GLUT2, a glucose uniporter located in the basolateral membrane (step 3 ). Description The illustration shows the transport of glucose between the blood, cytosol, and intestinal lumen. The blood is represented in pink on the left, the cytosol in light orange in the center, and the intestinal lumen in light blue on the right. The diagram indicates that the blood is high in sodium and low in potassium, the cytosol is low in sodium and high in potassium, and the intestinal lumen is high in dietary glucose and sodium chloride. Glucose is transported from the intestinal lumen through the apical membrane via two sodium, one glucose symporter. Tight junctions are between the apical membrane and the basolateral membrane. Glucose transported into the cytosol is pumped into the blood by G L U T 2. In addition, sodium potassium A T P-ase transports sodium from the cytosol into the blood and potassium into the cytosol, using A T P. Potassium channels transport potassium back into the blood. Multiple Transport Proteins Are Needed to Move Glucose and Amino Acids Across Epithelia
Figure 11-30 depicts the proteins that mediate absorption of glucose from the intestinal lumen into the blood. This figure illustrates the important concept that different types of proteins are localized to the apical and basolateral membranes of epithelial cells. The passage of and ions through nongated channels and through the ATPase generates and gradients as well as an inside-negative membrane potential. The concentration gradient and the membrane potential are used to drive the uptake of glucose, against its concentration gradient,
from the intestinal lumen into the cell by the two- /one-glucose symporter located in the apical surface membrane. As noted above, this symporter couples the energetically unfavorable inward movement of one glucose molecule to the energetically favorable inward transport of two ions. In the steady state, all the ions transported from the intestinal lumen into the cell during /glucose symport, or the similar process of /amino acid symport that also takes place on the apical membrane, are pumped out across the basolateral membrane, which faces the blood. Thus the low intracellular concentration is maintained. The ATPase that accomplishes this pumping is found exclusively in the basolateral membrane of intestinal epithelial cells. The coordinated operation of these two transport proteins allows uphill movement of glucose and amino acids from the intestine into the cell. This first stage in transcellular transport is ultimately powered by ATP hydrolysis by the ATPase. In the second stage, the glucose and amino acids concentrated inside intestinal cells by apical symporters are exported down their concentration gradients into the blood via uniport proteins in the basolateral membrane. In the case of glucose, this movement is mediated by GLUT2 (see Figure 11-30 and Figure 11-25d). As noted earlier, this GLUT isoform has a relatively low affinity for glucose but increases its rate of transport substantially when the glucose gradient across the membrane rises (see
Figure 11-4). The net result of this two-stage process is movement of ions, glucose, and amino acids from the intestinal lumen across the intestinal epithelium
Simple Rehydration Therapy Depends on the Osmotic Gradient Created by Absorption of Glucose and Na+
into the extracellular medium that surrounds the basolateral surface of intestinal epithelial cells, and eventually into the blood. Tight junctions between the epithelial cells prevent these molecules from diffusing back into the intestinal lumen. The transport of salt, glucose, and amino acids across the intestinal epithelium increases osmotic pressure and thereby draws water from the intestinal lumen, mainly through the tight junctions, into the extracellular medium that surrounds the basolateral surface; aquaporins do not appear to play a major role. In a sense, salts, glucose, and amino acids “carry” the water along with them. Simple Rehydration Therapy Depends on the Osmotic Gradient Created by Absorption of Glucose and An understanding of osmosis and the intestinal absorption of salt and glucose forms the basis for a simple therapy that saves millions of lives each year, particularly in developing countries. In these countries, cholera and other intestinal pathogens are major causes of death for young children. A toxin released by these bacteria activates chloride secretion from the apical surfaces of intestinal epithelial cells into the lumen; water follows osmotically, and the resultant massive loss of water causes diarrhea, dehydration, and ultimately death. A cure demands not only killing the bacteria with antibiotics but also rehydration: replacement of the water that is lost from the blood and other tissues.
Parietal Cells Acidify the Stomach Contents While Maintaining a Neutral Cytosolic pH
Simply drinking water does not help because it is excreted from the gastrointestinal tract almost as soon as it enters. However, as we have just learned, the coordinated transport of glucose and across the intestinal epithelium creates a difference in osmotic pressure across the plasma membrane, forcing water to move from the intestinal lumen across the epithelial cell layer and ultimately into the blood. Thus giving affected children a solution of sugar and salt to drink (but not sugar or salt alone) increases the transport of sodium and sugar across epithelial cells and, consequently, increases osmotic flow of water into the blood from the intestinal lumen, leading to rehydration. Similar sugar-salt solutions are the basis of popular drinks used by athletes to get sugar as well as water into the body quickly and efficiently. Parietal Cells Acidify the Stomach Contents While Maintaining a Neutral Cytosolic pH The mammalian stomach contains a 0.1 M solution of hydrochloric acid (HCl). This strongly acidic medium kills many ingested pathogens and denatures many ingested proteins so that they can be degraded by proteolytic enzymes (e.g., pepsin) that function at acidic pH. Hydrochloric acid is secreted into the stomach by specialized epithelial cells called parietal cells (also known as oxyntic cells) in the stomach lining. These cells contain a ATPase in the apical membrane (which faces the stomach lumen) that pumps ions into the stomach in exchange for ions. The action of this ATPase generates a 1-million-fold
concentration gradient: pH in the stomach lumen versus pH in the cell cytosol. This P-class ATP-powered ion pump is similar in structure and function to the plasma-membrane ATPase discussed earlier. The numerous mitochondria in parietal cells produce abundant ATP for use by the ATPase. If parietal cells simply exported ions in exchange for ions, the loss of protons would lead to a rise in the concentration of ions in the cytosol and thus a marked increase in cytosolic pH. (Recall that is always a constant, .) Parietal cells avoid this rise in cytosolic pH by using antiporters in the basolateral membrane to export the excess ions from the cytosol to the blood. As noted earlier, these anion antiporters are activated at high cytosolic pH. The overall process by which parietal cells acidify the stomach lumen is illustrated in Figure 11-31. In a reaction catalyzed by carbonic anhydrase, the excess cytosolic combines with that diffuses in from the blood, forming . This bicarbonate ion is exported across the basolateral membrane (and ultimately into the blood) by the antiporter in exchange for a ion. The ions then exit through channels in the apical membrane, entering the stomach lumen. To preserve electroneutrality, each ion that moves into the stomach lumen across the apical membrane is accompanied by a ion that moves outward through a separate channel. In this way, the excess ions pumped inward by the ATPase are returned to the stomach lumen, thus maintaining the normal intracellular concentration. The net result is secretion of equal amounts of and ions (i.e., HCl) into the stomach
lumen, while the pH of the cytosol remains neutral and the excess ions, as , are transported into the blood, where the change in pH is minimal.
FIGURE 11-31 Acidification of the stomach lumen by parietal cells in the gastric lining. The apical membrane of parietal cells contains a ATPase (a P-class pump) as well as and channels. Note the cyclic transport across the apical membrane: ions are pumped inward by the ATPase and exit via a channel. The basolateral membrane contains an anion antiporter that exchanges and ions. The combined operation of these four different transport proteins and carbonic anhydrase acidifies the stomach lumen while maintaining the neutral pH of the cytosol. Description The illustration shows blood, cytosol, and intestinal lumen. The blood is represented in pink on the left, the cytosol in light orange in the center, and the intestinal lumen in light blue on the right. Tight junctions are in the cytosol between apical and basolateral
Bone Resorption Requires the Coordinated Function of a V-Class Proton Pump and a Specific Chloride Channel
membranes. The diagram indicates that the pH of the blood is 7.4, pH of the cytosol is 7.7, and pH of the stomach lumen is 1.0. Bone Resorption Requires the Coordinated Function of a V-Class Proton Pump and a Specific Chloride Channel Net bone growth in mammals subsides just after puberty, but a finely balanced, highly dynamic process of disassembly (resorption) and reassembly (bone formation) goes on throughout adulthood. Such continual bone remodeling permits the repair of damaged bones and can release calcium, phosphate, and other ions from mineralized bone into the blood for use elsewhere in the body. Osteoclasts, the bone-dissolving cells, are macrophages, a type of cell best known for their role in protecting the body from infections. Osteoclasts are polarized cells that adhere to bone and form specialized, very tight seals between themselves and the bone, creating an enclosed extracellular space (Figure 11-32). An adhered osteoclast then secretes into this space a corrosive mixture of HCl and proteases that dissolves the inorganic components of the bone into and phosphate and digests its protein components. The mechanism of HCl secretion is similar to that used by the stomach to generate digestive juice (see Figure 11-31). As in gastric HCl secretion, carbonic anhydrase and an anion antiporter are important
for osteoclast function. Osteoclasts employ a V-class proton pump to export ions into the bone-facing space, rather than the P-class pump used by gastric epithelial cells.
FIGURE 11-32 Dissolution of bone by polarized osteoclast cells requires a V-class proton pump and the ClC-7 chloride channel. The osteoclast plasma membrane is divided into two domains separated by the tight seal between a ring of membrane and the bone surface. The membrane domain facing the bone contains V-class proton pumps and ClC-7 channels. The opposing membrane domain contains anion antiporters that exchange and ions. The combined operation of these three transport proteins and carbonic anhydrase acidifies the enclosed space and allows bone resorption while maintaining the neutral pH of the cytosol. See R. Planells-Cases and T. Jentsch, 2009, Biochim. Biophys. Acta 1792:173 for discussion of ClC-7. Description
The illustration shows an osteoclast dissolving bone. The bone is represented as a gray area across the bottom of the diagram. The osteoclast is represented as a light pink dome attached to the bone. The bone has a ragged edge under the dome. The osteoclast is attached to the bone by tight seals. The osteoclast contains several membrane transport proteins. Chloride-hydrogen carbonate antiporters transport chloride into the cell and hydrogen carbonate out. Meanwhile, at the osteoclast bone interface between the tight seals, chloride ions are pumped out of the osteoclast. In addition, a V-class proton pump pumps protons out of the osteoclast, using A T P in the process. Digestive enzymes are also secreted. The production of an acid environment leads to the dissolution of calcium and hydrogen phosphate from the bone. The rare hereditary disease osteopetrosis, marked by increased bone density, is due to abnormally low bone resorption. Many patients have mutations in the gene encoding TCIRG1, a subunit of the osteoclast V-class proton pump, whose action is required to acidify the space between the osteoclast and the bone. Other patients have mutations in the gene encoding ClC-7, the chloride channel localized to the domain of the osteoclast plasma membrane that faces the space near the bone. As with lysosomes (see Figure 11-13), in the absence of a chloride channel, the proton pump cannot acidify the enclosed extracellular space, and thus bone resorption is defective. KEY CONCEPTS OF SECTION 11.6 Transcellular Transport The apical and basolateral regions of epithelial cell plasma membranes contain different transport proteins and carry out quite different transport processes. In intestinal epithelial cells, the coordinated operation of -linked symporters in the apical membrane and ATPases and uniporters in the basolateral
membrane mediates transcellular transport of amino acids and glucose from the intestinal lumen to the blood (see Figure 11-30). The increased osmotic pressure created by transcellular transport of salt, glucose, and amino acids across the intestinal epithelium draws water from the intestinal lumen into the body, a phenomenon that serves as the basis for rehydration therapy using sugarsalt solutions. The combined action of carbonic anhydrase and four different transport proteins permits parietal cells in the stomach lining to secrete HCl into the lumen while maintaining their cytosolic pH near neutrality (see Figure 11-31). Bone resorption requires coordinated function in osteoclasts of a V-class proton pump and the ClC-7 chloride channel (see Figure 11-32).
Key Terms
End of Chapter Visit Achieve to access study tools and to learn more about the content in this chapter. Perspectives for the Future Classic Experiment 11-1: Stumbling upon Active Transport Analyze the Data Chapter References Additional study tools, including videos, animations, and quizzes Key Terms ABC superfamily active transport antiporter apical aquaporins ATP-powered pump basolateral channel cotransport cotransporter electrochemical gradient facilitated transport flippase
Review the Concepts
membrane potential membrane transport proteins ATPase osmosis patch clamping P-class pump resting channel resting membrane potential symporter tight junction transcellular transport transporter uniport Review the Concepts 1. Nitric oxide (NO) is a gaseous molecule with lipid solubility similar to that of and . Endothelial cells lining arteries use NO to signal surrounding smooth muscle cells to relax, thereby increasing blood flow. What mechanism or mechanisms would transport NO from where it is produced in the cytoplasm of an endothelial cell into the cytoplasm of a smooth muscle cell, where it acts? 2. Acetic acid (a weak acid with a of 4.75) and ethanol (an alcohol) are each composed of two carbon atoms, hydrogen and oxygen, and both enter cells by passive diffusion. At pH 7, one is much more able to permeate a cellular membrane than the other.
Which is more membrane permeable, and why? Predict how the membrane permeability of each is altered when the extracellular pH is reduced to 1.0, a value typical of the stomach. 3. Uniporters and ion channels support facilitated transport across cellular membranes. Although both are examples of facilitated transport, the rates of ion movement via an ion channel are roughly - to -fold faster than the rates of molecule movement via a uniporter. What key mechanistic difference results in this large difference in transport rate? What contribution to free energy ( ) determines the direction of transport? 4. Name the three classes of membrane transport proteins. Explain which one or ones of these classes is able to move glucose and which can move bicarbonate ( ) against an electrochemical gradient. In the case of bicarbonate, but not glucose, the of the transport process has two terms. What are these two terms, and why does the second not apply to glucose? Why are cotransporters often referred to as examples of secondary active transport? 5. An ion is smaller than an molecule, and a glycerol molecule, a three-carbon alcohol, is much larger. Both readily dissolve in . Why do aquaporins fail to transport whereas some can transport glycerol? 6. GLUT1, found in the plasma membrane of erythrocytes, is a classic example of a uniporter. a. Design a set of experiments to prove that GLUT1 is indeed a glucose-specific uniporter rather than a galactose- or mannose-specific uniporter.
b. Glucose is a six-carbon sugar, and ribose is a five-carbon sugar. Despite its smaller size, ribose is not efficiently transported by GLUT1. How can this be explained? c. A drop in blood sugar from 5 mM to 2.8 mM or below can cause confusion and fainting. Calculate the effect of this drop on glucose transport into cells expressing GLUT1. d. How do liver and muscle cells maximize glucose uptake without changing ? e. Tumor cells expressing GLUT1 often have a higher for glucose transport than do normal cells of the same type. How could these cells increase the ? f. Fat and muscle cells modulate the for glucose uptake in response to insulin signaling. How? 7. Name the four classes of ATP-powered pumps that produce active transport of ions and molecules. Indicate which of these classes transport only ions and which transport primarily small organic molecules. The initial discovery of one class of these ATP-powered pumps came from studying the transport not of a natural substrate, but rather of artificial substrates used as cancer chemotherapy drugs. What do investigators now think are common examples of the natural substrates of this particular class of ATP-powered pumps? 8. Explain why the coupled reaction in the Pclass ion pump mechanism does not involve direct hydrolysis of the phosphoanhydride bond. 9. Describe a negative feedback mechanism for controlling a rising cytosolic concentration in cells that require rapid changes in concentration for normal functioning. How would a drug
that inhibits calmodulin activity affect cytosolic concentration regulation by this mechanism? What would be the effect on the function of, for example, a skeletal muscle cell? 10. Certain proton pump inhibitors that inhibit secretion of stomach acid are among the most widely sold drugs in the world today. What pump does this type of drug inhibit, and where is this pump located? 11. The membrane potential in animal cells, but not in plants, depends largely on resting channels. How do these channels contribute to the resting membrane potential? Why are these channels considered to be nongated channels? How do these channels achieve selectivity for versus , which is smaller than ? 12. Patch clamping can be used to measure the conductance properties of individual ion channels. Describe how patch clamping can be used to determine whether or not the gene coding for a putative channel actually codes for a or a channel. 13. Plants use the proton electrochemical gradient across the vacuole membrane to power the accumulation of salts and sugars in the organelle. This accumulation creates hypertonic conditions in the vacuole. Why does this not result in the plant cell swelling and bursting? Even under isotonic conditions, there is a slow leakage of ions into animal cells. How does the plasmamembrane ATPase enable animal cells to avoid osmotic lysis under isotonic conditions? 14. In the case of the bacterial two- /one-leucine symporter, what is the key distinguishing feature of the bound ions that
ensures that other ions, particularly , do not bind? 15. Describe the symport process by which cells lining the small intestine import glucose. What ion is responsible for the transport, and what two particular features facilitate the energetically favored movement of this ion across the plasma membrane? 16. Movement of glucose from one side to the other side of the intestinal epithelium is a major example of transcellular transport. How does the ATPase power the process? Why are tight junctions essential for the process? Why is localization of the transporters specifically in the apical or basolateral membrane crucial for transcellular transport? Rehydration supplements such as sport drinks include a sugar and a salt; why are both important to rehydration?