Introduction
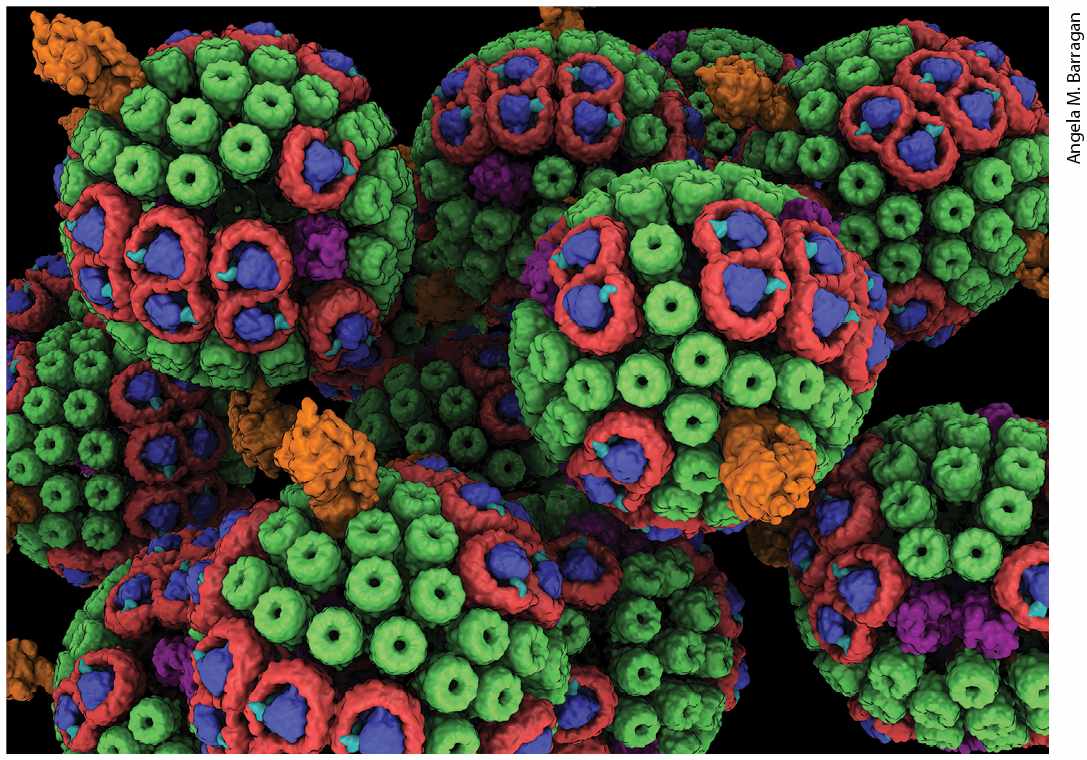
Chapter 12 Cellular Energetics Computer generated image of chromatophores in the photosynthetic purple bacterium Rhodobacter sphaeroides. Each chromatophore contains membrane proteins that use light to drive the synthesis of ATP. Energy is absorbed by pigments in two types of light-harvesting complexes (green and red) and transferred to reaction centers (light blue) where high-energy electrons are generated. Their energy is used by pumps (purple) to move protons into the chromatophores, generating a proton gradient. This powers ATP synthase (orange) to convert ADP + P to ATP. i
12.1 Chemiosmosis, Electron Transport, the Proton-Motive Force, and ATP Synthesis
12.2 First Step of Harvesting Energy from Glucose: Glycolysis
12.4 The Dynamics of Mitochondria and Mitochondrial-ER Membrane Contact Sites
12.5 The Citric Acid Cycle and Fatty Acid Oxidation
12.6 The Electron-Transport Chain and Generation of the Proton-Motive Force
12.7 Harnessing the Proton-Motive Force to Synthesize ATP
12.9 Use of Light Energy to Generate Molecular Oxygen, NADPH, and ATP in Stages 1–3 of Photosynthesis
12.10 ATP and NADPH Drive Carbon Fixation in the Calvin Cycle and Carbohydrate Synthesis in Stage 4 of Photosynthesis From the growth and division of a cell to the beating of a heart to the electrical activity of a neuron that underlies thinking, life requires energy. Energy is defined as the capacity to do work, and on a cellular level, that work includes conducting and regulating a multitude of chemical reactions and transport processes, growing and dividing, generating and maintaining a highly organized structure, and interacting with other cells. This chapter describes the molecular mechanisms by which cells use chemical nutrients or sunlight as sources of energy, with a special focus on how cells convert these external sources of energy into a biologically universal intracellular chemical energy carrier, adenosine triphosphate, or ATP. ATP, found in all types of organisms and presumably present in the earliest life forms, is generated by the chemical addition of inorganic phosphate ( , often
abbreviated as ) to adenosine diphosphate, or ADP, a process called phosphorylation. Cells use the energy released during hydrolysis of the terminal phosphoanhydride bond in ATP (see Figures 1-7 and 2-31) to power many otherwise energetically unfavorable processes. Examples include the synthesis of proteins from amino acids and of nucleic acids from nucleotides (see Chapter 4), the transport of molecules against a concentration gradient by ATP-powered pumps (see Chapter 11), the contraction of muscles (see Chapter 17), and the beating of cilia (see
Chapter 18). A key theme of cellular energetics is that proteins use, or couple, energy released from one process (e.g., ATP hydrolysis) to drive another process (e.g., movement of molecules across membranes) that otherwise would be thermodynamically unfavorable. The energy to drive ATP synthesis from ADP derives primarily from two sources: the energy in the chemical bonds of nutrients and the energy in sunlight (Figure 12-1). The two processes primarily responsible for converting these energy sources into ATP are aerobic oxidation (also known as aerobic respiration), which occurs in mitochondria in nearly all eukaryotic cells (see Figure 12-1, top), and photosynthesis, which occurs only in chloroplasts, found in the leaf cells of plants (see Figure 12-1, bottom) and in certain single-celled organisms, such as algae and cyanobacteria. Two additional processes, glycolysis and the citric acid cycle (see Figure 12-1, top left), are also important direct or indirect sources of ATP in both animal and plant cells.
FIGURE 12-1 Overview of aerobic oxidation and photosynthesis. Eukaryotic cells use two fundamental mechanisms to convert external sources of energy into ATP. Top: In aerobic oxidation, “fuel” molecules [primarily sugars and fatty acids (lipids)] undergo preliminary processing in the cytosol, such as breakdown of glucose to pyruvate (stage I), and are then transferred into mitochondria, where they are converted by oxidation with to and (stages II and III) and ATP is generated (stage IV). Bottom: In photosynthesis, which occurs in chloroplasts, the radiant energy of light is absorbed by specialized pigments (stage 1); the absorbed energy is used both to oxidize to and to establish conditions (stage 2) necessary for the generation of ATP (stage 3) and of carbohydrates from (carbon fixation, stage 4). Both mechanisms involve the production of reduced high-energy electron carriers and the movement of electrons down an electric potential gradient in an electron-transport chain through specialized membranes. Energy released from these electrons is captured as a proton electrochemical gradient (proton-motive force) that is then used to drive ATP synthesis. Bacteria use comparable processes. Description The process of glycolysis and aerobic oxidation is as follows. Chemical energy (energy source) is converted to A T P in 4 stages, starting in the cytosol as stage 1. Lipids or sugars are converted via glycolysis into A T P, N A D H, and pyruvate. Stage 2 through 4 occurs in mitochondrion. Stage 2 involves substrate oxidation via the citric acid cycle, yielding carbon dioxide, A T P, or G T P. Electrons are carried by N A D H and F
A D H 2, entering the electron transport chain in stage 3, converting oxygen to water, and moving protons (H plus gradient) across membranes. In stage 4, A T P is formed. The process of photosynthesis is as follows. Photons or sunlight (energy source) is converted to sugar in 4 stages occurring in chloroplast. In Stage 1, energy is absorbed by pigments and directly transferred to electrons. In stage 2, electron transport occurs and water is oxidized to oxygen. In the process N A D P H is formed and proton motive force (H plus gradient) occurs that results in A T P production in stage 3. In stage 4, N A D P H, A T P, and C O 2 are combined via carbon fixation, resulting in sugar. In aerobic oxidation, breakdown products of sugars (carbohydrates) and fatty acids (hydrocarbons) — both derived from the digestion of food in animals — are converted by oxidation with oxygen to carbon dioxide and water . The energy released from this overall reaction is transformed into the chemical energy of phosphoanhydride bonds in ATP. This process is analogous to burning wood (carbohydrates) or oil (hydrocarbons) to generate heat in furnaces or motion in automobile engines: both consume and generate and . The key difference is that cells break down the overall reaction into many intermediate steps, with the amount of energy released in any given step closely matched to the amount of energy that can be stored — for example, as ATP — or that is required for the next intermediate step. If there were not such a close match, either excess released energy would be lost as heat (which would be very inefficient), or there would not be enough energy released in a step to generate energy storage molecules such as ATP or to drive the next step in the process (which would be ineffective).
In photosynthesis, the radiant energy of light is absorbed by pigments such as chlorophyll and used to make ATP and carbohydrates — primarily sucrose and starch. Unlike aerobic oxidation, which uses carbohydrates and to generate , photosynthesis uses as a substrate and generates and carbohydrates as products. This reciprocal relationship between aerobic oxidation in mitochondria and photosynthesis in chloroplasts underlies a profound symbiotic relationship between photosynthetic and non-photosynthetic organisms. The oxygen generated during photosynthesis is the source of virtually all the oxygen in the air on our planet, and the carbohydrates produced are the ultimate source of energy for virtually all non-photosynthetic organisms on Earth. (An exception is bacteria living in deep-sea hydrothermal vents — and the organisms that feed on them — which obtain energy for converting into carbohydrates by oxidation of geologically generated reduced inorganic compounds released by the vents.) In this chapter, we explore the structures and functions of mitochondria and chloroplasts and the molecular mechanisms underlying aerobic oxidation and photosynthesis. We will first consider the mechanism, known as chemiosmosis (also called chemiosmotic coupling), used by mitochondria and chloroplasts in eukaryotic cells and by bacteria to generate ATP from ADP and .
12.1 Chemiosmosis, Electron Transport, the Proton-Motive Force, and ATP Synthesis
12.1 Chemiosmosis, Electron Transport, the Proton-Motive Force, and ATP Synthesis Chemiosmosis is based on a simple, yet profound, concept. In Chapter 2 (Section 2.4) we described the three forms of potential, or stored, energy in biology: chemical bond energy, the energy stored in concentration gradients, and that stored in electrical gradients. All three forms are interconvertible. For example, as we learned in Chapter 11, the hydrolysis of ATP, which releases its chemical potential energy, can drive, via ATPase pumps, the formation of chemical concentration gradients and electric voltage gradients across biological membranes. Thus it makes sense that the movement of molecules across membranes and down a chemical concentration gradient or movement of ions (e.g., protons, ) down an electric voltage gradient release energy. The released energy could be dissipated as heat or harnessed to drive the synthesis of ATP from ADP and . As we also learned in Chapter 2, in redox reactions electrons can release energy as they move from a higher energy state to a lower energy state (down their electric potential gradient), for example, when they move from atoms or molecules having more negative reduction potentials to those with more positive reduction potentials. The released energy can be used to drive chemical reactions and generate electrical and chemical gradients across membranes.

In chemiosmosis, a proton electrochemical gradient across a membrane is first generated by energy released as electrons travel down their electric potential gradient through an electron-transport chain. Electrontransport chains will be described in detail below. The energy stored in the proton electrochemical gradient, called the proton-motive force, is then used to power the synthesis of ATP (Figure 12-2) or other energy-requiring processes when the protons move back across the membrane down the electrochemical gradient. As protons move down their electrochemical gradient through the ATP synthesizing enzyme called ATP synthase, ATP is generated from ADP and , a process that is the reverse of that mediated by the ATP-powered ion pumps discussed in Chapter 11. In ATPpowered pumps, the energy released by ATP hydrolysis is used to move substances up an electrochemical gradient; in ATP synthase, protons moving down their electrochemical gradient release energy used to make ATP from ADP and P . We will review in detail the mechanism by which ATP synthase exploits a proton-based electrochemical gradient to make ATP later in this chapter. i
FIGURE 12-2 The proton-motive force powers ATP synthesis. Transmembrane proton concentration and electrical (voltage) gradients, collectively called the proton-motive force, are generated during aerobic oxidation and photosynthesis, in both eukaryotes and prokaryotes (bacteria). High-energy electrons generated by light absorption by pigments (e.g., chlorophyll, step 1a ), or held in the reduced form of electron carriers (e.g.,
, step 1b ) made during the catabolism of sugars and lipids, pass down an electron-transport chain (blue arrows, step 2 ), releasing energy throughout the process. The released energy is used to pump protons across the membrane (red arrows, step 3 ), generating the proton-motive force (pH and electric voltage gradients across the membrane). In chemiosmotic coupling, the energy released when protons flow down the gradient through ATP synthase (step 4 ) drives the synthesis of ATP (step 5 ). The protonmotive force can also power other processes, such as the transport of metabolites across the membrane against their concentration gradient and rotation of bacterial flagella.
Description The steps are as follows: In step 1 a, radiant energy (light) falls on pigment (chlorophyll) present on cell surface. The chemical bonds in carbohydrates and lipids from exoplasmic face enter cytosolic face and are catabolized into N A D H and F AD H 2 in step 1 b. Both 1 a and 1 b result in electrons (high energy) that move along the electron transport chain, and power the movement of protons from the cytosolic face (high p h) to the exoplasmic face (low p h), lowering the energy of the electrons as they go in step 2. The transport of protons out of the cytosol leads to the formation of a positive electric potential on the exoplasmic face due to the impermeability of the membrane to protons. Meanwhile, protons are transferred back into the cytosol by proton pumps in step 4 and in step 5 the proton pump converts A D P plus P i to A T P. KEY CONCEPTS OF SECTION 12.1 Chemiosmosis, Electron Transport, the Proton-Motive Force, and ATP Synthesis In a process known as aerobic oxidation, cells convert the energy released by the oxidation of glucose or fatty acids into synthesis of the terminal phosphoanhydride bond of ATP. Chemiosmosis is based on the interconversion of three forms of biological potential energy: chemical bond energy, chemical gradients across membranes, and electrical (voltage) gradients across membranes. The energy released as electrons travel down their electric potential gradient through an electron-transport chain generates a proton electrochemical gradient across a membrane located either in a mitochondrion, a chloroplast, or a bacterial plasma membrane. The energy stored in the proton electrochemical gradient is called the proton-motive force. When protons move back across the membrane down the electrochemical gradient, they release energy. The protons move back across the membrane through the ATP-synthesizing enzyme called ATP synthase, which harnesses the released energy to make ATP from ADP and .
12.2 First Step of Harvesting Energy from Glucose: Glycolysis
12.2 First Step of Harvesting Energy from Glucose: Glycolysis In an automobile engine, hydrocarbon fuel is oxidatively and explosively converted in an essentially one-step process to mechanical work (i.e., driving a piston) plus the products and . The process is relatively inefficient in that substantial amounts of the chemical energy stored in the fuel are wasted, as they are converted to unused heat, and substantial amounts of fuel are only partially oxidized and are sometimes released as toxic exhaust. In the competition to survive, organisms cannot afford to squander their often limited energy sources on an equivalently inefficient process and have therefore evolved a more efficient mechanism for converting fuel into work. That mechanism, known as aerobic oxidation, provides the following advantages: By dividing the energy conversion process into multiple steps that generate several energy-carrying intermediates, chemical bond energy is efficiently channeled into the synthesis of ATP, with little energy lost as heat. Different fuels (sugars and fatty acids) are reduced to common intermediates that can then share subsequent pathways for combustion and ATP synthesis. Because the total energy stored in the bonds of the initial fuel molecules is substantially greater than that required to drive the synthesis of a single ATP molecule , many ATP molecules are produced for each
fuel molecule consumed. An important feature of ATP production from the breakdown of nutrient fuels into and is a set of reactions, called respiration, involving a series of oxidation and reduction reactions called an electron-transport chain (see Figure 12-1, top). The combination of these reactions with phosphorylation of ADP to form ATP is called oxidative phosphorylation and occurs in mitochondria in nearly all eukaryotic cells. When oxygen is available and is used as the final recipient of the electrons transported via the electron-transport chain, the respiratory process that converts nutrient energy into ATP is called aerobic oxidation or aerobic respiration. Aerobic oxidation is an especially efficient way to maximize the conversion of nutrient energy into ATP because is a relatively strong oxidant. If some molecule other than — for example, the weaker oxidants sulfate or nitrate — is the final recipient of the electrons in the electron-transport chain, the process is called anaerobic respiration. Anaerobic respiration is typical of some prokaryotic microorganisms. Although there are exceptions, most known multicellular (metazoan) eukaryotic organisms use aerobic oxidation to generate most of their ATP. In our discussion of aerobic oxidation, we will be tracing the fate of the two main cellular fuels: sugars (principally glucose) and fatty acids. Under certain conditions — for example, starvation conditions — amino acids also feed into these metabolic pathways. We first consider glucose oxidation, then turn to fatty acids. The complete aerobic oxidation of one molecule of glucose yields 6 molecules of , and the energy released is coupled to the synthesis of as
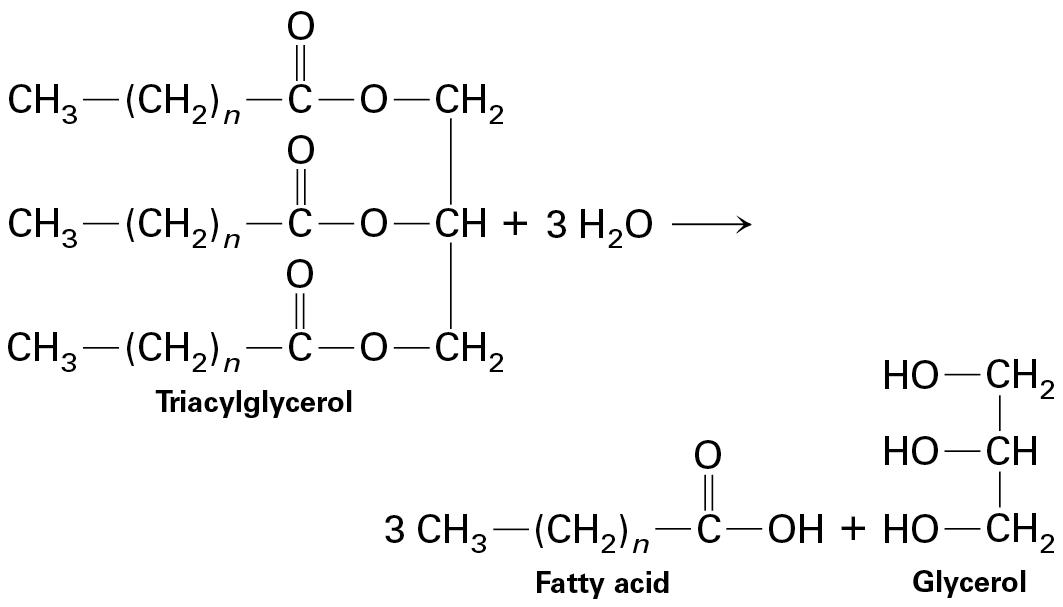
many as 30 molecules of ATP. The overall reaction is Glucose oxidation in eukaryotes takes place in four stages (see Figure 12-1, top): Stage I: Glycolysis In the cytosol, one 6-carbon glucose molecule is converted by a series of reactions to two 3-carbon pyruvate molecules; a net of 2 ATPs are produced for each glucose molecule metabolized. Stage II: Citric Acid Cycle In the mitochondrion, the oxidation of pyruvate, generated by glycolysis, to is coupled to the generation of the high-energy electron carriers NADH and , which store the energy for later use. These two carriers can be considered the sources of high-energy electrons. Stage III: Electron-Transport Chain High-energy electrons flow down their electric potential gradient from NADH and to via membrane proteins that convert the energy released into a protonmotive force ( electrochemical gradient). The energy released from the electrons pumps protons across a membrane, thus generating the proton gradient. Stage IV: ATP Synthesis The proton-motive force powers the synthesis of ATP as protons flow down their concentration and electrical (voltage) gradients through the ATP-synthesizing enzyme ATP synthase, which is embedded in a mitochondrial membrane. For each original glucose molecule, an estimated 28 additional ATPs are
During Glycolysis (Stage I), Cytosolic Enzymes Convert Glucose to Pyruvate
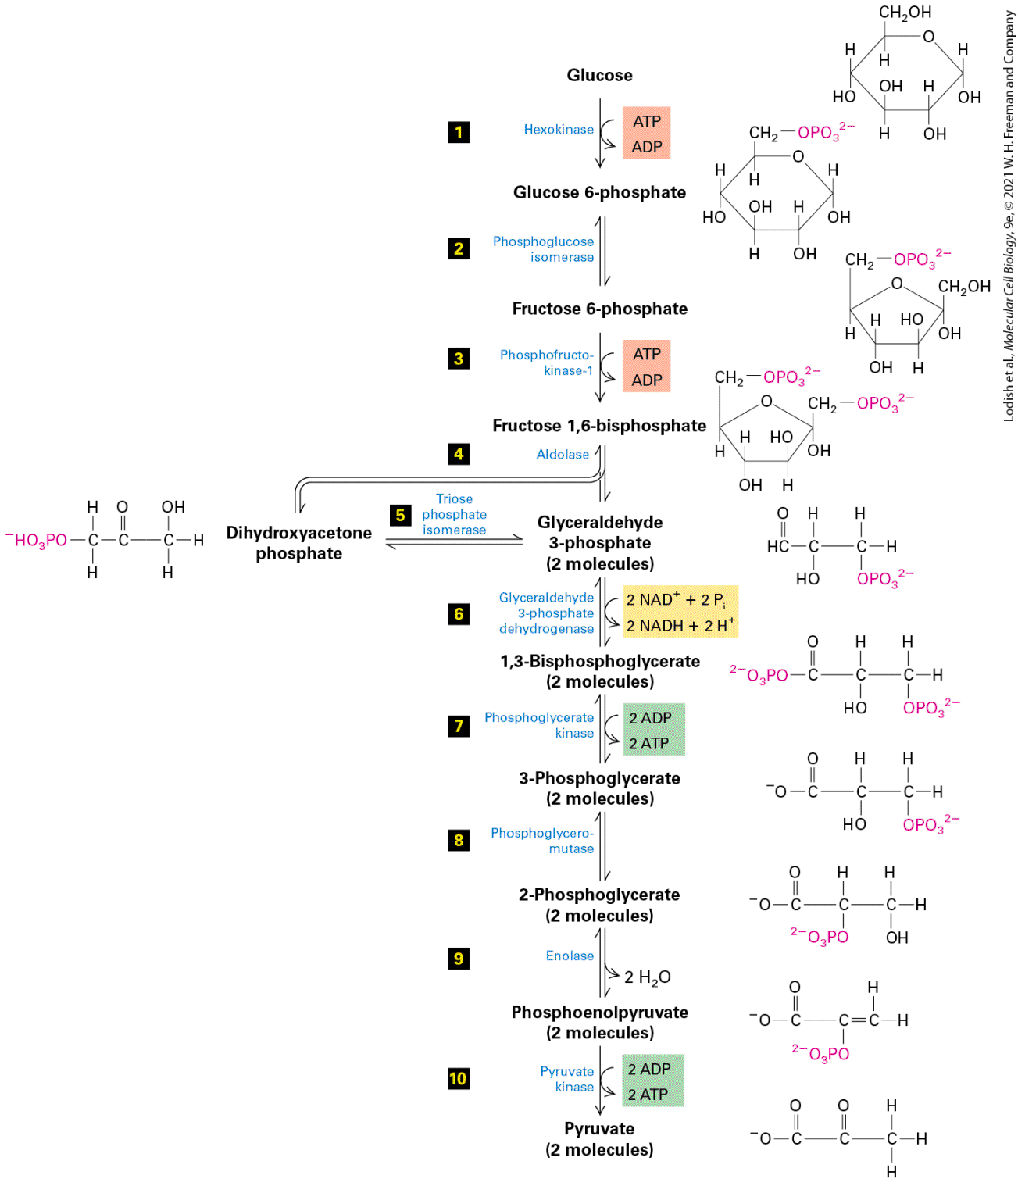
produced by this mechanism of oxidative phosphorylation (stages II– IV). In this section, we discuss stage I: the biochemical pathways that break down glucose into pyruvate in the cytosol. We also discuss how these pathways are regulated, and we contrast the metabolism of glucose under anaerobic and aerobic conditions. The ultimate fate of pyruvate, once it enters mitochondria, is discussed in Section 12.5. During Glycolysis (Stage I), Cytosolic Enzymes Convert Glucose to Pyruvate Glycolysis, the first stage of glucose oxidation, occurs in the cytosol in both eukaryotes and prokaryotes; it does not require molecular oxygen and is thus an anaerobic process. Glycolysis is an example of catabolism, the biological breakdown of complex substances into simpler ones. A set of 10 water-soluble cytosolic enzymes catalyze the reactions constituting the glycolytic pathway (glyco, “sweet”; lysis, “split”), in which one molecule of glucose is converted to two molecules of pyruvate (Figure 12-3). Below we will consider some of the reasons why so many steps are used to efficiently convert glucose to pyruvate.
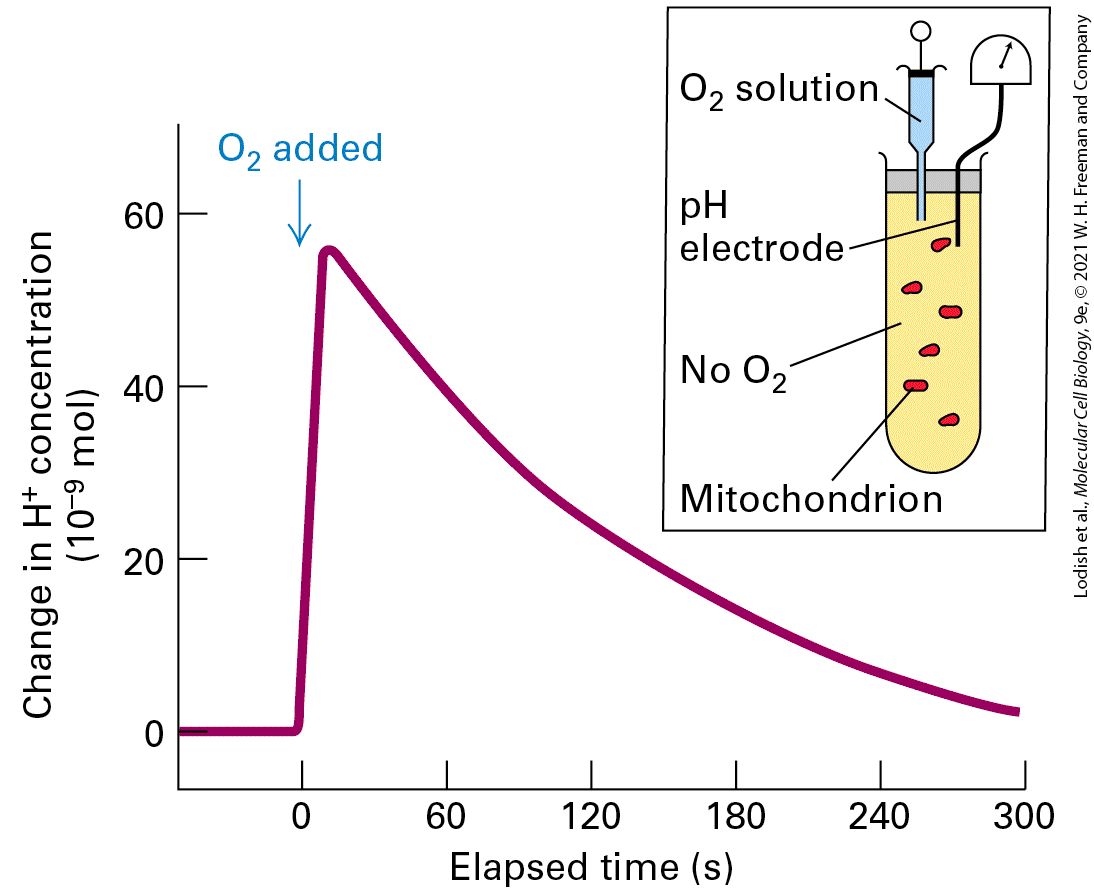
FIGURE 12-3 The glycolytic pathway. A series of 10 reactions degrades glucose to pyruvate. Two reactions consume ATP, forming ADP and phosphorylated sugars (red), two generate ATP from ADP by substrate-level phosphorylation (green), and one yields NADH by reduction of (yellow). Note that all the intermediates between glucose and pyruvate are phosphorylated compounds. Steps 1 , 3 , and 10 , with single arrows, are essentially irreversible (have large negative values) under ordinary conditions in cells.
Description Starting from glucose and ending in two molecules of pyruvate, the glycolytic pathway is listed as follows. Step 1. Glucose (hexane ring with H O H at C 1, C 2, C 3, C 4, and O H at C 6) is converted by hexokinase using A T P into glucose-6-phosphate (glucose ring with O P O 3 superscript 2 negative at C 6 rather than O H). Step 2. Phosphoglucose isomerase catalyzes the conversion to fructose-6-phosphate (glucose ring with O P O 3 superscript 2 negative at C 6 rather than O H and C H 2 O H, O H at C 1 rather than H O H). Step 3. Phosphofructose kinase 1, using A T P, catalyzes conversion to fructose 1, 6bisphosphate (fructose-6-phosphate C H 2 O P O 3 superscript 2 negative, O H at C 1). Step 4. Aldolase catalyzes the formation to dihydroxyacetone phosphate (H negative O 3 P O single bond C H 2 single bond C O single bond C H 2 O H). Step 5. Triose phosphate isomerase catalyzes the formation of two molecules of glyceraldehyde 3-phosphate (H C O single bond H C H O single bond C H 2 single bond O P O 3 superscript 2 negative). Step 6. Using glyceraldehyde 3-phosphate dehydrogenase, two molecules of N A D plus, and inorganic phosphate, are converted to two molecules of 1, 3-bisphosphoglycerate (O P O 3 superscript 2 negative single bond C O single bond H C O H single bond C H 2 single bond O P O 3 superscript 2 negative). Step 7. Phosphoglycerate kinase and two molecules of A D P are used to form two molecules of 3-phosphoglycerate (C O O negative single bond C O single bond H C O H single bond C H 2 single bond O P O 3 superscript 2 negative). Step 8. Phosphoglyceromutase catalyzes the conversion to two molecules of 2phosphoglycerate (C O O negative single bond C O single bond H C O P O 3 superscript 2 negative single bond C H 2 O H). Step 9. Enolase catalyzes the conversion to two molecules of phosphoenolpyruvate (C O O negative single bond C O single bond H C O P O 3 superscript 2 negative single bond C H 2), and two molecules of water are lost.
Step 10. Pyruvate kinase catalyzes, using two molecules of ADP, the conversion to two molecules of pyruvate (C O O negative single bond C O single bond C O single bond C H 3). All the reaction intermediates in glycolysis produced by these enzymes are water-soluble, phosphorylated compounds called metabolic intermediates. In addition to chemically converting one glucose molecule into two pyruvates, the glycolytic pathway generates four ATP molecules by phosphorylation of four ADPs (steps 7 and 10 ). ATP is formed directly through the enzyme-catalyzed joining of ADP with a that is derived from phosphorylated metabolic intermediates; this process is called substratelevel phosphorylation (to distinguish it from the oxidative phosphorylation that generates ATP in stages III and IV). Substrate-level phosphorylation in glycolysis, which does not involve the use of a proton-motive force, requires the prior addition (in steps 1 and 3 ) of two phosphates from two ATPs. By adding a little energy in the beginning of the pathway, glycolysis can recover more energy downstream. As a consequence, glycolysis yields the net production of only two ATP molecules per glucose molecule. The balanced chemical equation for the conversion of glucose to pyruvate shows that four hydrogen atoms (four protons and four electrons) are also released:
(For convenience, we show pyruvate here in its un-ionized form, pyruvic acid, although at physiological pH it would be largely dissociated.) All four electrons and two of the four protons are transferred (see Figure 12-3, step 6 ) to two molecules of the oxidized form of nicotinamide adenine dinucleotide to produce the reduced form of the coenzyme, NADH (see Figure 2-33a): Later we will see that the energy carried by the high-energy electrons in NADH and the analogous electron carrier , the reduced form of the coenzyme flavin adenine dinucleotide (FAD) (see Figure 2-33b), can be used to make additional ATPs via the electron-transport chain. The overall chemical equation for this first stage of glucose metabolism is Why are there so many enzymatic steps and so many metabolic intermediates in the conversion of one glucose to two pyruvates? One reason is that some of the intermediates can be diverted to the biosynthesis of other molecules needed by cells, such as the conversion of dihydroxyacetone phosphate to glycerol. Another was mentioned previously: by dividing the process into multiple steps, small portions of the high chemical bond energy in glucose can be efficiently channeled in separate steps into the synthesis of ATP (steps 7 and 10 ) and NADH (step 6 ), with little energy lost as heat. In addition, multiple intermediate steps afford the opportunity to regulate the activities of these steps and related cellular processes either independently or coordinately, thus permitting fine tuning of the metabolic pathway.
The Rate of Glycolysis Is Adjusted to Meet the Cell’s Need for ATP
After glycolysis, only a fraction of the energy available in glucose has been extracted and converted to ATP and NADH. The rest remains trapped in the covalent bonds of the two pyruvate molecules. The ability to efficiently convert the energy remaining in pyruvate to ATP depends on the presence of molecular oxygen. As we will see when we consider the electron-transport chain (Section 2.5), energy conversion is substantially more efficient under aerobic conditions than under anaerobic conditions. The Rate of Glycolysis Is Adjusted to Meet the Cell’s Need for ATP To maintain appropriate levels of ATP, cells must control the rate of glucose catabolism. The operation of the glycolytic pathway (stage I), as well as the citric acid cycle (stage II), is continuously regulated, primarily by allosteric mechanisms (see Chapter 3 for general principles of allosteric control). Three allosteric enzymes involved in glycolysis play key roles in regulating the entire glycolytic pathway. Hexokinase (see Figure 12-3, step 1 ) is inhibited by its reaction product, glucose 6-phosphate. Hexokinase is involved in the regulation of energy metabolism in at least two additional ways by acting as a glucose sensor. Hexokinase isoforms in mammals and plants, but not yeast, bind to and are active on the cytoplasmic surface of the mitochondrial outer membrane, apparently coordinating the activities of the cytoplasmic glycolytic system and mitochondrial activity, including respiration, and facilitating efficient, global ATP production. In mammals, plants, and yeast, some hexokinase isoforms can enter the nucleus and act as co-factors for transcription factors to control energy metabolism by
regulating the synthesis of several key enzymes. The second allosteric enzyme is Pyruvate kinase (see Figure 12-3, step 10 ), which is inhibited by ATP, so glycolysis slows down if too much ATP is present. The third enzyme, phosphofructokinase-1 (see Figure 12-3, step 3 ), is the principal rate-limiting enzyme of the glycolytic pathway; it is allosterically controlled by several molecules (Figure 12-4).
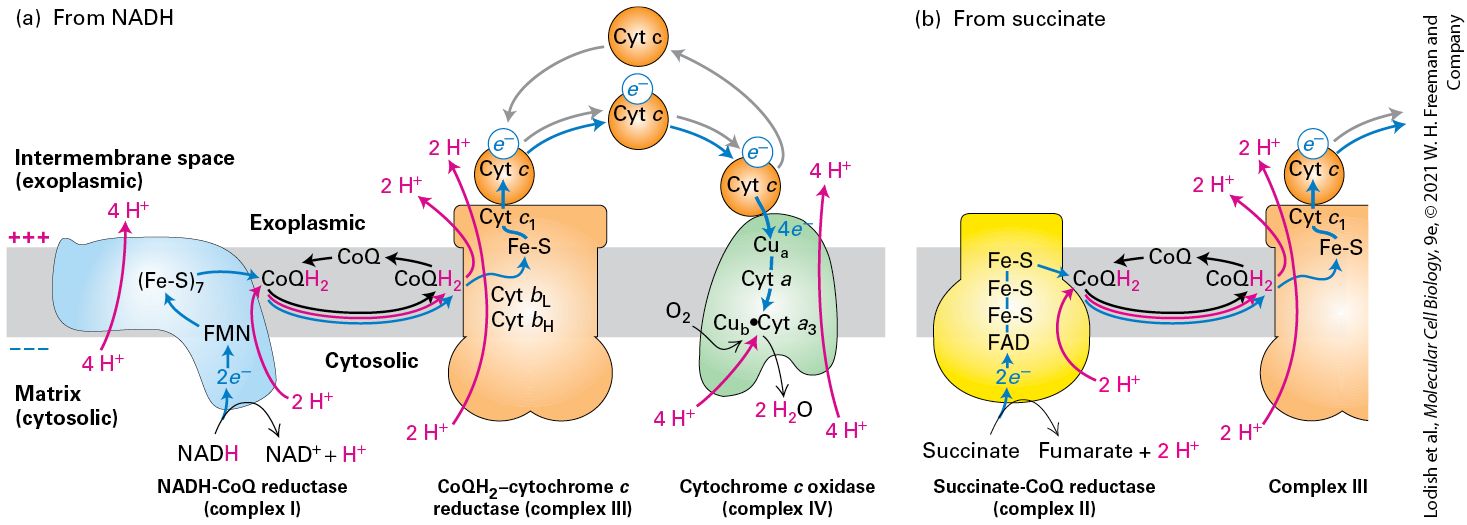
FIGURE 12-4 Allosteric regulation of glucose metabolism. The key regulatory enzyme in glycolysis, phosphofructokinase-1, is allosterically activated by AMP and fructose 2,6bisphosphate, whose concentrations are elevated when the cell’s energy stores are low. The enzyme is inhibited by ATP and citrate, both of which are elevated when the cell is actively oxidizing glucose to (i.e., when energy stores are high). Description The conversion of glucose to pyruvate occurs in several steps as follows. Glucose is converted to fructose 6-phosphate which can be converted to fructose 1, 6-bisphosphate and fructose 2, 6-bisphosphate. Phosphofructokinase-2 catalyzes the formation of fructose 2, 6-bisphosphate while simultaneously converting A T P to A D P. Phosphofructokinase-1 catalyzes the formation of fructose 1, 6-bisphosphate while simultaneously converting A T P to A D P. This process is allosterically activated by high A M P and fructose 2, 6-bisphosphate while inhibited by high A T P and high citrate. Fructose 1, 6-bisphosphate is converted to pyruvate.
For example, phosphofructokinase-1 is allosterically inhibited by ATP and allosterically activated by adenosine monophosphate (AMP). As a result, the rate of glycolysis is very sensitive to the cell’s energy charge, a measure of the fraction of total adenosine phosphates that have “highenergy” phosphoanhydride bonds, which is equal to . The allosteric inhibition of phosphofructokinase-1 by ATP may seem unusual because ATP is also a substrate of this enzyme. But the affinity of the substrate-binding site for ATP is much higher (has a lower ) than that of the allosteric site. Thus at low concentrations, ATP binds to the catalytic site, but not to the inhibitory allosteric site, and enzymatic catalysis proceeds at near maximal rates. At high concentrations, ATP also binds to the allosteric site, inducing a conformational change that reduces the affinity of the enzyme for its other substrate, fructose 6-phosphate, and thus reduces the rate of this reaction and the overall rate of glycolysis. Another important allosteric activator of phosphofructokinase-1 is fructose 2,6-bisphosphate. This metabolite is formed from fructose 6-phosphate by an enzyme called phosphofructokinase-2. Fructose 6-phosphate accelerates the formation of fructose 2,6-bisphosphate, which in turn activates phosphofructokinase-1. This type of control is known as feed-forward activation, in which a high abundance of a metabolite (here, fructose 6phosphate) accelerates its own subsequent metabolism. Fructose 2,6bisphosphate allosterically activates phosphofructokinase-1 in liver cells by decreasing the inhibitory effect of high ATP concentrations and by increasing the affinity of phosphofructokinase-1 for one of its substrates, fructose 6-phosphate. In Chapter 21 we will see how the hormone insulin
influences energy metabolism via fructose 2,6-bisphosphate. Phosphofructokinase-1 is also inhibited by high concentrations of citrate. Later in this chapter we will see that citrate is a product generated during stage II of glucose oxidation. The three glycolytic enzymes that are regulated by allostery catalyze reactions with large negative values — reactions that are essentially irreversible under ordinary conditions. These enzymes are therefore particularly suitable for regulating the entire glycolytic pathway. Additional control is exerted by glyceraldehyde 3-phosphate dehydrogenase, which catalyzes the reduction of to NADH (see Figure 12-3, step 6 ). As we shall see, NADH is a high-energy electron carrier used subsequently during oxidative phosphorylation in mitochondria. If cytosolic NADH builds up owing to a slowdown in mitochondrial oxidation, step 6 becomes thermodynamically less favorable. Glucose metabolism is controlled differently in various mammalian tissues to meet the metabolic needs of the organism as a whole. For instance, when glucose is not available in the diet, it is necessary for the liver to provide that glucose by releasing it into the bloodstream. To do this, the liver converts the polymer glycogen, a storage form of glucose (see Chapter 2), directly to glucose 6-phosphate (without involvement of hexokinase, see
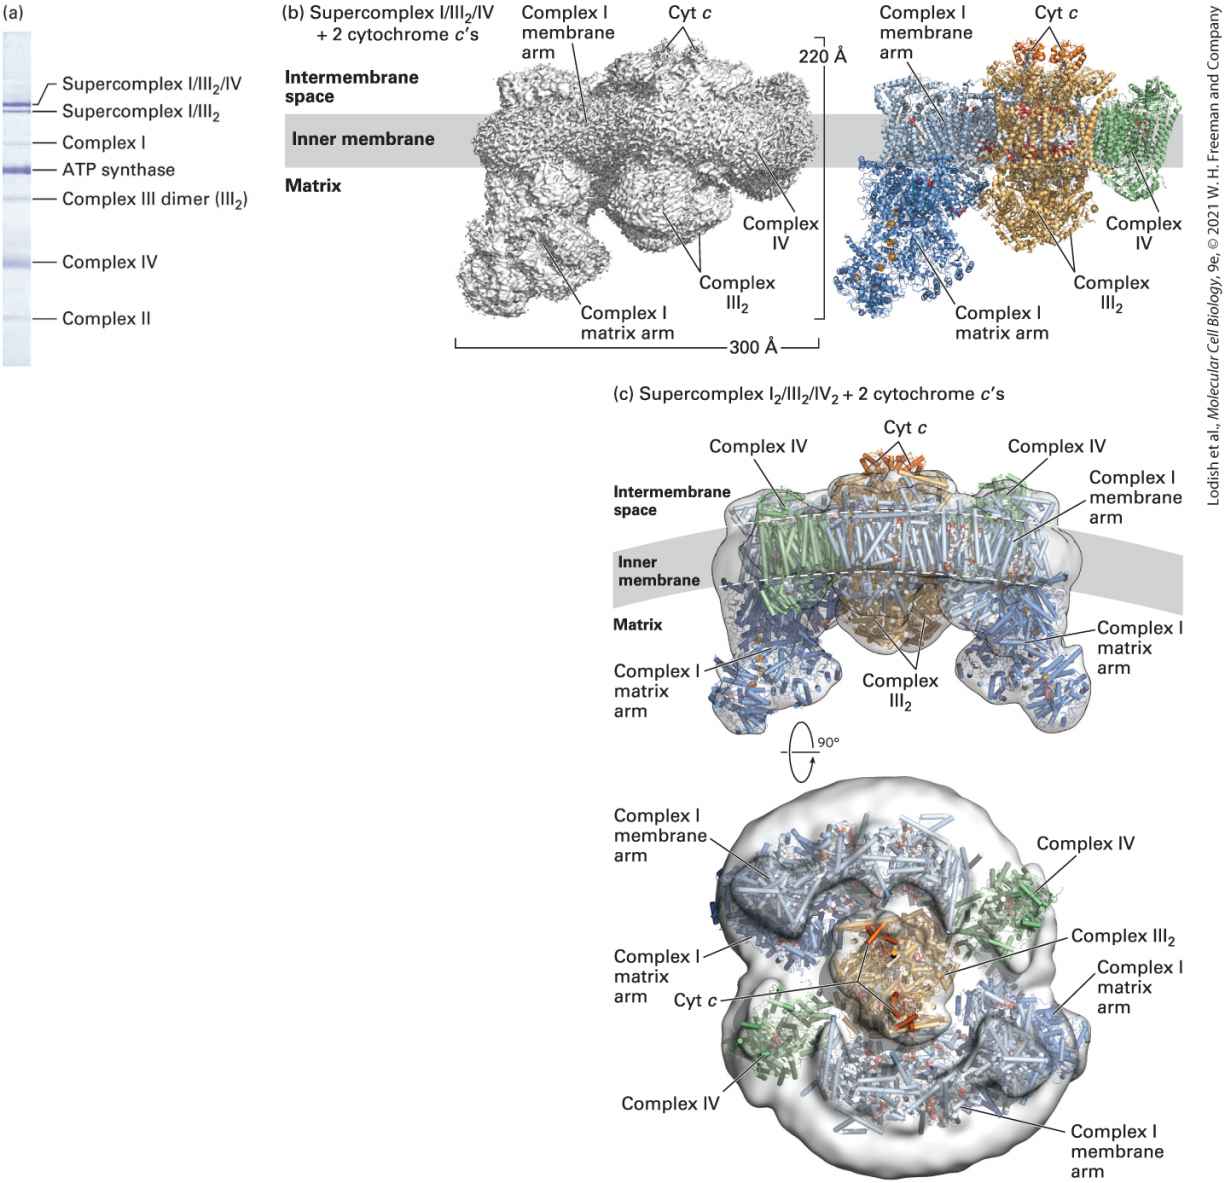
Figure 12-3, step 1 ). Under these conditions, there is a reduction in fructose 2,6-bisphosphate levels and decreased phosphofructokinase-1 activity (see Figure 12-4). As a result, glucose 6-phosphate derived from glycogen is not metabolized to pyruvate; rather, it is converted to glucose by a phosphatase and released into the blood to nourish the brain and red
Glucose Is Fermented When Oxygen Is Scarce
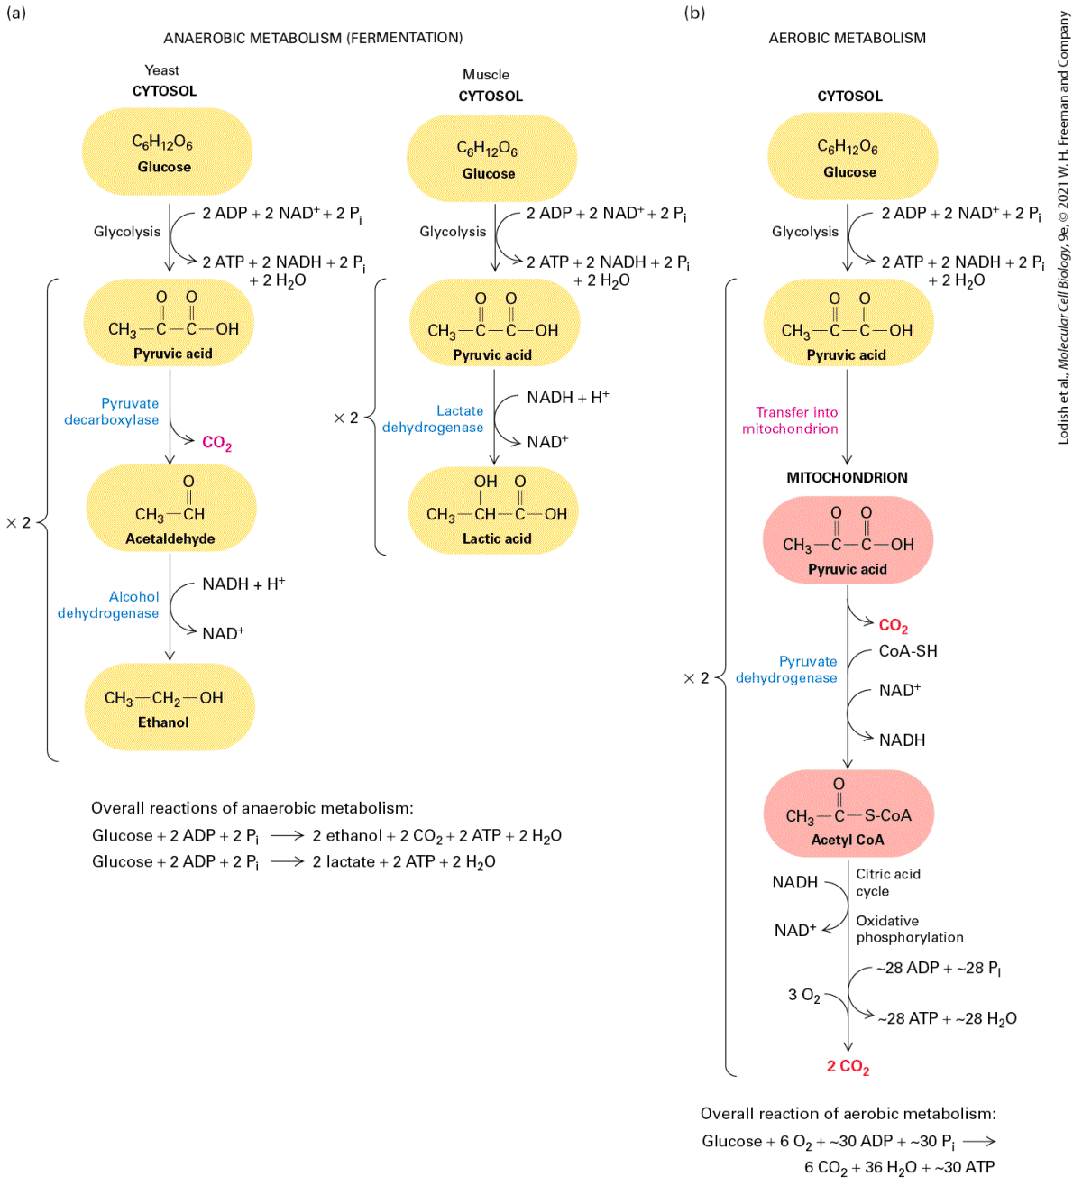
blood cells, which depend primarily on glucose for their energy. In all cases, the activity of these regulated enzymes is controlled by the level of smallmolecule metabolites, generally by allosteric interactions, or by hormonemediated phosphorylation and dephosphorylation reactions. (Chapters 15 and 21 provide more detailed discussions of hormonal control of glucose metabolism in liver and muscle.) Glucose Is Fermented When Oxygen Is Scarce Many eukaryotes, including humans, are obligate aerobes: they thrive only in the presence of molecular oxygen and can metabolize glucose (or related sugars) completely to , with the concomitant production of a large amount of ATP. Most eukaryotes, however, can generate some ATP by anaerobic metabolism. A few eukaryotes are facultative anaerobes: they grow in either the presence or the absence of oxygen. Annelids (segmented worms), mollusks, and some yeasts, for example, can survive without oxygen, relying on the ATP produced by fermentation. In the absence of oxygen, yeasts convert the pyruvate produced by glycolysis to one molecule each of ethanol and ; in these reactions, two NADH molecules are oxidized to for every two pyruvates converted to ethanol, thereby regenerating the supply of , which is necessary for glycolysis to continue (Figure 12-5a, left). This anaerobic catabolism of glucose, called fermentation, is the basis of beer and wine production.
FIGURE 12-5 Anaerobic versus aerobic metabolism of glucose. The ultimate fate of pyruvate formed during glycolysis depends on the presence or absence of oxygen. (a) In the absence of oxygen, pyruvate is only partially degraded and no further ATP is made. However, two electrons are transferred from each NADH molecule produced during glycolysis to an acceptor molecule to regenerate , which is required for continued glycolysis. In yeast (left), acetaldehyde is the electron acceptor and ethanol is the product. This process is called alcoholic fermentation. When oxygen is scarce in muscle cells (right), NADH reduces
pyruvate to form lactic acid, regenerating , a process called lactic acid fermentation. (b) In the presence of oxygen, pyruvate is transported into mitochondria, where it is first converted by pyruvate dehydrogenase into one molecule of and one of acetic acid, the latter linked to coenzyme A (CoA-SH) to form acetyl CoA, concomitant with reduction of one molecule of to NADH. Further metabolism of acetyl CoA and NADH generates approximately an additional 28 molecules of ATP per glucose molecule oxidized. Description Part (a) anaerobic metabolism (fermentation) shows two flowcharts. In yeast cells, anaerobic metabolism in the cytosol consists of the following steps: Glucose (C 6 H 12 O 6) enters the glycolytic pathway, using two molecules of A D P, two molecules of N A D plus, and two molecules of P i, yielding two molecules of A T P, two molecules of N A D H, two molecules of P i, two molecules of H 2 O, and two molecules of pyruvic acid (C H 3 single bond C O single bond C O O H). Next, the action of pyruvate decarboxylase leads the loss of two molecules C O 2 and the formation of two molecules of acetaldehyde (C H 3 single bond C H double bond O). Next, Alcohol dehydrogenase, using N A D H and a H plus ion, reduces acetaldehyde to ethanol (C H 2 single bond C H 2 single bond O H). In muscle cells, the first two steps are shared with yeast; however, instead of pyruvate dehydrogenase acting on pyruvic acid, lactase dehydrogenase, using two molecules of N A D H and a H plus ion, reduces two molecules of pyruvic acid to two molecules of lactic acid (C H 3 single bond C H O H single bond C O O H). Overall reactions of anaerobic metabolism in yeast: Glucose plus 2 A D P plus 2 P i gives 2 ethanol plus 2 C O 2 plus 2 A T P plus 2 H 2 O. Overall reactions of anaerobic metabolism in muscle: Glucose plus 2 A D P plus 2 P i gives 2 lactate plus 2 A T P plus 2 H 2 O. Part (b) shows the flowchart for aerobic metabolism as follows. In the cytosol, glucose enters the glycolytic pathway, using two molecules of A D P, two molecules of N A D plus, and two molecules of P i, yielding two molecules of A T P, two molecules of N A D H, two molecules of P i, two molecules of H 2 O, and two molecules of pyruvic acid. This pyruvic acid transfers to mitochondrion, where pyruvate dehydrogenase converts it to acetyl Co A (C H 3 single bond C O single bond S Co A) while releasing C O 2 and Co A-S H and N A D plus enters the cycle. Acetyl coenzyme A enters the citric acid cycle, using N A D H in the process. Subsequently, oxidative phosphorylation occurs,
using 3 molecules of O2, 28 molecules of A D P, and 28 molecules of P i, yielding 28 molecules of A T P, 28 molecules of H 2 O, and two molecules of C O 2. Overall reactions of aerobic metabolism: Glucose plus 6 O 2 plus almost 30 A D P plus almost 30 P i gives 6 C O 2 plus 36 H 2 O plus almost 30 A T P. Fermentation also occurs in animal cells, although lactic acid, rather than alcohol, is the product. During prolonged contraction of mammalian skeletal muscle cells — for example, during exercise — oxygen can become scarce within the muscle tissue. As a consequence, glucose catabolism is limited to glycolysis, and muscle cells convert two pyruvates to two molecules of lactic acid by a reduction reaction that also oxidizes two NADHs to two (Figure 12-5a, right). A monocarboxylic transporter can then transport the lactate out of the cell. Once it is secreted into the blood, some of the lactic acid passes into the liver, where it is reoxidized to pyruvate and either further metabolized to aerobically or converted back to glucose. Much lactate is metabolized to by the heart, which is highly perfused by blood and can continue aerobic metabolism at times when exercising, oxygen-poor skeletal muscles secrete lactate. If too much lactic acid accumulates in the blood, the acid causes an unhealthy decrease in the pH of the blood (lactic acidosis). Lactic acid bacteria (the organisms that spoil milk) and other prokaryotes also generate ATP by the fermentation of glucose to lactic acid. Fermentation is a much less efficient way to generate ATP than aerobic oxidation and therefore occurs in animal cells only when oxygen is scarce. In the presence of oxygen, pyruvate formed by glycolysis is transported into mitochondria, where it is oxidized by to and via the series of
reactions outlined in Figure 12-5b. This aerobic metabolism of glucose, which occurs in stages II–IV of the process outlined in Figure 12-1, generates an estimated 28 additional ATP molecules per original glucose molecule, far outstripping the ATP yield from anaerobic glucose metabolism (fermentation). To understand how ATP is generated so efficiently by aerobic oxidation, we must consider first the structure and function of the organelle responsible, the mitochondrion. The structure, dynamics, and functions of mitochondria are the subjects of the next two sections. KEY CONCEPTS OF SECTION 12.2 First Step of Harvesting Energy from Glucose: Glycolysis In a process known as aerobic oxidation, cells convert the energy released by the oxidation of glucose or fatty acids into formation of the terminal phosphoanhydride bond of ATP. The complete aerobic oxidation of each molecule of glucose produces 6 molecules of and approximately 30 ATP molecules. The entire process, which starts in the cytosol and is completed in the mitochondrion, can be divided into four stages: (I) degradation of glucose to pyruvate in the cytosol (glycolysis); (II) pyruvate oxidation to in the mitochondrion coupled to generation of the high-energy electron carriers NADH and (via the citric acid cycle); (III) electron transport to generate a proton-motive force together with conversion of molecular oxygen to water; and (IV) ATP synthesis (see Figure 12-1). From each glucose molecule, two ATPs are generated by stage I and approximately 28 from stages II–IV. In glycolysis (stage I), cytosolic enzymes convert glucose to two molecules of pyruvate and generate two molecules each of NADH and ATP (see Figure 12-3). The rate of glucose oxidation via glycolysis is regulated by the inhibition or stimulation of several enzymes, depending on the cell’s need for ATP (see Figure 12-4). Glucose is stored, for example, as glycogen, when ATP is abundant. In the absence of oxygen (anaerobic conditions), cells can metabolize pyruvate to lactic acid or (in the case of yeast) to ethanol and , in the process of converting NADH
back to , which is necessary for continued glycolysis. In the presence of oxygen (aerobic conditions), pyruvate is transported into the mitochondrion, where it is metabolized to , in the process generating abundant ATP (see Figure 12-5).
Mitochondria Are Abundant, Multifunctional Organelles
12.3 The Structure of Mitochondria Oxygen-producing photosynthetic cyanobacteria first appeared about 2.7 billion years ago. The subsequent buildup of oxygen in Earth’s atmosphere during the next approximately 1 billion years opened the way for organisms to evolve the very efficient aerobic oxidation pathway, which in turn permitted the evolution, especially during what is called the Cambrian explosion, of large and complex body forms and associated metabolic activities. In eukaryotic cells, aerobic oxidation is carried out by mitochondria (stages II–IV in Figure 12-1). In effect, mitochondria are ATP-generating factories, taking full advantage of this plentiful oxygen. We first describe their structure, dynamics, and diverse functions that extend well beyond making ATP, and then the reactions they employ to degrade pyruvate and make ATP. Mitochondria Are Abundant, Multifunctional Organelles An individual mitochondrion (Figure 12-6a) is about the size of an Escherichia coli bacterium, which is not surprising because, as we shall see below, bacteria are thought to be the evolutionary precursors of mitochondria. Most eukaryotic cells contain many mitochondria, which may be fused to one another into large networks and may collectively occupy as much as 25 percent of the volume of the cytoplasm. The
numbers of mitochondria in a cell — hundreds to a few thousands in most mammalian cells, as many as half a million per cell in mammalian eggs — are typically regulated to match the cell’s requirements for ATP (e.g., specialized stomach cells that use a lot of ATP for acid secretion have many mitochondria).
FIGURE 12-6 Internal structure of a mitochondrion. (a) Schematic diagram showing the principal mitochondrial membranes and compartments. The smooth outer membrane forms the outside boundary of the mitochondrion. The inner membrane is apparently a single continuous membrane that has three distinct domains: boundary membrane, cristae, and crista junctions. The boundary membrane is flat and lies immediately below and adjacent to
the outer membrane. The cristae are tubelike or flat, pancake-like invaginations that extend from the boundary membrane into the center of the mitochondrion. The sharp bends that form the connection between the boundary membrane and the cristae are called crista junctions. The intermembrane space is that fluid-filled space between the inner and outer membranes. The matrix is the fluid-filled space within the inner membrane (on the opposite side of the inner membrane from the intermembrane space). The ATP synthases (also called complexes, small yellow spheres), which synthesize ATP, are aligned in rows as dimers at the bends in the cristae membrane (described later in Figure 12-34e) and protrude into the matrix. The matrix contains the mitochondrial DNA (blue strands), ribosomes (small blue spheres), and granules (large yellow spheres). (b) Transmission electron micrograph of a thin section of a human cell line — HeLa cells — showing a mitochondrion’s inner and outer membranes with cristae in parallel, ladder-like stacks. One crista junction is highlighted with a white dotted circle. The ladder-like stacks of cristae can also be visualized using superresolution fluorescence microscopy (see Figure 12-8). (c) Computer-generated model of a section of a mitochondrion from chicken brain. This model is based on a three-dimensional electron microscopic image calculated from a series of two- dimensional electron micrographs (such as that in panel b) recorded at regular intervals. This technique is analogous to a three-dimensional x-ray tomogram or CAT scan used in medical imaging. Note the tightly packed cristae (yellow-green), the inner membrane (light blue), the outer membrane (dark blue) and the crista junction (white dotted circle). (d) Cristae and crista junctions from human fibroblasts were visualized and modeled using electron microscopy and tomography. The right panel shows one of the multiple sections through the mitochondrion imaged using transmission electron microscopy, with the mitochondrial membranes clearly distinguished. The sharp bends in the inner membrane at the crista junctions (dotted circles) that separate the crista membranes from the inner boundary membrane are seen clearly. The left panel shows a three-dimensional tomographic model of the laminar cristae seen edge on (green) and crista junctions (orange spheres) overlaid with the EM image. [Part (b) T. Stephan et al., 2019, “Live-Cell STED Nanoscopy of Mitochondrial Cristae.” Sci. Rep. 9:12419 (2019). https://doi.org/10.1038/s41598-019-48838-2. Part (c) T. G. Frey and G. A. Perkins. Part (d) D. C. Jans et al., 2013, “STED Super-Resolution Microscopy Reveals an Array of MINOS Clusters Along Human Mitochondria,” Proc. Natl. Acad. Sci. USA 110:8936–8941, Fig. 6, Fig. 6A and C.]
Description The illustration (a) shows a three-dimensional model of a capsule-shaped mitochondrion, measuring 1 to 2 micrometers in length and 0.1 to 0.5 micrometers in width. The mitochondrion has an outer membrane and an inner membrane with intermembrane space in between. The inner membrane is heavily folded, forming finger-like projections labeled cristae with space within the inner membrane labeled matrix. The bases of the finger-like cristae where the internal membranes at either side of a crista are close is labeled as a crista junction with A T P synthase on inner membrane. The illustration (b) shows a micrograph of a mitochondrion with following parts labeled: outer membrane, inner or boundary membrane, inner or crista membrane, crista junction, and matrix. Measurements between inner or crista membranes are labeled 91 nanometers and 74 nanometers. The illustration (c) shows a computergenerated cross-section model of a mitochondrion highlighting an outer membrane, an inner or boundary membrane, folds of cristae in the matrix, and the cristae junction. The illustration (d) shows a colored and a black-and-white micrograph highlighting the mitochondrial outer membrane between cytosol and matrix. The inner membrane constitutes of crista membranes and boundary membranes with intermembrane space between outer and inner membranes. Several finger-like projections called cristae are present in matrix with crista junction near inner membranes. Although our focus in this chapter is on the structure of mitochondria and the mechanisms by which they generate ATP, it is important to recognize that mitochondria participate in a wide variety of other critical cellular processes (Table 12-1). Mitochondria are involved with the biosynthesis of many small molecules. In several cases, some steps in these biosynthetic pathways take place within the mitochondria and some outside (extramitochondrial steps), requiring precursors and products to be shuttled into and out of the mitochondria via transport proteins. For example, in many eukaryotes, mitochondria host the first rate-limiting step in heme biosynthesis. The product of this first step is then exported
for additional modification in the cytoplasm, producing an intermediate that must then be imported into the mitochondria for the terminal steps. The biosynthesis in the cytoplasm of a wide variety of small molecules depends on mitochondria. Mitochondria provide small organic molecules to the cytoplasm — for example, citrate, isocitrate, malate, formate, and α-ketoglutarate, that can be used to generate NADPH (an energy source), acetyl CoA (a carbon source), or other precursors for the extramitochondrial biosynthesis of molecules such as glutathione, purines, fatty acids, and cholesterol.
TABLE 12-1 • Multiple Functions of Mitochondria Biosynthesis or processing of small molecules Fatty acids Steroid hormones Pyrimidines Iron-sulfur clusters Heme Phospholipids (phosphatidylethanolamine, phosphatidylglycerol, cardiolipin) Ubiquinone Amino acids (synthesis, interconversion, and catabolism) Other mitochondrial functions Oxidative phosphorylation and ATP synthesis Reactive oxygen species (ROS) homeostasis Ion homeostasis (e.g., calcium) Ammonia detoxification Fatty acid oxidation Thermogenesis (heat generation) in brown fat Contributions to innate immunity and inflammation Regulated cell death pathways (e.g., apoptosis) Cellular processes influenced by mitochondrial-ER membrane contact sites (MCS) Mitochondrial shape and dynamics (fusion, fission, autophagy) mitophagy (initiated at MCSs)
Mitochondria Have Two Structurally and Functionally Distinct Membranes
Calcium transport into mitochondria (see Figure 15-29) Calcium homeostasis and calcium-mediated signaling Glucose and energy metabolism Mitochondrial import from the ER of lipids, including phosphatidylserine and possibly cholesterol Mitochondrial biosynthesis of lipids, including phosphatidylethanolamine and steroid hormones Responses to stress Cell survival via regulated cell death (see Chapter 22) Inflammatory responses via the inflammasome and innate immune responses (see
Chapter 24) Pathways implicated in viral infections (cytomegalovirus, hepatitis C virus) Neurodegenerative pathology (Alzheimer’s and Parkinson’s diseases) Mitochondria Have Two Structurally and Functionally Distinct Membranes The details of mitochondrial structure can be observed with electron microscopy (Figures 1-20 and 12-6) and superresolution fluorescence microscopy (Figure 12-8). Each mitochondrion has two distinct, concentric membranes: the mitochondrial inner membrane and mitochondrial outer membrane. The outer mitochondrial membrane defines the smooth outer perimeter. The inner mitochondrial membrane lies underneath the outer membrane. The inner mitochondrial membrane is a single continuous membrane that itself can be considered to have three compositionally and structurally distinct domains. The boundary membrane (or inner boundary membrane) is the flat inner mitochondrial membrane that lies immediately inside and adjacent to the outer membrane. The mitochondrial cristae are the numerous invaginations of the inner membrane that extend from the boundary membrane at the perimeter into the center of the mitochondrion. The invaginating cristae
greatly expand the surface area of the inner mitochondrial membrane. As we shall see below, the cristae’s membranes are the site of ATP synthesis — thus the invaginations increase the mitochondrion’s capacity to generate ATP. The connection between the inner boundary membrane and a crista is called a crista junction (Figure 12-6). The lengths of the cristae and their structures (which may be tubular in shape or flat and pancake-like) can vary within a mitochondrion. They tend to form stacks that in cross section look like the steps of a ladder (Figure 12-6b and c, also see Figures 1-21 and 12-8). There can be regions within the mitochondria that have densely stacked cristae and regions that have less dense cristae or are even devoid of cristae. The crista junctions and the edges and tips of the cristae are highly curved. The curvature of the crista junctions (see Figures 12-6 and 12-30e) is due to a protein complex called MICOS (mitochondrial contact site and cristae organizing system), which has an integral membrane protein subunit that homooligomerizes and bends the inner membrane to produce high curvature. MICOS also mediates close juxtaposition of the outer membrane and inner membrane by binding to outer membrane–associated proteins. The binding partners for MICOS in the outer membrane include the Tom and SAM protein complexes (these complexes, discussed in Chapter 13, are involved in import of proteins into the mitochondria). MICOS is necessary to maintain normal structures of cristae in mitochondria. Additionally, MICOS appears to function as a diffusion barrier to prevent mixing of the distinct proteins and lipids in the boundary membrane and crista membranes. We will discuss the molecular basis of the curvature at the edges and tips of the cristae in Section 12.6.
The outer and inner membranes topologically define two fluid-filled submitochondrial compartments: the mitochondrial intermembrane space, between the outer and inner membranes, and the mitochondrial matrix, or central compartment, which forms the lumen within the inner membrane (see Figure 12-6a). Many of the proteins directly involved with transforming the energy of nutrients into the energy stored in ATP, such as the proteins of the electron-transport chain and ATP synthase, are located in the inner mitochondrial membrane. In typical liver mitochondria, for example, the surface area of the inner membrane, including cristae, is about five times that of the outer membrane. In fact, the total area of all inner mitochondrial membranes in liver cells is about 17 times that of the plasma membranes. The mitochondria in heart and skeletal muscle contain three times as many cristae as are found in typical liver mitochondria — presumably reflecting the greater demand for ATP by muscle cells. Over a thousand different types of polypeptides are required to make and maintain mitochondria and permit them to function. Defective functioning of mitochondria-associated proteins — due, for example, to inherited genetic mutations — leads to over 250 human diseases. The most common of these are electron-transport chain diseases, which result from mutations in any one of 150 genes and exhibit a very wide variety of clinical abnormalities affecting muscles, the heart, the nervous system, and the liver, among other physiological systems. Other mitochondria-associated diseases include Miller syndrome, which results in multiple anatomic malformations, and connective tissue defects.
The most abundant protein in the outer mitochondrial membrane is a mitochondrial β-barrel porin called VDAC (voltage-dependent anion channel), a multifunctional transmembrane channel protein that is similar in structure to bacterial porins (see Figure 10-18). Ions and most small hydrophilic molecules (up to about 5000 Da) can readily pass through these channel proteins when they are open. Although there may be metabolic regulation of the opening of mitochondrial porins and thus of the flow of metabolites across the outer membrane, the inner membrane is the major permeability barrier between the cytosol and the mitochondrial matrix, controlling the rate of mitochondrion-mediated oxidation and ATP generation. Proteins constitute 76 percent of the total mass of the inner mitochondrial membrane — a higher fraction than in any other cellular membrane. Many of these proteins are key participants in oxidative phosphorylation. They include ATP synthase, proteins responsible for electron transport, and a wide variety of transport proteins that permit the movement of metabolites between the cytosol (via the intermembrane space) and the mitochondrial matrix. The human genome encodes 48 members of one family of mitochondrial transport proteins. One of these, the carrier, is an antiporter that moves newly synthesized ATP out of the matrix and into the inner membrane space (and subsequently the cytosol) in exchange for ADP originating from the cytosol. Without this essential antiporter, the energy trapped in the chemical bonds of mitochondrial ATP made in the matrix would not be available to the rest of the cell.
Mitochondria Contain DNA and Evolved from a Single Endosymbiotic Event Involving Alphaproteobacterium
Keep in mind that plants, as well as animals, have mitochondria and perform aerobic oxidation. In plants, stored carbohydrates, mostly in the form of starch, are hydrolyzed to glucose. Glycolysis then produces pyruvate that is transported into mitochondria, as in animal cells. Mitochondrial oxidation of pyruvate and concomitant formation of ATP occur in photosynthetic cells during dark periods when photosynthesis is not possible, and in roots and other non-photosynthetic tissues at all times. We will discuss photosynthesis in chloroplasts in Section 12.7. The inner mitochondrial membrane and matrix are the sites of most reactions involved in the oxidation of pyruvate and fatty acids to and and the coupled synthesis of ATP from ADP and (see Figure 1213). Each of these reactions occurs in a discrete membrane or space in the mitochondrion. Mitochondria Contain DNA and Evolved from a Single Endosymbiotic Event Involving Alphaproteobacterium Although the vast majority of DNA in most eukaryotes is found in the nucleus, some DNA is present within the mitochondria of animals, plants, and fungi and within the chloroplasts of plants. Many lines of evidence indicate that mitochondria and chloroplasts evolved from bacteria that were engulfed into ancestral cells, forming endosymbionts (Figure 12-7).
Over evolutionary time, most of the bacterial genes in the endosymbiont bacteria were lost from the organelles’ DNA — some were lost because their function was replicated by nuclear-encoded genes and others were simply transferred to nuclear chromosomes. However, mitochondria and chloroplasts in today’s eukaryotes retain DNA encoding several proteins essential for organelle function as well as the ribosomal and transfer RNAs required for the intramitochondrial and intrachloroplast synthesis of those proteins. Thus eukaryotic cells have multiple genetic systems: a predominant nuclear system and secondary systems with their own DNA, ribosomes (see Figure 3-49), and tRNAs in mitochondria and chloroplasts. As detailed in Chapter 13, the majority of proteins inside mitochondria and chloroplasts are encoded by nuclear DNA, synthesized on cytosolic ribosomes, and subsequently imported into the organelle.
FIGURE 12-7 Endosymbiont hypothesis for the evolutionary origin of mitochondria and chloroplasts. Endocytosis of a bacterium by an ancestral, precursor eukaryotic cell (step 1 ) would generate an organelle with two membranes, the outer membrane derived from the precursor’s plasma membrane and the inner one from the bacterial membrane (step 2 ). There is uncertainty as to whether the ancestral cell already contained a nucleus (as
shown here) or developed a nucleus concomitant with or subsequent to engulfing the bacterial precursor to the mitochondrion (left pathway). Proteins localized to the ancestral bacterial membrane would retain their orientation, such that the portion of the protein once facing the extracellular space would now face the intermembrane space. For example, the subunit of ATP synthase, localized to the cytosolic face of the bacterial membrane, would face the matrix of the evolving mitochondrion (left) or chloroplast (right). Budding of vesicles from the inner chloroplast membrane, such as occurs during development of chloroplasts in contemporary plants, would generate the thylakoid membranes with the subunit remaining on the cytosolic face, facing the chloroplast stroma (step 3 ). The organelle DNAs are indicated. Membrane surfaces facing a shaded area are cytosolic faces; surfaces facing an unshaded area are exoplasmic faces. Description The first illustration shows an ancestral cell with eukaryotic plasma membrane and nucleus. An arrow labeled, Step 1. Endocytosis of bacterium capable of oxidative phosphorylation, leads to a second cell structure on the left. An arrow labeled, Step 1. Endocytosis of bacterium capable of photosynthesis, leads to a third cell structure on the right. The second cell structure on the left shows an ancestral cell engulfing a bacterium having A T P synthase on the bacterial plasma membrane and a circular bacterial D N A inside. This leads to Step 2 with bacterium enclosed in a vesicle. The interior of the bacterium is labeled mitochondrial matrix and has three circular mitochondrial genomes. A text below reads, bacterial plasma membrane becomes inner membrane of mitochondrion. The third cell structure on the right shows an ancestral cell engulfing a bacterium having A T P synthase on the bacterial plasma membrane and a circular bacterial D N A inside. This leads to Step 2 with bacterium enclosed in a vesicle. This further leads to Step 3 where inner membrane buds off thylakoid vesicles. The interior of the bacterium is labeled stroma and has a single linear chloroplast genome and a stack of thylakoid with thylakoid membrane around it. A text below reads, bacterial plasma membrane becomes inner membrane of chloroplast.
The Size, Structure, and Coding Capacity of mtDNA Vary Considerably Among Organisms
Analysis of mitochondrial DNA (mtDNA) sequences from multiple eukaryotes provides strong support for the idea that the mitochondrion had a single origin, most likely a bacterial symbiote whose closest contemporary relatives are alphaproteobacteria (also called α purple, see
Figure 1-1). Because these are obligate intracellular parasites, the ancestor of mitochondria may have had an intracellular lifestyle that facilitated its evolution into an intracellular symbiote. In organisms whose mtDNA includes only a limited number of genes, the same set of mitochondrial genes is retained, regardless of the phyla that include these organisms. There are several hypotheses for why these genes were never successfully transferred to the nuclear genome: their encoded polypeptides are too hydrophobic to be imported from the cytosol by crossing the outer mitochondrial membrane, the large size of rRNAs may interfere with their import into mitochondria, and differential regulation of their expression in response to conditions within individual mitochondria may be advantageous. If these genes were located in the nucleus, it would be difficult to tailor the regulation of their expression to accommodate specifically the needs of only one or a few mitochondria whose status required an alteration in gene expression. The Size, Structure, and Coding Capacity of mtDNA Vary Considerably Among Organisms
Surprisingly, the size of the mtDNA, the number and nature of the proteins it encodes, and even the mitochondrial genetic code itself can vary greatly between different organisms. The mtDNAs of most multicellular animals are approximately 16-kb circular molecules that encode intron-less genes compactly arranged on both DNA strands. Vertebrate mtDNAs encode the two rRNAs found in mitochondrial ribosomes, the 22 tRNAs used to translate mitochondrial mRNAs, and 13 proteins involved in electron transport and ATP synthesis. The smallest mitochondrial genomes in Plasmodium, intracellular parasites that cause malaria in humans (Figure 1-25) are only about 6 kb, encoding three proteins and the mitochondrial rRNAs. Plant mitochondrial genomes are many times larger than those of metazoans, in part due to the presence of non-protein-coding introns, pseudogenes, mobile DNA elements, and pieces of foreign (chloroplast, nuclear, and viral) DNA, evidence of many DNA changes during evolution of these plants. For instance, Arabidopsis thaliana, a member of the mustard weed family, has 366 kb of mtDNA and cucurbit plants (e.g., melon and cucumber) have about 2 Mb of mtDNA. Several proteins encoded by mtDNA in some species are encoded by nuclear DNA in other, closely related species. A striking example involves the coxII gene, which encodes subunit 2 of cytochrome c oxidase in the mitochondrial electron-transport chain (described in detail below). This gene is found in mtDNA in all multicellular plants studied except for certain related species of legumes, including the mung bean and the soybean, in which the coxII gene is nuclear.
Mitochondrial DNA Is Located in the Matrix and Transferred During Mitosis to Daughter Cells by Cytoplasmic Inheritance
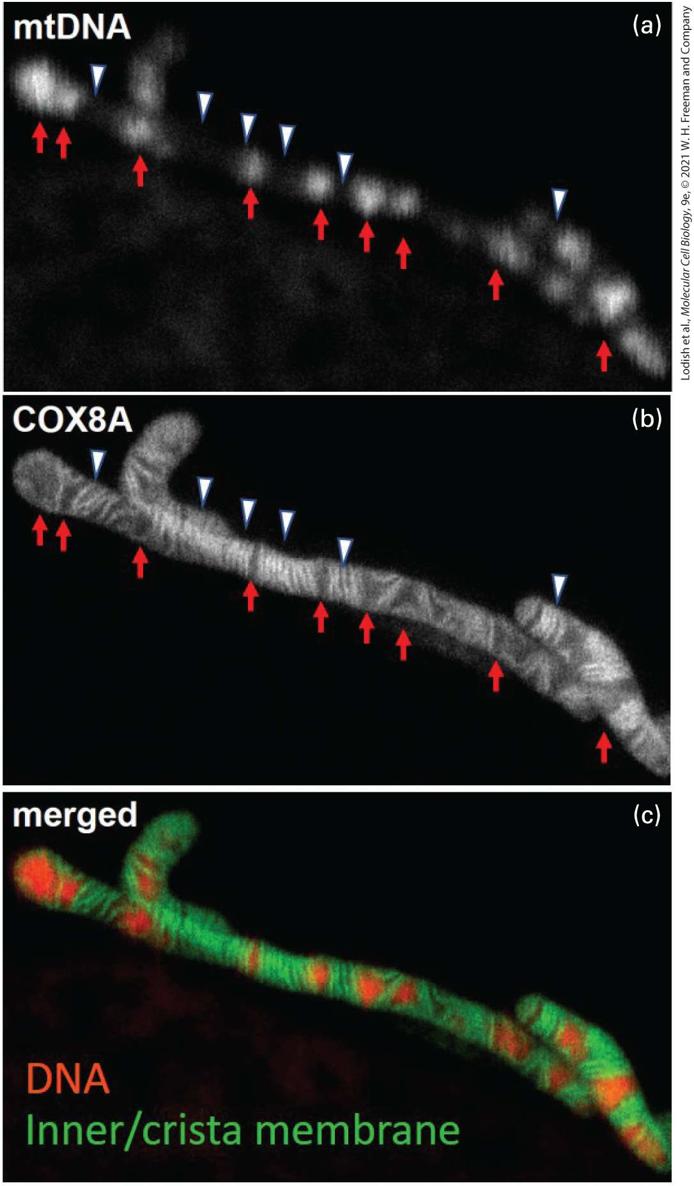
Most mtDNA encoded and intramitochondrially synthesized proteins identified thus far are subunits of multimeric complexes used in electron transport or ATP synthesis that we will describe shortly. Thus most of the mitochondrial proteome, such as those proteins involved in the processes listed in Table 12-1, are encoded by nuclear genes, synthesized on cytosolic ribosomes, and imported into the organelle by processes discussed in Chapter 13. Mitochondrial DNA Is Located in the Matrix and Transferred During Mitosis to Daughter Cells by Cytoplasmic Inheritance The mitochondrial DNA (mtDNA) is located in the mitochondrial matrix, and in the rapidly growing cells shown in Figure 12-8, the mtDNA is often seen in regions devoid of densely stacked cristae. Replication of mtDNA and division of the mitochondria can be followed in live cells using timelapse microscopy. Such studies show that in most organisms, mtDNA replicates throughout interphase. At mitosis, each daughter cell receives approximately the same number of mitochondria from the cytoplasm of the parental cell (a processed called cytoplasmic inheritance), but because there is no mechanism for apportioning exactly equal numbers of mitochondria to the daughter cells, some cells contain more mtDNA than others. If a mutation occurs in one mtDNA molecule in a cell, after cell division one daughter cell but not the other might inherit the mutant
mtDNA molecule, but most of the mtDNA molecules in that cell would not carry the mutation. The total amount of mtDNA in a cell depends on the number of mitochondria, the size of the mtDNA molecules, and the number of mtDNA molecules per mitochondrion. Each of these parameters varies greatly between cell types. A typical human cell has about 1000–2000 mtDNA molecules; however, a human egg has about 500,000 mtDNA molecules, and a sperm has only about 100.
EXPERIMENTAL FIGURE 12-8 Dual staining reveals multiple mitochondrial DNA molecules in the mitochondrial matrix. Live human HeLa cells expressing a fluorescently labeled mitochondrial inner membrane protein (COX8A) that preferentially localizes in the cristae were treated with the double-stranded DNA binding fluorescent dye PicoGreen and then examined using (a) confocal microscopy to visualized the stained mitochondrial DNA and (b) superresolution microscopy to visualize the inner/cristae membranes (COX8A fluorescence). White arrowheads and red arrows highlight regions in this single mitochondrion with either little or intense mtDNA staining, respectively, in panel (a), and corresponding regions with either relatively dense stacks of cristae or regions relatively devoid of cristae stacks in panel (b). In general, the mtDNA in the matrix was concentrated in regions relatively devoid of dense cristae stacks. (c) Merged image of DNA staining (red) and Cox8A fluorescence (inner/crista membrane, green). [T. Stephan et al., 2019, “Live-Cell STED Nanoscopy of Mitochondrial Cristae.” Sci. Rep. 9:12419 (2019). https://doi.org/10.1038/s41598-019-48838-2.] Description The black-and-white micrograph (a) labeled m t D N A shows a mitochondrial D N A with red arrows pointing to bright regions and white arrowheads pointing to dark regions, alternatively, on the D N A. The black-and-white high-resolution micrograph (b) labeled COX 8 A shows the similar structure with red arrows pointing to thin dark regions and white arrowheads pointing to thick bright regions. The colored micrograph (c) labeled merged shows the similar structure as (b) with the thick regions colored green and thin regions colored red. The dramatic difference in the amount of mtDNA per cell in eggs and sperm has a profound effect on the inheritance of mtDNA. In mammals and most other multicellular organisms, the sperm contributes little (if any) cytoplasm to the zygote, and virtually all the mitochondria in the embryo are derived from those in the egg, not the sperm. Studies in mice have shown that 99.99 percent of mtDNA is maternally inherited, but a
Products of Mitochondrial Genes Are Not Exported
small part (0.01 percent) is inherited from the male parent. In higher plants, mtDNA is inherited exclusively in a uniparental fashion through the female parent (egg), not the male (pollen). Products of Mitochondrial Genes Are Not Exported Most, if not all, RNA transcripts of mtDNA and their translation products remain in the mitochondrion in which they are produced, and all mtDNAencoded proteins are synthesized on mitochondrial ribosomes. Mitochondrial DNA encodes the rRNAs of mitochondrial ribosomes, although most of the ribosomal proteins are imported from the cytosol. In animals and fungi, all the tRNAs used for protein synthesis in mitochondria are also encoded by mtDNAs. However, in plants and many protozoans, most mitochondrial tRNAs are encoded by the nuclear DNA and imported into the mitochondrion. The structure of the human mitochondrial ribosome is shown in
Figure 3-49. Reflecting the bacterial ancestry of mitochondria, mitochondrial ribosomes resemble bacterial ribosomes and differ from eukaryotic cytosolic ribosomes in their RNA and protein compositions, their size, and their sensitivity to certain antibiotics (see Table 5-2). For instance, chloramphenicol blocks protein synthesis by bacterial and mitochondrial ribosomes from most organisms, but cycloheximide, which inhibits protein synthesis on eukaryotic cytosolic ribosomes, does not
Mutations in Mitochondrial DNA Cause Several Genetic Diseases in Humans
affect mitochondrial ribosomes. This sensitivity of mitochondrial ribosomes to the important aminoglycoside class of antibiotics, which includes chloramphenicol, is the main cause of the toxicity in patients that these antibiotics can cause. Mitochondrial Genetic Codes Can Differ from the Standard Nuclear Code The genetic code used in animal and fungal mitochondria is different from the standard code used in all prokaryotic, eukaryotic nuclear, and plant mitochondrial genes; remarkably, the code even differs among mitochondria from different species. Why and how these differences arose during evolution is a mystery. UGA, for example, is normally a stop codon, but is read as tryptophan by human and fungal mitochondrial translation systems; AGA and AGG, the standard nuclear codons for arginine, also code for arginine in fungal and plant mtDNA, but they are stop codons in mammalian mtDNA and serine codons in Drosophila mtDNA. Mutations in Mitochondrial DNA Cause Several Genetic Diseases in Humans
The severity of disease caused by a mutation in mtDNA depends on the nature of the mutation and on the proportion of mutant and wild-type mtDNAs present in a particular cell type. Generally when mutations in mtDNA are found, cells contain mixtures of wild-type and mutant mtDNAs — a condition known as heteroplasmy. Each time a mammalian somatic or germ-line cell divides, the mutant and wild-type mtDNAs segregate randomly into the daughter cells. Thus the mtDNA genotype, which fluctuates from one generation and from one cell division to the next, can drift toward predominantly wild-type or predominantly mutant mtDNAs. Since all enzymes required for the replication and growth of mammalian mitochondria, such as the mitochondrial DNA and RNA polymerases, are encoded in the nucleus and imported from the cytosol, a mutant mtDNA should not be at a replication disadvantage; mutants that have large deletions of mtDNA might even be at a selective advantage because they can replicate faster. Recent research suggests that the accumulation of mutations in mtDNA is an important component of aging in mammals. Mutations in mtDNA have been observed to accumulate over time, probably because mammalian mtDNA is not repaired in response to DNA damage. With few exceptions, all human cells have mitochondria, yet mutations in mtDNA affect only some tissues. Those most commonly affected are tissues that have a high requirement for the ATP produced by oxidative phosphorylation and tissues that require most or all of the mtDNA in the cell to synthesize sufficient amounts of functional
mitochondrial proteins. For instance, Leber’s hereditary optic neuropathy (degeneration of the optic nerve) is caused by a missense mutation in the mtDNA gene encoding subunit 4 of the NADH-CoQ reductase (complex I), a protein required for ATP production by mitochondria (see below). Several large deletions in mtDNA cause another set of diseases, including chronic progressive external ophthalmoplegia, characterized by eye defects, and Kearns–Sayre syndrome, characterized by eye defects, an abnormal heartbeat, and central nervous system degeneration. A third condition, causing “ragged-red” muscle fibers (with improperly assembled mitochondria) and associated uncontrolled jerky movements, is due to a single mutation in the TΨCG loop of the mitochondrial lysine tRNA. As a result of this mutation, the translation of several mitochondrial proteins is apparently inhibited. KEY CONCEPTS OF SECTION 12.3 The Structure of Mitochondria In eukaryotic cells, mitochondria use aerobic oxidation to generate ATP. These multifunctional organelles are also responsible for many other key activities (see
Table 12-1), including biosynthesis and metabolism of a wide variety of small molecules and regulated cell death. The mitochondrion has two distinct membranes (outer and inner) and two distinct subcompartments (the intermembrane space between the two membranes, and the matrix surrounded by the inner membrane) (see Figure 12-6). Aerobic oxidation occurs in the mitochondrial matrix and on the inner mitochondrial membrane. The inner mitochondrial membrane is a single continuous membrane with three compositionally, structurally, and functionally distinct domains: boundary membrane, cristae, and crista junctions. There are more than one thousand proteins associated with mammalian mitochondria, most of which are encoded by nuclear genes.
Mitochondria and chloroplasts contain DNA that encodes a relatively small number of proteins involved in mitochondrial or photosynthetic electron transport and ATP synthesis (13 in mammalian mitochondria), ribosomal RNAs and sometimes tRNAs necessary to translate the organelle mRNAs. Mitochondrial DNA (mtDNA) and chloroplast DNA most likely evolved from bacteria that formed a symbiotic relationship with ancestral cells (see Figure 12-7). Most of the genes originally in the bacterial precursors to mitochondria and chloroplasts were either lost because their functions were redundant with nuclear genes or moved to the nuclear genome over evolutionary time, leaving different gene sets in the organelle DNAs of different organisms. Animal mtDNAs are circular molecules, reflecting their probable bacterial origin. Plant mtDNAs and chloroplast DNAs are generally longer than mtDNAs from other eukaryotes, largely because they contain more noncoding regions and repetitive sequences. Mitochondrial DNA (mtDNA) is located in the mitochondrial matrix and is often seen in regions devoid of densely stacked cristae. Because most mitochondrial DNA (mtDNA) is inherited from egg cells rather than sperm, mutations in mtDNA exhibit a maternal cytoplasmic pattern of inheritance. Similarly, chloroplast DNA is exclusively inherited from the maternal parent. Mitochondrial ribosomes resemble bacterial ribosomes in their structure and in their sensitivity to drugs such as chloramphenicol (sensitive) and cycloheximide (resistant). The genetic code of animal and fungal mtDNA differs slightly from that of bacterial and nuclear genomes and varies among different animals and fungi. In contrast, plant mtDNAs appear to conform to the standard genetic code. Several human neuromuscular disorders result from mutations in mtDNA. Patients generally have a mixture of wild-type and mutant mtDNA in their cells (heteroplasmy): the higher the fraction of mutant mtDNA, the more severe the mutant phenotype.
Mitochondria Are Dynamic Organelles
12.4 The Dynamics of Mitochondria and MitochondrialER Membrane Contact Sites Mitochondria are dynamic organelles that move about through the cytoplasm, merge with one another (fuse) to form large networks and break away from these networks (fission). Mitochondrial functions can be influenced by these dynamic behaviors and by the abilities of their outer membranes to attach to and interact with the plasma membrane and membranes of other organelles. Here we describe several features of mitochondrial dynamics and mitochondrial-endoplasmic reticulum (ER) membrane contact sites. Mitochondria Are Dynamic Organelles Many methods, including analysis of fluorescently labeled mitochondria in live cells, have been used to show that mitochondria are highly dynamic. They can move about the cell within the cytoplasm and undergo frequent fusions (merging) and fissions (breaking apart) that generate tubular, sometimes branched networks (Figures 12-9a and b) which may account for some of the wide variety of mitochondrial morphologies seen in different types of cells. Damaged or otherwise malfunctioning
mitochondria can be recognized as such and consequently degraded as part of a quality control mechanism. EXPERIMENTAL FIGURE 12-9 Mitochondria undergo rapid fusion and fission. (a) A human HeLa cell labeled with a mitochondrion-specific fluorescent dye (MitoTracker Green) was imaged using three-dimensional structured illumination fluorescence microscopy (a -thick section through the cell is shown). The network of fused and branched mitochondria is seen in the cytoplasm, with only a few mitochondria observed above or below the nucleus (outlined by thin gray dashed line). The identity of the striations
seen within the mitochondria in this image is not known. The mitochondria are shown in artificial colors to indicate their positions relative to the surface to which the cell is attached (blue is closest to and red farthest from the surface). (b) Mitochondria labeled with a fluorescent protein in a live normal mouse embryonic fibroblast were observed using timelapse fluorescence microscopy. Several mitochondria undergoing fusion (top) or fission (bottom) are artificially highlighted in blue and with arrows. (c) Mitochondrial fusion (top) and fission (bottom) are mediated by a set of GTPase enzymes (MFN1, MFN2, OPA1, and DRP1). The integral membrane proteins MFN1 and MFN2 mediate outer mitochondrial membrane (OMM) fusion, which is followed by fusion of the inner mitochondrial membranes (IMM) mediated by the integral membrane protein OPA1. The matrix and inner membrane space (IMS) remain distinct. The soluble cytosolic GTPase DRP1 is recruited to a constricted site on the surface of a mitochondrion, where DRP1 polymers sever the membrane, resulting in fission. A variety of post-translational modifications of DRP1 regulate fission. (d) Left: Rat liver cells (hepatocytes) one day after being removed from the liver and placed in cell culture, are stressed and depolarized (lack some of the morphological and biochemical properties of epithelial cells; see Chapter 20), have low levels of oxidative phosphorylation and ATP production, and have fragmented mitochondria (visualized by staining with MitoTracker Green). Right: After growth in culture for 6 days, the hepatocytes become polarized, their mitochondria fuse, forming an extensive network, and the cells exhibit high levels of oxidative phosphorylation and ATP production. Insets show higher magnification views of the mitochondria. [(a) Reprinted with permission from Nature Publishing Group, from Shao et al., 2011, “Super-Resolution 3D Microscopy of Live Whole Cells Using Structured Illumination,” Nature Methods 8:121044–121046; permission conveyed through Copyright Clearance Center, Inc. (b) Republished with permission from Elsevier, modified from Chan D. C., 2006, “Mitochondria: Dynamic Organelles in Disease, Aging, and Development,” Cell 125(7):1241–1252; permission conveyed through Copyright Clearance Center, Inc. (c) Information from P. Mishra and D. C. Chan, 2014, Nat. Rev. Mol. Cell Biol. 15:634–646. (d) From D. Fu et al., 2013, “Coordinated Elevation of Mitochondrial Oxidative Phosphorylation and Autophagy Help Drive Hepatocyte Polarization,” Proc. Nat’l Acad. Sci. USA 110(18):7288–7293, Fig. 3 Day 1 and Day 6; courtesy Jennifer LippincottSchwartz.] Description
The part (a) shows a colored micrograph with several thread-like structures surrounding a dashed-line nucleus containing few thread-like structures. The part (b) shows six time-lapse micrographs arranged in two rows with arrows pointing to the blue threads. The top row with three micrographs shows fusion as follows: At 0 seconds, a long blue thread coming in contact with a small blue thread and two small blue threads beside them coming together; At 3 seconds, the long and small blue thread are almost touching at one end and similarly both small blue threads are touching at their ends; and at 6 seconds, the long and small blue thread are attached and similarly both small blue threads are attached together. The bottom row with three micrographs shows fission as follows: At 81 seconds, a blue thread made of two smaller detaching threads; At 84 seconds, the two smaller threads detach and move apart; and at 87 seconds, the two smaller threads are present at a distance. The part (c) shows two series of diagrams. The first series for fusion process shows two mitochondria with M F N 1 by 2 protein present on the outer mitochondrial membrane (O M M) and O P A 1 protein present on the inner mitochondrial membrane (I M M). Matrix is present inside I M M and M F N 1 by 2 of both mitochondria are attached. A rightward arrow labeled, O M M fusion, points to a diagram showing fused O M M of both mitochondria and O P A 1 protein of both are attached. A rightward arrow labeled, I M M fusion, points to a diagram showing fused outer and inner membranes of both mitochondria. The first series for fission process shows a mitochondrion with labeled matrix and I M S. A rightward arrow labeled, constriction, D R P 1 recruitment, points to mitochondrion with a constriction in middle surrounded by several D R P 1 polymer band. A rightward arrow labeled, fission, points to two mitochondria. The part (d) shows two photos of liver mitochondria. The left photo shows fragmented mitochondria and a text reads, Stressed, low A T P production. The right photo shows fused mitochondrial network and a text reads, Unstressed, high A T P production. Intracellular Mitochondrial Movements Intracellular movement helps to establish the proper geographical distribution of mitochondria within cells. As we shall see below, cells
require that activities of mitochondria and other structures, including other organelles, must be coordinated. For example, in neurons (see Chapter 23) that have extensions called axons that can be centimeters to even a meter long, mitochondria must be transported from the region near the nucleus (cell body) to the ends of the axon where contact is made with other neurons to provide energy (ATP) and to regulate calcium levels (see below and Chapter 15). Proteins on the cytoplasmic surface of the outer mitochondrial membrane mediate mitochondrial interactions with motor proteins such as kinesin (Chapter 18) that drive intracytoplasmic movement via microtubules (Figure 18-28), including long distance movement through the axons of neurons. One such protein is called Miro, a GTPase that has calcium binding EF hands (Figure 3-7) that appear to confer calcium sensitivity to mitochondrial movement. Miro indirectly links mitochondria to kinesin, and it also is associated with MICOS in the inner membrane and thus influences cristae structure and function. Miro has also been implicated in mitochondrial-endoplasmic reticulum interactions and in Parkinson’s disease, both described below. In addition to intracellular movement, mtDNA, and indeed intact mitochondria, have reported to be transferred from one cell to another via membrane tubules called tunneling nanotubes, which are described in Chapter 20. Mitochondrial Fusion and Fission When individual mitochondria fuse, each of the two membranes fuses (inner with inner, and outer with outer) and each of their distinct compartments intermix (matrix with matrix, intermembrane space with intermembrane space). A set of four evolutionarily conserved GTP-
hydrolyzing (GTPase) enzymes — MFN1 (mitofusin 1), MFN2 (mitofusin 2), OPA1, and DRP1 — plays critical roles in mediating these membrane fusions and fissions (Figure 12-9c). These enzymes are members of the dynamin family of GTPases. Dynamin, the first-identified member of this family, mediates a comparable membrane fission reaction required during the pinching off of endocytic vesicles from the plasma membrane (see
Chapter 14). Mutations in several of the genes encoding these GTPases can disrupt mitochondrial functions, such as maintenance of proper inner membrane structure and electric potential, the function of which is described in Section 12.6. These mutations result in truncated or enlarged mitochondria and can cause human disease. The inherited, autosomal dominant neuromuscular disease Charcot-Marie-Tooth subtype 2A is caused by loss-of-function mutations in MFN2 that lead to defects in peripheral nerve function and progressive muscle weakness, mainly in the feet and hands. Mutations in OPA1 are associated with autosomal dominant optic atrophy that influences nerves in the eye’s retina. What is the value of mitochondrial fission and fusion? It has been suggested that fusion helps to maintain a relatively homogeneous population of mitochondria within a cell. Should some subset of individual mitochondria suffer deleterious modification or loss of important components, fusion with other mitochondria would permit restoration by sharing of those components. Studies of cells and organisms with mutations in genes encoding the fusion machinery suggest that fusion also plays a role in the proper localization of mitochondria within cells, maintaining the proper morphology and cristal organization, distribution
of mitochondrial DNA, and maintenance of fully functional electron transport. A number of functions are served by mitochondrial fission. For example, mitochondrial fission is particularly active when cells divide (particularly during the and M phases of the cell cycle; see Chapter 19). As a consequence, the multiple discrete mitochondria generated by fission are readily distributed into both daughter cells. In addition, fission provides a powerful mechanism of quality control by culling defective segments of mitochondria from the interconnected, healthy mitochondrial network. Should a portion of a large mitochondrial network become damaged or dysfunctional — for example, by the generation of high levels of reactive oxygen species (discussed later) or by mutations in the mitochondrial DNA — fission can separate the compromised segments from healthy segments. Mitophagy Provides Mitochondrial Quality Control Cells have the capacity to recognize damaged or dysfunctional segments of the mitochondrial network and, after they detach from the network, can surround them with a membrane and then deliver them to lysosomes for degradation. This destruction of mitochondria, which is called mitophagy (“eating mitochondria”), is a subset of the general process called autophagy (“self eating”) by which cells engulf in membranes and degrade organelles and portions of the cytosol (see Chapter 14). For example, when the environment of a cell has inadequate oxygen (hypoxia), enzymatic
modification of proteins on the outer mitochondrial membrane induces mitophagy. Hereditary early onset Parkinson’s disease is caused by mutations in two gene encoding proteins that can mediate mitophagy. The proteins are PINK1 (a kinase) and Parkin (an E3 ubiquitin ligase that ubiquitinylates a substrate protein, thus targeting it for destruction by proteasomes; see
Chapter 3). In healthy mitochondria, PINK1 resides in the mitochondrial matrix. In damaged or dysfunctional mitochondria, PINK1 resides on the outer mitochondrial membrane, where it recruits cytosolic Parkin. The Parkin is activated and polyubiquitinylates outer membrane proteins, thus targeting them for degradation and inducing mitophagy. There also are mechanisms that mediate mitophagy. Some studies suggest that mitochondrial stress (due to aging, pathogens, etc.) can induce inflammation and contribute to pathology and that mitophagy may mitigate mitochondrial stress-induced inflammation by removing defective segments of mitochondria. Mitochondrial dynamism has additional features that are worth mentioning. Mitochondrial structure and function can change in response to the metabolic state of the cells. For example, the isolation of rat liver cells (hepatocytes) from the body and their transfer into cell culture stresses the cells and results in their depolarization (loss of some of their epithelial cell properties; see Chapter 20). These cells exhibit fragmentation of their mitochondria (Figure 12-9d, left) accompanied by low generation of ATP via oxidative phosphorylation. As the cells adjust
Mitochondrial Function and Dynamics Can Depend on Direct Contacts with Other Organelles
to growth in cell culture, they become polarized (have a morphology and biochemistry more like that of hepatocytes in a liver), increase mitochondrial generation of ATP via oxidative phosphorylation, and exhibit an extensive network of fused mitochondria (Figure 12-9d, right). Mitochondrial Function and Dynamics Can Depend on Direct Contacts with Other Organelles The activities of mitochondria and other organelles must be coordinated with one another for efficient and effective cell function. Such coordination requires inter-organelle communication, including transfer of ions, small molecules, and macromolecules between organelles. Four mechanisms for such transfers include: release into the cytosol and organelle uptake of ions and small molecules by transporters, pumps, and channels (Chapter 11); transfer of proteins across organelle membranes via pore-like integral membrane proteins (Chapter 13); transport via small membrane vesicles (Chapter 14); and direct, protein-mediated organelleorganelle binding via membrane contact sites (MCSs). Mitochondria establish MCSs with many other organelles, including the endoplasmic reticulum (ER), lysosomes (vacuoles in yeast), peroxisomes, the plasma membrane, the Golgi, endosomes, and even lipid droplets (Chapter 10). Here we will focus on mitochondrial-ER MCSs. The portions of the ER membranes that form special contact regions with the mitochondria are called mitochondria-associated membranes, or MAMs.
Mitochondrial-ER MCSs can be visualized using electron microscopy and fluorescence microscopy (Figure 12-10). The MAMs’ lipid and protein composition differs somewhat from that of the rest of the ER. At the MCSs, tethering proteins hold the MAM and the outer mitochondrial membrane about 10–30 nm apart. Those tethering proteins in yeast have been identified as a protein complex called ERMES. Mammals do not have the ERMES complex; they use what appears to be a variety of other proteins to tether mitochondria to the ER (see Figure 15-29). EXPERIMENTAL FIGURE 12-10 At mitochondrial-ER membrane contact sites (MCSs) specialized regions of the endoplasmic reticulum called mitochondria-associated membranes (MAMs) directly contact mitochondria and influence mitochondrial shape, function, and sites of fission. (a) Three-dimensional model of a segment of a mitochondrion
(red, only outer membrane shown) and the adjacent ER (yellow) determined from a line of cultured avian lymphoma cells using EM tomography (assembly of a three-dimensional image from consecutive individual sections). At the MCS, the MAM is the portion of the ER membrane that is closely apposed (10–30 nm distance) to the outer mitochondrial membrane. The regions of the MCSs are indicated by brackets. (b) A three-dimensional model of a mitochondrion (red) and adjacent MAMs (green) from a yeast cell using EM tomography. The two MAM domains are derived from ER tubules that in some cases can wrap around the mitochondrion, in the top case forming a clamp-like structure at the MCS that appears to constrict the mitochondrion in preparation for fission. (c) Many mitochondrial fission events occur at the mitochondrial-ER MCSs. These live-cell fluorescence microscopic images of a Cos-7 monkey cell show such a fission event observed over the 8 seconds of imaging. We see mitochondria (green) and tubular ER (magenta) in a single field of view at 4-second intervals, visualized using a superresolution (97 nm) and high-speed method called grazing incidence-structured illumination microscopy. The arrows in the upper panel point to sites of constriction in the mitochondria at MCSs that will develop into sites of DRP1-mediated fission. The upper panel shows the cell at 0 seconds and the area outlined by a white dashed box is shown in the lower panels at three times (0, 4, and 8 seconds), which illustrate the rapid fission (white brackets indicate separation of the released mitochondrial ends) initiated at the MCS (white dotted oval in the left panel). To visualize the mitochondria and ER, the Cos-7 cells were transfected with cDNA vectors encoding two fluorescent proteins that specifically accumulate in either the outer mitochondrial membranes (mEmerald-Tomm20) or the lumen of the ER (mCherry-KDEL). [Part (a) G. Csordás et al., 2006, J. Cell Biol. 174:915–921; https://doi.org/10.1083/jcb.200604016. Part (b) Republished with permission from American Association for the Advancement of Science, from J. R. Friedman et al., 2011, “ER Tubules Mark Sites of Mitochondrial Division,” Science 334(6054):358–362; permission conveyed through the Copyright Clearance Center, Inc. Part (c) Reprinted with permission from Elsevier, from Y. Guo et al., 2018, “Visualizing Intracellular Organelle and Cytoskeletal Interactions at Nanoscale Resolution on Millisecond Timescales,” Cell 175(5):1430–1442; permission conveyed through Copyright Clearance Center, Inc.] Description
The part (a) shows a three-dimensional model of a mitochondrion with circular red outer membrane and two yellow endoplasmic reticula (E R) attached on both sides. The contact sites are labeled M A M. The part (b) shows a three-dimensional model of a red mitochondrion attached to a curved green E R. The two contact sites are labeled M A M and have sites of constriction for fission. The part (c) shows a micrograph and a series of time-lapse micrograph displaying mitochondrial fission. The micrograph shows few thick green mitochondria embedded in a web-like magenta E R with several arrows pointing to their sites of attachment where constriction occurs. The series of micrographs show a single site of constriction as follows: At 0 seconds, an arrow labeled constriction points to a M C S; At 4 seconds, at M C S, fission occurs and the mitochondria splits; and at 8 seconds, the distance enlarges between detached mitochondria. Mitochondrial-ER MCSs significantly contribute to many cellular processes (see Table 12-1). For example, these MCSs play important roles in mitochondrial dynamics. A majority of mitochondrial fission events occur at the mitochondrial-ER MCSs, although most of the MCSs are not associated with sites of fission. MCSs apparently initiate mitochondrial constriction by inducing an increased local density of filamentous actin polymers that, with the aid of myosin motor proteins, contract (Chapter 17). The contractions squeeze down on and thus constrict the mitochondrion. The change of shape of the mitochondrial outer membrane at the constriction recruits DPR1, which completes membrane fission (see
Figure 12-9c). In yeast, MAM tubules have been seen to loop completely around mitochondria (Figure 12-10b). In mammalian cells, the MAMs contact the mitochondria at fission sites, but they usually do not appear to loop fully around the mitochondria (Figure 12-10c).
MCSs also serve as interfaces for the transfer of ions (e.g., ) and small molecules (e.g., glycerophospholipids) between the ER and mitochondria. These MCSs play an integral role in intracellular calcium and energy metabolism. Variations in the concentrations of calcium ions in intracellular compartments — cytosolic calcium mitochondrial calcium , and calcium in the ER — are employed to control a wide variety of activities within cells, a process called calcium signaling (see Chapter 15). Calcium is also important for extracellular processes, such as the activity of some blood-clotting proteins. Intramitochondrial calcium ions play an important role in controlling mitochondrial function, and MCSs mediate this control by delivering calcium from the ER to mitochondria. For example, an increase in in the matrix can increase mitochondrial production of ATP. Increased directly increases the activities of three mitochondrial enzymes that produce NADH from pyruvate dehydrogenase (see Figure 125), and α-ketoglutarate and isocitrate dehydrogenases (see Figure 12-13 in the following section). As we shall see later in this chapter, NADH provides high-energy electrons for ATP synthesis. Thus continuous lowlevel release of from ER MAMs into mitochondria is necessary for ATP synthesis when cells are in a basal, or resting, state. Increased delivery of via MCSs can occur when cells require more ATP — for example, when muscle cells are stimulated to contract. Strikingly, calcium signaling is used both to induce muscle contraction (see Chapter 17) and coordinately to increase mitochondrial ATP synthesis to provide the energy to fuel that contraction. When is elevated, mitophagy can be induced. Indeed, mitochondrial calcium overload can activate regulated
cell death pathways (Chapter 22). Thus the control of can literally control the life and death of cells. KEY CONCEPTS OF SECTION 12.4 The Dynamics and Functions of Mitochondria Mitochondria are dynamic organelles, undergoing intracellular transport, as well as fusion and fission reactions that are regulated by the state of the cell. In many cells, the fused mitochondria form a large, interconnected branched tubular network. A family of GTPases mediate mitochondrial membrane fusion and fission (see Figure 12-9). Mutations in the genes encoding some of these GTPases cause human diseases. Mitochondrial fission and fusion are thought to play roles in maintaining a relatively homogeneous population of mitochondria, distributing mitochondria among the daughter cells during cell division, and establishing a system of quality control to permit culling of defective mitochondria from healthy mitochondria. Defective mitochondria or segments of mitochondria are destroyed by a processed called mitophagy. Two proteins that can mediate mitophagy, PINK1 and Parkin, are encoded by genes that, when mutated, can be responsible for hereditary early onset Parkinson’s disease. Membrane contact sites (MCSs) are regions of organelles that directly bind to one another via tethering proteins. Mitochondria form MCSs with many different organelles. Mitochondrial-endoplasmic reticulum (ER) MCSs significantly influences many cellular functions, including mitochondrial shape and dynamics (see Table 12-1). The portions of the ER membranes that are in contact with mitochondria at MCSs are called mitochondria-associated membranes (MAMs) (see Figure 12-10). A majority of mitochondrial fission events occur at the mitochondrial-ER MCSs, although most of the MCS are not associated with sites of fission. MCSs also serve as interfaces for the transfer of ions (e.g., ) and small molecules (e.g., glycerophospholipids) between the ER and mitochondria. These MCSs play an integral role in intracellular calcium and energy metabolism. Calcium influx into mitochondria from MAMs can stimulate ATP synthesis and, in the context of mitochondrial calcium overload, initiates a program of regulated cell death.
In the First Part of Stage II, Pyruvate Is Converted to Acetyl CoA and High-Energy Electrons
12.5 The Citric Acid Cycle and Fatty Acid Oxidation We now continue our detailed discussion of glucose oxidation and ATP generation, exploring what happens to the pyruvate generated during glycolysis (stage I, see Figures 12-1 and 12-3) after it is transported into the mitochondrial matrix. The last three of the four stages of glucose oxidation (Figure 12-11) are: Stage II: Stage II can be subdivided into two distinct parts: (1) the conversion of pyruvate to acetyl CoA and , followed by (2) oxidation of acetyl CoA to in the citric acid cycle. These oxidations are coupled to reduction of to NADH and of FAD to . These two carriers can be considered the sources of highenergy electrons. (Fatty acid oxidation follows a similar route, with conversion of fatty acyl CoA to acetyl CoA.) Most of the reactions occur in or on the inner membrane facing the matrix. Stage III: Electron transfer from NADH and to via an electron-transport chain within the inner membrane converts the energy carried in those electrons into an electrochemical gradient across that membrane, called the proton-motive force. Stage IV: The energy of the proton-motive force is harnessed for ATP synthesis in the inner mitochondrial membrane. Stages III and IV together are called oxidative phosphorylation.
In the First Part of Stage II, Pyruvate Is Converted to Acetyl CoA and HighEnergy Electrons Within the mitochondrial matrix, pyruvate reacts with coenzyme A, forming , acetyl CoA, and NADH (see Figure 12-11, stage II). This reaction, catalyzed by pyruvate dehydrogenase, is highly exergonic and essentially irreversible. Influx of calcium into the mitochondria at mitochondrial-ER MCSs (from the ER MAM) increases the activity of pyruvate dehydrogenase, driving the formation of acetyl CoA.
FIGURE 12-11 Summary of aerobic oxidation of glucose and fatty acids. Stage I: In the cytosol, glucose is converted to pyruvate (glycolysis) and fatty acid to fatty acyl CoA.
Pyruvate and fatty acyl CoA then move into the mitochondrion. Mitochondrial porins make the outer membrane permeable to these metabolites, but specific pyruvate and fatty acid transport proteins (yellow and blue colored ovals, respectively) in the inner membrane are required to import these molecules into the matrix. Fatty acyl groups are transferred from fatty acyl CoA to an intermediate carrier, transported across the inner membrane, and then reattached to CoA on the matrix side. Stage II: In the mitochondrial matrix, pyruvate and fatty acyl CoA are converted to acetyl CoA and then oxidized, releasing . Pyruvate is converted to acetyl CoA with the formation of NADH and ; two carbons from fatty acyl CoA are converted to acetyl CoA with the formation of and NADH. Oxidation of acetyl CoA in the citric acid cycle generates NADH and , GTP, and Stage III: Electron transport reduces to and generates a proton-motive force. Electrons (blue) from reduced coenzymes NADH and , are transferred via electron-transport complexes (colored shapes) to concomitant with transport of ions (red) from the matrix to the intermembrane space, generating the proton-motive force. Electrons from NADH flow from complex I (blue) to complex III (orange), bypassing complex II (yellow). Electrons from succinate flow through within complex II to complex III (orange), bypassing complex I. Stage IV: ATP synthase, also called the complex (orange), harnesses the proton-motive force to synthesize ATP in the matrix. Antiporter proteins (purple and green ovals) transport ADP and into the matrix and export hydroxyl groups and ATP. NADH generated in the cytosol is not transported directly to the matrix because the inner membrane is impermeable to and NADH; instead, a shuttle system (red) transports electrons from cytosolic NADH to in the matrix. diffuses into the matrix, and diffuses out. Description The illustration shows a mitochondrion inside a cytosol having outer mitochondrial membrane (permeable to metabolites), intermembrane space, inner mitochondrial membrane, and mitochondrial matrix. Stage 1 occurring in cytosol is as follows: glucose is converted to 2 pyruvates while simultaneously converting 2 N A D plus to 2 N A D H and 2 AT P are produced; fatty acid is converted to fatty acyl Co A while simultaneously converting A T P and H S Co A to A M P and P P i. Both pyruvates and fatty acyl Co A are transported inside mitochondrial matrix by transporters. Stage 2 occurring in mitochondrial matrix is as follows: Pyruvate is converted to acetyl Co A while simultaneously converting N A D plus to N A D H and C O 2 is produced;
also, fatty acyl Co A is converted to acetyl Co A while simultaneously converting N A D plus to N A D H and F A D to F A D H 2. The C O 2 exits the matrix into intermembrane space. Next, acetyl Co A enters the citric acid cycle and G T P, 2 C O 2, F A D H 2, and 3 N A D H are produced. The 2 C O 2 molecules exits the matrix into intermembrane space. The N A D H from cytosol enters the mitochondria and is converted to N A D plus by electron shuttle present in the inner membrane that simultaneously converts N A D plus to N A D H. This N A D H enters the stage 3 electron-transport chain occurring on the inner mitochondrial membrane as follows: the first intermembrane complex converts N A D H to N A D plus producing electron which is transported to complex 3. The second complex converts succinate to fumarate producing F A D which is transported to complex 3 from where they are transported to complex 4. All four complexes shuttle H plus ions from matrix to intermembrane space. The complex 4 also converts O 2 to H 2 O inside matrix. The overall process is: 2 electrons along with 2 H plus ions and onehalf O 2 yield H 2 O. Stage 4 occurs on F 0 F 1 complex embedded in the inner mitochondrial membrane and is as follows: 3 H plus ions from intermembrane space enter the matrix via the complex that simultaneously A D P and P i to A T P inside the matrix. The A T P is transported out by transporter embedded on the inner mitochondrial membrane that also transports in A D P. Another transporter moves out O H minus while transports in P i. Acetyl CoA is a molecule that consists of a two-carbon acetyl group covalently linked to a longer molecule known as coenzyme A (CoA) (Figure 12-12). It plays a central role in the oxidation of pyruvate, fatty acids, and amino acids. In addition, it is an intermediate in numerous biosynthetic reactions, including the transfer of an acetyl group to histones (Figure 8-33) and many other mammalian proteins, and the synthesis of lipids such as cholesterol (Figure 10-26). In respiring mitochondria, however, the two-carbon acetyl group of acetyl CoA is almost always
In the Second Part of Stage II, the Citric Acid Cycle Oxidizes the Acetyl Group in Acetyl CoA to CO2 and Generates High-Energy Electrons
oxidized to via the citric acid cycle. Note that the two carbons in the acetyl group come from pyruvate; the third carbon of pyruvate is released as carbon dioxide.
FIGURE 12-12 The structure of acetyl CoA. This compound, consisting of an acetyl group covalently linked to a coenzyme A (CoA) molecule, is an important intermediate in the aerobic oxidation of pyruvate, fatty acids, and many amino acids. It also contributes acetyl groups to many biosynthetic pathways. Description The chemical structure of acetyl Co A shows C H 3 single bond C O single bond S single bond left parentheses C H 2 right parentheses 2 single bond N H single bond C O single bond left parentheses C H 2 right parentheses 2 single bond N H single bond C O single bond H C O H single bond C H 3 C C H 3 single bond C H 2 single bond O single bond P O O negative single bond O single bond P O O negative single bond ribose single bond adenine and phosphate. The starting structure, C H 3 single bond C O, is labeled acetyl group and the rest of the structure is labeled coenzyme A (Co A). In the Second Part of Stage II, the Citric Acid Cycle Oxidizes the Acetyl Group in Acetyl CoA to and Generates High-Energy Electrons
Nine sequential reactions operate in a cycle to oxidize the acetyl group of acetyl CoA to (see Figures 12-11 and 12-13, stage II). This cycle is referred to by several names: the citric acid cycle, the tricarboxylic acid (TCA) cycle, and the Krebs cycle. The net result is that for each acetyl group entering the cycle as acetyl CoA, two molecules of , three of NADH, and one each of and GTP are produced. NADH and are high-energy electron carriers that will play a major role in stage III of mitochondrial oxidation: electron transport. As shown in Figure 12-13, the cycle begins with condensation of the twocarbon acetyl group from acetyl CoA and the four-carbon molecule oxaloacetate (step 1 ) to yield the six-carbon citric acid (citrate when ionized, hence the name citric acid cycle). Reactions step 4 and step 5 each release a molecule and reduce to NADH. The source of the oxygen for generating the molecules in these reactions is water not molecular oxygen , and the enzymatic activities of the enzymes catalyzing reactions step 4 and step 5 are increased by the influx of calcium into the mitochondrion from the ER’s MAM. Reduction of to NADH occurs during reaction step 9 ; thus three NADHs are generated per turn of the cycle. In reaction step 7 , two electrons and two protons are transferred to FAD, yielding the reduced form of this coenzyme, . Reaction step 7 is distinctive not only because it is an intrinsic part of the citric acid cycle (stage II) but also because it is catalyzed by a membrane-attached enzyme that, as we shall see, also plays an important role in stage III. In reaction step 6 , hydrolysis of the highenergy thioester bond in succinyl CoA is coupled to synthesis of one GTP
by substrate-level phosphorylation. Because GTP and ATP are interconvertible, this can be considered an ATP-generating step. Reaction step 9 regenerates oxaloacetate, so the cycle can begin again. Note that molecular does not participate in the citric acid cycle.
FIGURE 12-13 The citric acid cycle. Acetyl CoA is metabolized to and the highenergy electron carriers NADH and . In reaction 1 , a two-carbon acetyl residue from acetyl CoA condenses with the four-carbon molecule oxaloacetate to form the sixcarbon citrate. In the remaining reactions ( 2–9 ), each molecule of citrate is eventually converted back to oxaloacetate, losing two molecules in the process. In each turn of the cycle, four pairs of electrons are removed from carbon atoms, forming three molecules of NADH from three of , one molecule of from FAD, and one molecule of GTP, from GDP and . The two carbon atoms that enter the cycle with acetyl CoA are highlighted in blue through succinyl CoA. In succinate and fumarate, which are symmetric molecules, they can no longer be specifically denoted. Isotope-labeling studies have shown
that these carbon atoms are not lost in the turn of the cycle in which they enter; on average, one will be lost as during the next turn of the cycle and the other in subsequent turns. Description The flow cycle is as follows: Step 1. Acetyl Co A (C H 3 single bond C O single bond S Co A) plus H 2 O along with oxaloacetate is converted by citrate synthase into citrate (C O O negative single bond C H 2 single bond H O C C O O negative single bond C H 2 single bond C O O negative). Step 2: Citrate is converted by aconitase into cisaconitate (C O O negative single bond C H 2 single bond C C O O negative double bond C H single bond C O O negative) and H 2 O is lost. Step 3: Cis-aconitate is converted by aconitase into Isocitrate (C O O negative single bond C H 2 single bond H C C O O negative single bond O H C H single bond C O O negative) by using H 2 O. Step 4: Isocitrate is converted by isocitrate dehydrogenase into alpha¬-ketoglutarate (C O O negative single bond C H 2 single bond C H 2 single bond C O single bond C O O negative) while simultaneously converting N A D plus to C O 2, N A D H, and H plus ion. Step 5: Alpha¬-ketoglutarate is converted by alpha¬-ketoglutarate dehydrogenase into Succinyl Co A (C O O negative single bond C H 2 single bond C H 2 single bond C O single bond S Co A) while simultaneously converting N A D plus and H S Co A into C O 2, N A D H, and H plus ion. Step 6: Succinyl Co A is converted by succinyl Co A synthetase into succinate (C O O negative single bond C H 2 single bond C H 2 single bond C O O negative) while simultaneously converting G D P, P i, and H 2 O into G T P and H S Co A. Step 7: Succinate is converted by succinate dehydrogenase into fumarate (C O O negative single bond C H double bond C H single bond C O O negative) while simultaneously converting F A D to F A D H 2. Step 8: Fumarate is converted by fumarase into malate (C O O negative single bond O H C H single bond C H 2 single bond C O O negative) while using H 2 O. Step 9: Malate is converted by malate dehydrogenase into oxaloacetate (C O O negative single bond C O single bond C H 2 single bond C O O negative) while simultaneously converting N A D plus to N A D H and H plus ions. Most enzymes and small molecules involved in the citric acid cycle are soluble in the aqueous mitochondrial matrix. These include CoA, acetyl CoA, succinyl CoA, , and NADH, as well as most of the citric acid
cycle enzymes. Succinate dehydrogenase (reaction step 7 ), however, is a component of an integral membrane protein in the inner membrane, with its active site facing the matrix. The non-membrane-bound enzymes of the citric acid cycle can be isolated as very large multiprotein complexes. It is believed that within such complexes, the reaction product of one enzyme passes directly to the next enzyme without diffusing through the solution (see Figure 3-31). Because glycolysis of one glucose molecule generates 2 pyruvate molecules, and thus 2 acetyl CoA molecules, the reactions in the glycolytic pathway and citric acid cycle produce 6 molecules, 10 NADH molecules, and 2 molecules per glucose molecule (Table 12-3). Although these reactions also generate four high-energy phosphoanhydride bonds in the form of 2 ATP and 2 GTP molecules, this represents only a small fraction of the available energy released in the complete aerobic oxidation of glucose. The remaining energy is stored as high-energy electrons in the reduced coenzymes NADH and , which can be thought of as high-energy electron carriers. The goal of stages III and IV is to recover this energy in the form of ATP.
TABLE 12-3 • Electron-Carrying Prosthetic Groups in the ElectronTransport Chain Protein Component Prosthetic Groups NADH-CoQ reductase (complex I) FMN Fe-S Succinate-CoQ reductase (complex II) FAD Fe-S i
Transporters in the Inner Mitochondrial Membrane Help Maintain Appropriate Cytosolic and Matrix Concentrations of NAD+ and NADH
–cytochrome c reductase (complex III) Heme Heme Fe-S Heme Cytochrome c Heme c Cytochrome c oxidase (complex IV) Heme a Heme Not included is coenzyme Q, an electron carrier that is not permanently bound to a protein complex. SOURCE: Data from J. W. De Pierre and L. Ernster, 1977, Annu. Rev. Biochem. 46:201. Transporters in the Inner Mitochondrial Membrane Help Maintain Appropriate Cytosolic and Matrix Concentrations of and
In the cytosol, is required for step 6 of glycolysis (see Figure 123); in the mitochondrial matrix, is required for the conversion of pyruvate to acetyl CoA and for three steps in the citric acid cycle (step 4 , step 5 , and step 9 in Figure 12-13). In each case, NADH is a product of the reaction. If glycolysis and oxidation of pyruvate are to continue, must be regenerated by oxidation of NADH to ensure that this substrate is available. (Similarly, the generated in stage II reactions must be i
reoxidized to FAD if FAD-dependent reactions are to continue.) As we will see in the next section (Section 12.6), the electron-transport chain within the inner mitochondrial membrane converts NADH to and to FAD as it reduces to water and converts the energy stored in the high-energy electrons in the reduced forms of these molecules into a proton-motive force (stage III). Even though is not involved in any reaction of the citric acid cycle, in the absence of this cycle soon stops operating because in such anaerobic conditions, the mitochondria cannot regenerate the required and FAD substrates. and FAD concentrations dwindle due to the inability of the electron-transport chain within the mitochondrion to oxidize NADH and . These observations raise the question of how a supply of in the cytosol is regenerated. If the NADH from the cytosol could move into the mitochondrial matrix and be oxidized by the electron-transport chain, and if the product could be transported back into the cytosol, regeneration of cytosolic would be simple when is available. However, the inner mitochondrial membrane is impermeable to NADH. To bypass this problem and permit the electrons from cytosolic NADH to be transferred indirectly to via the mitochondrial electron-transport chain, cells use several electron shuttles to transfer electrons from NADH in the cytoplasm to in the matrix. The operation of the most widespread shuttle — the malateaspartate shuttle — is depicted in Figure 12-14.
FIGURE 12-14 The malate-aspartate shuttle. This cyclical series of reactions transfers electrons from NADH in the cytosol (via the intermembrane space) across the inner mitochondrial membrane, which is impermeable to NADH itself, to in the matrix. The net result is the replacement of cytosolic NADH with and matrix with NADH. Step 1 : Cytosolic malate dehydrogenase transfers electrons from cytosolic NADH to oxaloacetate, forming malate and . Step 2 : An antiporter (blue oval) in the inner mitochondrial membrane transports malate into the matrix in exchange for α-ketoglutarate. Step 3 : Mitochondrial malate dehydrogenase converts malate back to oxaloacetate, reducing in the matrix to NADH in the process. Step 4 : Oxaloacetate, which cannot directly cross the inner membrane, is converted to aspartate by addition of an amino group from glutamate. In this transaminase-catalyzed reaction in the matrix, glutamate is converted to α-ketoglutarate. Step 5 : A second antiporter (red oval) exports aspartate to the cytosol in exchange for glutamate. Step 6 : A cytosolic transaminase converts aspartate to oxaloacetate and α-ketoglutarate to glutamate, completing the cycle. The blue arrows reflect the movement of the α-ketoglutarate, the red arrows the movement of glutamate, and the black arrows that of It is noteworthy that as aspartate and malate cycle clockwise, glutamate and α-ketoglutarate cycle in the opposite direction. Description The illustration shows an oval blue antiporter and an oval red antiporter embedded in the inner mitochondrial membrane present between cytosol and matrix. The cyclic malate-aspartate shuttle occurs in a series of five steps in both cytosol and matrix. The chemical structure of aspartate shows C O O negative single bond N H 3 positive C H
Mitochondrial Oxidation of Fatty Acids Generates ATP
single bond C H 2 single bond C O O negative. The chemical structure of oxaloacetate shows C O O negative single bond C O single bond C H 2 single bond C O O negative. The chemical structure of malate shows C O O negative single bond O H C H single bond C H 2 single bond C O O negative. The chemical structure of glutamate shows C O O negative single bond N H 3 positive C H single bond C H 2 single bond C H 2 single bond C O O negative. The chemical structure of alpha-ketoglutarate shows C O O negative single bond C O single bond C H 2 single bond C H 2 single bond C O O negative. For every complete cycle of the shuttle, there is no overall change in the numbers of NADH and molecules or the intermediates aspartate or malate. In the cytosol, however, NADH is oxidized to , which can be used for glycolysis, and in the matrix, is reduced to NADH, which can be used for electron transport: Mitochondrial Oxidation of Fatty Acids Generates ATP Up to now, we have focused mainly on the oxidation of carbohydrates, namely glucose, for ATP generation. Fatty acids are another important source of cellular energy. Cells can take up either glucose or fatty acids from the extracellular space with the help of specific transporter proteins (see Chapter 11). Should a cell not need to burn these molecules immediately, it can store them as a polymer of glucose called glycogen, especially in muscle or liver, or as a trimer of fatty acids covalently linked to glycerol, called a triacylglycerol or triglyceride:
Description One molecule of triacylglycerol plus three molecules of H 2 O yields 3 molecules of fatty acid and one molecule of glycerol. The chemical structure of triacylglycerol shows a C H 2 single bonded to a C H single bonded to a C H 2. Each of these are single bonded to C H 3 single bond left parentheses C H 2 right parentheses n single bond C O single bond O chain. The chemical structure of fatty acid shows C H 3 single bond left parentheses C H 2 right parentheses n single bond C O single bond O H. The chemical structure of glycerol shows C H 2 O H single bond C H O H single bond C H 2 O H. In some cells, excess glucose is converted into fatty acids and then triacylglycerols for storage. However, unlike microorganisms, animals are unable to convert fatty acids to glucose. When the cells need to burn these energy stores to make ATP (e.g., when a resting muscle begins to do work and needs to burn glucose or fatty acids as fuel), enzymes break down glycogen to glucose or hydrolyze triacylglycerols to fatty acids, which are then oxidized to generate ATP.
Fatty acids are the major energy source for some tissues, particularly adult heart muscle. In humans, in fact, more ATP is generated by the oxidation of 1 g of fats than by the oxidation of 1 g of glucose. The oxidation of 1 g of triacylglycerol to generates about six times as much ATP as does the oxidation of 1 g of hydrated glycogen. Thus considering the mass of stored fuel an organism must carry, triglycerides are more efficient than carbohydrates for storage of energy, in part because they are stored in anhydrous form and can yield more energy when oxidized, and in part because they are intrinsically more reduced (have more hydrogens) than carbohydrates. In mammals, the primary site of storage of triacylglycerol is fat (adipose) tissue, whereas the primary sites for glycogen storage are muscle and the liver. In animals, when tissues need to generate a lot of ATP, as in exercising muscle, signals are sent to adipose tissue to hydrolyze triacylglycerols and to release the fatty acids into the circulatory system so that they can move to and be transported into the ATPrequiring tissues. Just as there are four stages in the oxidation of glucose, there are four stages in the oxidation of fatty acids. To optimize the efficiency of ATP generation, part of stage II (citric acid cycle oxidation of acetyl CoA) and all of stages III and IV of fatty acid oxidation are identical to those of glucose oxidation. The differences lie in cytosolic stage I and in the first part of mitochondrial stage II. In stage I, fatty acids are converted to a fatty acyl CoA in the cytosol in a reaction coupled to the hydrolysis of ATP to AMP and (inorganic pyrophosphate) (see Figure 12-11):
Subsequent hydrolysis of to two molecules of releases energy that drives this reaction to completion. To enter the mitochondrial matrix, the fatty acyl group must be covalently transferred to a molecule called carnitine and moved across the inner mitochondrial membrane by an acylcarnitine transporter protein (see Figure 12-11, blue oval); then, on the matrix side, the fatty acyl group is released from carnitine and reattached to another CoA molecule. The activity of the acylcarnitine transporter is regulated to prevent oxidation of fatty acids when cells have adequate energy (ATP) supplies. In the first part of stage II, each molecule of a fatty acyl CoA in the mitochondrion is oxidized in a cyclical sequence of four reactions in which all the carbon atoms are converted, two at a time, to acetyl CoA with generation of and NADH (Figure 12-15a). For example, mitochondrial oxidation of each molecule of the 18-carbon stearic acid, , yields nine molecules of acetyl CoA and eight molecules each of NADH and In the second part of stage II, as with acetyl CoA generated from pyruvate, these acetyl groups enter the citric acid cycle and are oxidized to . As will be described in detail in
Peroxisomal Oxidation of Fatty Acids Generates No ATP
the next section, the reduced NADH and with their high-energy electrons will be used in stage III to generate a proton-motive force, which in turn is used in stage IV to power ATP synthesis. Peroxisomal Oxidation of Fatty Acids Generates No ATP Mitochondrial oxidation of fatty acids is the major source of ATP in mammalian liver cells, and biochemists at one time believed this was true in all cell types. However, rats treated with clofibrate, a drug that affects many features of lipid metabolism, were found to exhibit an increased rate of fatty acid oxidation and a large increase in the number of peroxisomes in their liver cells. This finding suggested that peroxisomes, as well as mitochondria, can oxidize fatty acids. These small organelles, in diameter, are lined by a single membrane (see Figure 1-12). They are present in all mammalian cells except erythrocytes and are also found in plant cells, yeasts, and probably most other eukaryotic cells. Mitochondria preferentially oxidize short-chain [fewer than 8 carbons , medium-chain , and long-chain fatty acids, whereas peroxisomes preferentially oxidize very long chain fatty acids which cannot be oxidized by mitochondria. Most dietary fatty acids have long chains, which means that they are oxidized mostly in mitochondria. In contrast to mitochondrial oxidation of fatty acids, which is coupled to generation of ATP, peroxisomal oxidation of fatty acids is not linked to ATP formation, and energy is released as heat.
The reaction pathway by which fatty acids are degraded to acetyl CoA in peroxisomes is similar to that used in mitochondria (Figure 12-15). However, peroxisomes lack an electron-transport chain, and electrons from the produced during the oxidation of fatty acids are immediately transferred to by oxidases, regenerating FAD and forming hydrogen peroxide . In addition to oxidases, peroxisomes contain abundant catalase, which quickly decomposes the , a highly cytotoxic metabolite. NADH produced during peroxisomal oxidation of fatty acids is exported and reoxidized in the cytosol; there is no need for a malate-aspartate shuttle here. Peroxisomes also lack the citric acid cycle, so acetyl CoA generated during peroxisomal degradation of fatty acids cannot be oxidized further; instead, it is transported into the cytosol for use in the synthesis of cholesterol (see Chapter 10) and other metabolites.
FIGURE 12-15 Oxidation of fatty acids in mitochondria and in peroxisomes. In both mitochondrial oxidation (a) and peroxisomal oxidation (b), fatty acids are converted to acetyl CoA by a series of four enzyme-catalyzed reactions (shown down the center of the figure). A fatty acyl CoA molecule is converted to acetyl CoA and a fatty acyl CoA shortened by two carbon atoms. Concomitantly, one FAD molecule is reduced to
and one molecule is reduced to NADH. The cycle is repeated on the shortened acyl CoA until fatty acids with an even number of carbon atoms are completely converted to acetyl CoA. In mitochondria (a), electrons from and NADH enter the electrontransport chain and are ultimately used to generate ATP; the acetyl CoA generated is oxidized in the citric acid cycle, resulting in the release of and ultimately the synthesis of additional ATP. Because peroxisomes (b) lack the protein complexes composing the electron-transport chain and the enzymes of the citric acid cycle, oxidation of fatty acids in these organelles yields no ATP. Description The flowchart reads as follows: Fatty acyl Co A (R single bond C H 2 single bond C H 2 single bond C H 2 single bond C O single bond S Co A) is converted by dehydrogenase to R single bond C H 2 single bond C H double bond C H single bond C O single bond S Co A while simultaneously converting F A D to F A D H 2. In mitochondrial oxidation, the F A D H 2 enters electron transport chain and gets converted to F A D while simultaneously converting O 2 to H 2 O and A D P plus P i to A T P. In peroxisomal oxidation, the F A D H 2 is converted to F A D by oxidase while simultaneously converts O 2 to H 2 O 2. The H 2 O 2 is converted by catalase into H 2 O and one-half O 2. The R single bond C H 2 single bond C H double bond C H single bond C O single bond S Co A is converted to R single bond C H 2 single bond C H O H single bond C H 2 single bond C O single bond S Co A by hydratase which is further converted to R single bond C H 2 single bond C O single bond C H 2 single bond C O single bond S Co A by dehydrogenase while simultaneously converting N A D plus to N A D H. In mitochondrial oxidation, the N A D H enters electron transport chain and gets converted to N A D plus while simultaneously converting O 2 to H 2 O and A D P plus P i to A T P. In peroxisomal oxidation, the N A D H is exported for reoxidation outside the peroxisome and is converted back to N A D plus. The R single bond C H 2 single bond C O single bond C H 2 single bond C O single bond S Co A is converted to acyl Co A shortened by two carbon atoms (R single bond C H 2 single bond C O single bond S Co A) and acetyl Co A (C H 3 single bond C O single bond S Co A). The reaction is catalyzed by thiolase by using Co A S H. In
mitochondrial oxidation, the acetyl Co A enters citric acid cycle while in peroxisomal oxidation, the acetyl Co A is exported out. KEY CONCEPTS OF SECTION 12.5 The Citric Acid Cycle and Fatty Acid Oxidation In stage II of glucose oxidation, the three-carbon pyruvate molecule is first oxidized to generate one molecule each of , NADH, and acetyl CoA. The acetyl group of acetyl CoA is then oxidized to by the citric acid cycle (see Figure 12-11). Each turn of the citric acid cycle releases two molecules of and generates three NADH molecules, one molecule, and one GTP (see Figure 12-13). Most of the energy released in stages I and II of glucose oxidation is temporarily stored in the reduced coenzymes NADH and , which carry high-energy electrons that subsequently drive the electron-transport chain (stage III). Neither glycolysis nor the citric acid cycle directly uses molecular oxygen . The malate-aspartate shuttle regenerates the supply of cytosolic necessary for continued glycolysis (see Figure 12-14). Like glucose oxidation, the oxidation of fatty acids takes place in four stages. In stage I, fatty acids are converted to fatty acyl CoA in the cytosol. In stage II, in the mitochondria the fatty acyl CoA is first converted into multiple acetyl CoA molecules, with generation of NADH and Then, as in glucose oxidation, the acetyl CoA enters the citric acid cycle. Stages III and IV are identical for fatty acid and glucose oxidation (see Figure 12-11). In most eukaryotic cells, oxidation of short- to long-chain fatty acids occurs in mitochondria with production of ATP, whereas oxidation of very long chain fatty acids occurs primarily in peroxisomes and is not linked to ATP production (see Figure 12-15); the energy released during peroxisomal oxidation of fatty acids is converted to heat.
Oxidation of NADH and FADH2 Releases a Substantial Amount of Energy
12.6 The Electron-Transport Chain and Generation of the ProtonMotive Force Most of the energy released during the oxidation of glucose and fatty acids to (stages I and II) is converted into high-energy electrons in the reduced coenzymes NADH and . We now turn to stage III, in which the energy transiently stored in these reduced coenzymes is converted by an electron-transport chain, also known as the respiratory chain, into the proton-motive force. We first describe the logic and components of the electron-transport chain. Next we follow the path of electrons as they flow through the chain and describe the mechanism of proton pumping across the inner mitochondrial membrane. We conclude this section with a discussion of the magnitude of the proton-motive force produced by electron transport and proton pumping. In Section 12.7, we will see how the proton-motive force is used to synthesize ATP. Oxidation of NADH and Releases a Substantial Amount of Energy During electron transport, electrons are released from NADH and and eventually transferred to , forming , according to the following overall reactions:
Recall that the conversion of 1 glucose molecule to via the glycolytic pathway and citric acid cycle yields 10 NADH and 2 molecules (see
Table 12-2). Oxidation of these reduced coenzymes has a total of . Thus of the total potential free energy present in the chemical bonds of glucose , about 90 percent is conserved in the reduced coenzymes. Why should there be two different coenzymes, NADH and ? Although many of the reactions involved in glucose and fatty acid oxidation are sufficiently energetic to reduce , several are not. To capture the energy released by those reactions, they are coupled to reduction of FAD, which requires less energy.
TABLE 12-2 • Net Result of the Glycolytic Pathway and the Citric Acid Cycle Reaction Molecules Produced Molecules Reduced to
FAD Molecules Reduced to ATP (or GTP) 1 glucose molecule to 2 pyruvate molecules 2 pyruvates to 2 acetyl CoA molecules
Electron Transport in Mitochondria Is Coupled to Proton Pumping
2 acetyl CoA to 4 molecules Total The energy carried in the reduced coenzymes can be released by oxidizing them. The biochemical challenge faced by the mitochondrion is to transfer, as efficiently as possible, the energy released by this oxidation into the energy in the terminal phosphoanhydride bond in ATP. A relatively simple one-to-one reaction involving reduction of one coenzyme molecule and synthesis of one ATP molecule would be terribly inefficient because the for ATP generation from ADP and is substantially less than that for the coenzyme oxidation, and much energy would be lost as heat. To efficiently recover that energy, the mitochondrion converts the energy of coenzyme oxidation into a proton-motive force using a series of electron carriers, all but one of which are integral components of the inner membrane (see stage III in Figure 12-11). The proton-motive force can then be used to generate ATP very efficiently. Electron Transport in Mitochondria Is Coupled to Proton Pumping During electron transport from NADH and to , protons from the mitochondrial matrix are pumped across the inner membrane. This pumping
raises the pH of the mitochondrial matrix relative to the intermembrane space and cytosol and also makes the matrix side of the inner membrane more electrically negative relative to the intermembrane side. In other words, the free energy released during the oxidation of NADH or is stored both as a proton concentration gradient and as an electrical voltage gradient across the membrane — collectively known as the proton-motive force (see Figure 12-2). As we will see in Section 12.7, the movement of protons back across the inner membrane, driven by this force, is coupled to the synthesis of ATP from ADP and by ATP synthase (stage IV). The synthesis of ATP from ADP and , driven by the energy released by transfer of electrons from NADH or to , is the major source of ATP in aerobic non-photosynthetic cells. Much evidence shows that in mitochondria and bacteria, this process of oxidative phosphorylation depends on the generation of a proton-motive force across the inner membrane (in mitochondria) or bacterial plasma membrane, with electron transport, proton pumping, and ATP formation occurring simultaneously. In the laboratory, for instance, addition of and an oxidizable substrate such as pyruvate or succinate to isolated intact mitochondria results in net synthesis of ATP if the inner mitochondrial membrane is intact. In the presence of minute amounts of detergents that make the membrane leaky, electron transport and the oxidation of these metabolites by still occurs. However, no ATP is made under these conditions because the proton leak prevents the maintenance of the proton-motive force. The coupling between electron transport from NADH to and proton transport across the inner mitochondrial membrane can also be
demonstrated experimentally, with isolated, intact mitochondria (Figure 1216). As soon as is added to a suspension of mitochondria in an otherwise -free solution that contains NADH, the medium outside the mitochondria transiently becomes more acidic (increased proton concentration) because the mitochondrial outer membrane is freely permeable to protons. (Remember that the malate-aspartate shuttle and other shuttles can convert the NADH in the solution into NADH in the mitochondrial matrix.) Once the is depleted by its reduction, the excess protons in the medium slowly leak back into the matrix. By measuring the pH change in such experiments, one can calculate that about 10 protons are transported out of the matrix for every electron pair transferred from NADH to .
EXPERIMENTAL FIGURE 12-16 Electron transfer from NADH to is coupled to proton transport across the mitochondrial membrane. If NADH is added to a suspension of mitochondria depleted of (experimental apparatus shown in the inset), no NADH is oxidized. When a small amount of is added to the system (arrow), there is a sharp rise in the concentration of protons as a function of time in the surrounding medium outside the mitochondria (decrease in pH). Thus the oxidation of NADH by is coupled to the movement of protons out of the matrix into the intermembrane space and then to the surrounding media. Once the is depleted, the excess protons slowly move back into the mitochondria (powering the synthesis of ATP), and the pH of the extracellular medium returns to its initial value. Description The horizontal axis represents elapsed time (in seconds) and ranges from 0 to 300, in increments of 60. The vertical axis represents change in H plus concentration (in 10 to
Electrons Release Energy as They Flow Downhill Through a Series of Electron Carriers
the power of negative 9 mol) and ranges from 0 to 60, in increments of 20. The curve starts from (0, 0), steeply increases to (20, 35) when O 2 is added, and then gradually decreases to (300, 0). The illustration shows a test tube filled with a solution having no O 2 and few mitochondria. A p H electrode is inserted into the solution and a syringe with O 2 solution is being injected into it. To obtain numbers for , this experiment can be repeated using succinate instead of NADH as the substrate. (Recall that oxidation of succinate to fumarate in the citric acid cycle generates ; see Figure 12-13.) The amount of succinate added can be adjusted so that the amount of generated is equivalent to the amount of NADH in the first experiment. As in the first experiment, addition of causes the medium outside the mitochondria to become acidic, but less so than with NADH. This difference is not surprising, because electrons in have less potential energy than electrons in NADH , and thus drives the translocation of fewer protons from the matrix and a smaller change in pH. Electrons Release Energy as They Flow Downhill Through a Series of Electron Carriers Let’s examine more closely the energetically favored movement of electrons from NADH and to the final electron acceptor, . For simplicity, we will focus our discussion on NADH. In respiring mitochondria, each NADH molecule releases two electrons to the electron-
transport chain; these electrons ultimately reduce one oxygen atom (half of an molecule), forming one molecule of water: As electrons move from NADH to , their electric potential declines by
1.14 V, which corresponds to of electrons transferred, or about for a pair of electrons. As noted earlier, much of this energy is conserved in the proton-motive force generated across the inner mitochondrial membrane. Four large multiprotein complexes (complexes I–IV) compose the electrontransport chain in the inner mitochondrial membrane that is responsible for the generation of the proton-motive force (see Figure 12-11, stage III). Each complex contains several prosthetic groups that participate in the process of moving electrons from donor molecules to acceptor molecules in coupled oxidation-reduction reactions (see Chapter 2). These small nonpeptide organic molecules or metal ions are tightly and specifically associated with the multiprotein complexes (Table 12-3). Heme and the Cytochromes Several types of heme, an iron-containing prosthetic group similar to that found in hemoglobin and myoglobin (Figure 12-17a), are tightly bound (covalently or noncovalently) to a set of mitochondrial proteins called cytochromes. Each cytochrome is designated by a letter, such as a, b, c, or
. Electron flow through the cytochromes occurs by oxidation and reduction of the Fe atom in the center of the heme molecule:
FIGURE 12-17 Heme and iron-sulfur prosthetic groups in the electron-transport chain. (a) Heme portion of cytochromes and , which are components of – cytochrome c reductase (complex III). The same porphyrin ring (yellow) is present in all hemes. The chemical substituents attached to the porphyrin ring differ in the other cytochromes in the electron-transport chain. All hemes accept and release one electron at a time. (b) Dimeric iron-sulfur cluster (Fe-S). Each Fe atom is bonded to four S atoms: two are inorganic sulfur, and two are in cysteine side chains of the associated protein. All Fe-S clusters accept and release one electron at a time. Description The chemical structure of (a) heme shows a F e 2 plus in the center bound to nitrogen of four surrounding heterocyclic porphyrin rings. The top two porphyrin rings have two chemical substituents, C H 3 and C H double bond C H 2, each single bonded to an outer carbon atom. The bottom two porphyrin rings have two chemical substituents, C H 3 and C H 2 single bond C H 2 single bond C O 2 negative, each single bonded to an outer carbon atom.
The structure of (b) dimeric iron-sulfur cluster shows two F e ions single bonded to two S in the middle and two Cys-S on sides (each). All four Cys-S are attached to a semicircular protein model. Because the heme ring in cytochromes consists of alternating double- and single-bonded atoms, a large number of resonance hybrid forms exist. These forms allow the extra electron delivered to the cytochrome to be spread throughout the heme carbon and nitrogen atoms as well as the Fe ion. The various cytochromes each have slightly different heme groups and surrounding atoms, which generate different environments for the Fe ion. Therefore, each cytochrome has a different reduction potential, or tendency to accept an electron — an important property that dictates the unidirectional, energetically downhill electron flow along the chain. Just as water spontaneously flows downhill from a higher to a lower potential energy state — but not uphill — electrons flow in only one direction from one heme (or other prosthetic group) to another due to their differing reduction potentials. (For more on the concept of reduction potential, E, see
Chapter 2.) As we will see shortly, all the cytochromes except cytochrome c are components of integral membrane multiprotein complexes in the inner mitochondrial membrane. Iron-Sulfur Clusters Iron-sulfur clusters are nonheme, iron-containing prosthetic groups consisting of Fe atoms bonded both to inorganic sulfur (S) atoms and to S atoms on cysteine residues in a protein (Figure 12-17b). Some Fe atoms in
the cluster bear a charge; others have a charge. However, the net charge of each Fe atom is actually between and , because electrons in their outermost orbitals, together with the extra electron delivered via the transport chain, are dispersed among the Fe atoms and move rapidly from one atom to another. Iron-sulfur clusters accept and release electrons one at a time. Coenzyme Q Also called ubiquinone, Coenzyme Q (CoQ) is the only small-molecule electron carrier in the electron-transport chain that is not an essentially irreversibly protein-bound prosthetic group (Figure 12-18). It is a carrier of both protons and electrons. The oxidized quinone form of CoQ can accept a single electron to form a semiquinone, a negatively charged free radical denoted by , where the superscript dot indicates an unpaired and reactive electron. Addition of a second electron and two protons (thus a total of two hydrogen atoms) to forms dihydroubiquinone , the fully reduced form. Both CoQ and are hydrophobic, and thus are soluble in phospholipids and diffuse freely in the hydrophobic center of the inner mitochondrial membrane. These properties underlie ubiquinone’s role in the electron-transport chain: carrying electrons and protons between the membrane-embedded protein complexes of the chain.
FIGURE 12-18 Oxidized and reduced forms of coenzyme Q (CoQ), which can carry two protons and two electrons. Because of its long hydrocarbon “tail” of isoprene units, CoQ, also called ubiquinone, is soluble in the hydrophobic core of phospholipid bilayers and is very mobile. Reduction of CoQ to the fully reduced form, (dihydroquinone), occurs in two steps with a half-reduced free-radical intermediate, called semiquinone. Description The oxidized form of ubiquinone molecule (C o Q) takes up an electron to form a free radical semiquinone molecule (C o Q negative) which further takes up 2 H plus ions and
Four Large Multiprotein Complexes (I–IV) Couple Electron Transport to Proton Pumping Across the Inner Mitochondrial Membrane
an electron to result into a fully reduced dihydroquinone (C o Q H 2). The chemical structure of ubiquinone shows a hexane ring with C 1 and C 4 double bonded to O, each; C 2 and C 3 single bonded to H 3 C O, each; C 5 single bonded to C H 3; and C 6 single bonded to left parentheses C H 2 single bond C H double bond C single bon C H 3 and C H 2 right parentheses 10 single bond H. The chemical structure of semiquinone is similar to ubiquinone except C 1 single bonded to O and C 4 single bonded to O negative. The chemical structure of dihydroquinone is similar to ubiquinone except C 1 and C 4 are single bonded to O H. Four Large Multiprotein Complexes (I–IV) Couple Electron Transport to Proton Pumping Across the Inner Mitochondrial Membrane We now consider in detail the multiprotein complexes that use these prosthetic groups and the paths taken by electrons and protons as they pass through these complexes. As electrons flow downhill from one electron carrier to the next in the electron-transport chain, the energy released is used to power the pumping of protons out of the matrix against their electrochemical gradient across the inner mitochondrial membrane. Four large multiprotein complexes (Figure 12-19) directly or indirectly couple the movement of electrons to proton pumping: NADH-CoQ reductase (complex I, protein subunits), succinate-CoQ reductase (complex II, 4 subunits), –cytochrome c reductase (complex III, 11 subunits), and cytochrome c oxidase (complex IV, 13 subunits). The electrons follow one of two routes through these
complexes: or . In addition, complexes I, III, and IV all pump protons directly across the inner membrane, whereas complex II does not (see Figure 12-19). Electrons from NADH flow from complex I via to complex III and then, via the soluble protein cytochrome c (cyt c), to complex IV which reduces molecular oxygen (complex II is bypassed) (see Figure 12-19a). Electrons from flow from complex II via to complex III (see Figure 12-19b) and then via cytochrome c to complex IV to reduce molecular oxygen (complex I is bypassed). As shown in Figure 12-19, CoQ accepts electrons released from NADHCoQ reductase (complex I) or succinate-CoQ reductase (complex II) and donates them to –cytochrome c reductase (complex III). Protons are simultaneously transported from the matrix side of the membrane (also called the cytosolic side) to the intermembrane space (also called the exoplasmic side). Whenever CoQ accepts electrons, it does so at a binding site on the matrix side of a protein complex, always picking up protons from the medium there. Whenever releases its electrons, it does so at a site on the intermembrane space side of a protein complex, releasing protons into the fluid of the intermembrane space. Thus the transport of each pair of electrons by CoQ is obligately coupled to the movement of two protons from the matrix to the intermembrane space.
FIGURE 12-19 The mitochondrial electron-transport chain. Electrons (blue arrows) flow through four major multiprotein complexes (I–IV). Electron movement between complexes is mediated either by the lipid-soluble molecule coenzyme Q (CoQ, oxidized form; , reduced form) or the water-soluble protein cytochrome c (cyt c) in the intermembrane space. Three of the multiprotein complexes use the energy released from the electrons to pump protons (red arrows) from the matrix (cytosolic compartment in bacteria) to the intermembrane space (exoplasmic space of bacteria). (a) Pathway from NADH. Two electrons from NADH flow through complex I, initially via a flavin mononucleotide (FMN) and then one at a time via seven iron-sulfur clusters (Fe-S), to CoQ, to which two protons bind, forming . Conformational changes in complex I that accompany the electron flow drive proton pumping from the matrix to the intramembrane space. Electrons then flow via the released (and subsequently recycled) to complex III, and then via cyt c to complex IV. Each of four cyt c molecules carrying four electrons originating from two NADHs transfers individual electrons to complex IV for the fourelectron reduction of one molecule to two molecules and transport of four protons. Thus for every two NADHs oxidized and one molecule reduced, a total of 20 protons are translocated out of the matrix into the intermembrane space. (b) Pathway from succinate. Two electrons flow from each succinate to complex II via and iron-sulfur clusters (Fe-S), from complex II to complex III via , and then to complex IV via cyt c. Electrons released during oxidation of succinate to fumarate in complex II are used to reduce CoQ to without translocating additional protons. The remainder of electron transport from proceeds by the same pathway as for the NADH pathway in (a). Thus for every two succinates oxidized and one molecule reduced,12 protons (8 via the Q-cycle of complex III that is described below, 4 via complex IV) are translocated. Description
The illustration (a) from N A D H shows three multiprotein complexes embedded in the inner mitochondrial membrane present between intermembrane space (exoplasmic) and matrix (cytosolic). The complexes in sequence are: complex 1, N A D H-Co Q reductase; complex 3, Co Q H 2–cytochrome c reductase; and complex 4, cytochrome c oxidase. Electrons resulting from conversion of N A D H to N A D plus and H plus are transported across the complexes and all three complexes simultaneously pump out H plus ions from cytosol to exoplasm. The illustration (b) from succinate shows two multiprotein complexes embedded in the inner mitochondrial membrane present between intermembrane space (exoplasmic) and matrix (cytosolic): complex 2, Succinate-Co Q reductase; and complex 3. Electrons resulting from conversion of succinate to fumarate and 2 H plus are transported from complex 2 to 3 which simultaneously pump out H plus ions from cytosol to exoplasm. NADH-CoQ Reductase (Complex I) Electrons are transferred from NADH to CoQ by NADH-CoQ reductase (see
Figure 12-19a). Electron microscopy and x-ray crystallography of complex I from bacteria (mass with 14 subunits) and from eukaryotes ( , with 14 highly conserved core subunits, which are also present in bacteria, plus about 26–32 accessory subunits) has established that it is Lshaped (Figure 12-20a). The membrane-embedded arm of the L is slightly curved, about long, and comprises proteins with more than 60 transmembrane α helices. This arm has four subdomains, three of which contain proteins that are members of a family of cation antiporters. The hydrophilic peripheral arm extends over away from the membrane into the matrix (cytosolic) space.
FIGURE 12-20 Electron and proton transport through complexes I and II. (a) Model of complex I based on its three-dimensional structure. The outline of the shape of the core complex I from the yeast Yarrowia lipolytica, as determined by x-ray crystallography, is shown in light blue, and the borders separating several distinct structural subunits are indicated by thin dashed black lines. From NADH, electrons flow first to a flavin mononucleotide (FMN) and then, via iron-sulfur clusters (Fe-S, red and yellow balls), to CoQ, to which two protons from the matrix bind (red arrow) to form . Conformational changes due to the electron flow, which may include a horizontal movement of the t-helix, drive proton pumping through the transmembrane subunits from the matrix to the intramembrane space (red arrows). (b) Model of complex II based on its three-dimensional structure. Electrons flow through complex II from succinate to CoQ via and iron-sulfur clusters (Fe-S), and from complex II to complex III via . Electrons released during oxidation of succinate to fumarate in complex II are used to reduce CoQ to without translocating additional protons. [Part (a) Data from V. Zickermann et al., 2015, Science 347:44–49, PDB ID 3m9s. Part (b) data from F. Sun et al., 2005, Cell 121:1043–1057, PDB ID 1zoy.] Description Both illustrations show three-dimensional structure complex 1 and 2 embedded in inner mitochondrial membrane present between intermembrane space (exoplasmic) and matrix (cytosolic). The illustration (a) complex 1: N A D H-Co Q reductase show transfer of electrons from conversion of N A D H to N A D plus and H plus. The electrons are
transferred to F M N to several F e-S to Co Q inside the complex while protons from cytosol are pumped out to exoplasm by the complex through t-helix. The illustration (b) complex 2: Succinate-Co Q reductase show transfer of electrons from conversion of succinate to fumarate and 2 H plus. The electrons are transferred to F A D to several F eS to Co Q inside the complex. is exclusively a two-electron carrier: it accepts (or for NADH releases) a pair of electrons simultaneously. In NADH-CoQ reductase (complex I), the NADH-binding site is at the tip of the peripheral arm (see
Figure 12-20a); electrons released from NADH first flow to FMN (flavin mononucleotide), a prosthetic group, or cofactor, related to FAD, then are shuttled about down the peripheral arm through a series of iron-sulfur clusters and finally to CoQ, which is bound at a site at least partially in the plane of the membrane. FMN, like FAD, can accept two electrons, but does so one electron at a time. Each transported electron undergoes a drop in potential of about 360 mV, equivalent to a of for the two electrons transported. Much of this released energy is used to transport four protons across the inner membrane per molecule of NADH oxidized by complex I. These four protons are distinct from the two protons that are transferred to the CoQ as illustrated in Figures 12-18, 12-19a, and 12-20a. The precise mechanism by which the energy released by electron transport in the peripheral arm is used to change the conformation of subunits in the membrane arm and thus mediate the movement of four protons across the membrane is uncertain. Three protons are likely to pass through the three cation antiporter domains via a zigzag series of polar side chains that can be protonated and that span the membrane. A similar series of side chains is the likely conduit for the
fourth proton. A transverse α helix (t-helix) in the membrane arm runs parallel to the plane of the membrane, potentially mechanically linking the antiporter-like domains to the peripheral arm (see Figure 12-20a) and possibly contributing directly to the conformational changes required to convert the energy released by the electron transport in the peripheral arm into proton transport by the transmembrane domains. The overall reaction catalyzed by this complex is Succinate-CoQ Reductase (Complex II) Succinate dehydrogenase, the enzyme that oxidizes a molecule of succinate to fumarate in the citric acid cycle (and in the process generates the reduced coenzyme ), is one of the four subunits of complex II (Figure 1220b). Thus the citric acid cycle is physically as well as functionally linked to the electron-transport chain. The two electrons released in the conversion of succinate to fumarate are transferred first to FAD in succinate dehydrogenase, then to iron-sulfur clusters — regenerating FAD — and finally to CoQ, which binds to a cleft on the matrix side of the transmembrane portions of complex II (see Figures 12-19b and 12-20b). The pathway is somewhat reminiscent of that in complex I (see Figure 1220a). The overall reaction catalyzed by this complex is
Although the for this reaction is negative, the released energy is insufficient for proton pumping in addition to reduction of CoQ to form . Thus no protons are translocated directly across the membrane by succinate-CoQ reductase (complex II), and no proton-motive force is generated in this part of the electron-transport chain. We will see shortly how the protons and electrons in the molecules generated by complexes I and II contribute to the generation of the proton-motive force. Complex II generates from succinate via -mediated redox reactions. Another set of proteins in the matrix and inner mitochondrial membrane performs a comparable set of - mediated redox reactions. As with succinate dehydrogenase, these proteins, described in detail in the following paragraph and Figure 12-15, use to produce , which contributes electrons to the electron-transport chain. Fatty acyl–CoA dehydrogenase (see Figure 12-15), which is a water-soluble enzyme, catalyzes the first step of the oxidation of fatty acyl CoA in the mitochondrial matrix. There are several fatty acyl–CoA dehydrogenase enzymes with specificities for fatty acyl chains of different lengths. These enzymes mediate the initial step in a four-step process that removes two carbons from the fatty acyl group by oxidizing the carbon in the β position of the fatty acyl chain (thus the entire process is often referred to as β-oxidation). These reactions generate acetyl CoA, which in turn enters the citric acid cycle. They also generate an intermediate and NADH. The generated remains bound to the enzyme during the redox reaction, as is the case for complex II. A water-soluble protein called
electron transfer flavoprotein (ETF) transfers the high-energy electrons from the in the fatty acyl–CoA dehydrogenase to electron transfer flavoprotein:ubiquinone oxidoreductase (ETF:QO), a membrane protein that reduces CoQ to in the inner membrane. This intermixes in the membrane with the other molecules generated by complexes I and II, all contributing to proton transport out of the matrix by complex III. –Cytochrome c Reductase (Complex III) A generated by complex I, complex II, or ETF:QO donates two electrons to –cytochrome c reductase (complex III), regenerating oxidized CoQ. Concomitantly, it releases into the intermembrane space two protons previously picked up by CoQ on the matrix face, generating part of the proton-motive force (see Figure 12-19). Within complex III, the released electrons are first transferred to an iron-sulfur cluster within the complex and then to cytochrome or to two b-type cytochromes ( and , see the discussion of the Q cycle below). Finally, the two electrons are transferred sequentially to two molecules of the oxidized form of cytochrome c, a water-soluble peripheral protein that diffuses in the intermembrane space. For each pair of electrons transferred, the overall reaction catalyzed by complex III is The for this reaction is sufficiently negative that two protons in addition to those from are translocated from the mitochondrial matrix across the inner membrane for each pair of electrons transferred; this
transfer involves the proton-motive Q cycle, discussed immediately below. The heme protein cytochrome c and the small lipid-soluble molecule CoQ play similar roles in the electron-transport chain in that they both serve as mobile electron shuttles, transferring electrons (and thus energy) between the complexes of the electron-transport chain. The Q Cycle Experiments have shown that four protons are translocated across the inner mitochondrial membrane per electron pair transported from through complex III. These four protons are those carried on two molecules, which are converted to two CoQ molecules during the cycle. However, during this process another CoQ molecule receives two other protons from the matrix and is converted to one molecule. Thus the net overall reaction involves the conversion of only one molecule to CoQ as two electrons are transferred, one at a time, to two molecules of the acceptor cytochrome c. An evolutionarily conserved mechanism, called the Q cycle, is responsible for the two-for-one transport of protons and electrons by complex III (Figure 12-21).
FIGURE 12-21 The Q cycle. The Q cycle of complex III uses the net oxidation of one molecule to transfer four protons into the intermembrane space and two electrons to two cytochrome c molecules. The cycle begins (step 1 ) when a molecule from the combined pool of reduced in the inner mitochondrial membrane binds to the site on the intermembrane space (exoplasmic) side of the transmembrane portion of complex
III. There in step 2a releases two protons into the intermembrane space and in step 3 two electrons and the resulting CoQ dissociate. In step 2b , one of the electrons is transported, via an iron-sulfur protein and cytochrome , directly to cytochrome c. (Recall that each cytochrome c shuttles one electron from complex III to complex IV.) In step 4 , the other electron moves through cytochromes and and partially reduces an oxidized CoQ molecule already bound to the second, , site on the matrix (cytosolic) side of the complex, forming a CoQ semiquinone anion, . The process is then repeated with step 5 : the binding of a second at the site, step 6a : proton release, step 6b : reduction of another cytochrome c, and step 7 : addition of the other electron to the bound at the site. In steps 8 and 9 the addition of two protons from the matrix yields a fully reduced molecule at the site, which then dissociates, that leads to step 10 , the freeing the to bind a new molecule of CoQ and the Q cycle begins over again. See B. Trumpower, 1990, J. Biol. Chem. 265:11409; and E. Darrouzet et al., 2001, Trends Biochem. Sci. 26:445. Description The illustration shows complex 3, Co Q H 2–cytochrome c reductase embedded in the inner mitochondrial membrane present between intermembrane space and matrix. The complex shows 10 steps occurring in the transfer of electrons across Q i and Q o sites of the complex while simultaneously pumping out 2 H plus ions from matrix to intermembrane space. The reaction occurring at Q o site: 2 Co Q H 2 comprising 4 H plus and 4 electrons along with 2 cytochrome c 3 plus yield 2 Co Q, 2 cytochrome c 2 plus having 2 electrons, along with 2 electrons and 4 H plus in the intermembrane space or exoplasmic side. The reaction occurring at Q i site: Co Q along with 2 electrons and 2 H plus in the matrix or cytoplasmic side yield Co Q H 2 having 2 H plus and 2 electrons. Net Q cycle (sum of reactions at Q o and Q i): Co Q H 2 having 2 H plus and 2 electrons along with 2 cytochrome c 3 plus and 2 H plus in the matrix or cytoplasmic side yield Co Q along with 4 H plus and 2 cytochrome c 2 plus having 2 electrons in the intermembrane space or exoplasmic side. Per 2 electrons transferred through complex 3 to cytochrome c, 4 H plus are released to the intermembrane space. The substrate for complex III, , is generated by several enzymes, including NADH-CoQ reductase (complex I), succinate-CoQ reductase
(complex II), ETF:QO (during β-oxidation), and as we shall see, by complex III itself. As shown in Figure 12-21, in one turn of the Q cycle, two molecules of are oxidized to CoQ at the site near the intermembrane space in complex III and release a total of four protons into the intermembrane space. In addition, at a different CoQ binding site near the matrix side of complex III called the site, one molecule of is regenerated from CoQ and two additional protons from the matrix. The translocated protons are all derived from , which obtained its protons from the matrix, as described above. Although seemingly cumbersome, the Q cycle optimizes the number of protons pumped per pair of electrons moving through complex III. The Q cycle is found in all plants and animals as well as in bacteria. Its formation at a very early stage of cellular evolution was probably essential for the success of all life forms as a way of converting the potential energy in reduced coenzyme Q into the maximum proton-motive force across a membrane. In turn, this process maximizes the number of ATP molecules synthesized from each electron that moves down the electron-transport chain from NADH or to . How are the two electrons released from at the site directed to different acceptors, either to Fe-S, cytochrome , and then cytochrome c (upward pathway in Figure 12-21), or alternatively to cytochrome , cytochrome , and then CoQ at the site (downward pathway in Figure 12-21)? The mechanism involves a flexible hinge in the Fe-S–containing protein subunit of complex III. Initially, the Fe-S cluster is close enough to the site to pick up an electron from bound there. Once this
happens, the subunit containing this Fe-S cluster swings the cluster away from the site to a position near enough to the heme on cytochrome for electron transfer to occur. With the Fe-S–containing subunit in this alternate conformation, the second electron released from the bound to the site cannot move to the Fe-S cluster — it is too far away, so it takes an alternative path open to it via a somewhat less thermodynamically favored route to cytochrome and through cytochrome to the CoQ at the site. Cytochrome c Oxidase (Complex IV) Cytochrome c, after being reduced by one electron from complex III, is reoxidized when it transports its electron to cytochrome c oxidase (complex IV) (see Figure 12-19a). Mitochondrial cytochrome c oxidases contain 13 different subunits, but the catalytic core of the enzyme consists of only three. The functions of the remaining subunits are not well understood. Bacterial cytochrome c oxidases contain only the three catalytic subunits. In both mitochondria and bacteria, four molecules of reduced cytochrome c bind, one at a time, to the oxidase. Figure 12-19a shows how an electron is transferred from the heme of each cytochrome c, first to the pair of copper ions labeled , then to the heme in cytochrome a. Next the electron moves to the oxygen reduction center, composed of and the heme in cytochrome , which together bind in a sandwich fashion and sequester the molecule that will be reduced to two Several lines of evidence suggest that reaches the reduction center via one or more hydrophobic channels through the protein, into which flows from the hydrophobic core of the membrane, where it is more soluble than in aqueous solution (see Figure 12-19a).
The four electrons are finally passed by complex IV to , the ultimate electron acceptor, yielding two , which together with is one of the end products of the overall oxidation pathway. Proposed intermediates in oxygen reduction include the peroxide anion and the hydroxyl radical , as well as unusual complexes of iron and oxygen atoms. These intermediates would be harmful to the cell if they escaped from complex IV, but they do so only rarely because they are sequestered by the and the heme in cytochrome . To generate from the reduced , protons are channeled to the oxygen reduction center. In addition, other protons are transported across the membrane from the matrix to the intermembrane space. During the transport of four electrons through the cytochrome c oxidase complex, four protons from the matrix are translocated across the membrane. Thus complex IV transports only one proton per electron transferred, whereas complex III, using the Q cycle, transports two protons per electron transferred. However, the mechanism by which complex IV translocates these protons and energetically couples the translocation to reduction is not fully understood. For each four electrons transferred, the overall reaction catalyzed by cytochrome c oxidase is The poison cyanide, which has been used as a chemical warfare agent, by spies to commit suicide when captured, in gas chambers to execute prisoners, and by the Nazis (Zyklon B gas) for the mass murder of Jews and others, is toxic because it binds to the heme in mitochondrial cytochrome
The Reduction Potentials of Electron Carriers in the Electron-Transport Chain Favor Electron Flow from NADH to O2
c oxidase (complex IV), inhibiting electron transport and thus oxidative phosphorylation and production of ATP. Cyanide is one of many toxic small molecules that interfere with energy production in mitochondria. The Reduction Potentials of Electron Carriers in the Electron-Transport Chain Favor Electron Flow from NADH to As we saw in Chapter 2, the reduction potential (E) for a partial reduction reaction is a measure of the equilibrium constant of that partial reaction. With the exception of the b cytochromes in complex III ( –cytochrome c reductase), the standard reduction potential of the electron carriers in the electron-transport chain increases steadily from NADH to . For instance, for the partial reaction the value of the standard reduction potential is which is equivalent to a of for transfer of two electrons. Thus this partial reaction tends to proceed toward the left: that is, toward the oxidation of NADH to In contrast, the standard reduction potential for the partial reaction
is for transfer of one electron. Thus this partial reaction tends to proceed toward the right: that is, toward the reduction of cytochrome c to cytochrome c . The final reaction in the electron-transport chain, the reduction of to has a standard reduction potential of ( for transfer of two electrons), the most positive in the whole series; thus this reaction also tends to proceed toward the right. As illustrated in Figure 12-22, the steady increase from the top left to the bottom right in values, and the corresponding decrease in values of the carriers in the electron-transport chain favors the flow of electrons from NADH and (generated from succinate) to . The energy released as electrons flow energetically downhill through the electrontransport chain complexes drives the pumping of protons against their concentration gradient across the inner mitochondrial membrane.
FIGURE 12-22 Changes in reduction potential and free energy during the stepwise flow of electrons through the electron-transport chain. Blue arrows indicate electron flow; red arrows, translocation of protons across the inner mitochondrial membrane. Electrons pass through the multiprotein complexes from those with a lower reduction potential to those with
a higher (more positive) reduction potential (left scale), with a corresponding reduction in free energy (right scale). The energy released as electrons flow through three of the complexes is sufficient to power the pumping of ions across the membrane from the matrix to the intermembrane space (IMS), establishing a proton-motive force. Description A vertical scale on the left side of the electron-transport chain represents reduction potential (in millivolts) and ranges from negative 400 at top to 800 at bottom, in increments of 200. A vertical scale on the right side of the electron-transport chain represents free energy (in kilocalories per mol) and ranges from 60 at top to 0 at bottom, in decrement of 10. The electron-transport chain shows from top to bottom as: complex 1, N A D H-Co Q reductase between negative 300 to negative 50 millivolts and 55 to 42 kilocalories per mol; complex 2, Succinate-Co Q reductase between negative 150 to negative 50 millivolts and 45 to 42 kilocalories per mol; complex 3, Co Q H 2– cytochrome c reductase between 25 to 250 millivolts and 38 to 28 kilocalories per mol; and complex 4, Cytochrome c oxidase between 500 to 750 millivolts and 25 to 3 kilocalories per mol. Co Q is present between complex 2 and 3 while cytochrome c is present between complex 3 and 4. The reaction from top to bottom across the complexes occurs as follows: In complex 1: N A D H is converted to N A D plus and H plus with 2 electrons transferred to F M N to F e-S. H plus from matrix are transferred to H plus in I M S. In complex 2: Succinate is converted to fumarate and 2 H plus with 2 electrons transferred to F A D slash F A D H 2 to F e-S. Electrons from both complex 1 and 2 are then transferred to Co Q to complex 3. In complex 3: Electrons are transferred to F e-S to cytochrome c 1. H plus from matrix are transferred to H plus in I M S. Next, electrons are transferred to cytochrome c to complex 4. In complex 4: Electrons are transferred to C u a to cytochrome a to (C u b cytochrome a 3). The electrons then convert one-half O 2 and 2 H plus into H 2 O. H plus from matrix are transferred to H plus in I M S.
The Multiprotein Complexes of the Electron-Transport Chain Assemble into Supercomplexes
The Multiprotein Complexes of the Electron-Transport Chain Assemble into Supercomplexes Over 50 years ago, Britton Chance proposed that the electron-transport complexes might assemble into large supercomplexes. Doing so would bring the complexes into close and highly organized proximity, which might improve the speed and efficiency of the overall electron-transport process. Indeed, genetic, biochemical, and biophysical studies have provided very strong evidence for the existence of electron-transport chain supercomplexes. For example, polyacrylamide gel electrophoretic methods called blue native (BN)-PAGE and colorless native (CN)-PAGE, which permit separation of very large macromolecular protein complexes, have allowed detection of multiple inner mitochondrial membrane supercomplexes with various stoichiometries (Figure 12-23a). When one such supercomplex containing one copy each of complexes I and IV and two copies of complex III was isolated with ubiquinone (CoQ) and cytochrome c from BN-PAGE gels, it was shown to transfer electrons from NADH to in other words, this supercomplex can respire — it is a respirasome. The structures of two of such supercomplexes from human mitochondria determined by cryo-EM are shown in Figure 12-23b ( cytochrome c’s) and 12-23c ( cytochrome c’s). The precise function of supercomplex formation in the context of the very high protein concentration in the inner mitochondrial membrane remains to be established with certainty, but is thought to involve improving the speed
and efficiency of electron transport, stabilizing individual multiprotein complexes, or preventing inappropriate protein aggregates. EXPERIMENTAL FIGURE 12-23 Electrophoresis and cryoelectron microscopic imaging have identified and permitted high-resolution structure determination of electrontransport chain supercomplexes containing complexes I, III, and IV. (a) Membrane proteins in isolated bovine heart mitochondria were solubilized with a detergent, and the complexes and supercomplexes were separated by gel electrophoresis (see Chapter 3) using the blue native (BN)-PAGE method. Each blue-stained band within the gel represents the indicated protein complex or supercomplex. The intensity of the blue stain is approximately
proportional to the amount of complex or supercomplex present. The supercomplex has an apparent molecular weight of (b and c) Supercomplexes cytochrome c’s and cytochrome c’s were isolated by sucrose density gradient centrifugation from detergent extracted mitochondria from human HEK293 cultured cells. Cryo-EM imaging methods were used to determine the structures at overall resolutions of ( cytochrome c’s) and ( cytochrome c’s). (b) The left image shows the three-dimensional surface structure of supercomplex cytochrome c’s viewed from an orientation parallel to the presumptive plane of the membrane. The right image is a molecular model showing the individual complexes: complex I (the peripheral “matrix” arm is dark blue and the membrane-embedded arm is light blue), dimer of complex III (gold), complex IV (green) and cytochrome c (Cyt c, orange/brown). Additional atoms in associated small molecules (such as the iron sulfur clusters in complex I and lipids) are colored as follows: carbon, white; iron, burnt orange; sulfur, yellow; oxygen, red; phosphorous, orange; and nitrogen, blue. The same color scheme is used in panel (c). The data permitted the structure of most of the supercomplex to be determined. For example, the locations of all 45 protein subunits in complex I and most of their 8499 amino acid residues were identified. (c) The top image shows the translucent electron density of supercomplex cytochrome c’s into which molecular models for each complex and Cyt c were docked. The bottom image was generated by rotating the top image 90° about a horizontal axis. The locations of the cytochrome c’s would permit them to rapidly shuttle electrons from complex III to complex IV (see Figure 12-19). [Part (a) Republished with permission by The American Society for Biochemistry and Molecular Biology, from Schafer, E., et al., “Architecture of active mammalian respiratory chain supercomplexes,” J. Biol. Chem. 2006, Jun 2;281(22):15370–15375. Epub 2006 Mar 20; permission conveyed through Copyright Clearance Center, Inc. Parts (b) and (c) Republished with permission of Elsevier, from Guo R, Zong S, Wu M, Gu J, Yang M., Architecture of Human Mitochondrial Respiratory Megacomplex I(2)III(2)IV(2). Cell. 2017 Sep 7;170(6):1247–1257; permission conveyed through Copyright Clearance Center, Inc.] Description The part (a) shows a vertical electrophoresis strip with following bands, from top to bottom: supercomplex 1 slash 3 subscript 2 slash 4; supercomplex 1 slash 3 subscript 2; complex 1; thick A T P synthase; complex 3 dimer (3 subscript 2); complex 4, and complex 2.
The part (b) shows a micrograph of the supercomplex 1 subscript 2 slash 3 subscript 2 slash 4 subscript 2 plus 2 cytochrome c’s embedded in the inner membrane separating intermembrane space and matrix. The supercomplex is 220 Armstrong in height and 300 Armstrong in length. The supercomplex has complex 1 membrane arm in the inner membrane, two cytochrome c protruding into the intermembrane space, and three lobes of complex 1 matrix arm, complex 3 subscript 2, and complex 4 protruding into the matrix. The part (b) also shows a similar ribbon-like model supercomplex next to it. The part (c) shows a computer-generated model of the supercomplex 1 subscript 2 slash 3 subscript 2 slash 4 subscript 2 plus 2 cytochrome c’s embedded in the inner membrane separating intermembrane space and matrix. An inverted W-shaped structure shows, complex 1 matrix arm on both sides of the structure and complex 3 subscript 2 in between protruding into the matrix; and complex 4 on both sides of the structure and 2 cytochrome c in between protruding into the intermembrane space. The complex 1 membrane arm lies horizontally in the inner membrane. The part (c) also shows the top view of the supercomplex. The circular structure with a circular center has complex 3 subscript 2 in the middle with cytochrome c at top and bottom. The outer circle has complex 4 at top right and bottom left; complex 1 membrane arm at top left and bottom right; and complex 1 matrix arm in top middle and bottom middle. The unique phospholipid cardiolipin (diphosphatidyl glycerol) appears to play an important role in the assembly and function of these supercomplexes.
Generally found only in the inner mitochondrial membrane, cardiolipin, which normally composes about 20 percent of the lipids in the inner mitochondrial membrane, has been observed to bind to integral membrane proteins of the inner mitochondrial membrane (e.g., complexes I and II). Genetic and biochemical studies in yeast mutants in which cardiolipin synthesis is blocked have established that cardiolipin contributes to the formation and activity of mitochondrial supercomplexes; thus it has been called the glue that holds together the electron-transport chain, though the precise mechanism by which it does so remains to be defined. In addition, there is evidence that cardiolipin may influence the inner membrane’s binding and permeability to protons and consequently the proton-motive force. When mitochondria are damaged, cardiolipin can move to the outer membrane, where it can participate in mitophagy. The role of cardiolipin can be seen in patients with Barth’s syndrome, a human X-linked genetic disease caused by defects in an enzyme that determines the structures of the
Reactive Oxygen Species Are By-Products of Electron Transport
acyl chains on cardiolipin. The reduction in the amounts of cardiolipin in these patients and its abnormal structure result in heart and skeletal muscle defects, growth retardation, and other abnormalities. Reactive Oxygen Species Are ByProducts of Electron Transport Rather than being converted to water, about 1–2 percent of the oxygen metabolized by aerobic organisms is partially reduced to the superoxide anion radical ( , where the “dot” represents an unpaired electron). Radicals are atoms that have one or more unpaired electrons in an outer (valence) shell, or molecules that contain such an atom. Many, though not all, radicals are generally highly chemically reactive, altering the structures and properties of those molecules with which they react. The products of such reactions are often themselves radicals and can thus propagate a chain reaction that alters many additional molecules. Superoxide and other highly reactive oxygen-containing molecules, both radicals (e.g., ) and nonradicals (e.g., hydrogen peroxide, ), are called reactive oxygen species (ROS). ROS are of great interest because they can react with, and thus damage, many key biological molecules, including lipids (particularly unsaturated fatty acids and their derivatives), proteins, and DNA, and thus severely interfere with their normal functions. At moderate to high levels, ROS contribute to what is often called cellular oxidative stress and can be highly toxic. Indeed, ROS are purposefully generated by body-defense cells (e.g., macrophages, neutrophils) to kill pathogens. In humans, excessive or inappropriate generation of ROS has been implicated in many diverse
diseases, including heart failure, neurodegenerative diseases, alcoholinduced liver disease, and diabetes, as well as in aging. Although there are several mechanisms for generating ROS in cells, their major source in eukaryotic cells is electron transport in the mitochondria (or in chloroplasts, as described below). Electrons passing through the mitochondrial electron-transport chain can have sufficient energy to reduce molecular oxygen to form superoxide anions ( , Figure 12-24, top). This can occur, however, only when molecular oxygen comes in close contact with the reduced electron carriers (iron, FMN, ) in the chain. Usually such contact is prevented by sequestration of the carriers within the proteins involved. However, there are some sites (particularly in complex I and , see Figure 12-18) and some conditions (e.g., high ratio in the matrix, high proton-motive force when ATP is not generated) when electrons can more readily leak out of the chain and reduce to .
FIGURE 12-24 Generation and inactivation of toxic reactive oxygen species. Electrons from the electron-transport chains of mitochondria and chloroplasts, as well as some generated through other enzymatic reactions, reduce molecular oxygen , forming the highly reactive radical anion superoxide . Superoxide is rapidly converted by superoxide dismutase (SOD) to hydrogen peroxide which in turn can be converted by metal ions such as to hydroxyl radicals or inactivated to by enzymes such as catalase. Because of their high chemical reactivity, , , , and similar molecules are called reactive oxygen species (ROS). They cause oxidative and free-radical damage to many biomolecules, including lipids, proteins, and DNA. This damage leads to cellular oxidative stress that can cause disease and, if sufficiently severe, can kill cells. In addition, ROS can function as intra- and intercellular signaling molecules. Description
The flowchart is as follows: O 2 takes electrons from complex 1, Co Q 2 minus, etcetera and transforms to O 2 minus. S O D converts O 2 minus to H 2 O 2 while simultaneously converting 2 H plus and O 2 minus to O 2. F e 2 plus converts H 2 O 2 to O H while simultaneously converting electron to O H negative. A catalase also converts H 2 O 2 to 2 H 2 O while simultaneously converting H 2 O 2 to O 2. The O 2 minus, H 2 O 2, and O H cause oxidative and free radical damage to lipids, proteins, and D N A. H 2 O 2 can also cause cell signaling. The superoxide anion is an especially unstable, and thus reactive, ROS. Mitochondria have evolved several defense mechanisms that help protect against toxicity, including the use of enzymes that inactivate superoxide: first superoxide is converted to by Mn-containing superoxide dismutase, called SOD, and then to by the enzyme catalase (see Figure 12-24). SOD and catalase are some of the fastest enzymes known so that they prevent the buildup of ROS. SOD is found within mitochondria and other cellular compartments. Hydrogen peroxide itself is an ROS that can diffuse readily across membranes and react with molecules throughout the cell. It can also be converted by certain metals, such as , into the even more dangerous hydroxyl radical . Thus cells depend on the inactivation of by catalase and other enzymes, such as peroxiredoxin and glutathione peroxidase, which also detoxify the lipid hydroperoxide products formed when ROS react with unsaturated fatty acyl groups. Small-molecule antioxidant radical scavengers, such as vitamin E and α-lipoic acid, also protect against oxidative stress. Although in many cells catalase is located only in peroxisomes, in heart muscle cells it is found in mitochondria. This is not surprising because the heart is the most oxygen-consuming organ per gram in mammals.
Experiments Using Purified Electron-Transport Chain Complexes Established the Stoichiometry of Proton Pumping
As the rate of ROS production by mitochondria and chloroplasts reflects the metabolic state of these organelles (e.g., strength of proton-motive force, ratio), cells have developed ROS-sensing systems, such as transcription factors, to monitor the metabolic state of these organelles and respond accordingly — for example, by changing the rate of transcription of nuclear genes that encode organelle-specific proteins. Thus ROS such as can function as a physiologically relevant intracellular, and even intercellular, signaling molecule. ROS have been reported to participate in cell processes as diverse as adaptation to low oxygen levels (hypoxia) and stress, growth factor and nutrient regulation of cell proliferation, cell differentiation, regulated cell death, and autophagy. Experiments Using Purified ElectronTransport Chain Complexes Established the Stoichiometry of Proton Pumping The multiprotein complexes of the electron-transport chain that are responsible for proton pumping have been identified by selectively extracting mitochondrial membranes with detergents, isolating each of the complexes in nearly pure form, and then preparing artificial phospholipid vesicles (liposomes) containing each complex. When an appropriate electron donor and electron acceptor are added to such liposomes, a change in the pH of the medium will occur if the embedded complex transports protons. Studies of this type as well as studies using membranes isolated from mitochondria indicate that NADH-CoQ reductase (complex I)
The Proton-Motive Force in Mitochondria Is Due Largely to a Voltage Gradient Across the Inner Membrane
translocates four protons per pair of electrons transported, whereas cytochrome c oxidase (complex IV) translocates two protons per pair of electrons transported (see Figure 12-19). Current evidence suggests that a total of 10 protons are transported from the matrix across the inner mitochondrial membrane for every electron pair that is transferred from NADH to (see Figure 12-19). Because succinate-CoQ reductase (complex II) does not transport protons, and because complex I is bypassed when the electrons come from succinate-derived , only six protons are transported across the membrane for every electron pair that is transferred from this to . The Proton-Motive Force in Mitochondria Is Due Largely to a Voltage Gradient Across the Inner Membrane The main result of the electron-transport chain is the generation of the proton-motive force, which is the sum of a transmembrane proton concentration (pH) gradient and an electric potential, or voltage gradient, across the inner mitochondrial membrane. The relative contributions of these two components to the total proton-motive force have been shown to depend on the permeability of the membrane to ions other than . A significant voltage gradient can develop only if the membrane is poorly permeable to other cations and to anions. Otherwise, anions would leak across the membrane from the matrix to the intermembrane space along
with the protons and prevent a voltage gradient from forming. Similarly, if cations other than could leak across the membrane in a direction opposite to that of the (from the intermembrane space to the matrix), that leakage would counterbalance the positive charges delivered to the intermembrane space by the protons, short-circuiting voltage-gradient formation. Indeed, the inner mitochondrial membrane is poorly permeable to ions other than . Thus proton pumping generates a voltage gradient that makes it energetically difficult for additional protons to move across the membrane because of charge repulsion. As a consequence, proton pumping by the electron-transport chain establishes a robust voltage gradient in the context of what turns out to be a rather small pH gradient. Because mitochondria are much too small to be impaled with electrodes, the electric potential and pH gradient across the inner mitochondrial membrane cannot be directly measured. However, the electric potential can be measured indirectly by adding radioactive ions and a trace amount of valinomycin to a suspension of respiring mitochondria and measuring the amount of radioactivity that accumulates in the matrix. Although the inner membrane is normally impermeable to , valinomycin is an ionophore, a small lipid-soluble molecule that selectively binds a specific ion (in this case, ) and carries it across otherwise impermeable membranes. In the presence of valinomycin, equilibrates across the inner membrane of isolated mitochondria in accordance with the electric potential: the more negative the matrix side of the membrane, the more will be attracted to and accumulate in the matrix.
At equilibrium, the measured concentration of radioactive ions in the matrix, , is about 500 times greater than that in the surrounding medium, . Substitution of this value into the Nernst equation (see
Chapter 11) shows that the electric potential E (in mV) across the inner membrane in respiring mitochondria is , with the matrix (inside) negative: Alternatively, the relative mitochondrial inner membrane potential can be measured using lipophilic cationic dyes such as tetramethylrhodamine methyl ester. The extent of accumulation of these fluorescent dyes in the mitochondrial matrix depends on the membrane potential and follows the Nernst equation. Various methods can be used to measure the fluorescence in the mitochondria, including flow cytometry, spectrofluorimetry, and quantitative fluorescence microscopy. Researchers can measure the matrix (inside) pH by trapping pH-sensitive fluorescent dyes inside vesicles formed from the inner mitochondrial membrane, with the matrix side of the membrane facing inward. They can also measure the pH outside the vesicles (equivalent to the intermembrane space) and thus determine the pH gradient , which turns out to be about one pH unit. A difference of one pH unit represents a tenfold difference in concentration, so according to the Nernst equation, a pH gradient of one unit across a membrane is equivalent to an electric potential of 59 mV at 20 °C. Thus knowing the voltage and pH gradients, we can calculate the proton-motive force (pmf) as
where R is the gas constant of T is the temperature (in degrees Kelvin), F is the Faraday constant and is the transmembrane electric potential; and pmf are measured in millivolts. The electric potential across the inner membrane is (negative inside), and is equivalent to about 60 mV. Thus the total proton-motive force is , with the transmembrane electric potential responsible for about 73 percent of the total. KEY CONCEPTS OF SECTION 12.6 The Electron-Transport Chain and Generation of the Proton-Motive Force By the end of the citric acid cycle (stage II), much of the energy originally present in the covalent bonds of glucose and fatty acids has been converted into high-energy electrons in the reduced coenzymes NADH and . The energy from these electrons is used to generate the proton-motive force. In the mitochondrion, the proton-motive force is generated by coupling electron flow (from NADH and to ) to the energetically uphill transport of protons from the matrix across the inner membrane to the intermembrane space. This process, together with the synthesis of ATP from ADP and driven by the proton-motive force, is called oxidative phosphorylation. As electrons flow from and NADH to , they pass through multiprotein complexes. The four major complexes are NADH-CoQ reductase (complex I), succinate-CoQ reductase (complex II), –cytochrome c reductase (complex III), and cytochrome c oxidase (complex IV) (see Figure 12-19). Each complex contains one or more electron-carrying prosthetic groups, which include iron-sulfur clusters, flavins, heme groups, and copper ions (see Table 12-3). Cytochrome c, which contains heme, and coenzyme Q (CoQ), a lipid-soluble small molecule, are mobile carriers that shuttle electrons between the complexes. Complexes I, III, and IV pump protons from the matrix into the intermembrane space. Complexes I and II reduce CoQ to , which carries protons and high-energy electrons to complex III. The heme protein cytochrome c carries electrons from
complex III to complex IV, which uses them to pump protons and reduce molecular oxygen to water. The high-energy electrons from NADH enter the electron-transport chain through complex I, whereas the high-energy electrons from (derived from succinate in the citric acid cycle) enter the electron-transport chain through complex II. Additional electrons derived from by the initial step of fatty acyl–CoA β-oxidation increase the supply of available for electron transport. The Q cycle allows four protons to be translocated per pair of electrons moving through complex III (see Figure 12-21). Each electron carrier in the chain accepts an electron or electron pair from a carrier with a less positive reduction potential and transfers the electron to a carrier with a more positive reduction potential. Thus the reduction potentials of electron carriers favor unidirectional, downhill, electron flow from NADH and to (see Figure 12-22). Within the inner mitochondrial membrane, electron-transport complexes assemble into supercomplexes held together by cardiolipin, a specialized phospholipid. Supercomplex formation may enhance the speed and efficiency of generation of the proton-motive force or play other roles. Reactive oxygen species (ROS) are toxic by-products of the electron-transport chain that can modify and damage proteins, DNA, and lipids. Specific enzymes (e.g., glutathione peroxidase, catalase) and small-molecule antioxidants (e.g., vitamin E) help protect against ROS-induced damage (see Figure 12-24). ROS can also be used as intracellular signaling molecules. A total of ions are translocated from the matrix across the inner membrane per electron pair flowing from NADH to (see Figure 12-19), whereas ions are translocated per electron pair flowing from to . The proton-motive force is largely due to a voltage gradient across the inner membrane produced by proton pumping; the pH gradient plays a quantitatively less important role.
12.7 Harnessing the Proton-Motive Force to Synthesize ATP
12.7 Harnessing the Proton-Motive Force to Synthesize ATP The hypothesis that a proton-motive force across the inner mitochondrial membrane is the immediate source of energy for ATP synthesis was proposed in 1961 by Peter Mitchell. Virtually all researchers studying oxidative phosphorylation and photosynthesis initially rejected his proposal (called the chemiosmotic hypothesis). They favored a mechanism similar to the then well-elucidated substrate-level phosphorylation in glycolysis, in which chemical transformation of a substrate molecule (like phosphoenolpyruvate in glycolysis) is directly coupled to ATP synthesis. Despite intense efforts by a large number of investigators, however, compelling evidence for such a substrate-level phosphorylation–mediated mechanism was never observed. Definitive evidence supporting Mitchell’s hypothesis depended on developing and employing techniques to purify and reconstitute organelle membranes and membrane proteins. In one such experiment, outlined in
Figure 12-25, vesicles made from chloroplast thylakoid membranes (equivalent to the inner membranes of mitochondria, we will discuss these later in this chapter) that contain the enzyme ATP synthase, were studied. This and other experiments demonstrated that ATP synthase is an ATPgenerating enzyme and that ATP generation is dependent on proton movement down an electrochemical gradient across the membrane in
which the enzyme resided. It turns out that the protons actually move through the ATP synthase protein as they traverse the membrane.
ATP Synthase Comprises F0 and F1 Multiprotein Complexes
the thylakoid membrane wherein one has F 1 inside and F 0 outside while other is in opposite direction. Positive charge is present inside the thylakoid membrane while negative outside in stroma. H plus ions from stroma enters inside the thylakoid as light strikes it and N A D P plus and H 2 O is converted to N A D P H and O 2 toward outside surface of thylakoid membrane. The H plus ions re-enter the thylakoid via an inverted A T P synthase that simultaneously converts A D P and P i to A T P in stroma. In addition to ATP synthesis, the proton-motive force across the bacterial plasma membrane is used to power other processes, including the uptake of nutrients such as sugars (using symporters) and the rotation of bacterial flagella. Chemiosmotic coupling thus illustrates an important principle introduced in our discussion of active transport in
Chapter 11: the membrane potential, the concentration gradients of protons (and other ions) across a membrane, and the phosphoanhydride bonds in ATP are equivalent and interconvertible forms of potential energy (also see Chapter 2). Indeed, ATP synthesis through ATP synthase can be thought of as active transport in reverse. ATP Synthase Comprises and Multiprotein Complexes With general acceptance of Mitchell’s chemiosmotic mechanism, researchers turned their attention to the structure and operation of ATP synthase. The complex has two principal subcomplexes, and , both of which are multimeric proteins (Figure 12-27a). The subcomplex contains three types of integral membrane proteins, designated a, b, and c. In bacteria and in yeast mitochondria, the most common subunit
stoichiometry is , but the number of c subunits per subcomplex varies among different eukaryotes from 8 to 15. In all cases, the c subunits form a doughnut-shaped ring (“c ring”) in the plane of the membrane. The one a and two b subunits are rigidly linked to one another, but not to the c ring, a critical feature of the protein to which we will return shortly. As you can see in Figure 12-27a, when the ATP synthase is operating, portions of the structure do not move (orange) and the rest (green) rotate together about an axis perpendicular to the plane of the membrane. As we shall see, the flow of protons through the ATP synthase powers the rotation of the complex of the c, γ, and ε subunits that in turn drives the synthesis of ATP from ADP and on the β subunits.
FIGURE 12-27 Structure of ATP synthase (the complex) in the bacterial plasma membrane and mechanism of proton translocation across the membrane. (a) The membrane-embedded subcomplex of ATP synthase is built of three integral membrane proteins: one copy of a, two copies of b, and an average of ten copies of c arranged in a ring in the plane of the membrane. Two proton half-channels near the interfaces of subunit a
with the c subunits mediate proton movement across the membrane (proton path is indicated by red arrows). Half-channel I allows protons to move one at a time from the exoplasmic medium (equivalent to intermembrane space in mitochondria) to the negatively charged side chain of Asp-61 in the center of a c subunit near the middle of the membrane. The proton-binding site in each c subunit is represented as a white circle with a blue representing the negative charge on the side chain of Asp-61. Half-channel II permits protons to move from the Asp-61 of an adjacent c subunit into the cytosolic medium. In order for protons to move through the complex the c ring must rotate in the plane of the membrane, as shown by the detailed molecular structure of the c ring and a portion of the adjacent a subunit in Figure 12-30. The subcomplex of ATP synthase contains three copies each of subunits α and β, which form a hexamer resting atop the single rod-shaped γ subunit, which is inserted into the c ring of . The ε subunit is rigidly attached to the γ subunit and also to several of the c subunits. The δ subunit permanently links one of the α subunits in the subcomplex to the b subunit of . Thus the a and b subunits and the subunit and hexamer form a rigid structure (orange) anchored in the membrane. During proton flow, the c ring and the attached and γ subunits rotate as a unit (green), causing conformational changes in the subunits, leading to ATP synthesis. (b) Potential mechanism of proton translocation. Step 1 : A proton from the exoplasmic space enters half-channel I and moves toward the “empty” (unprotonated) Asp61 proton-binding site. The negative charge (blue ) on the unprotonated side chain Asp-61 is balanced, in part, by a positive charge on the side chain of Arg-210 (red ). Step 2 : The proton fills the empty proton-binding site and simultaneously displaces the positively charged Arg-210 side chain, which swings over to the filled proton-binding site on the adjacent c subunit (curved arrow). As a consequence, the proton bound at that adjacent site is displaced. Step 3 : The displaced adjacent proton moves through halfchannel II and is released into the cytosolic space, leaving an empty proton-binding site on Asp-61. Step 4 : Counterclockwise rotation of the entire c ring moves the “empty” c subunit over half-channel I. Step 5 : The process is repeated. See M. J. Schnitzer, 2001, Nature 410:878–881; P. D. Boyer, 1999, Nature 402:247–249; and C. von Ballmoos, A. Wiedenmann, and P. Dimroth, 2009, Annu. Rev. Biochem. 78:649–672. Description The illustration (a) of an A T P synthase structure shows F 0 unit embedded in the membrane present between matrix (cytosolic) and intermembrane space (exoplasmic)
with the F 1 unit protruding in the matrix. The diameter of alpha and beta ring is 10 nanometers. The matrix is negatively charged while the intermembrane space is positively charged. H plus ions move across proton half-channel 1 and 2 present in subunit a embedded in the membrane from intermembrane space to matrix. H plus ions or protons are bound to negative charge on Asp-61 of each subunit c that rotates. A D P and P i is converted to A T P by alpha and beta ring of F 1 unit. The illustration (b) shows five steps of proton translocation across half-channel 1 and half-channel 2 that causes the subunit c ring to rotate. Step 1: Proton enters subunit c of half-channel 1 and binds to Arg-210. Step 2: Arg-210 is displaced. Step 3: Adjacent proton exits from halfchannel 2. Step 4: The c-ring rotates. Step 5: Process repeats. The subcomplex is a water-soluble complex of five distinct polypeptides with the composition that is normally firmly bound to the a subunit of the subcomplex at the surface of the membrane. The lower end of the rodlike γ subunit of the subcomplex is a coiled coil that fits into the center of the c-subunit ring of and appears rigidly attached to it. Thus when the c-subunit ring rotates, the rodlike γ subunit rotates with it. The subunit is rigidly attached to γ and also forms tight contacts with several of the c subunits of . The α and β subunits are responsible for the overall globular shape of the subcomplex and associate in alternating order to form a hexamer, , or , which rests atop, but is not rigidly attached to the single long γ subunit. The subunit is permanently linked to one of the subunits and also binds to the b subunit of . Thus the a and b subunits of the subcomplex and the δ subunit and hexamer of the subcomplex form a rigid structure anchored in the membrane. The rodlike b subunits form a “stator” that prevents the hexamer from moving while it rests on the subunit, whose rotation, together with that of the ε subunit and the c-
Rotation of the F1γ Subunit, Driven by Proton Movement Through F0, Powers ATP Synthesis
subunit ring of , plays an essential role in the ATP synthesis mechanism described below. When ATP synthase is embedded in a membrane, the subcomplex forms a knob that protrudes from the cytosolic face (the matrix face in the mitochondrion). Because separated from membranes is capable of catalyzing ATP hydrolysis (ATP conversion to ADP plus ) in the absence of the subcomplex, it has been called the ATPase; however, its function in cells is the reverse, to synthesize ATP. ATP hydrolysis is a spontaneous process ; thus energy is required to drive the ATPase in reverse and generate ATP. Rotation of the Subunit, Driven by Proton Movement Through , Powers ATP Synthesis Each of the three β subunits in the globular subcomplex of can bind ADP and and catalyze the endergonic synthesis of ATP when coupled to the flow of protons from the exoplasmic medium (the intermembrane space in the mitochondrion) to the cytosolic (matrix) medium. However, the energetic coupling of proton flow and ATP synthesis does not take place in the same portions of the protein, because the nucleotide-binding sites on the β subunits of , where ATP synthesis occurs, are 9–10 nm from the surface of the membrane-embedded portion of through which the protons flow. The most widely accepted model for
ATP synthesis by the complex — the binding-change mechanism — posits an indirect, mechanical coupling (Figure 12-28).
FIGURE 12-28 The binding-change mechanism of ATP synthesis from ADP and . This view is looking up at from the membrane surface (see Figure 12-27). As the γ subunit rotates by 120° in the center, each of the otherwise identical β subunits alternates among three conformational states (O, open, with oval representation of the nucleotide binding site; L, loose, with a rectangular binding site; T, tight, with a triangular site) that differ in their binding affinities for ATP, ADP, and . To make it easier for you to follow the reactions, the three different sets of (and their product ATP) are colored red, blue, or green. The cycle begins (upper left) when ADP and bind loosely to one of the three β subunits (here, arbitrarily designated ) whose nucleotide-binding site is in the O (open) conformation. Proton flux through the portion of the protein powers a 120° rotation of the γ subunit (relative to the fixed β subunits) (step 1 ). This causes the rotating γ subunit, which is asymmetric, to push against each of the three β subunits in different ways, resulting in distinct conformational changes in each β subunit. In step 1 this results in an increase in the binding affinity of the subunit for ADP and , an increase in the binding affinity of the subunit for ADP and that were previously bound , and a decrease in the binding affinity of the subunit for a
previously bound ATP , causing release of the bound ATP. Step 2 : Without additional rotation, the ADP and in the T site (here, in the subunit) form ATP, a reaction that does not require an input of additional energy due to the special environment in the active site of the T state. At the same time, a new ADP and bind loosely to the unoccupied O site on . Step 3 : Proton flux powers another 120° rotation of the γ subunit, consequent conformational changes in the binding sites , and release of ATP from . Step 4 : Without additional rotation, the ADP and in the T site of form ATP, and additional ADP and bind to the unoccupied O site on . The process continues with rotation (step 5 ) and ATP formation (step 6 ) until the cycle is complete, with three ATPs having been produced for every 360° rotation of γ. See P. Boyer, 1989, FASEB J. 3:2164–2178; Y. Zhou et al., 1997, Proc. Natl. Acad. Sci. USA 94:10583–10587; and M. Yoshida, E. Muneyuki, and T. Hisabori, 2001, Nat. Rev. Mol. Cell Biol. 2:669–677. Description The illustrations show a circular disc-shaped structure, divided into three equal sections of beta 1, 2, and 3 with a gamma subunit in between. The process starts with a beta 1 subunit at top having open oval site, beta 2 subunit at right having tight triangular site, and beta 3 subunit at left with loose rectangular site. A D P and P i enter open site, A T P is present in tight site, and A D P and P i are present in loose site. Step 1, clockwise rotation results in: loose rectangular site in beta 1 having A D P and P i, open oval site in beta 2 with A T P detaching, and tight triangular site in beta 3 having A D P and P i. Step 2, reaction but no rotation results in: loose rectangular site in beta 1 having A D P and P i, open oval site in beta 2 with A D P and P i entering, and tight triangular site in beta 3 having A T P. Step 3, clockwise rotation results in: tight triangular site in beta 1 having A D P and P i, loose rectangular site in beta 2 having A D P and P i, and open oval site in beta 3 with A T P detaching. Reversible step 4, reaction but no rotation results in: tight triangular site in beta 1 having A T P, loose rectangular site in beta 2 having A D P and P i, and open oval site in beta 3 with A D P and P i entering. Step 5, clockwise rotation results in: open oval site in beta 1 with A T P detaching, tight triangular site in beta 2 having A D P and P i, and loose rectangular site in beta 3 having A D P and P i. Reversible step 6, reaction but no rotation results back to initial structure.
According to this mechanism, energy released by the downhill movement of protons through directly powers rotation of the c-subunit ring together with its rigidly attached γ and ε subunits (see Figure 12-27a). The γ subunit is a nonsymmetrical, rotating shaft, similar to a camshaft in a car engine, whose c ring–driven rotation within the center of the static hexamer of causes it to push sequentially against each of the β subunits. The mechanical force exerted on the β subunits induces cyclical changes in their conformations and drives the conversion of ADP and to ATP in the active site of each β subunit. As schematically depicted in a view of the bottom of the hexamer’s globular structure in Figure 1228, rotation of the γ subunit relative to the fixed hexamer causes the nucleotide-binding, active site of each β subunit to cycle through three conformational states in the following order: 1. An O (open) state that binds ATP very poorly and ADP and weakly 2. An L (loose) state that binds ADP and more strongly but cannot bind ATP 3. A T (tight) state that binds ADP and so tightly that they spontaneously react and form ATP In the T state, the ATP produced is bound so tightly that it cannot readily dissociate from the site — it is trapped until further rotation of the γ subunit returns that β subunit to the O state, thereby releasing ATP and beginning the cycle again. ATP or ADP also binds to regulatory or allosteric sites on the three α subunits; this binding modifies the rate of ATP synthesis according to the level of ATP and ADP in the matrix, but is
not directly involved in the catalytic step that synthesizes ATP from ADP and . Several types of evidence support the binding-change mechanism. First, biochemical studies showed that on isolated particles one of the three β subunits can tightly bind ADP and and then form ATP, which remains tightly bound. The measured for this reaction is near zero, indicating that once ADP and are bound to the T state of a β subunit, they spontaneously form ATP. Importantly, dissociation of the bound ATP from the β subunit on isolated particles occurs extremely slowly. This finding suggested that dissociation of ATP would have to be powered by a conformational change in the β subunit, which in turn would be due to cring rotation caused by proton movement. A second line of evidence comes from x-ray crystallographic analysis of the hexamer, which yielded a striking conclusion: although the three β subunits are identical in sequence and overall structure, the sites have different conformations in each subunit. The most reasonable conclusion was that the three β subunits cycle in an energy-dependent reaction between three conformational states (O, L, T), in which the nucleotide-binding site has substantially different structures. In other studies, intact complexes were treated with chemical crosslinking agents that covalently linked the γ and ε subunits and the c-subunit ring. The observation that such treated complexes could synthesize ATP or use ATP to power proton pumping indicates that the cross-linked proteins normally rotate together.
Finally, rotation of the γ subunit relative to the fixed hexamer, as proposed in the binding-change mechanism, was observed directly by microscopy in the clever experiment depicted in Figure 12-29. A fluorescently labeled actin filament was attached to the γ subunit of ; the -mediated ATP hydrolysis then caused the filament to rotate like a propeller in 120° steps. In one modification of this experiment in which tiny gold particles, rather than an actin filament, were attached to the γ subunit, rotation rates of 134 revolutions per second were observed. Hydrolysis of three ATPs, which you recall is the reverse reaction catalyzed by the same enzyme, is thought to power one revolution; this result is close to the experimentally determined rate of ATP hydrolysis by complexes: about 400 ATPs per second. These and similar experiments established that the γ subunit, along with the attached c ring and ε subunit, does indeed rotate, thereby driving the conformational changes in the β subunits that are required for the binding of ADP and , followed by synthesis and subsequent release of ATP.
EXPERIMENTAL FIGURE 12-29 The γ subunit of the subcomplex rotates relative to the hexamer. subcomplexes were engineered to contain β subunits with an additional His-6 sequence, which causes them to adhere to a glass plate coated with a metal reagent that binds polyhistidine. The γ subunit in the engineered subcomplexes was linked covalently to a fluorescently labeled actin filament. When viewed in a fluorescence microscope, the actin filament was seen to rotate counterclockwise in discrete 120° steps in the presence of ATP due to ATP hydrolysis by the β subunits. See H. Noji et al., 1997, Nature 386: 299–302; and R. Yasuda et al., 1998, Cell 93:1117–1124. Description The illustration shows a ring-shaped structure made of alpha and beta subunits having F 1 subcomplex at the base attached to a glass plate. A cylindrical gamma subunit protruding upward from the center of the alpha-beta ring has F 1 subcomplex covalently linked to a horizontal fluorescent actin filament. Addition of A T P induces fi¬lament rotation in counterclockwise direction, 120 degrees at a time to complete a full rotation in three times.
F0 c Ring Rotation Is Driven by Protons Flowing Through Transmembrane Channels
Multiple Protons Must Pass Through ATP Synthase to Synthesize One ATP A simple calculation indicates that the passage of more than one proton across the membrane and down the electrochemical gradient is required to synthesize one molecule of ATP from ADP and . Although the for this reaction under standard conditions is at the concentrations of reactants in the mitochondrion, is probably higher to . We can calculate the amount of free energy released by the passage of 1 mol of protons down an electrochemical gradient of 220 mV (0.22 V) from the Nernst equation, setting and measuring in volts: Because the downhill movement of 1 mol of protons releases just over 5 kcal of free energy, the passage of at least two protons is required for synthesis of each molecule of ATP from ADP and . c Ring Rotation Is Driven by Protons Flowing Through Transmembrane Channels
Each copy of the c subunit contains two membrane-spanning α helices that form a hairpin-like structure (Figure 12-30a, right). An aspartate residue, Asp-61 (E. coli ATP synthase numbering), in the center of one of these helices in each c subunit is thought to play a key role in proton movement by binding and releasing protons as they traverse the membrane. Chemical modification of this aspartate by the poison dicyclohexylcarbodiimide, or its mutation to alanine, specifically blocks proton movement through . According to one current model, the protons traverse the membrane via two staggered half-channels, I and II (see Figure 12-27a and b). They are called half-channels because each extends only halfway across the membrane; the intramembrane termini of the channels are at the level of Asp-61 in the middle of the membrane. Half-channel I is open only to the exoplasmic face, and half-channel II is open only to the cytosolic face. Prior to rotation, each of the Asp-61 carboxylate side chains in the c subunits is bound to a proton, except for that on the c subunit in contact with half-channel I. The negative charge on that unprotonated carboxylate (the “empty” proton-binding site; see Figure 12-27b, bottom) is neutralized by interaction with the positively charged side chain of Arg210 from the a subunit. Proton translocation across the membrane begins when a proton from the exoplasmic medium (intermembrane space in mitochondria) moves upward through half-channel I (see Figure 12-27b, step 1 ). As that proton moves into the empty proton-binding site, it displaces the Arg-210 side chain, which swings toward the filled protonbinding site of the adjacent c subunit in contact with half-channel II (step 2 ). As a consequence, the positive side chain of Arg-210 displaces the proton bound to Asp-61 of the adjacent c subunit. This displaced proton is now free to travel up half-channel II and out into the cytosolic medium
(matrix in mitochondria) (step 3 ). Thus when one proton entering from half-channel I binds to the c ring, a different proton on an adjacent c subunit is released to the opposite side of the membrane via half-channel II. Rotation of the entire c ring due to motion (step 4 ) then allows the newly unprotonated c subunit to move into alignment above half-channel I as an adjacent, protonated c subunit rotates in to take its place under half-channel II. The entire cycle is then repeated (step 5 ) as additional protons move down their electrochemical gradient from the exoplasmic medium to the cytosolic medium. During each partial rotation (360° divided by the number of c subunits in the ring), the c ring rotation is ratcheted, in that net movement of the ring occurs in only one direction. The energy driving the protons across the membrane, and thus the rotation of the c ring, comes from the electrochemical gradient across the membrane. If the direction of proton flow is reversed, which can be done by experimentally reversing the direction of the proton gradient and the proton-motive force, the direction of c ring rotation is reversed. Because the γ subunit of is tightly attached to the c ring of , rotation of the c ring associated with proton movement causes rotation of the γ subunit. According to the binding-change mechanism, a 120° rotation of γ powers synthesis of one ATP (see Figure 12-28). Thus complete rotation of the c ring by 360° would generate three ATPs. In E. coli, where the composition is movement of 10 protons drives one complete rotation and thus synthesis of three ATPs. This value is consistent with experimental data on proton flux during ATP synthesis, providing indirect support for the model coupling proton movement to c ring rotation depicted in Figure 12-27. The from mammals contains 8 c subunits per
ring. The from chloroplasts contains 14 c subunits per ring, and movement of 14 protons would be needed for synthesis of three ATPs. Why these otherwise similar complexes have evolved to have different :ATP ratios is not clear. High-resolution electron microscopic tomography (Figure 12-30) has provided additional insights into the structure of the c subunit interface and other features of structure and function. The experiments were performed using either dissolved in detergent, then incorporated into artificial phospholipid bilayers, or in isolated mitochondrial membranes. Figures 12-30a and b show two views of the two membrane-spanning α helices in each copy of the c subunit (green) that together form the c ring. In a portion of the a subunit (orange), a bundle of four α helices that are almost parallel to and embedded within the inner mitochondrial membrane forms the interface with the c ring and positions the side chain of the a subunit’s Arg 210 adjacent to the c ring so that it can mediate proton displacement from Asp 61 as shown in Figure 12-27. The c subunit interface also forms the two proton halfchannels through which protons flow out of the intermembrane space (red arrow), around the c ring (black arrows in Figure 12-30b), and then out into the matrix (red arrow). Each monomer bends the membrane by approximately 43° (Figure 12-30c). The monomers dimerize to impart high membrane curvature and then align in long rows, contributing to the formation of the edges and tips of the pancake-like (flat) and tubular cristae (Figure 12-30d and e, also see Figure 12-6a).
EXPERIMENTAL FIGURE 12-30 High-resolution electron microscopy-based mechanism of proton translocation and bending of cristae membranes by ATP synthase. (a) and (b) The interface between the c ring (green) and a subunit (orange) of detergentsolubilized mitochondrial ATP synthase from the alga Polytomella sp., imaged by singleparticle cryoelectron microscopy ( resolution), is shown (a) from within the plane of the inner mitochondrial membrane (side view) and (b) after a 90° rotation (top view). The movement of protons through half-channels I and II and the rotation of the c ring are described in detail in Figure 12-27. (a) Cross section through the c ring (right) shows that each c subunit is a transmembrane helical hairpin — two adjacent transmembrane α helices connected by a short nonhelical linker on the matrix side of the membrane. The negative side chain of the c subunit’s Asp61 in the middle of the membrane is thought to both serve as a binding site for translocating protons and interact with the side chain of the a subunit’s Arg210. (c) A model of the bovine heart mitochondrial ATP synthase dimer is based on cryoelectron tomography and electron crystallographic image
processing from crystalline ATP synthase in artificial membranes. Each monomer bends the membrane by ∼ 43° toward the intermembrane space (IMS), resulting in dimers bending the membrane by ∼ 86°. The rotating c ring and γ and ε subunits are colored green, and the remaining static portions of the enzyme are shown in orange. (d) Cryoelectron tomographic image of frozen membranes from purified Saccharomyces cerevisiae (yeast) mitochondria. The surfaces of the ATP synthase complexes (yellow) and the membrane (gray) show that the enzymes dimerize as in (c) and align into long rows that bend the membranes into characteristic tubular and flat, pancake-like cristae. (e) Cartoon illustrating the topological relationships of the rows of ATP synthase dimers (orange and green) on the curved edge of a crista to other components of the inner membrane (electron transport supercomplexes and the crista junction complex MICOS, gray) and the outer membrane (SAM and Tom complexes, gray) that link MICOS to the outer membrane. The cycling of protons (red spheres) from the matrix through the electrontransport chain to the inner membrane space and then back into the matrix via ATP synthase is indicated by black arrows. The relative sizes of the proteins and membrane bilayers are not drawn to scale. [Parts (a) and (b) Reprinted with permission of Nature Publishing Group, from Allegretti, M., et al., “Horizontal membrane-intrinsic α-helices in the stator a-subunit of an F-type ATP synthase,” Nature, 2015, 521, pp. 237–240, 2015; permission conveyed through Copyright Clearance Center, Inc.; Part (c) From Proc Natl Acad Sci USA 2012. 109(34):13602–13607, Fig. 4C and D. Structure of the yeast F1Fo-ATP synthase dimer and its role in shaping the mitochondrial cristae by Davies et al. Part (e) Data from W. Kühlbrandt, 2015, BMC Biol. 13:89.] Description The illustration (a) shows the side-view of c ring and c ring cross-section embedded in the inner mitochondrial membrane separating matrix from intermembrane space. The counterclockwise rotating c ring has a static a subunit wrapped around it in the middle attached to a proton half-channel 1 toward intermembrane space and proton halfchannel 2 toward matrix. Protons from intermembrane space enter proton half-channel 1 then to proton half-channel 2 and exits in matrix. The cross-section shows Asp 61 attached to the c subunit, transmembrane hairpin and Arg 210 attached to the static a subunit. Positively charged Arg 210 is bound to the negatively charged Asp 61.
ATP-ADP Exchange and Phosphate Transport Across the Inner Mitochondrial Membrane Are Required to Supply ADP and Phosphate for ATP Synthesis
The illustration (b) shows the top-view of c ring (from matrix) and a similar schematic model. The wheel-like c ring has multiple spirals attached on the surface, and rotating counterclockwise. Each spiral is bound to a hydrogen. The ring below is attached to the proton half-channel 2 bound to horizontal rod-like static a subunit which is further bound to proton half-channel 1 below. The Arg 210 of static a subunit is attached to the hydrogen of c ring. The schematic model shows a similar structure. The illustration (c) shows the F 0 F 1 dimer. The a subunit of one F 0 F 1 is attached to the a subunit of another F 0 F 1 with an 86 degrees angle between them. The a and c subunits are embedded in the inner mitochondrial membrane while the other subunits protrude into the matrix. The illustration (d) shows a pancake-like crista and a tubular crista surrounded by several F 0 F 1 dimers. The illustration (e) shows wall-like outer and inner membranes separating cytosol with p H 7.3 5 from matrix with p H 7.9. The outer membrane has several V D A C pores for easy movement of protons while the inner membrane is made of supercomplex 1 subscript 2 slash 3 subscript 2 slash 4 subscript 2. The inner membrane has a horizontal U-shaped fold protruding into the matrix. A disc-like S A M slash Tom protein is embedded in the outer membrane with its two legs attached to the origin of fold in inner membrane at M I C O S. The F 0 F 1 dimers are present at the curve of the Ushaped fold with thread-like structures binding at both sides of the fold. ATP-ADP Exchange and Phosphate Transport Across the Inner Mitochondrial Membrane Are Required to Supply ADP and Phosphate for ATP Synthesis
It is estimated that at any one time an adult human contains about 50 g of ATP, yet that same individual must hydrolyze 65 kg of ATP per day. Thus mitochondria must generate 65 kg of per person from ADP and and transport most of that ATP out of the matrix where it is generated (Figures 12-11 and 12-26) so that it can be used elsewhere in the cells. Clearly large amounts of ADP and must be transported into the matrix to sustain ATP synthesis. This transport is mediated by two proteins in the inner membrane (Figure 12-31): a phosphate ( , ) transporter, which mediates the import of one coupled to either the import of one proton or the export of one (export of shown in the figure and we will assume exchange below), and an exchanger (see Figure 12-31). The 30,000-Da exchanger makes up 10–15 percent of the protein in the inner mitochondrial membrane, so it is one of the more abundant mitochondrial proteins. Both of these transporters are members of the SLC25 family of mitochondrial inner membrane transporters. The SLC25 transporters each have six transmembrane α-helices and use the alternating access mechanism (see Figure 11-6) to move their substrates across the inner mitochondrial membrane. The and transporters together produce an influx into the matrix of one and one and an efflux of one together with one . Each transported outward combines with a proton, translocated during electron transport to the intermembrane space, to form . Thus proton translocation via electron transport together with the relatively high matrix concentration of ATP under normal circumstances drive the overall reaction in the direction of ATP export and ADP and import. In adult humans, each ATP molecule is recycled across the inner membrane about 1300 times a day.
FIGURE 12-31 The phosphate and transport system in the inner mitochondrial membrane. The coordinated action of two transporters (purple and green ovals), which results in the uptake into the matrix of one and one in exchange for one and one hydroxyl, is powered by the outward translocation of one proton (mediated by the proteins of the electron-transport chain, blue rectangle) during electron transport. Red arrows indicate that movement of a proton and hydroxyl out of the
matrix results in export of . The outer membrane is not shown here because it is permeable to molecules smaller than 5000 Da. Description The illustration shows three transporters and an A T P synthase embedded in the inner mitochondrial membrane present between intermembrane space and matrix. An H plus concentration gradient formed across the membrane shows positive charge (membrane electric potential) toward intermembrane space and negative charge toward matrix. Translocation of H plus during electron transport is as follows: The H plus ions move from matrix to intermembrane space via first blue, rectangular transporter. The O H minus ions move from matrix to intermembrane space via second purple, oval phosphate transporter which simultaneously transports H P O 4 superscript 2 minus ions from intermembrane space to matrix. The transported H plus and O H minus ions form H 2 O. The A T P 4 minus move from matrix to intermembrane space via third green, oval A T P slash A D P exchanger which simultaneously transports A D P 3 minus from intermembrane space to matrix. Also, three H plus ions move from intermembrane space to matrix via the A T P synthase that simultaneously converts A D P 3 minus and H P O 4 superscript 2 minus into A T P 4 minus and O H minus in the matrix. Because some of the protons translocated out of the mitochondrial matrix during electron transport provide the power (by combining with the exported ) for the phosphate transport and help neutralize the extra negative charge carried into the matrix on ATP relative to ADP, fewer protons are available for ATP synthesis. It is estimated that for every four protons translocated across the inner membrane during electron transport, about three are used to synthesize one ATP molecule and one is used to power the export of ATP from the mitochondrion in exchange for ADP and . This expenditure of energy from the proton concentration gradient to export ATP from the mitochondrion in exchange for ADP and ensures a
The Rate of Mitochondrial Oxidation Normally Depends on ADP Levels
high ratio of ATP to ADP in the cytosol, where hydrolysis of the highenergy phosphoanhydride bond of ATP is used to power many energyrequiring reactions. Studies of what turned out to be exchanger activity were first recorded about 2000 years ago, when Dioscorides (~AD 40–90) described the effects of a poisonous herb from the thistle Atractylis gummifera. The same agent is found in the traditional Zulu multipurpose herbal remedy impila (Callilepis laureola), although this herb has caused numerous poisonings. The active agent, atractyloside, inhibits the transporter and thus inhibits oxidative phosphorylation of extramitochondrial ADP, but not intramitochondrial (matrix) ADP. Atractyloside, which shows the importance of the transporter, continues to be used to study the mechanism by which this transporter functions. Dioscorides lived near Tarsus, at the time a province of Rome in southeastern Asia Minor, in what is now Turkey. His five-volume De Materia Medica (The Materials of Medicine) “on the preparation, properties, and testing of drugs” described the medicinal properties of about 1000 natural products. For about 1600 years, it was the basic reference in medicine for using drugs from northern Europe to the Indian Ocean, comparable to today’s Physicians’ Desk Reference.
Mitochondria in Brown Fat Use the Proton-Motive Force to Generate Heat
The Rate of Mitochondrial Oxidation Normally Depends on ADP Levels If intact isolated mitochondria are provided with NADH (or a source of such as succinate) plus and , but not ADP, the oxidation of NADH and the reduction of rapidly cease as the amount of endogenous ADP is depleted by ATP formation. If ADP is then added, the oxidation of NADH is rapidly restored. Thus mitochondria can oxidize and NADH only as long as there is a source of ADP and to generate ATP. This phenomenon, termed respiratory control, occurs because oxidation of NADH and succinate is obligatorily coupled to proton transport across the inner mitochondrial membrane. If the resulting proton-motive force is not dissipated during the synthesis of ATP from ADP and (or during other energy-requiring processes), both the transmembrane proton concentration gradient and the membrane electric potential will increase to very high levels. At this point, pumping of additional protons from the matrix across the inner membrane requires so much energy that it eventually ceases, blocking the coupled oxidation of NADH and other substrates. Mitochondria in Brown Fat Use the Proton-Motive Force to Generate Heat
Brown-fat tissue, whose color is due to the presence of abundant mitochondria, is specialized for the generation of heat. In contrast, whitefat tissue is specialized for the storage of fat and contains relatively few mitochondria. The inner membranes of brown-fat mitochondria contain a protein called uncoupling protein 1 (UCP1), a protein that functions as an uncoupler of oxidative phosphorylation and ATP generation. UCP1 is one of several uncoupling proteins (UCPs) found in most eukaryotes (but not in fermentative yeasts). As with the exchanger and the phosphate transporter, UCPs are members of the SLC25 family of transporters. UCP1, which requires a bound fatty acid molecule as a cofactor, functions as an intermembrane space-to-matrix proton transporter. Fatty-acidcontaining UCP1 dissipates the proton-motive force by rendering the inner mitochondrial membrane permeable to protons. As a consequence, the energy released by NADH oxidation in the electron-transport chain and used to transport protons out of the matrix is not available to be used to synthesize ATP via ATP synthase. Instead, when protons move back into the matrix down their concentration gradient via UCP1, the energy is released as heat. UCP1 is a proton transporter, not a proton channel, and shuttles protons across the membrane at a rate that is 1-million-fold slower than that of typical ion channels (see Figure 11-3). Certain smallmolecule poisons also function as uncouplers by rendering the inner mitochondrial membrane permeable to protons. One example is the lipidsoluble chemical 2,4-dinitrophenol (DNP), which can reversibly bind to and release protons and shuttle them across the inner membrane from the intermembrane space into the matrix. Remarkably, when a fatty acid binds
to the exchanger, this transporter can also transport protons from the matrix to the intermembrane space and thus, just like UCP1, uncouple oxidative phosphorylation that generates a proton-motive force and ATP synthesis. Environmental conditions regulate the amount of UCP1 in brown-fat mitochondria. For instance, when rats adapt to cold temperatures, the ability of their tissues to generate heat is increased by the induction of UCP1 synthesis. In cold-adapted animals, UCP1 may constitute up to 15 percent of the total protein in the inner membranes of brown-fat mitochondria. In the newborn human, UCP1 expression by brown-fat mitochondria is vital to survival, as it is in hibernating mammals. In adult humans there is usually little brown fat, which is located in the neck, clavicle, and other sites. The amounts of human brown fat are significantly increased upon exposure to cold. In fur seals and other animals naturally acclimated to the cold, muscle-cell mitochondria contain UCP1; as a result, much of the proton-motive force is used for generating heat, thereby maintaining body temperature. Detailed analyses of the biochemical properties and developmental origins of thermogenic fat cells have uncovered the existence of at least two subtypes of such cells: classic brown-fat cells that develop from precursor cells also used to generate skeletal muscle cells, and beige-fat cells whose detailed properties (gene expression pattern, responses to hormonal signals) differ from those of brown-fat cells and are formed from white-fat cells or their progenitors. Thus there are three types of fat: brown, white, and beige. Further characterization of beige-fat cells
and their influence on normal metabolism and disease may lead to new approaches to treat or prevent some metabolic disorders. KEY CONCEPTS OF SECTION 12.7 Harnessing the Proton-Motive Force to Synthesize ATP The chemiosmotic hypothesis, proposed by Peter Mitchell, states that a proton-motive force across the inner mitochondrial membrane is the immediate source of energy for ATP synthesis. Bacteria, mitochondria, and chloroplasts all use the same chemiosmotic mechanism and a similar ATP synthase to generate ATP (see Figure 12-26). ATP synthase (also called the complex) catalyzes ATP synthesis as protons flow through the inner mitochondrial membrane (the plasma membrane in bacteria) down their electrochemical proton gradient. contains a ring of 8–14 c subunits, depending on the organism, that is rigidly linked to the rod-shaped γ subunit and the ε subunit of . These subunits rotate during ATP synthesis. Resting atop the γ subunit is the hexameric knob of , which protrudes into the mitochondrial matrix (cytosol in bacteria). The three β subunits are the sites of ATP synthesis (see Figure 12-27 and 12-30a and b). Rotation of the asymmetic subunit, which is inserted in the center of the nonrotating hexamer, leads to sequential changes in the conformation of the nucleotide-binding sites in the three subunits (see Figure 12-28). By means of this binding-change mechanism, the β subunits bind ADP and , condense them to form ATP, and then release the ATP. Three ATPs are made for each revolution of the rigid complex of the c ring and and ε subunits. Movement of protons across the membrane via two half-channels at the interface of the a subunit and the c ring powers rotation of the c ring with its attached and γ subunits. The complex bends the inner mitochondrial membrane, contributing to its characteristic high curvature and to the tubular and pancake-like structures of the cristae (see Figure 12-30c, d, and e). The proton-motive force also powers the uptake of and ADP from the cytosol in exchange for mitochondrial ATP and , thus reducing the energy available for ATP synthesis. The antiporter that participates in this exchange is one of the most abundant proteins in the inner mitochondrial membrane (see Figure 1231).
Continued mitochondrial oxidation of NADH and reduction of are dependent on sufficient ADP being present in the matrix. This phenomenon, termed respiratory control, is an important mechanism for coordinating oxidation and ATP synthesis in mitochondria. In brown fat, the inner mitochondrial membrane contains the uncoupler protein UCP1, a proton transporter that dissipates the proton-motive force into heat. Certain chemicals also function as uncouplers (e.g., DNP) and have the same effect, uncoupling oxidative phosphorylation from electron transport. There are two distinct types of thermogenic fat cells: brown-fat and beige-fat cells.
12.8 Chloroplasts and Photosynthesis
12.8 Chloroplasts and Photosynthesis We now shift our attention to photosynthesis, the second key process for synthesizing ATP. In plants, photosynthesis occurs in chloroplasts, large organelles found mainly in leaf cells. During photosynthesis, chloroplasts capture the energy of sunlight, convert it into chemical energy in the form of ATP and NADPH, and then use this energy to synthesize complex carbohydrates out of carbon dioxide and water. It is estimated that annually photosynthesis on earth results in the conversion of g of carbon from into organic molecules. In cyanobacteria, algae, and plants photosynthesis also generates molecular oxygen from water. The principal carbohydrates produced are polymers of hexose (six-carbon) sugars: sucrose, a glucose-fructose disaccharide (see Figure 2-19), and starch, a mixture of two types of large, insoluble glucose polymers called amylose and amylopectin. Starch is the primary storage carbohydrate in plants (Figure 12-32). Starch is synthesized and stored in the chloroplast. Sucrose is synthesized in the leaf cytosol from three-carbon precursors generated in the chloroplast; it is transported to non-photosynthetic (nongreen) plant tissues (e.g., roots and seeds), which metabolize it for energy by the pathways described in the previous sections.
Thylakoid Membranes in Chloroplasts Are the Sites of Photosynthesis in Plants
FIGURE 12-32 Structure of starch. The large glucose polymer and the disaccharide sucrose (see Figure 12-15) are the principal end products of photosynthesis. Both are built of six-carbon sugars (hexoses). Thylakoid Membranes in Chloroplasts Are the Sites of Photosynthesis in Plants Chloroplasts are lens-shaped organelles with a diameter of approximately and a width of approximately (Figure 12-33 and 1-20). They contain different proteins, 95 percent of which are encoded in the nucleus, made in the cytosol, imported into the organelle, and then transported to their appropriate membrane or space (see Chapter 13). Chloroplasts are bounded by two membranes, which do not contain
chlorophyll and do not participate directly in the generation of ATP and NADPH driven by light (Figures 12-33 and 12-34). Like that of mitochondria, the outer membrane of chloroplasts contains porins and thus is permeable to metabolites of small molecular weight. The inner membrane forms a permeability barrier that contains transport proteins for regulating the movement of metabolites into and out of the organelle. Unlike mitochondria, chloroplasts contain a third membrane — the thylakoid membrane — on which the light-driven generation of ATP and NADPH occurs. The chloroplast thylakoid membrane is believed to constitute a single sheet that forms numerous small, interconnected flattened structures, the thylakoids, which are commonly arranged in stacks termed grana (see Figure 12-33). The spaces within all the thylakoids constitute a single continuous compartment, the thylakoid lumen (see Figure 12-34). The thylakoid membrane contains a number of integral membrane proteins; bound to these are several important prosthetic groups and light-absorbing pigments, most notably chlorophylls. Starch synthesis and storage occurs in the stroma, the aqueous compartment between the thylakoid membrane and the inner membrane. In photosynthetic bacteria, extensive invaginations of the plasma membrane form a set of internal membranes, also termed thylakoid membranes, where photosynthesis occurs.
Chloroplasts Contain Large DNAs Often Encoding More Than a Hundred Proteins
FIGURE 12-33 Structure of leaf and chloroplast. Like mitochondria, plant chloroplasts are bounded by two membranes separated by an intermembrane space. Photosynthesis occurs on a third membrane, the thylakoid membrane, which is surrounded by the inner membrane and which forms a series of flattened vesicles (thylakoids) that enclose a luminal space. The green color of plants is due to the color of chlorophyll and carotenoids, all of which is located within the thylakoid membrane. A granum is a stack of adjacent thylakoids. The stroma is the space between the inner membrane and the thylakoids. [From Katherine Esau, D-120, Special Collections, University of California Library, Davis.] Description The series starts with a cross-section illustration of a leaf. From top to bottom the layers are as follows: cuticle, upper epidermis, mesophyll, lower epidermis, and cuticle. Several chloroplast cells are present in the middle mesophyll layer. Next, the illustration shows a cross-section of a spherical chloroplast surrounded by an outer and inner membrane with intermembrane space in between. The outer membrane is permeable to small molecules. The inner membrane has transporters for phosphate and sucrose precursors. The chloroplast is filled with stroma which contains enzymes that catalyze C O 2 fixation and starch synthesis. Several stacks of interconnected thylakoids are present inside chloroplast surrounded by thylakoid membrane that absorbs light by chlorophyll, synthesis A T P 4 minus, N A D P H, and electron transport. Next, a micrograph shows a stack of thylakoid labeled granum and each thylakoid surrounded by thylakoid membrane. Chloroplasts Contain Large DNAs Often Encoding More Than a Hundred Proteins Like mitochondria, chloroplasts are thought to have evolved from an ancestral endosymbiotic photosynthetic bacterium (see Figure 12-7).
However, the endosymbiotic event that gave rise to chloroplasts occurred more recently (1.2 billion–1.5 billion years ago) than the event that led to the evolution of mitochondria (1.5 billion–2.2 billion years ago) (see
Figure 1-1). Consequently, contemporary chloroplast DNAs show less sequence diversity than do mtDNAs. As with mtDNA, chloroplast DNA is inherited through the female parent (egg). In higher plants, chloroplast DNA molecules are 120–160 kb long, depending on the species. Plant chloroplast DNAs are long head-to-tail linear concatemers plus recombination intermediates between these long linear molecules. They contain 120–135 genes, 130 in the important model plant Arabidopsis thaliana (see Figure 1-23). A. thaliana chloroplast DNA encodes 76 protein-coding genes and 54 genes with RNA products such as rRNAs and tRNAs. Chloroplast DNAs encode the subunits of a bacterialike RNA polymerase, and they express many of their genes from polycistronic operons, in which multiple proteins are translated from a single messenger RNA, as in bacteria. Some chloroplast genes contain introns, but these introns are similar to the specialized introns found in some bacterial genes and in mitochondrial genes from fungi and protozoans, rather than the introns of nuclear genes. Many genes essential for chloroplast function have been transferred to the nuclear genome of plants over evolutionary time. Chloroplast proteins that are encoded by nuclear genes are synthesized on cytosolic ribosomes and then incorporated into the organelle (see Chapter 13). Recent estimates from sequence analysis of the A. thaliana and cyanobacterial genomes indicate that somewhat less than 4500 genes have been transferred from the original endosymbiont to the nuclear genome.
Light Absorption by Photosystems in Chloroplasts Provides the Energy That Drives the Synthesis of NADPH and ATP and the Generation of O2 from H2O
Chloroplast DNA can be genetically manipulated by a process similar to that used for the transformation of yeast cells (see Chapter 6) or by techniques such as to engineer plants that are resistant to bacterial and fungal infections, drought, and herbicides as well as engineered so that they can be used to make human pharmaceutical drugs (called pharming). The first such pharming drug, approved in the United States for use in adults in 2012 and children in 2014, is an enzyme to treat Gaucher’s disease, a genetic disorder. This approach might also be used for the engineering of food crops containing high levels of all the amino acids essential to humans. Light Absorption by Photosystems in Chloroplasts Provides the Energy That Drives the Synthesis of NADPH and ATP and the Generation of from In the 1950s, biophysicist Robert Emerson and colleagues discovered that the rate of plant photosynthesis generated by light of wavelength 700 nm could be greatly enhanced by adding light of shorter wavelengths (higher energy). They found that a combination of light at, say, 600 and 700 nm supports a rate of photosynthesis higher than the sum of the rates for the two separate wavelengths. This so-called Emerson effect led researchers to conclude that photosynthesis in plants, as well as in eukaryotic singlecelled algae and in several photosynthetic bacteria (e.g., the cyanobacteria
and prochlorophytes), involves the interaction of two separate multiprotein complexes called photosystems, each of which absorbs light at defined wavelengths. Photosystems are found in all photosynthetic organisms, both eukaryotic and prokaryotic. We will focus on the two photosystems found in plants, photosystem I (PSI) that is primarily in unstacked regions of the thylakoid membranes and photosystem II (PSII) that is primarily in regions of stacked thylakoids (grana, see Figure 1233).
Figure 12-34 shows an overview of the four stages of photosynthesis in plants. PSI (Figure 12-34, stage 2) is driven by light of 700 nm or less; PSII (Figure 12-34, stage 1), only by shorter wavelength light . In stage 1 in cyanobacteria, algae, and plants PSII absorbs light, generates high energy electrons, and transfers those electrons to a quinone electron carrier, similar in structure to Coenzyme Q, called . PSII also forms from In stage 2, the energy from the electrons in drives a proton pump in the multiprotein cytochrome bf complex that generates a proton-motive force across the thylakoid membrane, which, as in mitochondria, is subsequently used for ATP production (stage 3). The energy-depleted electrons in the cytochrome bf complex are transferred by a small protein carrier called plastocyanin to PSI which uses light to reenergize the electrons that are then used by PSI to reduce to NADPH. The ATP and NADPH are used in stage 4 to incorporate carbon from into small molecules (commonly referred to as carbon fixation) and then into six carbon sugars and starch.
FIGURE 12-34 Overview of the four stages of photosynthesis. In stage 1, light is absorbed by light-harvesting complexes (LHCs) and the reaction center of photosystem II (PSII). LHCs (yellow) transfer the absorbed energy to PSII’s reaction center (black arrow), which use it or the energy absorbed directly from photons to (i) generate high-energy electrons (electron paths shown by blue arrows) and (ii) oxidize water to molecular oxygen via PSII’s oxygen-evolving complex. In PSII, oxygen is formed on the lumenal side of the membrane, and the high-energy electrons are transferred to a quinone molecule, Q, bound near the stromal (cytosolic) face of the thylakoid membrane. The Q then combines with two protons to generate the lipid-soluble reduced quinone that is released within the thylakoid membrane for diffusion to the cytochrome bf complex (Cyto bf) in stage 2. The oxygen-evolving complex of PSII contains a manganese (Mn, violet), calcium (green), and oxygen (red) cluster ( , represented by the ball-and-stick model) that directly mediates the oxidation of water, as well as a bound ion (teal) that influences the reaction rate.
In stage 2, from stage 1 binds to a site near the lumenal surface on the cytochrome bf complex (Cyto bf), a proton pump. The energy stored in is released by a Q cycle similar to that in mitochondrial complex III (see Figure 12-21). This energy drives protons from and from the stroma across the thylakoid membrane to generate a protonmotive force. Then the two energy-depleted electrons originally from are transferred from Cyto bf, via a water-soluble protein called plastocyanin, to photosystem I (PSI). After additional energy is transferred to those electrons by absorption of light in PSI and its associated LHC, they move to ferredoxin (FN) and then to ferredoxinreductase (FNR), which uses their energy to reduce NAD and form the high-energy electron carrier NADPH. In stage 3, as in mitochondria, flow of protons down their concentration and voltage gradient through the ATP synthase drives ATP synthesis. The chloroplast ATP synthase generates one ATP for every 4–5 protons that pass through it. Stages 1–3 in plants take place in the thylakoid membrane of the chloroplast. In stage 4, in the chloroplast stroma, the energy stored in NADPH and ATP is used to incorporate into the three-carbon molecule glyceraldehyde 3-phosphate, the first step in a process known as carbon fixation. These molecules are then transported to the cytosol of the cell for conversion to hexose sugars in the form of sucrose. Glyceraldehyde 3-phosphate is also used to make starch within the chloroplast. Inset: Three-dimensional reconstruction from cryoelectron tomography of a chloroplast in the unicellular green alga Chlamydomonas reinhardtii, showing thylakoid membranes (dark green), thylakoid lumen (light green), inner and outer membranes (blue), and one small starch granule (tan). [Inset from Engel, B. D., et al., “Native Architecture of the Chlamydomonas Chloroplast Revealed by in Situ Cryo-Electron Tomography,” eLIFE, 2015;4: e04889] Description The four stages of photosynthesis and their locations in chloroplast membranes are as follows. Stages 1 to 3 of light reaction occur in the thylakoid membrane. In stage 1, light absorption generates high energy electrons and water is split to form oxygen. In stage 2, electron transport occurs, and a proton-motive force is generated by proton pumps. In stage 3, A T P is synthesized in the stroma by an A T P synthase. Stage 4 of dark reaction occurs in the stroma of chloroplast and involves carbon¬fixation and carbohydrate synthesis. 6 C O 2 yield 2 glyceraldehyde 3-phosphate during carbon ¬fixation and sucrose is transported to the cytosol. Starch synthesis occurs in the stroma.
Three of the Four Stages in Photosynthesis Occur on the Thylakoid Membrane and Only During Illumination
A three-dimensional model of a chloroplast shows an outer and inner membrane separating inner stroma from outer cytosol. The stroma contains few stacks of thylakoid having thylakoid lumen enclosed in thylakoid membranes. A starch granule in present in the stroma, attached to the thylakoid membrane. The overall reaction of oxygen-generating photosynthesis in plants, is the reverse of the overall reaction by which carbohydrates are oxidized to and . In effect, photosynthesis in chloroplasts produces energy-rich sugars that are broken down and harvested for energy by mitochondria using oxidative phosphorylation. Photosynthesis in green and purple bacteria employs a PSI-like system, but not PSII, and does not generate oxygen. In this section, we provide an overview of the stages in oxygen-generating photosynthesis and introduce the main molecular components of the process, including the chlorophylls, the principal light-absorbing pigments. Three of the Four Stages in Photosynthesis Occur on the Thylakoid Membrane and Only During Illumination
Stages 1 and 2 of Photosynthesis Convert Sunlight into High Energy Electrons That Generate a Proton-Motive Force and NADPH
Each of the four stages of photosynthesis is localized to a defined area of the chloroplast. All the reactions in stages 1–3 are catalyzed by multiprotein complexes embedded in the thylakoid membrane. The generation of a proton-motive force and the use of that proton-motive force to synthesize ATP resemble stages III and IV of mitochondrial oxidative phosphorylation. The enzymes of carbon fixation that incorporate into chemical intermediates and then convert them to starch are soluble constituents of the chloroplast stroma; the enzymes that form sucrose from three-carbon intermediates are in the cytosol. All four stages of photosynthesis are tightly coupled and controlled so as to produce the amount of carbohydrate required by the plant and to respond appropriately to environmental conditions. The reactions that generate the ATP and NADPH used in carbon fixation are directly dependent on light energy; thus stages 1–3 are called the light reactions of photosynthesis. The reactions in stage 4 are indirectly dependent on light energy; they are sometimes called the dark reactions of photosynthesis because they can occur in the dark, using the supplies of ATP and NADPH generated by light energy (see Figure 12-34). However, the reactions in stage 4 are not confined to the dark; in fact, they occur primarily during illumination. Stages 1 and 2 of Photosynthesis Convert Sunlight into High Energy
Electrons That Generate a ProtonMotive Force and NADPH The absorption of light energy and its conversion into chemical energy in plants occurs in photosystem II (PSII in stage 1 and photosystem I (PSI) in stage 2 (Figure 12-34). Photosystems — sometimes referred to as core photosystems — consist of two closely linked components: a reaction center, where the primary events of photosynthesis — light absorption and generation of high-energy electrons — occur; and core antenna complexes. Each photosystem is also associated with external antenna complexes termed light-harvesting complexes (LHCs), made up of specialized proteins that capture light energy and efficiently transmit it to the reaction center to generate high-energy electrons (see Figure 12-34). The proteins of the reaction centers and the antenna complexes contain tightly bound light-absorbing pigment molecules. Chlorophyll a, the principal pigment involved in photosynthesis, is present in both reaction centers and antenna complexes. The initial step in photosynthesis is the absorption of light by chlorophyll a and other pigments. Like the heme component of cytochromes, chlorophylls consist of a porphyrin ring attached to a long hydrocarbon side chain (Figure 12-35). In contrast to the hemes (see Figure 12-17), chlorophylls contain a central ion (rather than ) and have an additional five-member ring.
FIGURE 12-35 Structure of chlorophyll a, the principal pigment that traps light energy. Electrons are delocalized among three of chlorophyll a’s four central rings (yellow) and the atoms that interconnect them. In chlorophyll, a ion, rather than the ion found in heme, sits at the center of the porphyrin ring, and an additional five-member ring (blue) is present; otherwise, the structure of chlorophyll is similar to that of heme, found in molecules such as hemoglobin and cytochromes (see Figure 12-17a). The hydrocarbon phytol “tail” facilitates the binding of chlorophyll to hydrophobic regions of chlorophyllbinding proteins. The group (green) is replaced by a formaldehyde (CHO) group in chlorophyll b.
The antenna complexes contain both chlorophyll a and other lightabsorbing pigments, including other forms of chlorophyll (e.g., chlorophyll b in vascular plants) and carotenoids in both plants, algae, and photosynthetic bacteria. Carotenoids, of which there are several different molecular types, consist of long branched hydrocarbon chains with alternating single and double bonds; they are similar in structure to the visual pigment retinal (see Figure 15-34b), which absorbs light in the eye. The presence of various antenna pigments, which absorb light at different wavelengths, greatly extends the range of light that can be absorbed and used for photosynthesis. One of the strongest pieces of evidence for the involvement of chlorophylls and carotenoids in photosynthesis is that the absorption spectrum of these pigments is similar to the action spectrum of photosynthesis (Figure 12-36). The latter is a measure of the relative ability of light of different wavelengths to support photosynthesis.
EXPERIMENTAL FIGURE 12-36 The rate of photosynthesis is greatest at the wavelengths of light absorbed by three plant pigments. The action spectrum of photosynthesis in plants (the relative ability of light of different wavelengths to support photosynthesis) is shown in black. The energy from light can be converted into ATP only if it can be absorbed by pigments in the chloroplast. Absorption spectra (showing how well light of different wavelengths is absorbed) for three photosynthetic pigments (chlorophyll a, chlorophyll b, and β-carotene) present in the antennas of plant photosystems are shown in color. This figure shows as a function of the wavelength of light in nanometers (horizontal axis) a comparison of the action spectrum of photosynthesis (right vertical axis) with the individual absorption spectra of these pigments (left vertical axis). The data suggest that photosynthesis at 680 nm is primarily due to light absorbed by chlorophyll a; at 650 nm, to light absorbed by chlorophyll b; and at shorter wavelengths, to light absorbed by chlorophylls a and b and by carotenoid pigments, including β-carotene.
Description The horizontal axis represents wavelength (in nanometers) and ranges from 400 to 700, in increments of 100. The left vertical axis represents absorption of light and ranges from 0 to 100, in increments of 20. The right vertical axis represents relative rate of photosynthesis and is divided into 5 equal sections. The curve for chlorophyll a starts from (400, 30), peaks to (430, 68), drops down to (500, 0), slightly increases to (650, 5), peaks at (680, 50), and drops down to end at (710, 0). The curve for chlorophyll b starts from (400, 0), peaks to (490, 85), drops down to (530, 0), slightly increases to (620, 5), peaks at (650, 25), and drops down to end at (680, 0). The curve for betacarotene starts from (400, 25), peaks to (460, 60), drops down to (480, 45), again peaks at (500, 59), and drops down to end at (540, 0). The curve for action spectrum of photosynthesis starts from (400, 85), slightly peaks to (430, 140), drops down to (550, 30), peaks to (650, 84) and slightly dips to peak again at (680, 100), and drops down to end at (710, 0). All values are approximate. A dashed vertical line joins chlorophyll b peak (650, 25) to action spectrum of photosynthesis peak (650, 84) and another dashed vertical line joins chlorophyll a peak (680, 50) to action spectrum of photosynthesis peak (680, 100). Quantum mechanics established that light, a form of electromagnetic radiation, has properties of both waves and particles. When light interacts with matter, it behaves as discrete packets of energy (quanta) called photons. The energy of a photon is proportional to the frequency of the light wave and thus inversely proportional to its wavelength. Thus photons of shorter wavelengths have higher energies. The energy of visible light is considerable. Light with a wavelength of , typical of sunlight, has about 52 kcal of energy per mole of photons. This is enough energy to synthesize several moles of ATP from ADP and if all the energy were used for this purpose. However, in general in the electrontransport chain shown in stages 1–3 in Figure 12-34, the energy carried in 14 electrons derived from absorption of 28 photons (14 via photosystem II
Core Antenna Complexes and Light-Harvesting Complexes Increase the Efficiency of Photosynthesis
and 14 via photosystem I) is used to generate about 9 molecules of ATP and convert about 7 molecules of to NADPH. When chlorophyll a (or any other molecule) absorbs visible light, the absorbed light energy raises electrons in the chlorophyll a to a higher energy (excited) state. This state differs from the ground (unexcited) state largely in the distribution of the electrons around the C and N atoms of the porphyrin ring. Excited states are unstable, and the electrons return to the ground state by one of several competing processes. For chlorophyll a molecules dissolved in organic solvents such as ethanol, the principal processes that dissipate the excited-state energy are: (1) the emission of light (fluorescence and phosphorescence), (2) a process called intersystem crossing that leads to the transfer of energy to reactive oxygen species, and (3) thermal emission (heat). However, when the same chlorophyll a is bound in the unique protein environment of the reaction center, dissipation of excited-state energy occurs by a different process: the release of a high energy electron. As detailed in the next section, this is the key to photosynthesis. Core Antenna Complexes and LightHarvesting Complexes Increase the Efficiency of Photosynthesis Two chlorophyll a molecules of the six chlorophylls within the reaction center are capable of directly absorbing light and initiating photosynthesis by a mechanism we will discuss shortly. In photosynthetic bacteria, the
two bacteriochlorophylls that initiate photosynthesis are called the special-pair bacteriochlorophylls. Plants also have special-pair chlorophylls whose relative positions in the reaction center are similar to those in bacteria. Although in plants the specific pair of reaction-center chlorophylls responsible for initiating photosynthesis is not clear, for simplicity we will refer to the initiating chlorophylls in both plants and bacteria as the special-pair chlorophylls. While the special-pair chlorophylls can directly absorb light to initiate photosynthesis, they are most commonly energized indirectly by energy transferred to them from other light-absorbing and energy-transferring pigments. These other pigments, which include many other chlorophylls, absorb photons and pass the energy to the special-pair chlorophylls (Figure 12-37). Some of these pigments are bound to protein subunits that are considered to be intrinsic components of the core photosystem, which is made up of several distinct protein chains. These pigment-containing proteins are called core antenna complexes. Other pigments are incorporated into protein complexes that bind to, but are distinct from, the core photosystems and are called light-harvesting complexes (LHCs). The topological relationships of the reaction centers, core antennas and LHCs in the dimeric PSII-LHC supercomplex from the garden pea are illustrated in Figure 12-27d and e. Even at the maximum light intensity encountered by photosynthetic organisms (tropical noontime sunlight), each reactioncenter chlorophyll a molecule directly absorbs only about one photon per second, which is not enough to support photosynthesis sufficient for the needs of the plant. The involvement of core antenna complexes and LHCs greatly increases the efficiency of photosynthesis, especially at more
typical light intensities, by increasing absorption of 680-nm light and by extending the range of wavelengths of light that can be absorbed using other antenna pigments. For example, there are approximately 150 antenna chlorophyll molecules for each reaction center in plant PSII.
FIGURE 12-37 Light-harvesting complexes and photosystems in cyanobacteria and plants. (a) Diagram of the membrane of a cyanobacterium, in which each multiprotein lightharvesting complex (LHC, light yellow) contains 90 chlorophyll molecules (gray) and 31 other small molecules, all held in a specific geometric arrangement for optimal light absorption and energy transfer. Of the six chlorophyll molecules in the reaction center (dark and light green), two constitute the special-pair chlorophylls that initiate photoelectron transport (light blue arrow) when excited. The portions of the two reaction center quinone molecules are orange. Resonance energy transfer (pink arrows) rapidly funnels energy from absorbed light (wavy red arrows) to one of two “bridging” chlorophylls (blue) and thence to
the special-pair chlorophylls (dark green) in the reaction center. (b) Three-dimensional organization of photosystem I (PSI) and its associated LHCs from Pisum sativum (garden pea), as determined by x-ray crystallography, seen from the plane of the membrane. Only the LHC chlorophylls (white with gray outlines) and the reaction-center electron carriers (same colors as in panel a) are shown. For simplicity, the special-pair chlorophylls are shown to initiate photoelectron transport (light blue arrow), although in plants the specific pair of chlorophylls responsible is not clear. (c) Expanded view of the reaction center from (b), rotated 90° about a vertical axis. (d and e) Three-dimensional organization of the dimeric supercomplex of photosystem II (PSII) and its associated LHCs from Pisum sativum (garden pea), as determined by cryo-electron microscopy, seen from the plane of the membrane (panel d) or rotated 90° and viewed from the stroma (panel e). The 28 polypeptide chains in each monomeric supercomplex are colored based on their functions and locations: reaction center proteins D1 and D2 (pale green), internal antenna complexes - Core ant 47 and Core ant 43 - (lime green), and various LHC antenna proteins (light yellow). In addition to the reaction center and internal antennas, the PSII core contains 12 small proteins (dark green) and the oxygen-evolving complex on the luminal surface (shades of green, panel d). The 157 chlorophylls, 2 pheophytins (chlorophylls without the central magnesium), 44 carotenoids and other attached small molecules are white and gray. Two of the six electron-transporting cholorphylls present in the reaction center of PSI (panel a) are replaced in PSII by two pheophytins (not shown). The dimeric supercomplex comprises almost 100,000 atoms of which 73 percent compose the proteins. In panel e, the upper and lower monomers in the dimeric supercomplexe are separated by a black dotted line. The core PSII complex (reaction center, internal antennas and small associated proteins) is outlined in the upper monomer by a curved dashed line. In the lower monomer individual proteins are labeled: Reaction center D1/D2; core antenna complexes Core ant47 and Core ant43; and external antenna complexes, including the trimeric LHCII complexes tLHCII-m and tLHCII-s and the monomeric antenna complexes mLHC-24, mLHC-26 and mLHC-29. See W. Kühlbrandt, 2001, Nature 411:896, and P. Jordan et al., 2001, Nature 411:909. [Parts (b) and (c) Data from A. Ben-Sham et al., 2003, Nature 426:630, PDB ID 1qvz; and Y. Mazor, A. Borovikova, and N. Nelson, 2015, eLife 4:e07433, PDB ID 4y28; part (d) Data from: X. Su et al., 2017, Science 357:815–820 and PDB ID 5XNL.] Description
The illustration (a) shows a thylakoid membrane with the stroma above the membrane and lumen below it. Two L H C with a reaction center in between are embedded in the thylakoid membrane. Light absorbed by L H Cs transfers resonance energy to bridging chlorophyll that further transfers it to special-pair chlorophylls present in the reaction center. The illustration (b) shows a similar complex as in (a) except in ribbon structures. The close-up illustration (c) of a ribbon-model shows the bridging chlorophyll of L H Cs transferring energy to special-pair chlorophylls present in the reaction center. The illustration (d) shows a model diagram of P S 2-L H C 2 dimeric supercomplex. Several rods of proteins with a meshwork of chlorophylls etcetera are embedded in the thylakoid membrane. The space-filling three-dimensional model (e) shows the P S 2-L H C 2 dimeric supercomplex. A horizontal line dissects the complex, with the top section labeled upper monomer and the bottom section labeled lower monomer. The reaction center has upper monomer unit of P S 2 core and lower monomer made of D 1 slash D 2 with core ant 47 on left and core ant 43 on right. The lower monomer of left L H C has m L H C-24, m L H C-29, and t-L H C 2-m and of right L H C has m L H C-26 and t-L H C 2-s. Photosystem core proteins and LHC proteins orient the pigment molecules in the precise orientations and positions that are optimal for light absorption and rapid energy transfer, called resonance energy transfer, to one of the special-pair chlorophyll a molecules in the associated reaction center. Resonance energy transfer does not involve the transfer of an electron. Studies on one of the two photosystems in cyanobacteria, which are similar to those in multicellular, seed-bearing plants, suggest that energy from absorbed light is funneled first to a “bridging” chlorophyll in each LHC and then to the special-pair chlorophylls in the reaction center (see Figure 12-37a). Strikingly, the molecular structures of LHCs from plants and cyanobacteria are completely different from those from green and purple bacteria, even though both types contain carotenoids and chlorophylls. Figure 12-37b
Multiple Mechanisms Protect Cells Against Damage from Reactive Oxygen Species During Photoelectron Transport
shows the distribution of the chlorophyll pigments in photosystem I from Pisum sativum (garden pea) together with those from peripheral LHC antennas. The large number of core and LHC antenna chlorophylls that surround the reaction center permit efficient transfer of absorbed light energy to the special-pair chlorophylls in the reaction center. Each chloroplast reaction center is associated with multiple internal antennas and light-harvesting complexes; the LHCs associated with PSII (e.g., LHCII) and with PSI (e.g., LHCI) contain different proteins. Cryoelectron microscopy has been used to determine the structure of a dimeric supercomplex of photosystem II and LHCII from the garden pea (Figure 12-37d and e). The structure reveals the relative positions of the proteins in its reaction center (pale green), internal antenna complexes (lime green), LHC antennas (light yellow) and other PSII core proteins (dark green), viewed both in the plane of the membrane (panel d) and from the stroma (panel e). Depending on light conditions, LHCIIs can dissociate from PSII and bind to PSI. Although LHC antenna chlorophylls can transfer light energy absorbed from a photon, they cannot release an electron. As we’ve seen already, this function resides in the reaction-center chlorophylls. Multiple Mechanisms Protect Cells Against Damage from Reactive Oxygen Species During Photoelectron Transport
As we saw earlier in the case of mitochondria, reactive oxygen species (ROS) generated during electron transport (see Figure 12-24) can both serve as signals to regulate organelle function and cause damage to a variety of biomolecules. The same is true of chloroplasts. For example, hydrogen peroxide regulates gas-exchange pores (stomata) in plants subjected to drought stress to prevent dehydration and controls cyclic electron flow. Even though the PSI and PSII photosystems, with their associated lightharvesting complexes, are remarkably efficient at converting radiant energy to useful chemical energy in the form of ATP and NADPH — especially under low intensity light conditions — they are not perfect. Depending on the intensity of the light and the physiological conditions of the cells, a relatively small — but significant — amount of the energy absorbed by chlorophyll in the light-harvesting antennas and reaction centers results in the chlorophyll being converted to an activated state called triplet chlorophyll. In this state, the chlorophyll can transfer some of its energy to molecular oxygen , converting it from its normal, relatively unreactive ground state, called triplet oxygen , to a very highly reactive (ROS) singlet state, Some of this can be used for signaling to the nucleus to communicate the metabolic state of the chloroplast to the rest of the cell. However if the majority of the is not quickly quenched (inactivated), it will react with, and usually damage, nearby molecules. This damage, called photoinhibition, can suppress the efficiency of thylakoid activity.
Chloroplasts use two major strategies for what is called nonphotochemical quenching to avoid excess-light-induced damage. The first strategy for non-photochemical quenching is the use of specialized small organic scavenger molecules that quench the and are incorporated within supercomplexes. Examples include carotenoids (polymers of unsaturated isoprene groups, including β-carotene, which gives carrots their orange color) and α-tocopherol (a form of vitamin E). The second strategy involves dissipating the initially absorbed light energy as heat before it can generate damaging . The extent of energy dissipation is regulated, depending on the light conditions. When exposed to intense light and thus the greatest risk of -induced damage, the nonphotochemical quenching is rapidly induced, and when light intensity falls, quenching is suppressed. The mechanisms underlying the second strategy include enzymatic changes in the structures of certain carotenoids and rapid responses to PSII-dependent increases in the proton concentration in the thylakoid lumen. KEY CONCEPTS OF SECTION 12.8 Chloroplasts and Photosynthesis Chloroplasts capture the energy of sunlight, convert it into chemical energy in the form of ATP and NADPH, and then use this energy to make complex carbohydrates out of carbon dioxide and water. The principal end products of photosynthesis in plants are molecular oxygen and polymers of six-carbon sugars (starch and sucrose). In chloroplasts, the light-capturing and ATP- and NADPH- generating reactions of photosynthesis occur in the thylakoid membrane. The permeable outer membrane and the inner membrane surrounding the thylakoid membrane in chloroplasts do not participate directly in photosynthesis (see Figures 12-33 and 12-34).
Like mitochondria, chloroplasts contain their own DNA and are thought to have evolved from an ancestral endosymbiotic photosynthetic bacterium. Plants contain two light-absorbing photosystems, PSI and PSII, which have different functions and are physically separated in the thylakoid membrane. PSII generates high-energy electrons that convert the quinone Q to and convert into , and PSI reduces to NADPH. Cyanobacteria have two analogous photosystems. There are four stages in photosynthesis: (1) absorption of light, generation of highenergy electrons, and formation of from ; (2) electron transport leading to generation of a proton-motive force, absorption of light to reenergize electrons, and reduction of to NADPH; (3) synthesis of ATP; and (4) conversion of into carbohydrates (carbon fixation). The overall reaction of oxygen-generating photosynthesis in plants is (see Figure 12-34). In photosystems (PSI and PSII), light energy is transferred directly or indirectly to one of two special-pair chlorophyll a molecules bound to reaction-center proteins in the thylakoid membrane. This energy is used to generate a high-energy electron that separates from a positively charged chlorophyll a by a process called photoelectron transport. The high-energy electrons drive the generation of NADPH and ATP. In photosystems, the reaction centers are bound to multiple internal antennas and external antennas that contain chlorophylls a and b, carotenoids, and other pigments that absorb light at multiple wavelengths. The external antennas are called lightharvesting complexes (LHCs). Depending on light conditions, LHCIIs can dissociate from PSII to which they often bind and bind to PSI. Energy, but not electrons, is transferred from the pigments in the internal antennas and the LHCs to the specialpair chlorophylls in the reaction center by resonance energy transfer to increase the capacity to convert light to high-energy electrons for photosynthesis (see Figure 1237). The absorption of light by pigments in the chloroplast can generate reactive oxygen species (ROS), including singlet oxygen, , and hydrogen peroxide, . In small amounts, they are used as intracellular signaling molecules; in larger amounts, they can be toxic. Chloroplasts employ multiple strategies for preventing the buildup of damaging . For example, small-molecule scavengers, such as carotenoids, and antioxidant enzymes help to protect against ROS-induced damage. Chloroplasts also use regulated non-photochemical quenching mechanisms to protect against light-induced damage.
The First Three Stages of Photosynthesis
12.9 Use of Light Energy to Generate Molecular Oxygen, NADPH, and ATP in Stages 1–3 of Photosynthesis In the previous section, we presented an overview of the four stages of photosynthesis. In this section, we will describe some of the molecular details of how in stages 1 and 2 light energy is used to generate from , generate NADPH from , and produce a proton-motive force, and how in stage 3 that proton-motive force drives the synthesis of ATP from ADP and (see Figure 12-34). The First Three Stages of Photosynthesis Stage 1: Absorption of Light Energy by PSII, Generation of High-Energy Electrons, and Formation of from Water Within the reaction center of PSII, two adjacent special-pair chlorophylls lie close to the luminal face of the thylakoid membrane (Figure 12-38). When a photon of light with a wavelength of about 680 nm is absorbed by one of these two chlorophyll a molecules in purple bacteria, the energy of
that chlorophyll a molecule increases by (the first excited state). This energized molecule rapidly donates an electron to the adjacent chlorophyll, which passes it on to a series of intermediate small-molecule acceptors bound to the PSII. These transfers are represented by the zigzag blue lines in Figure 12-34 and in Figure 12-38 (left). The electron is rapidly passed on to the primary electron acceptor, which is the oxidized form of a molecule called quinone (Q), near the stromal surface of the thylakoid membrane (Figures 12-34 and 12-38). Q is similar in structure and function to CoQ in mitochondria, in that it is a small, lipid-soluble, organic molecule that serves as an electron carrier that undergoes oxidation to Q and reduction to This light-driven electron transfer, called photoelectron transport, is very efficient and depends on the environment of both the chlorophylls and the acceptor within the reaction center. Photoelectron transport, which occurs nearly every time a photon is absorbed, leaves a positive charge on the chlorophyll a (chlorophyll ) close to the luminal surface of the thylakoid membrane (on the opposite side from the stroma) and generates a high-energy electron that moves to Q to form the negatively charged acceptor near the stromal surface.
FIGURE 12-38 Photoelectron transport in a photosystem, the primary event in photosynthesis. After absorption of a photon of light, one of the excited special-pair chlorophyll a molecules in the reaction center (left) donates, via several intermediates (not shown), an electron to a loosely bound acceptor molecule, the quinone Q, on the stromal surface of the thylakoid membrane, creating an essentially irreversible charge separation across the membrane (right). Subsequent transfers of this electron release energy that is used to generate a proton gradient and thus ATP and NADPH (see Figures 12-34). The positively charged chlorophyll generated when the light-excited electron moves to Q is eventually neutralized by the transfer to the chlorophyll of another electron. In plants, the oxidation of to provides this neutralizing electron and takes place in PSII (see
Figure 12-34). Photosystem I uses a similar photoelectron-transport pathway, but as we will see below, instead of oxidizing water, it receives an electron from a protein carrier called plastocyanin to neutralize the positive charge on chlorophyll (see Figure 12-34). Description Both illustrations show a reaction center embedded in the thylakoid membrane. In the first illustration, light enters the reaction center and is absorbed by a pair of chlorophyll a molecules lying toward the limen. This produces electrons that are absorbed by Q or primary electron accepter lying toward the stroma. The second illustration shows one
chlorophyll a molecule with positive charge labeled, strong oxidizing agent (electron acceptor); the Q with negative charge labeled, strong reducing agent (electron donor); and both collectively labeled, charge separation. Absorption of a second photon and transfer of a second electron to forms a powerful reducing agent that combines with two protons to form , the reduced form of the quinone. is a source of high-energy electrons and protons for stage 2 described below. The herbicide atrazine is one of the most commonly used weed killers in US agriculture. Atrazine binds to PSII, blocks the binding of Q, and thus blocks formation of and downstream electron transport. The positively charged special-pair reaction-center chlorophyll is the strongest biological oxidant known. In plants, the oxidizing power of four chlorophyll molecules is used by a subcomplex in PSII called the oxygen-evolving complex ( , see Figure 12-34) to remove four electrons from two molecules bound to a site on the luminal surface to form : However, absorption of each photon by PSII results in the transfer of just one electron. Thus it is necessary for a single PSII to lose an electron and then partially oxidize the oxygen-evolving complex, and then sequentially repeat this process three more times in order for its oxygen-evolving complex to extract four electrons from two water molecules and generate one molecule. These potent biological reductants and oxidants along with PSI provide all the energy needed to drive all subsequent reactions of
photosynthesis: electron and proton transport and NADPH synthesis (stage 2), ATP synthesis (stage 3), and fixation (stage 4). Chlorophyll a can absorb light at discrete wavelengths shorter (and therefore of higher energy) than 680 nm (see Figure 12-36). Such absorption raises the molecule into one of several excited states whose energies are higher than that of the first excited state described above. These higher excited states decay to the lower energy first excited state by releasing energy in (~100–200 femtoseconds, fs) as heat. Because photoelectron transport and the resulting charge separation occur only from the first excited state of the reaction-center chlorophyll a, the quantum yield — the amount of photosynthesis per absorbed photon — is the same for all wavelengths of visible light shorter than 680 nm. How closely the wavelength of light matches the absorption spectrum of the pigment determines how likely it is that the photon will be absorbed. Once absorbed, the photon’s exact wavelength is not critical, provided it is at least energetic enough (has a short enough wavelength) to push the chlorophyll a into the first excited state. In chloroplasts, the special-pair reaction-center chlorophylls that initiate photoelectron transport in PSII and in PSI differ in their light-absorption maxima (680 and 700 nm, respectively) because of differences in their protein environments. For this reason, these chlorophylls are often denoted (PSII) and (PSI). Furthermore, the two photosystems are distributed differently in thylakoid membranes: PSII primarily in regions of stacked thylakoids (grana, see Figure 12-33) and PSI primarily in unstacked regions. The stacking of thylakoid membranes may be due to
the binding properties of the proteins associated with PSII, especially light-harvesting complexes. Stage 2: Generation of a Proton-Motive Force and
Electrons move from the quinone primary electron acceptor generated in stage 1 to a proton pump, called the cytochrome bf complex, in stage 2 (Figure 12-34). The high energy electrons in provide the energy for the cytochrome bf complex to drive across the thylakoid membrane protons from as well as protons from the stroma to generate a proton-motive force, forming a pH gradient across the membrane . This process is analogous to the generation of a proton-motive force across the inner mitochondrial membrane and in bacterial membranes during electron transport (see
Figure 12-25). A small, water-soluble, copper-containing, electron carrier protein called plastocyanin transfers the now lower energy electrons from the cytochrome bf complex to a complex called photosystem I (PSI) (see
Figure 12-34). The electrons from lose considerable energy by driving proton pumping and thus have relatively low energy when they are transferred to PSI from plastocyanin. After additional energy is transferred to those electrons by absorption of light in photosystem I (PSI) by specialpair chlorophylls, they move to two protein components of PSI, first to ferredoxin (FN) and then to ferredoxinreductase (FNR), which use the energy in these electrons to drive the synthesis of the high-energy electron carrier NADPH from its oxidized form, nicotinamide adenine
dinucleotide phosphate . The structure of is identical to that of except for the presence of an additional phosphate group. Both molecules gain and lose electrons in the same way (see Figure 2-33). Thus the overall reaction of stages 1 and 2 can be summarized as Generation of a Proton-Motive Force, but No NADPH or , in Stage 2 by Cyclic Electron Flow Stage 2 generates a proton gradient (used to make ATP in stage 3) and NADPH, and the pathway of stage 2 shown in Figure 12-34 has been called the linear electron flow pathway. In some circumstances, however, especially when plants are stressed by conditions such as drought, high light intensity, or low carbon dioxide levels, cells must generate greater amounts of ATP relative to NADPH than they can produce by linear electron flow. To do this, they photosynthetically produce ATP from PSI without concomitant NADPH production. This is accomplished by a PSIdependent and PSII-independent process called cyclic photophosphorylation, or cyclic electron flow (Figure 12-39). In this process, electrons cycle among PSI, ferredoxin, plastoquinone (Q), and the cytochrome bf complex, bypassing the ferredoxinreductase at PSI that normally generates NADPH. Thus during cyclic electron flow, proton pumping permits additional ATP synthesis, but no net NADPH is generated, and there is no oxidization of to produce .
FIGURE 12-39 Cyclic electron flow in plants, which generates a proton-motive force and ATP but no oxygen or NADPH. In cyclic electron flow, light energy is used by PSI to transport electrons in a cycle to generate a proton-motive force and subsequently in stage 3 ATP, without oxidizing water or generating NADPH. High-energy electrons are transferred via the ferredoxin of PSI either to a PGR5-PGRL1 heterodimer (red, left pathway) or to the NADH dehydrogenase–like complex (blue, right pathway), where they then reduce plastoquinone (Q) to Each of these two electron acceptors forms independent supercomplexes with PSI via light-harvesting complex (LHC) subunits (yellow). (The PGR5-PGRL1 heterodimer and NADH dehydrogenase–like complex are not found together in the same supercomplex, but here are drawn together with only one PSI to emphasize the similarities of the two mechanisms of cyclic electron flow.) then transfers the electrons to the cytochrome bf complex, then to plastocyanin, and finally back to PSI, as is the case for the linear electron flow pathway (see Figure 12-34). Description The illustration shows five multiprotein complexes embedded in the membrane, from left to right as follows: Cytochrome b f complex, P S I reaction center, N A D (P) H dehydrogenase-like complex, cytochrome b f complex, and F 0 F 1 complex. The P S I reaction center is made of P G R L 1 bound to P G R 5 atop, L H C, reaction center bound to Ferredoxin F e-S and Ferredoxin-N A D P plus reductase atop, and L H C. The structures from first cytochrome b f complex to second L H C are labeled G P R 5P G R L 1 dependent and from second L H C to second cytochrome b f complex are
labeled N A D H dehydrogenase–like complex-dependent. The illustration shows transfer of electrons by plastocyanin across the complexes and each complex transport protons from above to down except F 0 F 1 complex that does in reverse. In higher plants, there are two cyclic electron flow pathways that control the ATP:NADPH ratio (see Figure 12-39). The major pathway is the PGR5-PGRL1-dependent pathway, which we shall describe shortly; this pathway ensures efficient photosynthesis and protects against stress. The minor pathway is the NADH dehydrogenase–like complex-dependent pathway, which appears to respond to stress and to be a target of - mediated regulation. The NADH dehydrogenase–like complex is a very large multiprotein complex that is very similar in shape and composition to mitochondrial complex I (see Figure 12-19), which oxidizes NADPH or NADH while reducing CoQ to . The NADH dehydrogenase–like complex, however, appears to lack the subunit necessary for NADPH oxidation. During cyclic electron flow, high-energy electrons generated by light absorption and photoelectron transport in PSI are transferred either to the PGR5-PGRL1 heterodimer or to the NADH dehydrogenase–like complex from the ferredoxin subunit of PSI. Indeed, there is evidence that each of these two electron acceptors independently associates with PSI in supercomplexes mediated by LHC subunits. Both of these electron acceptors then reduce Q to , which then delivers protons and electrons to the cytochrome bf complex via a Q cycle, as we described earlier for linear electron flow (see Figure 12-34). Protons are transported across the thylakoid membrane into the lumen by the cytochrome bf complex and
Relative Activities of Photosystems I and II Are Regulated
possibly by the NADH dehydrogenase–like complex. Finally, plastocyanin returns the electrons from the cytochrome bf complex to PSI to complete the cycle. The proton-motive force generated by cyclic electron flow drives ATP synthesis by the complex (ATP synthase) and thus increases the ATP:NADPH ratio. Stage 3: Synthesis of ATP The light-driven proton gradient generated across the thylakoid membrane in stages 1 and 2 can then be used to drive ATP synthesis (see Figure 1234). The protons move down their concentration gradient from the thylakoid lumen to the stroma through the chloroplast complex (ATP synthase), which couples proton movement to the synthesis of ATP from ADP and , as we have seen for the ATP synthases in mitochondria and bacteria (see Figures 12-27, 12-28, and 12-33). Relative Activities of Photosystems I and II Are Regulated Chloroplasts respond to changes in the wavelengths and intensities of ambient light (as a consequence of the time of day, cloudiness, etc.) by altering the relative outputs of PSI and PSII to maintain the appropriate balance of ATP and NADPH production. One mechanism underlying the regulation of the relative activities of PSI (preferentially located in the unstacked thylakoid membranes) and PSII
(preferentially located in the stacked grana) is phosphorylation and dephosphorylation of thylakoid membrane proteins, including PSII and LHCII. Changes in phosphorylation, particularly for LHCII, can alter the intra–thylakoid membrane distribution (grana vs. unstacked membranes) of this antenna complex and thus its differential interactions with PSI and PSII. The more LHCII is associated with a particular photosystem, the more efficiently that system will be activated by light, and the greater its contribution to electron flow. It appears that the efficient operation of electron-transport chains has involved the evolution of functional complexes of increasing size and complexity, from individual proteins to complexes to supercomplexes to super-supercomplexes. Regulating the supramolecular organization of the photosystems in plants has the effect of directing them toward primarily ATP production alone or toward the generation of reducing equivalents (NADPH) and ATP, depending on ambient light conditions and the metabolic needs of the plant. Both NADPH and ATP are required to convert to sucrose or starch, the fourth stage in photosynthesis, which we cover in the next section. KEY CONCEPTS OF SECTION 12.9 Use of Light Energy to Generate Molecular Oxygen, NADPH, and ATP in Stages 1–3 of Photosynthesis In stage 1 of photosynthesis (see Figure 12-34), light energy is converted by photosystem II (PSII) into high energy electrons that are transferred by photoelectron transport from the special-pair chlorophylls, via intermediates, to a quinone (Q) on the opposite side of the membrane, generating a charge separation (see Figure 12-38) and the small lipid-soluble electron transport molecule . In green plants, the positively charged chlorophyll created by photoelectron transport in PSII is regenerated to the neutral, reduced form by the oxygen-evolving complex subunit of PSII. Electrons from water are transferred by the oxygen-evolving complex
to the positively charged chlorophyll of PSII, resulting in the formation of molecular oxygen in the thylakoid lumen. In stage 2 (see Figure 12-34), high-energy electrons are transported from the reduced quinone from stage 1 to a proton pump (cytochrome bf complex) that moves across the membrane protons from both and the stroma to the thylakoid lumen, forming a pH gradient (proton-motive force) across the thylakoid membrane. The electrons depleted of energy by the cytochrome bf complex during proton pumping are transferred by the water-soluble protein plastocyanin to PSI, where they reenergize when light energy is absorbed by its special-pair chlorophylls. Photoelectron transport within PSI transfers the reenergized electrons to the ultimate electron acceptor, usually , reducing it to NADPH. The relative activities of PSI and PSII are regulated to maintain the appropriate balance of ATP and NADPH production. Reversible phosphorylation and dephosphorylation of the light-harvesting complex II (LHCII) control the functional organization of the photosynthetic apparatus in thylakoid membranes to regulate the relative activities of PSI and PSII and thus the relative amounts of ATP and NADPH generated. Very large super-supercomplexes appear to be involved in this regulation. In stage 3, movement of protons down their electrochemical gradient generated in stage 2 (proton-motive force) through complexes (ATP synthase) powers the synthesis of ATP from ADP and .
Rubisco Fixes CO2 in the Chloroplast Stroma
12.10 ATP and NADPH Drive Carbon Fixation in the Calvin Cycle and Carbohydrate Synthesis in Stage 4 of Photosynthesis In stage 4, the NADPH and ATP generated in stages 2 and 3 drive the synthesis from and of six-carbon sugars (and their polymers). The overall chemical equation is In addition to fixation — incorporation of gaseous into small organic molecules and then sugars — the synthesis of almost all amino acids, all fatty acids and carotenes, all pyrimidines, and probably all purines occurs in chloroplasts. The synthesis of sugars from is the most extensively studied biosynthetic pathway in plant cells. We first consider the unique pathway, known as the Calvin cycle (after discoverer Melvin Calvin), that fixes into three-carbon compounds, powered by energy released during ATP hydrolysis and oxidation of NADPH. Because is initially incorporated into a three-carbon compound, the Calvin cycle is also called the pathway of carbon fixation.
Rubisco Fixes in the Chloroplast Stroma In the first step of the Calvin cycle (Figure 12-40, top), the enzyme ribulose 1,5-bisphosphate carboxylase, or rubisco, incorporates into precursor molecules that are subsequently converted into carbohydrates. Rubisco is located in the stroma of the chloroplast. This enzyme adds to the five-carbon sugar ribulose 1,5-bisphosphate to form two molecules of the three-carbon compound 3-phosphoglycerate (Figure 12-41). Rubisco is a large enzyme whose most common form is composed of eight identical large and eight identical small subunits. The large subunit, which contains the catalytic site, is encoded in chloroplast DNA and the small subunit is encoded by a family of genes in the nucleus. Because the catalytic rate of rubisco is quite low, many copies of the enzyme are needed to fix sufficient . Indeed, this enzyme makes up almost 50 percent of the soluble protein in a chloroplast and is believed to be the most abundant protein on Earth. It is estimated that rubisco fixes more than tons of atmospheric each year.
FIGURE 12-40 The pathway of carbon during photosynthesis. Top: Six molecules of are converted into two molecules of glyceraldehyde 3-phosphate. These reactions, which constitute the Calvin cycle, occur in the stroma of the chloroplast. Via the antiporter, some glyceraldehyde 3-phosphate is transported to the cytosol in exchange for phosphate. No fixed leaves the chloroplast
unless phosphate is fed into it to replace the phosphate carried out of the stroma in the form of glyceraldehyde 3-phosphate. Bottom: In the cytosol, an exergonic series of reactions converts glyceraldehyde 3-phosphate to fructose 1,6-bisphosphate. Two molecules of fructose 1,6-bisphosphate are used to synthesize one molecule of the disaccharide sucrose and release inorganic phosphate that can be transported back into the stroma. The mechanism of the conversion of glyceraldehyde 3-phosphate to hexoses is almost the reverse of that in glycolysis (see Figure 12-3). Some glyceraldehyde 3-phosphate (not shown here) is also converted to amino acids and fats, compounds essential for plant growth. Description The flowchart starts with Calvin cycle in stroma whose intermediate product glyceraldehyde 3-phosphate enters cytosol via phosphatetriosephosphate antiport protein and enters the sucrose synthesis cycle. The Calvin cycle (C O 2 fixation) starts as follows: Six molecules of C O 2 equals 1 C enter the Calvin cycle and interact with 6 molecules of ribulose 1, 5-bisphosphate equals 5 C producing 12 molecules of 3phosphoglycerate equals 3 C. Next, this produces 12 molecules of 1, 3bisphosphoglycerate equals 3 C while simultaneously converting 12 A T P to 12 A D P. Next, this produces 12 molecules of glyceraldehyde 3-phosphate equals 3 C while simultaneously converting 12 N A D P H to 12 N A D P plus, 12 P i. Out of this, 10 molecules of glyceraldehyde 3-phosphate equals 3 C are converted to 6 molecules of ribulose 5-phosphate equals 5 C with the help of 7 enzymes and releasing 4 P i. Next, this produces 6 molecules of ribulose 1, 5-bisphosphate equals 5 C while simultaneously converting 6 A T P to 6 A D P. This cycle continues. Two molecules of glyceraldehyde 3-phosphate equals 3 C from stroma enter into cytosol via phosphatetriosephosphate antiport protein present in inner chloroplast membrane while simultaneously 2 P i from cytosol enter stroma. The 2 molecules of glyceraldehyde 3-phosphate equals 3 C are converted to 1 molecule of fructose 1, 6bisphosphate equals 6 C which is further converted to 2 molecules of fructose 1, 6bisphosphate equals 6 C which then enters the sucrose synthesis cycle. One molecule of fructose 1, 6-bisphosphate equals 6 C is converted to one molecule of fructose 1phosphate equals 6 C and one is converted to 1 molecule of fructose 6-phosphate equals 6 C while releasing P i. Fructose 1-phosphate equals 6 C is converted to one molecule of glucose 1-phosphate equals 6 C which is converted to 1 molecule of U D
P-glucose equals 6 C while simultaneously converting U T P to P P i. U D P-glucose equals 6 C combines with of fructose 6-phosphate equals 6 C to produce 1 molecule of sucrose 6-phosphate equals 12 C which results into sucrose equals 12 C by releasing P i. The chemical structures are as follows: Carbon dioxide shows C double bonded to two O. 3-Phosphoglycerate shows C O O negative single bond H C O H single bond C H 2 single bond O P O 3 superscript 2 negative. 1,3-Bisphosphoglycerate shows C double bond O and single bond O P O 3 superscript 2 negative and H C O H single bond C H 2 single bond O P O 3 superscript 2 negative. Glyceraldehyde 3-phosphate shows C H O single bond H C O H single bond C H 2 single bond O P O 3 superscript 2 negative. Ribulose 5-phosphate shows C H 2 O H single bond C O single bond H C O H single bond H C O H single bond C H 2 single bond O P O 3 superscript 2 negative. Ribulose 1, 5-bisphosphate shows C H 2 single bond O P O 3 superscript 2 negative and C O single bond H C O H single bond H C O H single bond C H 2 single bond O P O 3 superscript 2 negative. Fructose 1, 6-bisphosphate shows C H 2 single bond O P O 3 superscript 2 negative and C O single bond H O C H single bond H C O H single bond H C O H single bond C H 2 single bond O P O 3 superscript 2 negative. Glucose 1-phosphate shows a glucose ring with O P O 3 superscript 2 negative at C 1, O H at C 2, O H at C 3, O H at C 4, C H 2 O H at C 5. Fructose 6-phosphate shows a pentose ring with C H 2 O H at C 2, O H at C 3, O H at C 4, and C H 2 O P O 3 superscript 2 negative at C 5. Sucrose 6-phosphate shows C 1 of glucose ring single bond O single bond C 2 of pentose ring.
FIGURE 12-41 The initial reaction of rubisco that fixes into organic compounds. In this reaction, catalyzed by ribulose 1,5-bisphosphate carboxylase (rubisco), (red) condenses with the five-carbon sugar ribulose 1,5-bisphosphate. The products are two molecules of 3-phosphoglycerate. Description The process starts with C O 2 plus ribulose 1, 5-bisphosphate (C H 2 single bond O P O 3 H negative and C O single bond H C O H single bond H C O H single bond C H 2 single bond O P O 3 H negative) resulting into rubisco-bound intermediate(C H 2 single bond O P O 3 H negative and C O H single bond C O O negative and C O single bond H C O H single bond C H 2 single bond O P O 3 H negative). Next, H 2 O enters the process and results in two molecules of 3-phosphoglycerate (C O O negative single bond H C O H single bond C H 2 single bond O P O 3 H negative). Rubisco is a light- and redox-sensitive enzyme, although its regulation is very complex and not yet fully understood. Rubisco is spontaneously activated in the presence of high and concentrations. The activating reaction entails the covalent addition of to the side-chain amino group of a lysine in the enzyme’s active site, forming a carbamate group that then binds a ion, which is required for enzymatic activity. Under normal conditions, however, with ambient levels of , this reaction is slow and usually requires catalysis by rubisco activase, a member of the family of ATPases. Rubisco activase hydrolyzes
ATP and uses the energy released to clear the active site of rubisco of small molecule inhibitors so that can be added to its active site lysine. Rubisco activase also accelerates an activating conformational change in rubisco (from an inactive-closed to an active-opened state). The regulation of rubisco activase by the protein thioredoxin (Tx) is, at least in part in some species, responsible for rubisco’s sensitivity. In the dark, thioredoxin contains a disulfide bond; in the light, electrons are transferred from PSI, via ferredoxin, to thioredoxin, reducing its disulfide bond: In the dark, when thioredoxin becomes reoxidized, rubisco activase and other enzymes are reoxidized and so inactivated. Thus the activities of these enzymes are sensitive to the redox state of the stroma, which in turn is light sensitive — an elegant mechanism for the regulation of enzymatic activity by light. Furthermore, rubisco activase’s activity is sensitive to the ratio of ATP to ADP. If that ratio is low (relatively high ADP), then the activase will not activate rubisco (and so the cell will expend less of its scarce ATP to fix carbon). Photosynthesis is sensitive to a variety of typical plant stresses — moderate heat, cool temperatures, drought (limited water), high salt, high
light intensity, and UV radiation. At least some of these stresses influence fixation by reducing the activity of rubisco activase and thus rubisco. Inhibition of fixation reduces consumption of NADPH. Under strong light conditions, the high ratio can reduce electron flow to and increase leakage to , resulting in increased ROS formation, which can both initiate cellular-signaling pathways and interfere with a variety of cellular processes. Given the key role of rubisco in controlling energy utilization and carbon flux — both in individual chloroplasts and, in a sense, throughout the entire biosphere — it is not surprising that its activity is carefully regulated. The fate of 3-phosphoglycerate formed by rubisco is complex: some is converted to hexoses incorporated into starch or sucrose, but some is used to regenerate ribulose 1,5-bisphosphate. The fixation of 6 molecules and the net formation of 2 glyceraldehyde 3-phosphate molecules (see
Figure 12-40, top) require the consumption of 18 ATPs and 12 NADPHs generated by the light-requiring processes of photosynthesis. Synthesis of Sucrose Using Fixed Is Completed in the Cytosol After its formation in the chloroplast stroma, glyceraldehyde 3-phosphate is transported to the cytosol in exchange for phosphate. The final steps of sucrose synthesis (Figure 12-40, bottom) occur in the cytosol of leaf cells. Synthesis of Starch in the Stroma
Photorespiration Competes with Carbon Fixation and Is Reduced in C4 Plants
The key monomer substrate used to build large starch polymers is ADPglucose. This polymerization takes place in the stroma, and starch polymers are stored there in densely packed crystalline aggregates called granules (see Figures 12-33 and 12-34). The enzymes that generate ADPglucose from glucose 1-phosphate and ATP are found in both the stroma and the cytosol, indicating that hexoses of various structures are imported from the cytosol into the stroma for starch synthesis. Photorespiration Competes with Carbon Fixation and Is Reduced in Plants As noted above, rubisco catalyzes the incorporation of into ribulose 1,5-bisphosphate as part of photosynthesis. It can catalyze a second, distinct, and competing reaction with the same substrate — ribulose 1,5bisphosphate — but with in place of as a second substrate, in a process known as photorespiration (Figure 12-42). The products of this second reaction are one molecule of 3-phosphoglycerate and one molecule of the two-carbon compound phosphoglycolate. The carbon-fixing reaction is favored when the ambient concentration is relatively high, whereas photorespiration is favored when is low and is relatively high. Photorespiration takes place in light, consumes , and converts ribulose 1,5-bisphosphate in part to . As Figure 12-42 shows, photorespiration is wasteful to the energy economy of the plant: it consumes ATP and , and it generates without fixing carbon. Indeed, when is low and is high, much of the fixed by the Calvin cycle is lost as the result
of photorespiration. This surprising, wasteful alternative reaction catalyzed by rubisco may be a consequence of the inherent difficulty the enzyme has in specifically binding the relatively featureless molecule and of the ability of both and to react and form distinct products with the same initial 1,5-bisphosphate intermediate.
Figure 12-42
fixation and photorespiration. These competing pathways are both initiated by ribulose 1,5-bisphosphate carboxylase (rubisco), and both use ribulose 1,5bisphosphate. fixation (pathway 1) is favored by high and low concentrations; photorespiration (pathway 2) occurs at low and high concentrations (i.e., under normal atmospheric conditions). The phosphoglycolate produced by photorespiration is recycled via a complex set of reactions that take place in peroxisomes and in mitochondria, as well as in chloroplasts. The net result: for every two molecules of phosphoglycolate formed by photorespiration (four C atoms), one molecule of 3phosphoglycerate is ultimately formed and recycled, and one molecule of is lost. Description In carbon dioxide fixation (labeled 1), C O 2, H 2 O, and ribulose 1, 6-bisphosphate (C H 2 single bond O P O 3 superscript 2 negative and C O single bond H C O H single
bond H C O H single bond C H 2 single bond O P O 3 superscript 2 negative) combine to form 3-phosphoglycerate (C O O negative single bond H C O H single bond C H 2 single bond O P O 3 superscript 2 negative), which can be converted to sugars. In photorespiration (labeled 2), ribulose 1, 5-bisphosphate combines with oxygen to form 3-phosphoglycerate and phosphoglycolate (C O O negative single bond C H 2 single bond O P O 3 superscript 2 negative). On addition of H 2 O and loss of P i, glycolate (C O O negative single bond C H 2 O H) is formed. Two glycolates are combined to form glycerate (C O O negative single bond C H O H single bond C H 2 O H) with the loss of a C O 2 molecule. Then, using one molecule of A T P, glycerate is converted to 3-phosphoglycerate, which can be converted to sugars. Excessive photorespiration could become a problem for plants in a hot, dry environment because they must keep the gas-exchange pores (stomata) in their leaves closed much of the time to prevent excessive loss of moisture. As a consequence, the level inside the leaf can fall below the of rubisco for . Under these conditions, the rate of photosynthesis is slowed, photorespiration is greatly favored, and the plant might be in danger of fixing inadequate amounts of . Corn, sugarcane, crabgrass, and other plants that can grow in hot, dry environments have evolved a way to avoid this problem by using a two-step pathway of fixation in which a -hoarding step in cells called mesophyll cells precedes the Calvin cycle in cells called bundle sheath cells (Figure 1243). This pathway has been named the pathway because the first molecules formed in mesophyll cells during carbon fixation in this pathway are four-carbon compounds, such as oxaloacetate and malate, rather than the three-carbon molecules that initiate the Calvin cycle ( pathway). These four-carbon molecules then move into bundle sheath cells where they release that serves as a substrate for the Calvin cycle. The relatively high concentration of and low concentration of in
bundle sheath cells favor the fixation of by rubisco to form 3phosphoglycerate and suppress photorespiration.
FIGURE 12-43 The pathway. The key enzyme in the pathway is phosphoenolpyruvate carboxylase, which assimilates (red) to form oxaloacetate in mesophyll cells. Decarboxylation of malate or other intermediates in bundle sheath cells releases , which enters the standard Calvin cycle via rubisco (see Figure 12-40, top and 12-41). Description In the mesophyll cells, C O 2 diffuses in and is combined with phosphoenolpyruvate (C H 2 double bond C O single bond P O 3 superscript 2 negative and C O O negative), forming oxaloacetate (C O O negative single bond C H 2 single bond C O single bond C O O negative) and losing inorganic phosphate (P i) by an enzyme phosphoenolpyruvate carboxylase. Oxaloacetate is reduced with N A D P H and H plus, forming malate and N A D P plus. Malate (C O O negative single bond C H 2 single bond C O H and H single bond C O O negative) is then passed to the bundle sheath cells where C O 2 is lost and passed onto the Calvin cycle. The decarboxylated malate is converted to pyruvate (C H 2 single bond C O single bond C O O negative) by oxidation with N A D P plus to N A D P H and a H plus ion. Then, pyruvate is passed back to the mesophyll cell where pyruvate phosphate dikinase converts it to phosphoenolpyruvate, using A T P in the process and yielding A M P.
plants are superior to plants in their ability to use the available because the enzyme phosphoenolpyruvate carboxylase has a higher affinity for than does rubisco. However, one ATP is converted to one AMP in the cyclical process (to generate phosphoenolpyruvate from pyruvate); thus the overall efficiency of the photosynthetic production of sugars from NADPH and ATP is lower than it is in plants, which use only the Calvin cycle for fixation. Nonetheless, the net rates of photosynthesis for grasses, such as corn or sugarcane, can be two to three times the rates for otherwise similar grasses, such as wheat, rice, or oats, owing to the elimination of losses from photorespiration. KEY CONCEPTS OF SECTION 12.10 ATP and NADPH Drive Carbon Fixation in the Calvin Cycle and Carbohydrate Synthesis in Stage 4 of Photosynthesis In stage 4, the NADPH and ATP generated in stages 2 and 3 provide the energy and the electrons to drive the fixation of , which results in the synthesis of carbohydrates. These reactions occur in the thylakoid stroma and cytosol. Stages 1–3 are called the light reactions of photosynthesis because they are directly dependent on light energy. The reactions in stage 4 are indirectly dependent on light energy; they are sometimes called the dark reactions of photosynthesis because they can occur in the dark, although they often occur during illumination. In the Calvin cycle, also called the pathway of carbon fixation, atmospheric is incorporated, or fixed, into organic molecules in a series of reactions that occur in the chloroplast stroma. The initial reaction in the Calvin cycle, catalyzed by the enzyme rubisco, forms a three-carbon intermediate, 3-phosphoglycerate. Some of the glyceraldehyde 3phosphate generated in the cycle is transported to the cytosol and converted to sucrose (see Figure 12-40). Rubisco is light- and redox-sensitive. Its activity is regulated by the enzyme rubisco activase. ADP-glucose is polymerized to starch polymers in the stroma, where they are stored in densely packed aggregates called granules.
In plants, a substantial fraction of the fixed by the Calvin cycle can be lost as the result of photorespiration, a wasteful reaction catalyzed by rubisco that is favored at low and high levels (see Figure 12-42). In plants, is fixed initially in the mesophyll cells by a rubisco-independent reaction with phosphoenolpyruvate. The four-carbon molecules so generated are shuttled to the bundle sheath cells, where the is released and then fixed by rubisco in the Calvin cycle. The rate of photorespiration in plants is much lower than it is in plants.
Key Terms
End of Chapter Visit Achieve to access study tools and to learn more about the concepts in this chapter: Perspectives for the Future Analyze the Data Chapter References Additional tools including videos, animations, and quizzes Key Terms acetyl-coenzyme A (acetyl CoA) adenosine triphosphate (ATP) aerobic oxidation (aerobic respiration) anaerobic respiration ATP synthase binding-change mechanism Calvin cycle carbon fixation catabolism pathway chemiosmosis chlorophylls chloroplast citric acid cycle
cytochrome electron-transport chain endosymbiont endosymbiont hypothesis energy charge fermentation fission (mitochondrial) flavin adenine dinucleotide (FAD) complex fusion (mitochondrial) glycolysis light-harvesting complexes (LHCs) membrane contact sites (MCSs) mitochondria-associated membranes (MAMs) mitochondrial cristae mitochondrial DNA mitochondrial inner membrane mitochondrial intermembrane space mitochondrial matrix mitochondrial outer membrane mitochondrion mitophagy multiprotein complexes nicotinamide adenine dinucleotide nicotinamide adenine dinucleotide phosphate oxidative phosphorylation peroxisomes photoelectron transport
photorespiration photosynthesis photosystem photosystem I (PSI) photosystem II (PSII) porin prosthetic group proton-motive force proton pump proton pumping pyruvate Q cycle reactive oxygen species (ROS) reduction potential (E) respiration respiratory chain respiratory control rubisco (ribulose 1,5-bisphosphate carboxylase) special-pair chlorophylls starch stroma substrate-level phosphorylation supercomplexes superoxide anions thylakoid lumen thylakoid membrane thylakoids triacylglycerol (triglyceride)
Review the Concepts
ubiquinone [coenzyme Q (CoQ)] uncoupler uncoupling protein 1 (UCP1) Review the Concepts 1. The proton-motive force is essential for both mitochondrial and chloroplast function. What produces the proton-motive force, and what is its relationship to ATP? The compound 2,4dinitrophenol (DNP), which was used in diet pills in the 1930s but later shown to have dangerous side effects, allows protons to diffuse across membranes. Why is it dangerous to consume DNP? 2. Mitochondria and chloroplasts are thought to have evolved from symbiotic bacteria. What is the experimental evidence from this chapter that supports this hypothesis? 3. The inner mitochondrial membrane exhibits all of the fundamental characteristics of a typical cell membrane, but it also has several unique characteristics that are closely associated with its role in oxidative phosphorylation. What are these unique characteristics? How does each contribute to the function of the inner membrane? 4. Maximal production of ATP from glucose involves the reactions of glycolysis, the citric acid cycle, and the electron-transport chain. Which of these reactions requires , and why? Which, in certain organisms or physiological conditions, can proceed in the absence of ?
5. Fermentation permits the continued extraction of energy from glucose in the absence of oxygen. If glucose catabolism is anaerobic, why is fermentation necessary for glycolysis to continue? 6. Describe the step-by-step process by which electrons from glucose catabolism in the cytoplasm are transferred to the electron-transport chain in the inner mitochondrial membrane. In your answer, note whether the electron transfer at each step is direct or indirect. 7. Mitochondrial oxidation of fatty acids is a major source of ATP, yet fatty acids can be oxidized elsewhere. What organelle, besides the mitochondrion, can oxidize fatty acids? What is the fundamental difference between oxidation occurring in this organelle and mitochondrial oxidation? 8. Each of the cytochromes in the mitochondrion contains prosthetic groups. What is a prosthetic group? Which type of prosthetic group is associated with the cytochromes? What property of the various cytochromes ensures unidirectional electron flow along the electron-transport chain? 9. The electron-transport chain consists of a number of multiprotein complexes, which work in conjunction to pass electrons from an electron carrier, such as NADH, to . What is the role of these complexes in ATP synthesis? It has been demonstrated that respiration supercomplexes contain all the protein components necessary for respiration. Why is this beneficial for ATP synthesis, and what is one way that the existence of supercomplexes has been demonstrated experimentally? Coenzyme Q (CoQ) is not a protein, but a small,
hydrophobic molecule. Why is it important for the functioning of the electron-transport chain that CoQ is a hydrophobic molecule? 10. It is estimated that each electron pair donated by NADH leads to the synthesis of approximately three ATP molecules, whereas each electron pair donated by leads to the synthesis of approximately two ATP molecules. What is the underlying reason for the difference in yield for electrons donated by versus NADH? 11. Describe the main functions of the different components of the ATP synthase enzyme in the mitochondrion. A structurally similar enzyme is responsible for the acidification of lysosomes and endosomes. Given what you know about the mechanism of ATP synthesis, explain how this acidification might occur. 12. Much of our understanding of ATP synthase is derived from research on aerobic bacteria. What makes these organisms useful for this research? Where do the reactions of glycolysis, the citric acid cycle, and the electron-transport chain occur in these organisms? Where is the proton-motive force generated in aerobic bacteria? What other cellular processes depend on the proton-motive force in these organisms? 13. An important function of the inner mitochondrial membrane is to provide a selectively permeable barrier to the movement of water-soluble molecules and thus to generate different chemical environments on either side of the membrane. However, many of the substrates and products of oxidative phosphorylation are water soluble and must cross the inner membrane. How does this transport occur?
14. The Q cycle plays a major role in the electron-transport chain of mitochondria, chloroplasts, and bacteria. What is the function of the Q cycle, and how does it carry out this function? What electron-transport components participate in the Q cycle in mitochondria, in purple bacteria, and in chloroplasts? 15. True or false: Since ATP is generated in chloroplasts, cells capable of undergoing photosynthesis do not require mitochondria. Explain. Name and describe the idea that explains how mitochondria and chloroplasts are thought to have originated in eukaryotic cells. 16. Write the overall reaction of oxygen-generating photosynthesis. Explain the following statement: The generated by photosynthesis is simply a by-product of the pathway’s generation of carbohydrates and ATP. 17. Photosynthesis can be divided into multiple stages. What are the stages of photosynthesis, and where does each occur within the chloroplast? Where is the sucrose produced by photosynthesis generated? 18. The photosystems responsible for absorption of light energy are each composed of two linked components, the reaction center and an antenna complex. What is the pigment composition and role of each component in the process of light absorption? What evidence exists that the pigments found in these components are involved in photosynthesis? 19. Photosynthesis in green and purple bacteria does not produce . Why? How can these organisms still use photosynthesis to produce ATP? What molecules serve as electron donors in these organisms?
20. Chloroplasts contain two photosystems. What is the function of each? For linear electron flow, diagram the flow of electrons from photon absorption to NADPH formation. What does the energy stored in the form of NADPH synthesize? 21. The Calvin cycle reactions that fix do not function in the dark. What are the likely reasons for this? How are these reactions regulated by light? 22. Rubisco, which may be the most abundant protein on Earth, plays a key role in the synthesis of carbohydrates in organisms that use photosynthesis. What is rubisco, where is it located, and what function does it serve?