Introduction
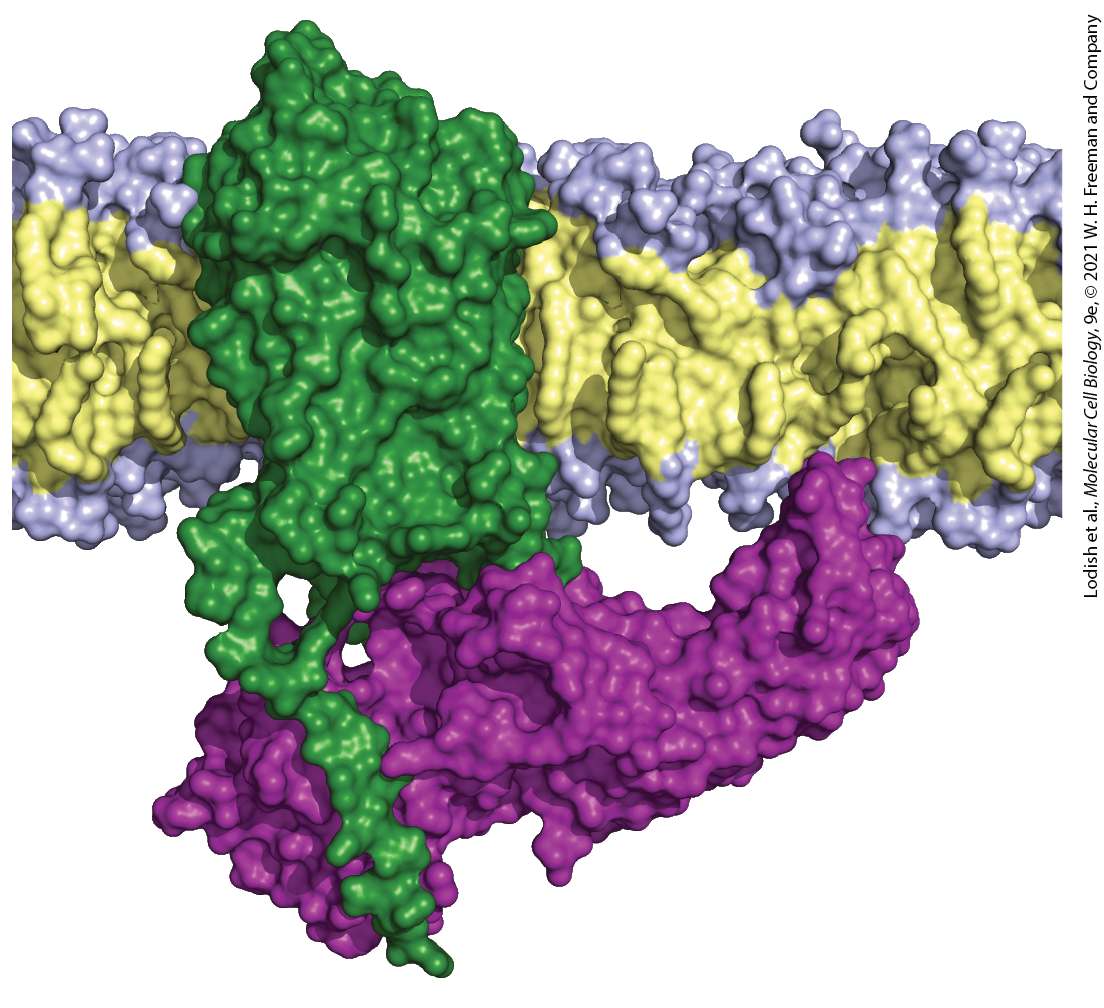
Chapter 15 Receptors, Hormones, and Cell Signaling Structure of a cell surface G protein–coupled receptor (green) bound to β-arrestin (purple). G protein–coupled receptors that are in the active state for a long period of time become phosphorylated, triggering binding of an arrestin and inhibition of further signaling by the receptor. [Data from Y. Kang et al., 2015, Nature 523:561–567, PDB ID 4zwj, and custom PDB.]
15.1 Signal Transduction Pathways: From Extracellular Signal to Cellular Response
15.2 Studying Cell-Surface Receptors and Signal Transduction Proteins
15.3 Structure and Mechanism of G Protein–Coupled Receptors
15.4 Regulating Metabolism of Many Cells: G Protein–Coupled Receptors That Activate or Inhibit Adenylyl Cyclase
15.5 Regulating Protein Secretion and Muscle Contraction: Ions as Second Messengers in Multiple Signal Transduction Pathways
15.6 Vision: How the Eye Senses Light No cell lives in isolation; life requires that all cells sense stimuli in their environment and respond appropriately with adaptations that affect their growth, health, function, or development. Many cells sense physical stimuli such as mechanical pressure (touch) and heat (see Chapter 21). Phototactic single-celled algae sense light (see Chapter 1), and in this chapter we see how cells in the human retina sense light and respond by sending signals to the brain. Metazoan cells sense a wide variety of environmental chemicals, including nutrients such as sugars and amino acids as well as oxygen, toxic compounds, and diverse molecules that convey taste (tastants) and odor (odorants). Many cells sense a reduction in oxygen levels in the blood and respond by activating the HIF1α transcription factor which, in turn, activates expression of genes that enable the cells and the organism to adapt to low oxygen (see Chapter 21).
Many types of cells release particular chemicals that can influence the behavior of another cell; these are often called extracellular (outside of the cell) signaling molecules, or simply signals. The release and reception of such signals is a fundamental process, known as cellular communication, that shapes the development and function of every living organism. Cells that communicate through extracellular signals include single-cell prokaryotic and eukaryotic microorganisms — such as bacteria, yeasts, algae, slime molds, and protozoans. In Chapter 1 we saw how secreted molecules called pheromones coordinate the aggregation of free-living yeast cells for sexual mating. This chapter and the next focuses on hormones and other extracellular signaling molecules that function within multicellular animals. These signaling molecules function to control a variety of processes, including the metabolism of sugars, fats, and amino acids; the induction or repression of specific genes that in turn affect the growth, differentiation, and function of cells and tissues; the synthesis and secretion of many proteins; and the composition of intracellular and extracellular fluids. For example, when the concentration of certain hormones rises, that informs cells that the organism is threatened (adrenaline and the fight-or-flight response) or that excess nutrients are present and should be stored for future use (insulin triggering the uptake of glucose into muscle for storage as glycogen). The primary biological function of many of the molecules used as signals — hormones, pheromones, and some neurotransmitters — is the transfer of information. Some molecules used as signals have multiple functions.
For example, some nutrients both act as signals and serve as fundamental building blocks of biomolecules (amino acids, sugars) or as sources of energy (oxygen, glucose, fatty acids). The cell that receives a signal — termed the target cell — must be able to detect the signaling molecule. Typically, the signaling molecule binds noncovalently to a specific protein in the cell, typically called the receptor, that contains a binding site for the signaling molecule. The signaling molecule that binds a receptor is often called the ligand of the receptor. Receptors bind a single type of molecule or a group of closely related molecules. After detecting a signaling molecule, the cell needs to generate a response. Upon binding their ligand, receptors undergo a conformational change that enables them to bind to other proteins in the cytosol or attached to a membrane, often the plasma membrane (Figure 15-1, steps 1 and 2 ). In binding to these proteins, the receptor may activate (or inhibit) them, sometimes by enzymic modification, such as phosphorylation. Often there are multiple biochemical or biophysical steps that form a pathway from the initial detection of the signal by the receptor to the final (downstream) responses of the cell. The series of steps leading from initial detection to the final response is termed a signal transduction pathway. Signal transduction pathways ultimately lead to activation (or in some cases inhibition) of one or more effector proteins — often enzymes or transcription factors or cytoskeletal proteins — that lead directly to changes in cellular activities (Figure 15-1, steps 3 – 5 ). Some signal
transduction pathways contain just one or two intermediates; others can involve over a dozen.
FIGURE 15-1 Signal transduction pathways. In this generalized pathway, a receptor protein R binds a ligand H (step 1 ), triggering a conformational change in the receptor that enables it to bind to and activate a signal transduction protein (step 2 ). In many signaling pathways this is a GTP-binding protein or a protein kinase or phosphatase. in turn binds to and activates (or inhibits) other signal transduction proteins (step 3 ), , that in turn activate other signaling proteins, here , and (step 4 ). Some signaling proteins (here ) can activate multiple types of different downstream proteins. Certain signal transduction proteins bind and activate an effector protein, E (step 5 ), which can be an enzyme, transcription factor, transport protein, ion channel, or other type of protein. Signal amplification is a characteristic of many signal transduction pathways, in which activation of a single receptor molecule can lead to activation of multiple signal transduction and effector proteins (step 3 ). Virtually all signal transduction pathways have feedback controls whereby a protein in the signal transduction pathway (here ) or an effector protein modifies either the receptor (step 6a ) or an early protein in the pathway (step 6b ), thus inhibiting or blocking an early step in that pathway. In many pathways these feedback controls trigger receptor degradation, lowering the numbers of receptors and thus the sensitivity of the cell to the ligand.
Description An illustration shows a cell membrane, with the exterior and the cytosol of the cell labeled. Two rounded rectangular receptors labeled R and R superscript asterisk are embedded in the cell membrane. Step 1: A structure labeled H in the exterior binds to a region on R. R becomes R superscript asterisk. Step 2: Another oval structure labeled S subscript 1 is converted to S subscript 1 superscript asterisk. Step 3: S subscript 1 activates three oval structures all labeled S subscript 2 (ellipses below the third S subscript 2 structure). Step 4: The middle S subscript 2 structure from the previous step activates three more oval structures labeled S subscript 3, S subscript 4, and S subscript 5 (ellipses below). Step 5: S subscript 4, activates an effector protein represented by an E-shaped structure. Step 6 a and 6 b: The effector protein can modify the R receptor while S subscript 5 protein can modify S subscript 1 superscript asterisk protein. In any cell in multicellular organisms, multiple receptors are simultaneously activated by different extracellular signals, and each of these receptors in turn can activate a different signal transduction pathway. Complex information-processing networks help coordinate the cell’s responses to these multiple signals and lead to an appropriate change in the cell’s pattern of gene expression and metabolism. In this chapter, we first discuss some basic properties of receptors and the signal transduction pathways they activate, then introduce key techniques for studying receptors and proteins in signaling pathways. We next focus on the largest and evolutionarily most ancient class of receptors — the G
protein–coupled receptors. We will see several of the many important signal transduction pathways they activate and the functions these pathways play in biology.
Signaling Molecules Can Act Locally or at a Distance
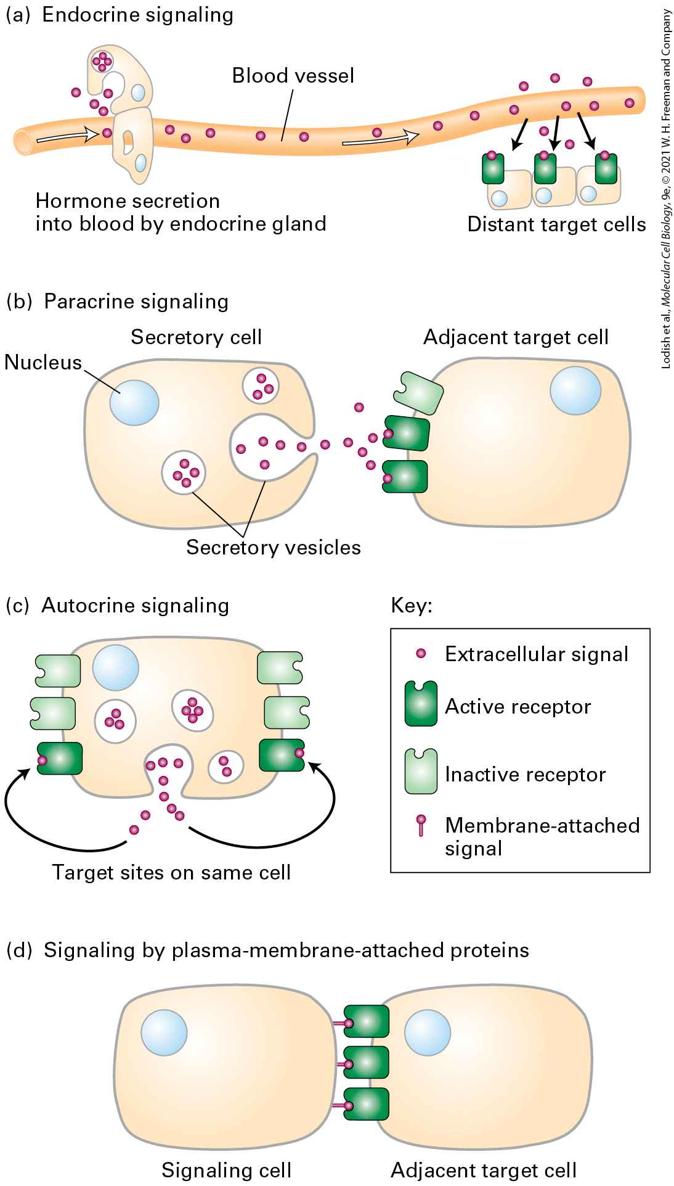
15.1 Signal Transduction Pathways: From Extracellular Signal to Cellular Response Signaling Molecules Can Act Locally or at a Distance As noted above, cells respond to many different types of signals — some originating from outside the organism, some internally generated. Within a multicellular organism, signaling molecules that are generated internally can be described by how they reach their target. Some signaling molecules are transported long distances from their site of synthesis — for example, by movement through the blood; others have more local effects. In animals, signaling by extracellular molecules can be classified into three types based on the distance over which the signal acts (Figure 15-2a–c).
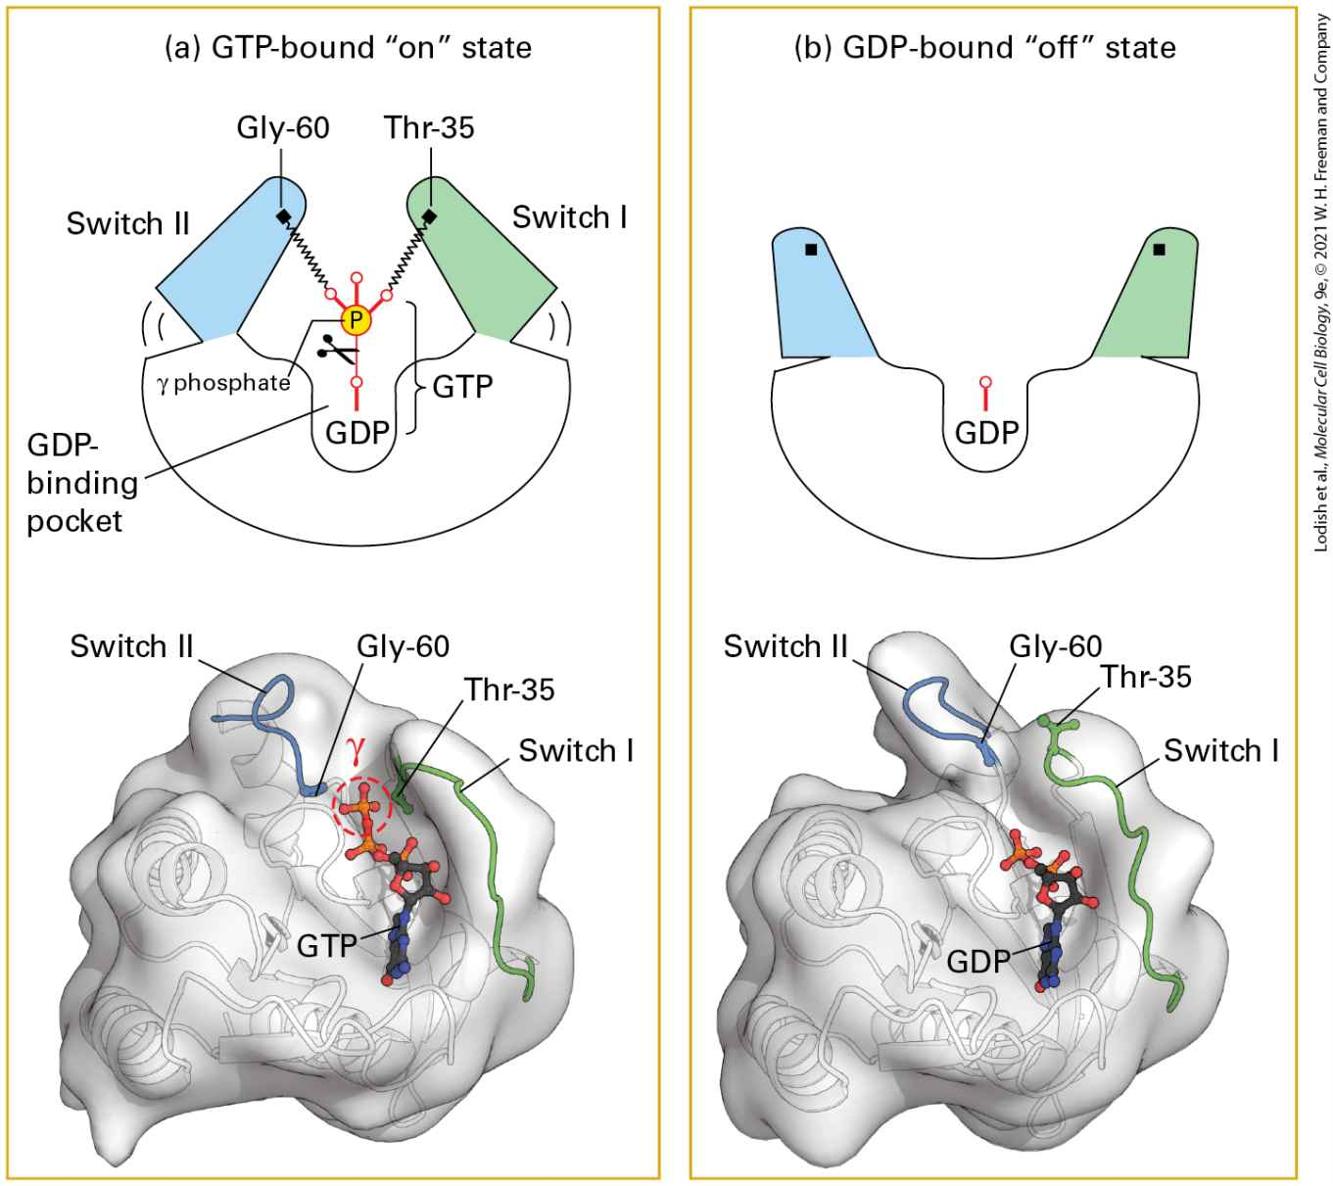
FIGURE 15-2 Types of extracellular signaling. (a–c) Cell-to-cell signaling by extracellular chemicals occurs over distances from a few micrometers in paracrine and autocrine signaling to several meters in endocrine signaling. (d) Proteins attached to the plasma membrane of one cell can interact directly with cell-surface receptors on adjacent cells. Description The illustration labeled (a) titled endocrine signaling shows a blood vessel. An endocrine gland is represented by a structure present on the blood vessel. Cells in the endocrine gland secrete hormones into the blood. The hormones travel through the blood to distant target cells. The target cells show tiny circular nuclei and receptors embedded in the plasma membrane-bound to the hormones. The secreted hormones (extracellular signal molecules) are represented by tiny spheres. The illustration labeled (b) titled paracrine signaling shows a secretory cell with a nucleus inside. The cell has circular secretory vesicles with signal molecules represented as tiny spheres inside. These tiny spheres are transported in vesicles to the cell surface where they are released. They bind to the active receptors on the surface of an adjacent target cell with a nucleus. The illustration labeled (c) titled autocrine signaling shows a cell containing signal receptors on its cell surface. The cell secretes signal molecules represented by tiny spheres inside vesicles. The signal molecules are transported to the cell surface in these vesicles and released. The released extracellular signal molecules interact with target sites of the active receptors on the same cell. The illustration labeled (d) titled signaling by plasma-membrane-attached proteins shows two cells adjacent to each other. One cell, the signaling cell, has membraneattached signal proteins on its surface, while the other cell, the target cell, contains active receptors on the surface. The proteins of the signaling cell interact with the active receptors of the target cell. In endocrine signaling, the signaling molecules act on target cells distant from their site of synthesis. The signaling molecules are synthesized and
secreted by signaling cells (e.g., those found in endocrine glands) and transported through the circulatory system to the target cells. The term hormone generally refers to signaling molecules that mediate endocrine signaling. Insulin secreted by the pancreas and epinephrine secreted by the adrenal glands are examples of endocrine signals that travel through the blood, and thus they are termed hormones. Defects in endocrine signaling can result in human diseases — for example, defects in insulin signaling can cause diabetes. In paracrine signaling, the signaling molecules released by a cell affect only those target cells in close proximity. An example is a neuron releasing a neurotransmitter that acts on an adjacent neuron. In addition to neurotransmitters, many of the protein growth factors that regulate development in multicellular organisms act at short range. Several of the developmentally important signaling proteins that we discuss in Chapter 16 diffuse away from the signaling cell, forming a concentration gradient, and induce different responses in nearby cells depending on their distances from the signaling cells and thus on the local concentration of the signaling protein. In some cases, paracrine signaling molecules, exemplified by TGF-β, are secreted by a cell and then trapped nearby in the web of extracellular macromolecules termed the extracellular matrix until freed to bind to cell-surface receptors on a nearby cell (see Chapters 16 and 20). In autocrine signaling, cells respond to substances that they themselves release. This type of signaling is particularly characteristic of tumor cells.
Signal Transduction Pathways Can Produce Rapid, Short-Term or Slow, Long-Term Changes in Cells, or Both
Many tumor cells release growth factors that stimulate inappropriate, unregulated self-proliferation. Some signaling molecules are integral membrane proteins located on the cell surface (Figure 15-2d). The targets of these relatively immobile membrane signals are receptors on the surface of adjacent cells, whose proliferation or differentiation are controlled by the signal. In other cases, proteolytic cleavage of a membrane-bound signaling protein releases the extracellular domain, which functions as a soluble signaling molecule that can act locally or at a distance (see Chapter 16). Some signaling molecules can act at both short and long ranges. For example, epinephrine (also known as adrenaline) functions as a neurotransmitter (paracrine signaling) and as a hormone (endocrine signaling). As a hormone, it helps initiate the fight-or-flight response to a sudden danger in the environment discussed in Section 15.4. Signal Transduction Pathways Can Produce Rapid, Short-Term or Slow, Long-Term Changes in Cells, or Both The effector proteins in signal transduction pathways are often enzymes or transcription factors that induce two major types of cellular responses: rapid short-term changes in protein activities (seconds-to-minutes) or slower long-term changes (hours-to-days). Rapid changes are typically consequences of modifications to specific preexisting enzymes and other
Receptors Are Allosteric Proteins That Activate Signal Transduction Pathways
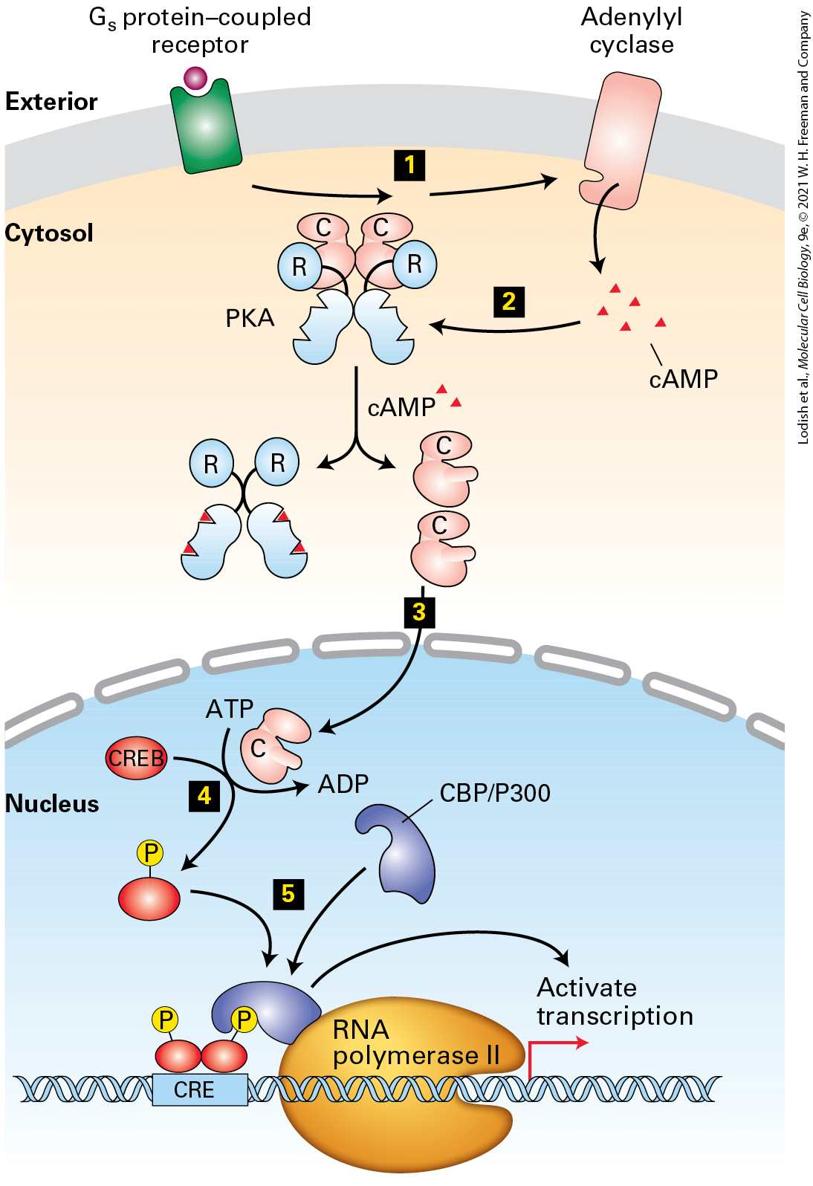
proteins that alter their activity or function. Changes to these proteins are often initiated by covalent modifications such as phosphorylation or ubiquitinylation or by binding of ions or molecules such as or cAMP. Such modifications can induce changes in cellular metabolism of sugars, amino acids, and lipids; can induce secretion of hormones; and can induce in nerve cells the electric signals called action potentials (Chapter 23). Slower, long-term changes are typically consequences of changes in gene expression, either activating or inhibiting synthesis of specific proteins. In this case, the effector proteins are usually transcription factors. Long-term changes in the amounts and activities of specific proteins within cells are critical for cell proliferation, cell differentiation, and organismal development. Receptors Are Allosteric Proteins That Activate Signal Transduction Pathways The interacting surfaces of a receptor and ligand are complementary (see
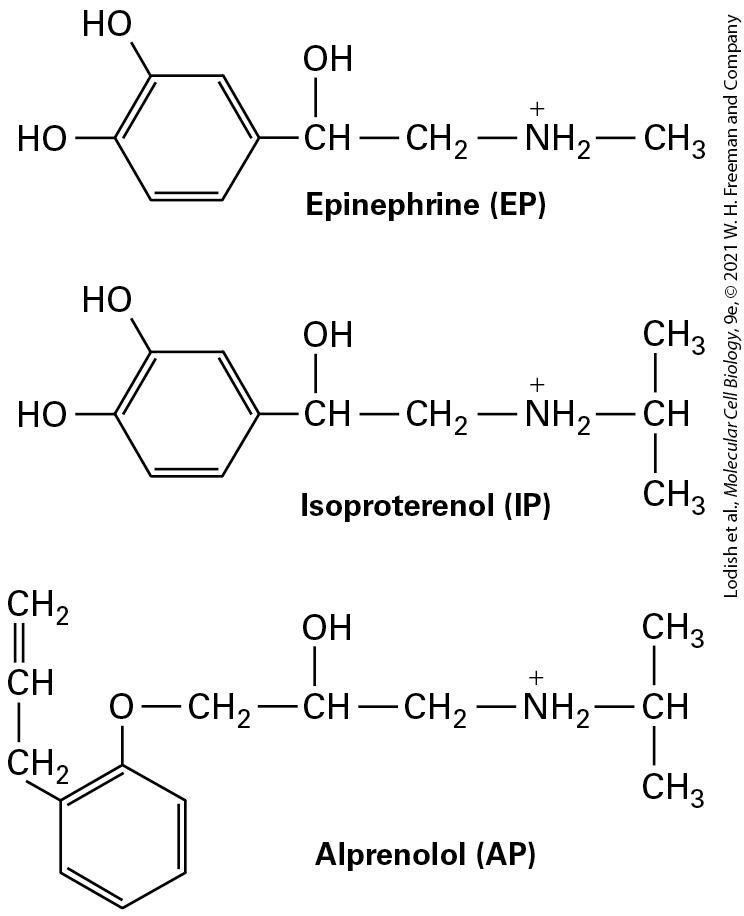
Figure 2-12), held together by multiple weak, noncovalent forces, including ionic, van der Waals, and hydrophobic interactions. In most cases, the binding of the ligand to the receptor causes the receptor to change from an inactive conformation (R) to an active conformation . Only the active conformation of the receptor can trigger the subsequent steps in the signal transduction pathway (see Figure 15-1) because only it
Receptors Can Be in the Cytosol, Nucleus, or on the Cell Surface Membrane
can bind to, and subsequently activate or inhibit, a protein that initiates the signaling pathway. The site on the receptor that interacts with the next molecule in the signal transduction pathway typically is not the site where the ligand binds. Thus receptors are considered to be allosteric proteins (see Chapter 3). As with all allosteric proteins, there is an equilibrium between the R and forms of the receptor. In the absence of the ligand, the equilibrium is far to the left; most of the receptor is in the inactive R conformation. In the presence of ligand, the equilibrium is changed, such that more receptors are in the active conformation. In other words, the ligand binds much more tightly to the than the R conformation, thus pushing the equilibrium to the right and activating the signal transduction pathway. Receptors Can Be in the Cytosol, Nucleus, or on the Cell Surface Membrane How a signaling molecule gains access to its receptor’s binding site depends on where the receptor is located, whether inside the cell or partially exposed to the extracellular fluid at the cell surface.
Extracellular signal molecules that bind to receptors inside the cell must be able to cross the plasma membrane. Some are hydrophobic and can spontaneously diffuse across the plasma membrane’s bilayer without the need for transport proteins (see Chapter 11). Others, such as amino acids, are hydrophilic and, as discussed in Chapter 11, can enter the cell only with the aid of transporter proteins in the plasma membrane. Once inside the cell, these signaling molecules bind to receptors that usually are watersoluble proteins located in the cytosol, the nucleus, or some other intracellular organelle (Figure 15-3).
FIGURE 15-3 Overview of cell signaling. Hydrophobic signaling molecules, such as steroids and related molecules, diffuse through the plasma membrane (step 1 ) and bind to receptors in the cytosol (step 2 ). The receptor-signal complex moves into the nucleus (step 3 ), where it can bind to transcription-control regions in DNA and activate or repress gene expression. The majority of signaling molecules, including small molecules (adrenaline, acetylcholine), peptides (yeast mating factors, glucagon), and proteins (insulin,
growth hormone), are hydrophilic and cannot diffuse across the cell membrane. These molecules bind to specific cell-surface receptor proteins, triggering a conformational change in the receptor, thus activating it (step 4 ). The activated receptor then activates one or more downstream signal transduction proteins or small-molecule second messengers (step 5 ), which eventually leads to activation of one or more effector proteins (step 6 ). The end result of a signaling cascade can be modification of specific cytosolic effector proteins, predominantly enzymes, leading to short-term changes in cellular function, metabolism, or movement (step 7a ). Alternatively, an effector protein can move into the nucleus, triggering a long-term change in gene expression (step 7b ). Termination or downmodulation of the cellular response is often caused by negative feedback from intracellular signaling molecules (step 8 ) and by removal of the extracellular signal (step 9 ). Description The steps involved in the cell signaling are as follows, Step 1. Hydrophobic signals such as steroids, retinoids, and thyroxine enter the cell. Step 2. The signal molecules interact with cytosolic receptors. Step 3. The receptor signal complex moves into the nucleus, which is labeled modification gene expression, development. Step 4. Hydrophilic signals such as small molecules, peptides, and proteins interact with active cell-surface receptors on the cell surface. An inactive cell-surface receptor is present next to the active receptor. Step 5 and 6. Signal transduction proteins and second messengers transmit signals to effector proteins, both connected to the label: signal transduction proteins and second messengers. Step 7 a. Effector proteins modify cellular metabolism, function, or movement in the cytosol. Step 7 b. Effector proteins move to the nucleus where they modify gene expression and cell development. Step 8. A sweeping arrow going up to the cell membrane depicts termination.
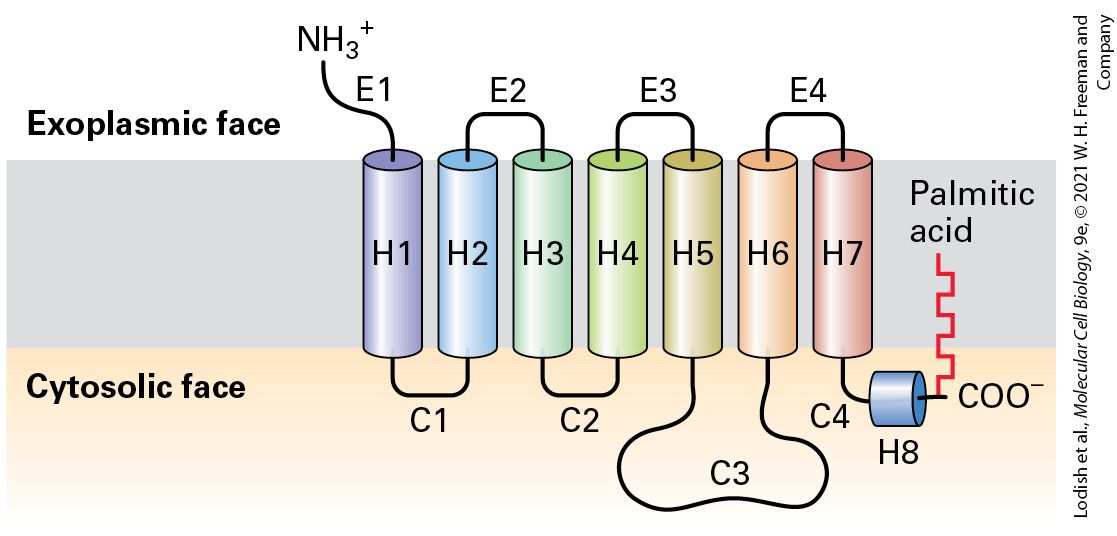
Step 9. The signal molecule exits from the active cell-surface receptor. One large class of hydrophobic signaling molecules spontaneously diffuses through the plasma membrane and binds to members of the nuclear receptor family of transcription factors. These signaling molecules are primarily steroids, retinoids, vitamin D, and thyroid hormone (thyroxine). In most cases, as we saw in Chapter 8, the receptor is located in the cytosol, and the receptor-hormone complex moves into the nucleus, binds to specific regulatory sequences in DNA, and activates or represses expression of specific target genes (see Figure 15-3). In other cases, the receptor is already positioned in the nucleus, bound to its corresponding enhancers or promoters on the DNA. The conformational change in the receptor induced by ligand binding permits transcriptional co-activators to bind and induce gene transcription. In this chapter and the next, we focus on extracellular signaling molecules — small molecules, peptides, and proteins — that initiate signal transduction pathways without crossing the plasma membrane. Indeed, they are frequently too large and too hydrophilic to diffuse through the plasma membrane. These bind to cell-surface receptors that are integral membrane proteins embedded in the plasma membrane (see Figure 15-3). Cell-surface receptors generally consist of three discrete topological domains, or segments: an extracellular domain facing the extracellular fluid, a plasma-membrane-spanning (transmembrane) domain, and an intracellular domain facing the cytosol.
Most Receptors Bind Only a Single Type of Ligand or a Group of Closely Related Ligands
The signaling molecule binds to a structurally complementary site of the receptor that is accessible from the extracellular fluid. The binding site may be located on the extracellular domain or within the membranespanning domain of the receptor. Binding of the ligand induces a conformational change in the receptor that is transmitted through the membrane-spanning domain to the cytosolic domain. This allosteric change results in the receptor’s binding to, and subsequently activating or inhibiting, other proteins in the cytosol or attached to the plasma membrane. Thus the information that an extracellular signal is present is transduced across the plasma membrane and delivered to the cell interior. In eukaryotes, there are about a dozen classes of cell-surface receptors, which activate several types of intracellular signal transduction pathways. Our knowledge of signal transduction has advanced greatly in recent years, in part because these receptors and pathways are highly conserved and function in essentially the same way in organisms as diverse as worms, flies, mice, and humans. Studies using one organism often provide insights into signal transduction pathways in other organisms. For example, information gleaned from genetic studies in flies or worms can be combined with the information from biochemical analyses of mammalian cells to enable researchers to trace many entire signaling pathways from binding of ligand to final cellular response. Most Receptors Bind Only a Single Type of Ligand or a Group of Closely Related Ligands
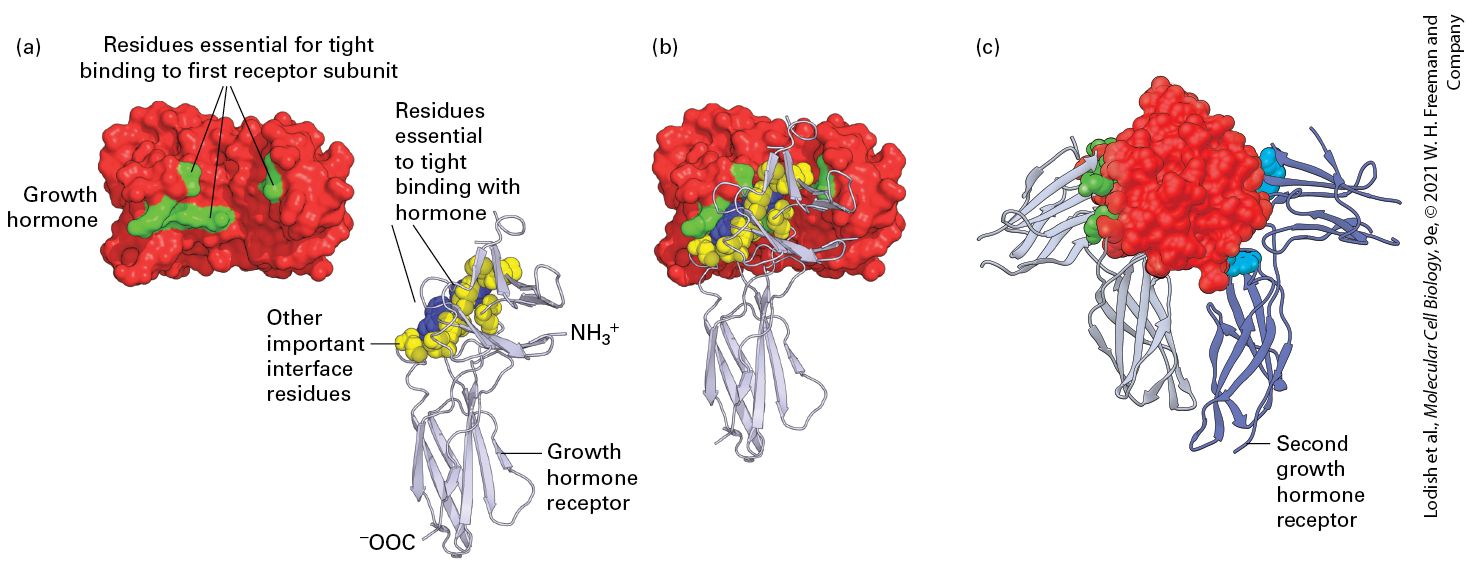
Like an enzyme binding to a substrate, each type of receptor binds only a single type of molecule or a group of very closely related ones. For example, the growth factor receptor binds growth factor, but not insulin or other protein hormones (Figure 15-4). Testosterone receptors bind the steroid testosterone but not other steroid hormones such as estrogen. The binding specificity of a receptor refers to its ability to bind or not bind closely related substances.
FIGURE 15-4 A single growth hormone protein binds simultaneously to two growth hormone receptors through multiple weak, noncovalent forces. (a) As determined from the three-dimensional structure of the 1 growth hormone: 2 growth hormone receptor complex, 28 amino acids in the hormone are at the binding interface with the first receptor protein. To determine which amino acids are important in ligand-receptor binding, researchers mutated each of these amino acids one at a time to alanine and measured the effect on receptor binding. From this study, it was found that only eight amino acids on growth hormone (green) contribute 85 percent of the energy that is responsible for tight receptor binding; these amino acids are distant from each other in the primary sequence but adjacent in the folded protein. Similar studies showed that two tryptophan residues (blue) in the receptor contribute most of the energy responsible for tight binding of growth hormone, although other amino acids at the interface with the hormone (yellow) are also important. (b) Binding of growth hormone to one receptor molecule is followed by (c) binding of a second receptor (purple) to the opposing side of the hormone; this involves the same set of
yellow and blue amino acids on the receptor but different residues (light blue) on the hormone. [Data from B. Cunningham and J. Wells, 1993, J. Mol. Biol. 234:554; and T. Clackson and J. Wells, 1995, Science 267:383.] Description In the illustration labeled (a), a space-filling three-dimensional structure of a growth hormone has three sites containing residues that bind tightly with the receptor. The growth hormone receptor is depicted with a ribbon structure attached to a space-filling model made of important interface residues and residues that bind tightly with growth hormone. The N-terminal and the C- terminal of the ribbon structure are labeled. In the illustration labeled (b), a space-filling three-dimensional structure shows growth hormone bound to a single growth hormone receptor. In the illustration labeled (c), a space-filling three-dimensional structure shows a growth hormone bound to two growth hormone receptors. The second receptor is labeled. Organisms have evolved to be able to use a single ligand to stimulate different cell types to respond in distinct ways. Different cell types often have different receptors that bind the same ligand, and activation of each receptor type induces a different intracellular signal transduction pathway. For instance, the surfaces of skeletal muscle cells, heart muscle cells, and the pancreatic acinar cells that produce hydrolytic digestive enzymes each have different types of receptors for acetylcholine. In a skeletal muscle cell, release of acetylcholine from a motor neuron innervating the cell (paracrine signaling) triggers muscle contraction by activating an ion channel. In heart muscle, the release of acetylcholine by certain neurons activates a G protein–coupled receptor that through a signal transduction pathway opens a channel, reducing the rate of contraction and
Most Receptors Bind Their Ligands with High Affinity
lowering the heart rate. Acetylcholine binding to a receptor on pancreatic acinar cells induces a rise in the cytosolic concentration of that triggers secretion of digestive enzymes to facilitate digestion of a meal. Thus the activation by acetylcholine of different types of acetylcholine receptors produces different cellular responses, depending on the receptor and cell type. Sometimes, the same receptor found on different cell types can, in response to binding the ligand, activate different signal transduction pathways leading to activation of different effectors. For example, the same receptor for the hormone epinephrine (the β-adrenergic receptor) is found on liver, muscle, and fat (adipose) cells. As we see in Section 15.4, epinephrine binding to its receptor stimulates depolymerization of glycogen to glucose in the first two cell types but hydrolysis and secretion of stored fat in adipose cells. In these ways, the same ligand can induce different cells to respond in a variety of ways, often in a manner that coordinates the overall response of the organism. This property is known as the effector specificity of the receptor-ligand complex. Most Receptors Bind Their Ligands with High Affinity Binding of a single ligand to a receptor usually can be viewed as a simple reversible reaction, where the receptor is represented as R, the ligand as L, and the activated receptor-ligand complex as :
(15-1) where is the kinetic rate constant for formation of a receptor-ligand complex from free ligand and receptor and is the rate constant for dissociation of a ligand from its receptor. We define [R] and [L] as the concentrations of free receptor (i.e., receptor without bound ligand) and ligand, respectively, and as the concentration of the receptor-ligand complex. At equilibrium, the rate of formation of the receptor-ligand complex, , is equal to the rate of its dissociation, : thus at equilibrium, The affinity of a signal molecule’s binding to its receptor is typically quantified by the dissociation constant for binding . The dissociation constant is the ratio of the two rate constants, . Equivalently, at equilibrium we can write this equation as: (15-2) The lower the value of the dissociation constant , the tighter the binding (see Chapter 2 and below) and the more stable the receptor-ligand complex.
A way of seeing this key point is that when the concentration of ligand equals (when ), then the concentration of free receptor [R] must equal the concentration of the receptor-ligand complex . Since the total amount of receptor equals the sum of the free and ligand-bound receptors: (15-3) when the system is at equilibrium, half of the receptors have a ligand bound. The smaller the , the lower the ligand concentration required to bind 50 percent of the cell-surface receptors. A common method for experimentally determining the of ligand/receptor binding is described in Section 15.2. The for a binding reaction is similar to the Michaelis constant, , which reflects the affinity of an enzyme for its substrate (see Chapter 3). Signaling systems have evolved such that when an extracellular signal is not present or is present at only very low concentrations, very little receptor is bound to the ligand ( is low), and the cells are in what is called the basal or unstimulated state. A rise in the concentration of an extracellular signaling molecule, as when hormones are released into the blood, usually induces a proportional response in the target cell as more and more cellular receptors bind to their ligand and switch to their active conformations. We can see this principle in practice by comparing the fraction of receptors bound by the hormone insulin at different levels of insulin
Second Messengers Are Used in Most Signal Transduction Pathways
present in the blood. The for binding of insulin to its receptor on liver cells is The normal concentration of insulin in the blood is about . By substituting this value of L and the into Equation 15-2, we can calculate the fraction of total insulin receptors with bound insulin, at equilibrium as 0.0344; that is, about 3 percent of the total insulin receptors will have insulin bound to them in this unstimulated state. Ingesting glucose during a meal induces insulin secretion from the pancreas (see Chapter 21). If the insulin concentration rises fivefold to , the number of receptor-hormone complexes will rise proportionately, almost fivefold, and about 15 percent of the total receptors will have insulin bound to them. If the extent of the induced cellular response is proportional to the number of active insulinreceptor complexes [RL], as is often the case, then the cellular response (changes in the activities of proteins and genes in the signal transduction pathway) will also increase by about fivefold. We now turn our attention to events in the signal transduction pathway after the receptor is activated, focusing on the small molecules and proteins that most commonly participate in signal transduction pathways. Second Messengers Are Used in Most Signal Transduction Pathways Many signal transduction pathways include a step in which specific small molecules such as cyclic AMP and cyclic GMP are synthesized or in which the cytosolic concentration of an ion such as is increased.
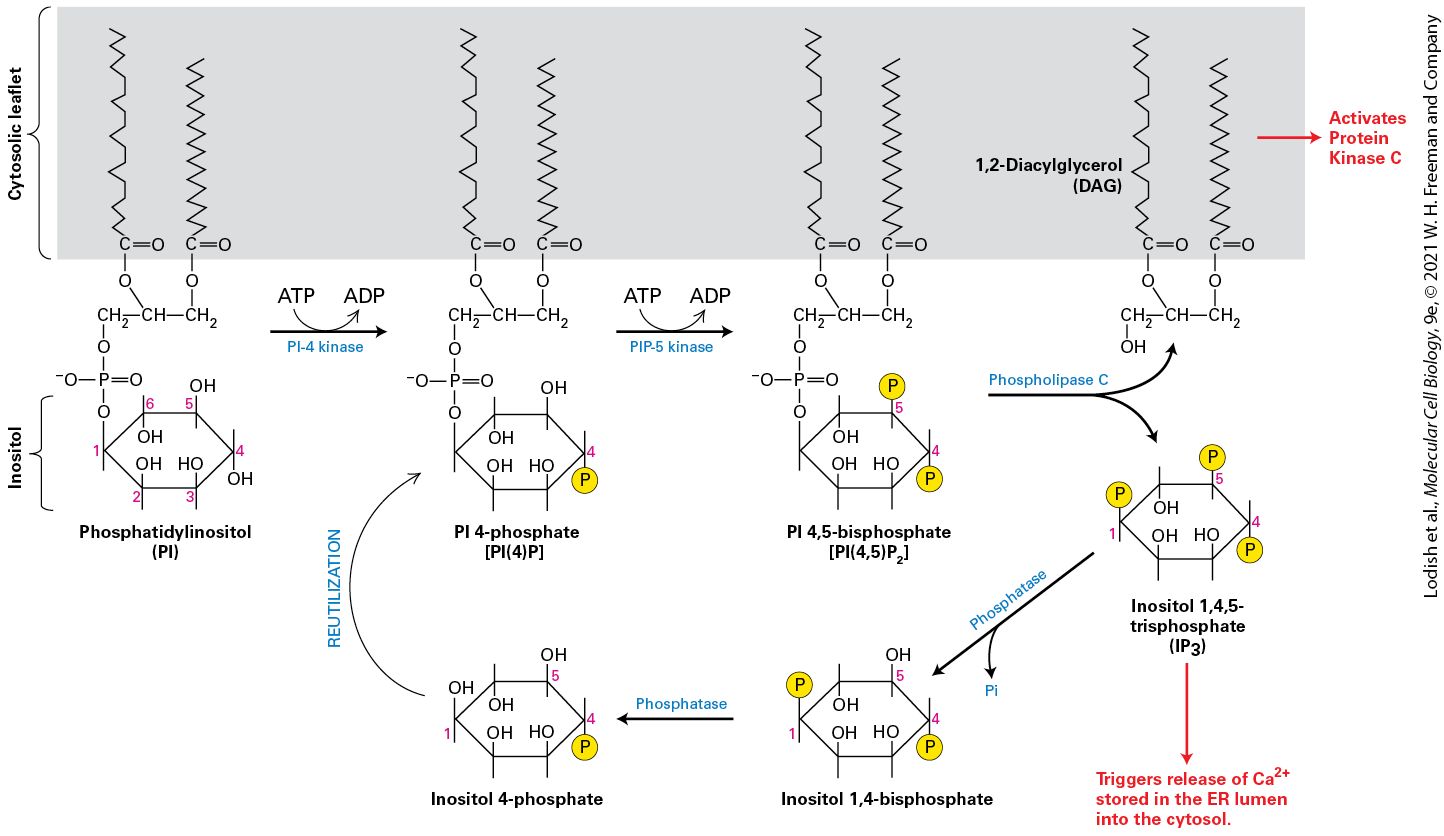
Such small molecules and ions in signaling pathways are often called second messengers, the first messenger being the extracellular signaling molecule itself (Figure 15-5). These second messenger molecules and ions then bind to and activate (or sometimes inhibit) specific intracellular proteins. Both the change in concentration of a second messenger and its action on another protein are key steps in the pathway that ultimately results in a change in the physiological state of the cell in response to the initial signal/stimulus (first messenger). As an example, increases in the concentration of in the cytosol can in different cells trigger protein secretion, cell movement, or muscle contraction.
FIGURE 15-5 Four common compounds that function as intracellular second messengers. The major direct effect or effects of each compound are indicated below its structural formula. Calcium ions and several membrane-bound phosphatidylinositol derivatives also act as second messengers. Description The chemical structure of 3 prime 5 prime cyclic adenosine monophosphate (c A M P) has a furanose ring. C 1 is bonded to N 9 of an adenine group on the top, C 2 is bonded to a hydroxyl group, C 3 is bonded to an oxygen atom which is further bonded to a phosphorous atom which is further double and single bonded to an oxygen atom, an oxygen anion, and another oxygen atom, respectively. The single bonded oxygen
Protein Kinases and Phosphatases Participate in Signal Transduction Pathways by Covalently Modifying and Thus Activating or Inhibiting a Wide Variety of Proteins That Control Cellular States
atom is further bonded to C 5 which is a methylene group bonded to C 4. This compound activates protein kinase A (P K A). The chemical structure of 3 prime 5 prime cyclic guanosine monophosphate (c G M P) has a structure similar to that of c A M P except that C 1 is bonded to N 9 of a guanosine group. This compound activates protein kinase G (P K G) and opens cation channels in rod cells. The chemical structure of 1,2-diacylglycerol (D A G) D A G has a glycerol group bonded to fatty acyl groups. It has a three-carbon chain where C 1 is a methylene group bonded to an oxygen atom further bonded to n number of methylene units which is further bonded to a methyl group. C 2 is a methine group bonded to an oxygen atom further bonded to n number of methylene units, which is further bonded to a methyl group. C 3 is a hydroxyl methyl group. This compound activates protein kinase C (P K C). The chemical structure of Inositol 1, 4, 5-trisphosphate (I P subscript 3) has a cyclohexane ring where C 1, C 4, and C 5 is bonded to an oxygen atom further bonded to a phosphate group. C 2, C 3, and C 6 are bonded to a hydroxyl group. This compound opens divalent calcium ion channels in the endoplasmic reticulum. Protein Kinases and Phosphatases Participate in Signal Transduction Pathways by Covalently Modifying and Thus Activating or Inhibiting a Wide Variety of Proteins That Control Cellular States
Commonly in a signal transduction pathway, proteins are activated or deactivated at multiple steps. One of the most common and reversible mechanisms for changing the activity of a protein is phosphorylation. Protein kinases (PKs) add phosphate groups to specific residues of target proteins, while protein phosphatases remove phosphate groups from these residues (see Figure 3-36). Depending on the target protein, phosphorylation can change its enzymatic activity or its ability to bind to other proteins and thus plays a critically important role in determining the functional state of a cell. A typical mammalian cell expresses a hundred or more different types of kinases, each of which can phosphorylate — and thus affect the activity of — multiple target proteins. The catalytic domains of all known protein kinases have a similar threedimensional structure (see Figure 3-37) and highly conserved amino acids cluster around the catalytic site. Some form the nucleotide-binding pocket that binds ATP, positioning it such that its gamma phosphate can be transferred to the OH moiety of its substrate (see Figure 3-38). As detailed in Chapter 3, all kinases recognize their specific protein substrates by binding not only to the side chain of the serine, threonine, or tyrosine to be phosphorylated but also to specific amino acid residues that surround the target residue. Thus one can analyze the amino acid sequences surrounding tyrosine, serine, and threonine residues in a protein and make a good prediction as to which kinases might phosphorylate those residues. The catalytic activity of all kinases is highly regulated; commonly it is modulated by the binding of other proteins to the kinase and by changes in the concentrations of various small intracellular signaling molecules and
metabolites. Many kinases are themselves activated by phosphorylation, resulting in cascades of kinases, one phosphorylating the next in the cascade. An example is protein kinase A (PKA), a kinase that phosphorylates proteins that regulate many aspects of cell metabolism (see Section 15-4). In its inactive, unphosphorylated form, critical residues in the activation loop are in the wrong position to bind ATP and its protein substrates (see Figures 3-38 and 15-6a). When a critical threonine residue in the activation loop is phosphorylated by PKA or by another kinase, the conformation of the loop changes, creating the binding site for ATP and its substrates, thus activating catalytic activity (Figure 15-6b). In this chapter and the next we see that many other kinases are activated in a similar manner.
EXPERIMENTAL FIGURE 15-6 Molecular structures of protein kinase A (PKA) in its catalytically inactive, unphosphorylated form (a) and after activation by phosphorylation of a threonine residue in the activation loop (b). Phosphorylation of PKA at threonine-197 (pT197) leads to a marked conformational change in the activation loop, a change that promotes binding of both ATP and its substrate proteins. A similar phosphorylation-dependent mechanism activates many other kinases (see Figure 3-38). Phosphorylation of threonine-197 is also required for binding of PKA to its inhibitory subunit R (see Figure 15-21a) and thus for its regulation by cAMP (see Section 15.4). PKA can autophosphorylate itself on T197 and other cellular kinases can also autophosphorylate this residue. [Data from J.M. Steichen et.al., J. Biol. Chem. 287:14672.]
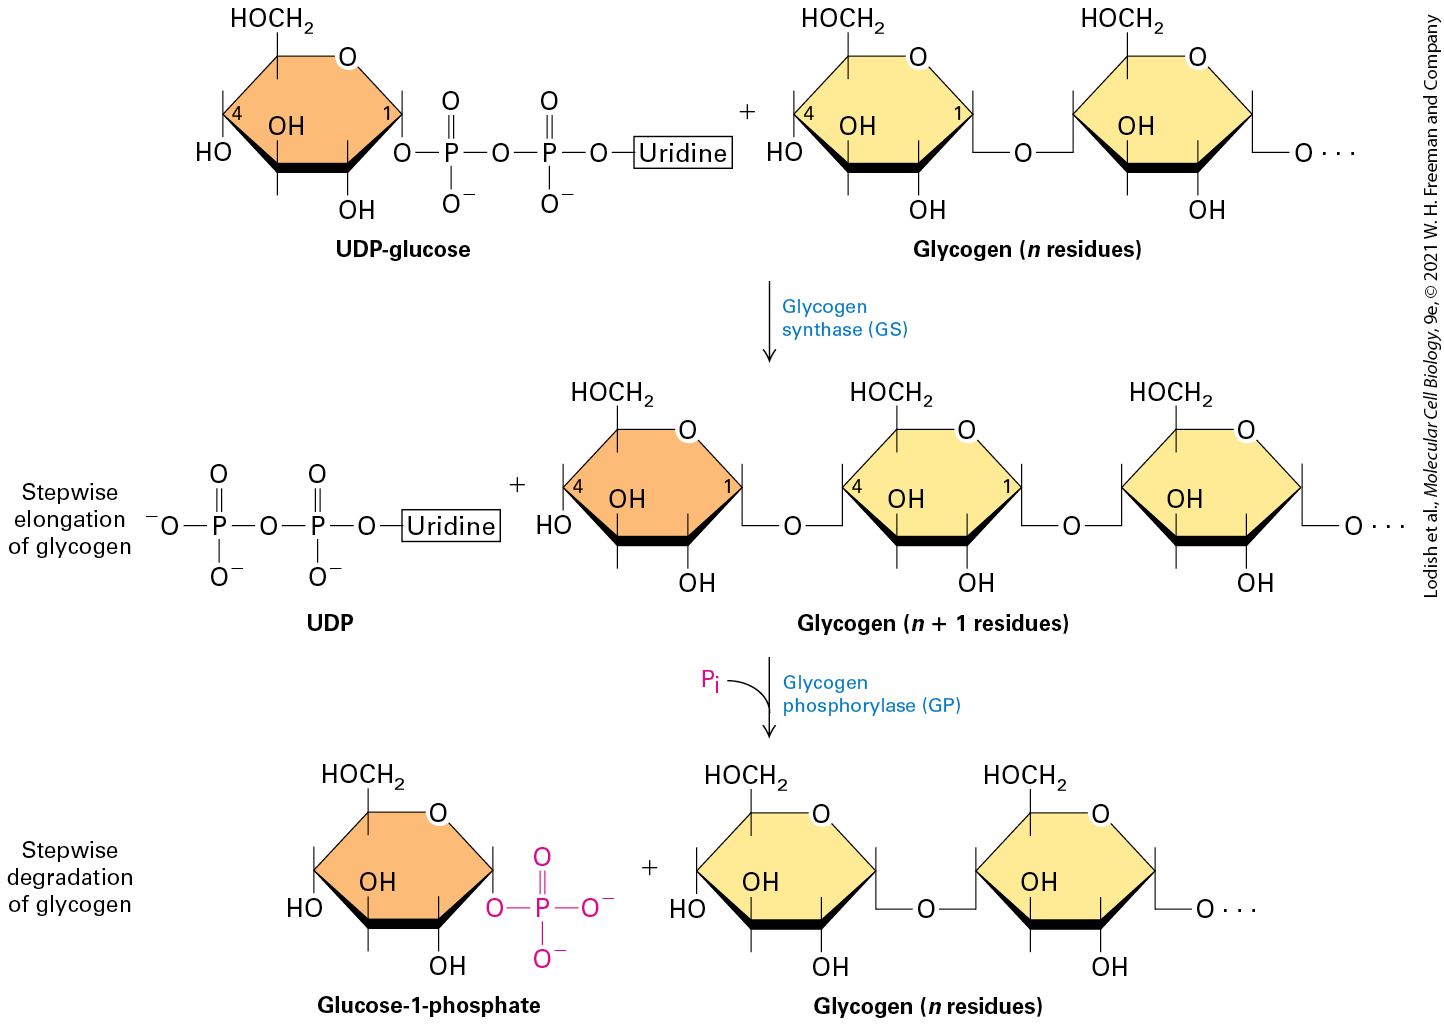
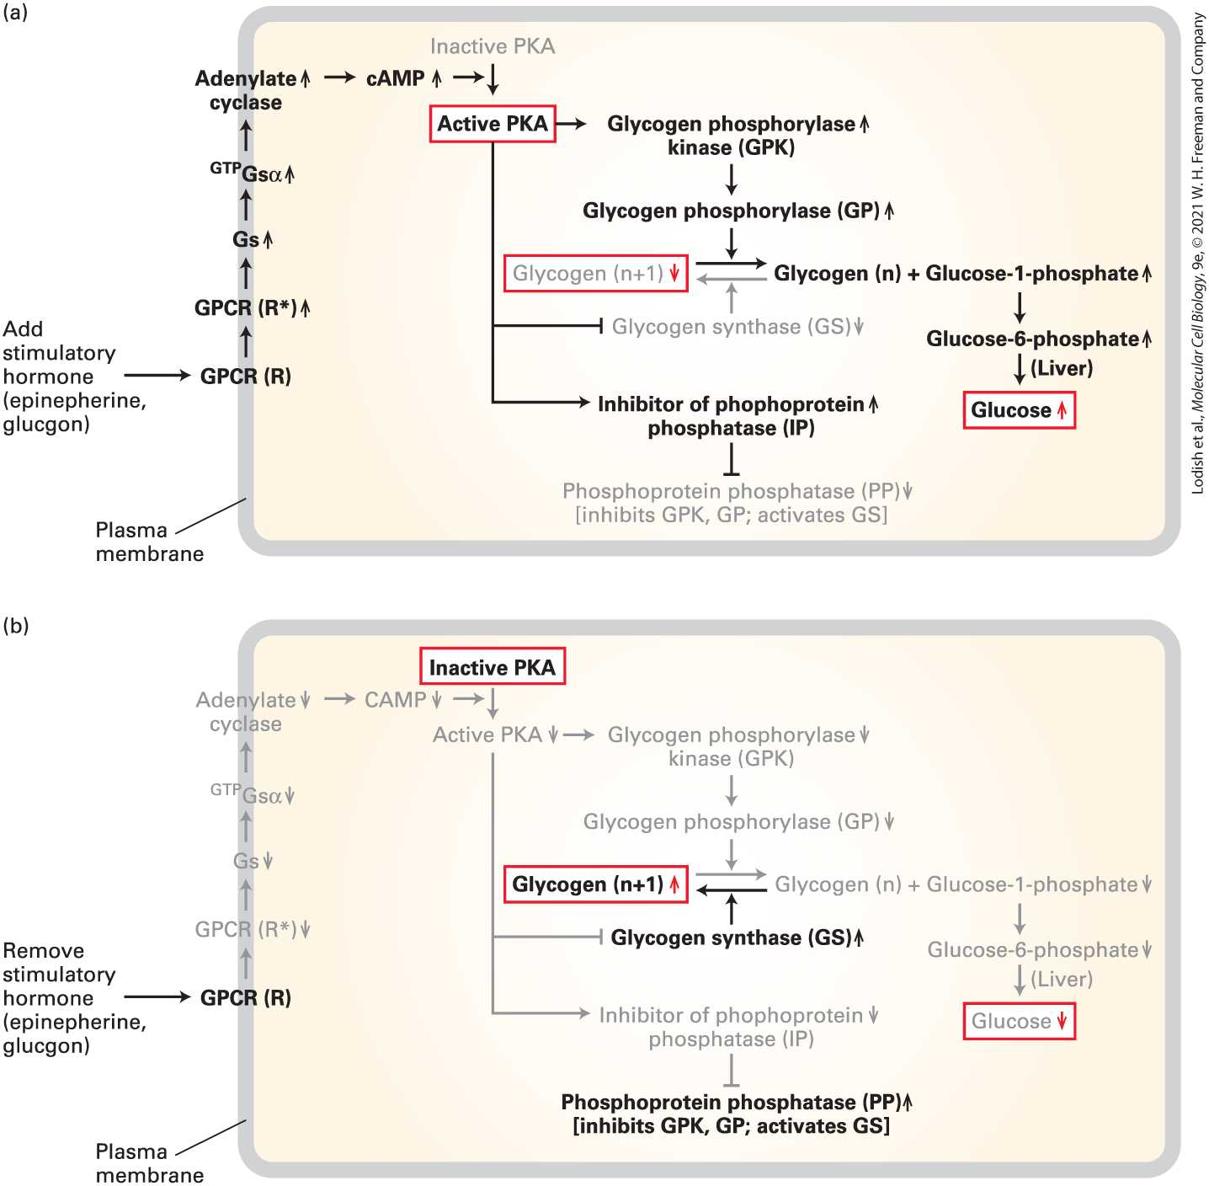
Description The illustration labeled (a) titled poorly active P K A kinase shows a semi-transparent space-filling structure in which there is a ribbon structure containing an activation loop. The activation loop has a color different from that of the ribbon. Below this is a threedimensional model of the poorly active P K A kinase. The active site and the activation loop are labeled. The illustration labeled (b) titled active P K A kinase shows a semi-transparent spacefilling structure in which there is a ribbon structure containing an activation loop. The activation loop has a color different from that of the ribbon. A space-filling model of A T P, p T 1 9 7, and a substrate of a different color are also present attached to the ribbon. An arrow from the three-dimensional model of the poorly active P K A kinase labeled activation by phosphorylation of activation loop points at the three-dimensional model of active P K A kinase where its threonine 197 phosphorylated activation loop is attached to A T P. Many proteins are substrates for multiple kinases, each of which usually phosphorylates different amino acids in the protein. Each phosphorylation event has the potential to modify the activity of a particular target protein in a different way, some activating its function, others inhibiting it. An example we will encounter later is glycogen phosphorylase kinase, a key regulatory enzyme in glucose metabolism (see Figure 15-22). When activated by a signal transduction pathway, this enzyme phosphorylates and thereby activates the enzyme that breaks down glycogen into glucose. In many cases, addition of a phosphate group to an amino acid creates a binding surface that allows a second protein to bind; in the following chapter and Chapter 19 we will encounter many examples of kinase-driven assembly of multiprotein complexes.
GTP-Binding Proteins Are Frequently Used in Signal Transduction Pathways as On/Off Switches
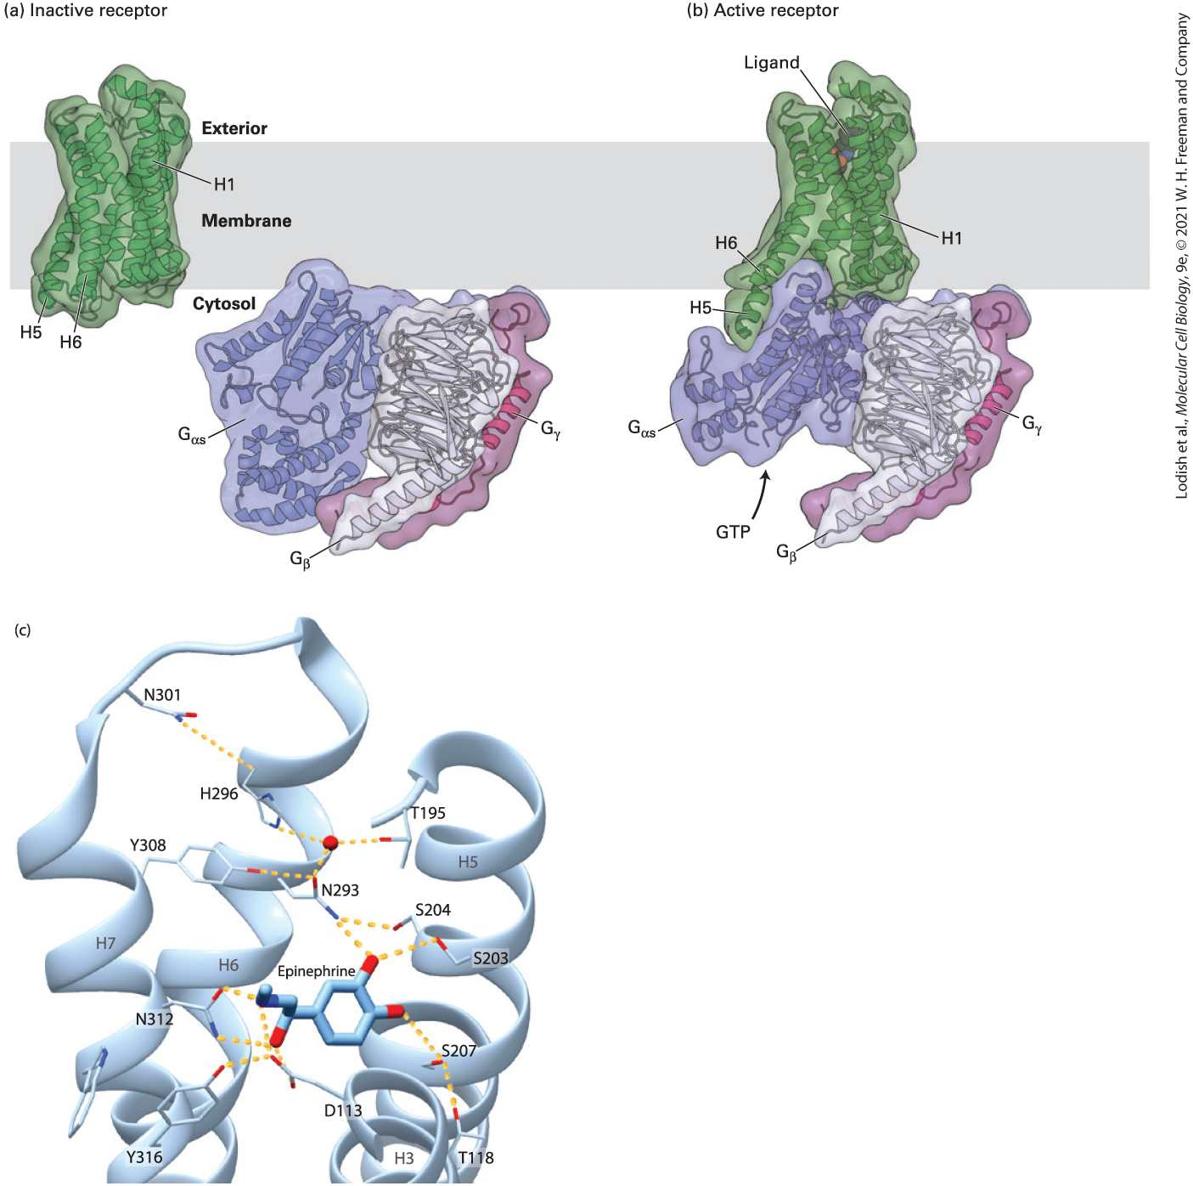
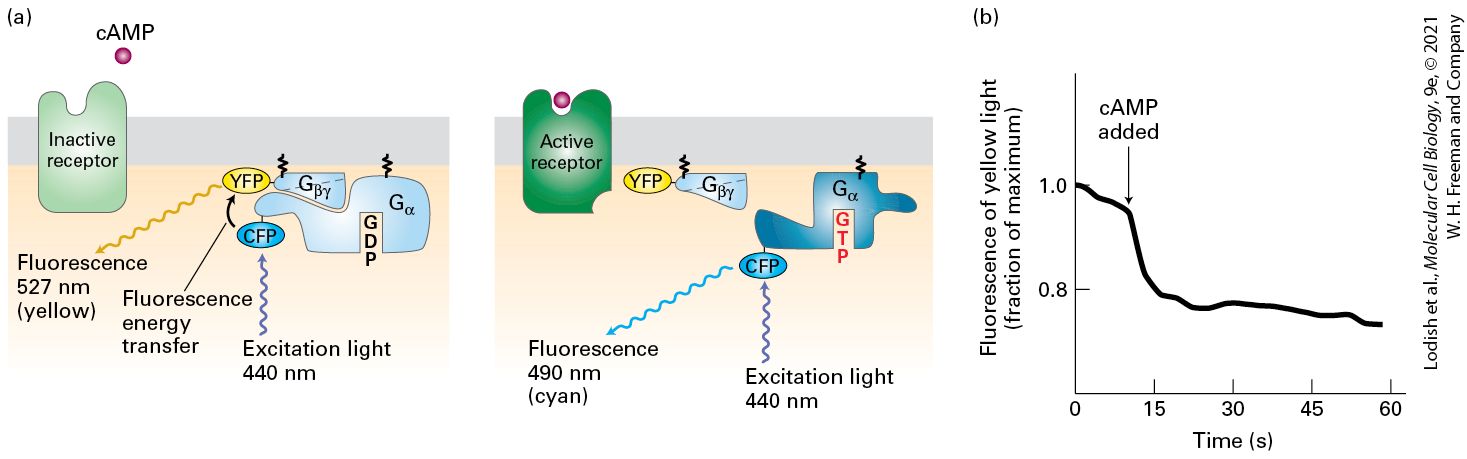
Importantly, the activity of all protein kinases is opposed by the activity of protein phosphatases, some of which themselves are regulated by extracellular signals. Thus the activity of a protein in a cell can be a complex function of the activities of multiple kinases and phosphatases that act on it. Several examples of this phenomenon that occur in regulation of the cell cycle are described in Chapter 19. GTP-Binding Proteins Are Frequently Used in Signal Transduction Pathways as On/Off Switches Many signal transduction pathways contain members of the GTPase superfamily of proteins, which are found in all prokaryotic and eukaryotic cells. All of these proteins bind GTP and all can be turned off and on like a molecular switch. They exist in two forms (see Figure 3-35): (1) an active (“on”) form with bound GTP (guanosine triphosphate) and (2) an inactive (“off”) form with bound GDP (guanosine diphosphate). The GTP-bound “on” form binds to and modulates the activity of specific target proteins, whereas the “off” form cannot affect the activity of target proteins. Two large classes of GTPase switch proteins are used in signal transduction pathways. Heterotrimeric G proteins directly bind to and are activated by certain cell-surface receptors. As we see in Section 15.3, G protein–coupled receptors function as guanine nucleotide exchange factors (GEFs): that is, they activate the heterotrimeric G protein to which
they are coupled by triggering its release of GDP. The G protein then spontaneously binds GTP, favored by the high intracellular concentration of GTP relative to that of GDP. Binding of GTP induces a conformational change in the G protein to the active, “on” form (see Figure 3-35). The principal conformational changes involve two highly conserved segments of the GTP-binding protein, termed switch I and switch II, that allow the protein to bind to and activate downstream signaling proteins (Figure 157).
FIGURE 15-7 Switching mechanism of monomeric G proteins. The ability of a G protein to interact with other proteins and thus transduce a signal differs between the GTP-bound “on” state and GDP-bound “off” state. (a) In the active “on” state, two domains, termed switch I (green) and switch II (blue), are bound to the terminal γ phosphate of GTP through interactions with the backbone amide groups of conserved threonine and glycine residues. When bound to GTP in this way, the two switch domains are in a conformation such that they can bind to and thus activate specific downstream effector proteins. (b) Removal of the γ phosphate by GTPase-catalyzed hydrolysis causes switch I and switch II to relax into a different conformation, the inactive “off” state; in this state, they are unable to bind to effector proteins. The ribbon models shown here represent both conformations of Ras, a monomeric G protein. A similar spring-loaded mechanism switches the alpha subunit in heterotrimeric G proteins between the active and inactive conformations by movement of three, rather than two, switch segments. [Data from I. Vetter and A. Wittinghofer, 2001, Science 294:1299.] Description The illustration labeled (a) is titled G T P-bound "on" state of a G protein. The whitish crescent shape has an area on the left colored blue and labeled Switch 2 (2 is a roman numerical), with G l y-60 as a dot at the top. This part leans inward over a gamma phosphate group and a G D P-binding pocket. On the right side of the crescent is another area colored green and labeled Switch 1 (1 is a roman numerical), with T h r-35 at the top. This side also leans inward towards the pocket. A semi-transparent spacefilling 3-D model below shows a ribbon structure inside it with the following parts highlighted: Switch 2, G l y- 60, T h r- 35, and switch 1. The illustration labeled (b) is titled G D P-bound "off" state of a G protein. In this illustration, the G D P pocket is empty. The two ends of the crescent are upward and not labeled. The semi-transparent space-filling three-dimensional model below shows a ribbon structure inside it with the following parts highlighted: Switch 2, G l y- 60, T h r35, and switch 1.
Signal Amplification and Feedback Repression Characterize Most Signal Transduction Pathways
After a brief time, the active G protein is shut off, converting back to the inactive form. A GTPase, which is often part of the GTP-binding protein itself, slowly hydrolyzes the bound GTP to GDP and , thereby altering the conformation of the switch I and switch II segments so that they are unable to bind to the target protein. The rate of GTP hydrolysis determines the length of time the GTP-binding protein remains in the active conformation and is able to signal its downstream target proteins: the slower the rate of GTP hydrolysis, the longer the protein remains in the active, GTP-bound state. The rate of GTP hydrolysis is often modulated by other proteins. For instance, both GTPase-activating proteins (GAPs) and regulators of G protein signaling (RGSs) accelerate GTP hydrolysis (see Figure 3-35). Many regulators of G protein activity are themselves controlled by extracellular signals. Monomeric (often called low-molecular-weight) G proteins, including Ras and various Ras-like proteins such as Ran and Sar, do not directly bind to receptors but act as intermediate proteins in signal transduction pathways (Chapter 16). Monomeric G proteins play crucial roles in many pathways that regulate cell division and cell motility. For this reason, mutations in genes encoding these G proteins frequently lead to cancer. Signal Amplification and Feedback Repression Characterize Most Signal Transduction Pathways
Two essential features of most signal transduction pathways are signal amplification and feedback repression. In amplification (see Figure 15-1, step 3 ), a single signaling molecule binding to one receptor protein can substantially alter the activity of a biochemical pathway within a cell. For instance, we see later in the chapter that a single photon absorbed by a photoreceptor in a rod cell in the eye (the physical stimulus) produces a measurable change in the membrane electrical potential. The process that enhances the effect of a signaling molecule is called amplification. In amplification, the activation of a single receptor molecule can lead to activation of more than one molecule of a downstream intermediate protein in the signal transduction pathway. Each intermediate protein can also activate multiple proteins downstream of it, resulting in a cascade of activation. The extent of amplification depends on the number of steps in the signal transduction cascade and on the relative concentrations of the various components. As discussed later in the chapter, we are able to detect a flash of as few as five photons because the signal transduction pathway amplifies the signal from a few photons enough to change the activities of and ion channels responsible for the change in membrane potential. The ability to respond to a single photon makes night vision possible. Cells must be able to suppress or even turn off a signal transduction pathway once the cell has adequately responded to the signal or the signal has been removed. Virtually all signal transduction pathways have feedback controls that will shut down the pathway: once activated, an effector protein modifies either the receptor or one of the proteins that
operates in the early stages of the signal transduction pathway, thus blocking the downstream cellular responses (see Figure 15-1, steps 6a and 6b ). In many pathways, these feedback controls trigger loss of receptor activity or even receptor degradation, lowering the number of functional receptors. The cell thus becomes much less sensitive to the ligand. Such feedback responses are sometimes referred to as adaptation. We next describe how cell-surface receptors and signal transduction proteins are identified and characterized biochemically, focusing on components of signal transduction pathways that have been conserved through evolution. We then turn to an in-depth discussion of a very large and evolutionarily conserved class of receptors found in organisms from fungi to humans: the G protein–coupled receptors. Other large classes of cell-surface receptors and the intracellular signaling pathways they activate are explored in Chapter 16. KEY CONCEPTS OF SECTION 15.1 Signal Transduction Pathways: From Extracellular Signal to Cellular Response All cells communicate through extracellular signals. In unicellular organisms, extracellular signaling molecules regulate interactions between individuals, while in multicellular organisms, they mainly regulate physiology and development. Extracellular signals include membrane-anchored and secreted proteins or peptides (e.g., vasopressin and insulin), small hydrophobic molecules (e.g., steroid hormones and thyroxine), small hydrophilic molecules (e.g., epinephrine), gases (e.g., , nitric oxide), and physical stimuli (e.g., light, touch). Hydrophobic signaling molecules interact with cytosolic or nuclear receptors and mainly affect gene expression. Binding of a hydrophilic extracellular signaling molecule to a cell-surface receptor triggers a conformational change in the receptor, which in turn leads to activation of
intracellular signal transduction pathways that ultimately modulate cellular metabolism, function, or gene expression. Signals from one cell act on distant cells in endocrine signaling, on nearby cells in paracrine signaling, or on the signaling cell itself in autocrine signaling. Most receptors bind only a single type of ligand or a group of closely related ligands and with high affinity. Second messengers such as cAMP and are found in many signal transduction pathways. Protein kinases, protein phosphatases, and GTP-binding switch proteins participate in most signal transduction pathways. Signal transduction pathways allow amplification of an extracellular signal, enabling activation of a relatively small number of receptors to trigger major changes in cell metabolism, movements, or gene expression. Virtually all signal transduction pathways have feedback controls whereby an effector protein modifies and inhibits an early protein in the pathway, blocking an early step in that pathway.
Binding Assays Are Used to Detect Receptors and Determine Their Affinity and Specificity for Ligands
15.2 Studying Cell-Surface Receptors and Signal Transduction Proteins How a cell responds to external signals depends on the cell’s complement of receptors that bind the signals as well as on the signal transduction pathways activated by these receptors. In this section, we examine experimental techniques used to characterize receptors and other signal transduction proteins. Many of these methods are also used to characterize the receptors that mediate endocytosis (see Chapter 14) or cell adhesion (see Chapter 20). We conclude the section with a discussion of techniques commonly used to measure the activity of signal transduction pathway components, such as kinases and GTP-binding switch proteins, and to study the mechanisms that regulate these signaling proteins. Binding Assays Are Used to Detect Receptors and Determine Their Affinity and Specificity for Ligands An experiment called a binding assay is used to quantify the number of receptors on a cell surface and determine how tightly they bind to a ligand . Receptors (R) are usually detected and quantified by their ability to bind ligands (L) that have been added to the fluid surrounding intact cells,
cell fragments, or purified receptors. In many experiments, the ligands are radioactively or fluorescently labeled to permit easy measurement of their binding. The ligand and receptor are allowed to incubate together until they reach equilibrium binding. Then unbound ligand is removed and the amount of ligand bound to receptors (RL) is measured — for example, by putting the sample in a machine that can detect the amount of radioactivity or fluorescence. One often measures the amount of ligand bound to the receptor at different ligand concentrations. A plot of the amount of ligand bound to the receptor [RL] versus the amount of free ligand [L], called a ligand-binding or saturation curve, can be seen in the red line in Figure 15-8. Such a plot generally follows Equation 15-4, which is simply an algebraic transformation of Equations 15-2 and 15-3. (15-4)
FIGURE 15-8 Binding assays determine the and the number of receptors per cell, but the maximal physiological response to an external signal occurs when only a fraction of the receptors are occupied by ligand. In a typical experiment to determine the affinity of a receptor for a ligand, radioactively or otherwise labeled ligand is incubated with control cells that do not express the receptor of interest and with the same cells that have been altered by recombinant DNA techniques to express the receptor on their surface. Incubation is generally for an hour at 4 °C; the low temperature is used to prevent endocytosis of the cell-surface receptors. The cells are then separated from unbound ligand, usually by centrifugation and washing with buffer, and the amount of radioactivity bound to the cells is measured. Background binding by control cells is subtracted from the binding to the receptor-expressing cells, and the amount of bound ligand per cell is calculated and plotted (red curve) as a function of the ligand concentration. Note that even at relatively high ligand concentrations, the number of receptor-bound ligand molecules approaches, but does not equal, the number of cell-surface receptors. Nonetheless, by fitting of the data to Equation 15-4, one can determine that these cells express 1000 receptors for this ligand and that the for binding of the ligand is 1 nM. In parallel experiments, the physiological response of the cell to increasing concentrations of ligand is also measured (blue curve). Typically, the plots of the extent of ligand binding to the receptor and of physiological response at different ligand concentrations differ. In the example shown here, 50 percent of the maximal physiological response is induced at a ligand concentration at which only 18 percent of the receptors are occupied. Likewise, 80 percent of the maximal response is induced when the ligand concentration equals the value, at which 50 percent of the receptors are occupied. Description In the graph, the vertical axis represents the number of ligand molecules bound per cell ranging from 100 to 1000 in increments of 200. The vertical axis on the right represents fraction of maximal physiological response ranging from 0 to 1 in increments of 0.2. The horizontal axis represents concentration of ligand added to binding reaction in nanomoles ranging from 1 to 4 in increments of 1. There are two curves, corresponding to physiological response (in blue) and number of ligand molecules bound per cell (in purple). Both curves rise sharply and the plateau out, but the purple curve rises less quickly and is lower than the blue curve. The intersection with the purple curve at 0.5 on the right vertical-axis gives a value of 1 nanomole on
the horizontal axis, corresponding to the dissociation constant, while that of the blue curve yields a value of about 0.2. The intersection with the blue curve at 0.8 on the right vertical-axis corresponds to the value of the dissociation constant on the horizontal-axis, 1 nanomole. Each line extends to a scale labeled fraction of maximal physiological response. The blue extension dotted line ends just below 1.0. The purple extension dotted line ends just below the blue line. The concentration of unbound ligand ([L]) is shown on the horizontal axis, and the amount of receptor-ligand complex, usually expressed as the amount of receptor-bound ligand (RL), is shown on the vertical axis. In most cases, the absolute amount of ligand initially added into the extracellular fluid, often referred to as the medium, is vastly in excess of the total amount of cell-surface receptors. Thus even after some of the ligand has bound to the receptors, there is essentially no reduction in the concentration of unbound ligand in the medium. As a consequence, one can assume that the concentration of free (unbound) ligand [L] at the end of the incubation is equal to the concentration of ligand initially added to the fluid. In practice, as the concentration of ligand in the medium increases, the number of receptor-ligand complexes approaches but never actually reaches the total number of cell-surface receptors (see Figure 15-8). The maximal amount of binding that actually occurs is proportional to the total number of receptors present on the cells . The maximal amount of binding is one of two parameters that characterize a simple receptor-ligand binding assay, where each receptor protein has a single binding site and thus can bind only one ligand (see Equations 15-2 and 15-3 and Chapter 2). The other is the dissociation constant , which is an indication of how tightly the ligand binds to the
Near-Maximal Cellular Response to a Signaling Molecule Usually Does Not Require Activation of All Receptors
receptor. Note that the concentration of ligand that results in half of the receptors being bound at equilibrium is equal to (Equation 15-2). The tighter the binding of a ligand to its receptor, the lower the concentration of ligand needed to achieve binding to 50 percent of the receptors. Computer curve-fitting programs are typically used to calculate the and values from data such as those in Figure 15-8. Using this approach, one can calculate from this binding curve that there are 1000 receptors per cell surface and that the for binding this ligand is , or 1 nM. Near-Maximal Cellular Response to a Signaling Molecule Usually Does Not Require Activation of All Receptors The extent of the cellular response to a particular signaling molecule depends on the number of receptor-ligand complexes. In general, much less than 100 percent of its receptors need to be bound to the ligand to induce the maximal cellular response. One can observe this phenomenon by comparing the extent of the cellular response (blue curve in Figure 158) and the amount of ligand-bound receptors at different concentrations of the ligand. For example, an erythroid progenitor cell in the bone marrow has 1000 surface receptors for erythropoietin, the protein hormone that induces these cells to proliferate and differentiate into red blood cells; the for erythropoietin binding is 1 nM. But only 180 of these receptors (18 percent of the total) need to bind erythropoietin to induce 50 percent of the
Sensitivity of a Cell to External Signals Is Determined by the Number of Cell-Surface Receptors and Their Affinity for Ligand
maximal cellular response (i.e., the division of the progenitor cell in this case). Thus the shape of the curve showing the dependence of a cellular response on ligand concentration differs from that of the curve for ligand binding (red curve in Figure 15-8). The ligand concentration needed for a cellular response that is 50 percent of the maximum is considerably lower than the value. Sensitivity of a Cell to External Signals Is Determined by the Number of Cell-Surface Receptors and Their Affinity for Ligand Because the cellular response to a particular signaling molecule depends on the number of receptor-ligand complexes, the fewer receptors for a ligand present on the surface of a cell, the less sensitive the cell is to that ligand. As a consequence, a higher ligand concentration is necessary to induce the physiological response than would be the case if more receptors were present. Of course, if the cell has no receptors, there can be no response. In contrast, if the level of a receptor for a particular ligand is increased, the cell will become more sensitive to the ligand. That is, fewer ligand molecules need be present to induce a response. Epidermal growth factor (EGF), as its name implies, stimulates the proliferation of many types of epithelial cells (see Chapters 16 and 20), including those that line the ducts of the mammary gland. In about 25
Chemical Analogs of Signaling Molecules Are Used to Study Receptors and Are Widely Used as Drugs
percent of breast cancers, the tumor cells have elevated levels of one particular type of EGF receptor called HER2. The overproduction of HER2 makes the cells hypersensitive to ambient levels of EGF and related hormones. Normal levels of EGF are too low to stimulate cell proliferation, but in the presence of excess HER2, even normal levels of EGF stimulate growth of tumor cells. We will see in Chapters 16 and 25 that researchers have developed monoclonal antibodies that bind HER2 and thereby block signaling by EGF; these antibodies have proved useful in treatment of breast cancer patients whose tumors overexpress HER2. The HER2–breast cancer connection vividly demonstrates the importance of regulating the number of receptors for a given signaling molecule. Such regulation can occur at the levels of transcription, translation, and posttranslational processing. Alternatively, endocytosis can remove receptors from the cell surface, often leading to their degradation in lysosomes, reducing their numbers so much that the cellular response is effectively eliminated. As we discuss in later sections of this chapter, other mechanisms can reduce a receptor’s affinity for ligand. This reduction of a cell’s sensitivity to a particular ligand, called desensitization, can dramatically reduce the ability of cells to respond appropriately to external signals. Chemical Analogs of Signaling Molecules Are Used to Study
Receptors and Are Widely Used as Drugs Synthetic analogs of natural signaling molecules, including hormones, are widely used both in research on cell-surface receptors and clinically as drugs. These analogs fall into two major classes. Agonists mimic the function of a natural hormone by binding to its receptor and inducing the allosteric conformational change that activates the downstream signal transduction pathway and thus the normal cellular response to the hormone. Many synthetic agonists bind much more tightly to the receptor than does the natural hormone. In contrast, antagonists bind to the receptor, usually at the normal ligandbinding site, but do not induce a conformational change. As a consequence, antagonists induce no cellular response. By occupying ligand-binding sites on a receptor, an antagonist can block binding of a natural hormone (or agonist) and thus reduce the hormone’s usual physiological activity. In other words, antagonists inhibit receptor signaling stimulated by the natural ligand. Consider, for instance, the drug isoproterenol, one of the first epinephrine agonists used to treat asthma. Isoproterenol is made by the chemical addition of two methyl groups to epinephrine (Figure 15-9). Isoproterenol is an agonist of the epinephrine receptor (called the adrenergic receptor, see Section 15.4) on bronchial smooth muscle cells.
The drug binds about tenfold more tightly than does epinephrine; that is, it has a tenfold lower . When activated, adrenergic receptors cause bronchial smooth muscle to relax, opening the air passages in the lungs. Because of this effect, isoproterenol and other agonists that have greater affinity and greater specificity for the adrenergic receptor are used in treating bronchial asthma, chronic bronchitis, and emphysema.
FIGURE 15-9 Structures of the natural hormone epinephrine, the synthetic agonist isoproterenol, and the synthetic antagonist alprenolol. As discussed in the text, isoproterenol and alprenolol, both of which bind to receptors for epinephrine, are used as drugs to treat different conditions.
Receptors Can Be Purified by Affinity Chromatography Techniques
Description Epinephrine: It has a benzene group where C 1 and C 2 are each bonded to a hydroxyl group. C 4 is bonded to a methine group bonded to a hydroxyl group and a methylene group which is further bonded to an amide cation further bonded to a methyl group. Isoproterenol: It has a benzene group where C 1 and C 2 are each bonded to a hydroxyl group. C 4 is bonded to a methine group bonded to a hydroxyl group and a methylene group which is further bonded to an amide cation further bonded to a methine group bonded to two methyl groups. Alprenolol: It has a benzene ring where C 1 is bonded to an oxygen atom, which is further bonded to a methylene group bonded to a methine group bonded to a hydroxyl group and another methylene group further bonded to an amide cation further bonded to a methine group bonded to two methyl groups. C 2 is bonded to a methylene group bonded to a methine group further double bonded to a methylene group. A different type of epinephrine-responsive receptor is present on cardiac muscle cells (called the -adrenergic receptor). Its activation increases the heart’s contraction rate. Antagonists of this receptor, such as alprenolol (see Figure 15-9) and related compounds, are referred to as beta-blockers; such antagonists are used to slow heart contractions in the treatment of cardiac arrhythmias and angina. Receptors Can Be Purified by Affinity Chromatography Techniques In order to study how receptors function, it is first necessary to purify them. For example, once an investigator has a sample of a purified protein, its molecular structure with and without a bound ligand can be determined
in order to elucidate the conformational changes that occur upon ligand binding. Separating integral membrane cell-surface receptors from other cellular proteins is very challenging. A typical mammalian cell can have between 1000 to 50,000 copies of a single type of cell-surface receptor. This may seem like a large number, but consider that this same cell contains total protein molecules, with of them in the plasma membrane alone; these receptors constitute only 0.1 to 5 percent of plasma-membrane proteins. This low abundance complicates the isolation and purification of cell-surface receptors. Purification of these integral membrane proteins is also difficult because the membrane must first be solubilized with a non-ionic detergent (see Figure 10-23) while maintaining the three-dimensional structure of the receptor and its ability to bind ligand. Only then can the receptors be separated from other cellular molecules. Recombinant DNA techniques can often be used to generate cells that express large amounts of receptor proteins. Even then, special techniques are necessary to isolate the receptors from other membrane proteins. A type of affinity chromatography is often used in purifying cell-surface receptors that retain their ligand-binding ability when they are solubilized by detergents (see Figure 3-44c). Either an antibody that recognizes the receptor or a ligand for the receptor is chemically linked to the beads used to form a column. A crude, detergent-solubilized preparation of membrane proteins is then passed through the column. Only the receptor protein, together with other proteins tightly bound to it, will stick to the column; other proteins are washed away. Once the other proteins are removed, the receptors can be released (“eluted”) from the column either by passage of
Immunoprecipitation Assays and Affinity Techniques Can Be Used to Study the Activity of Protein Kinases
an excess of the soluble ligand through the column (ligand affinity chromatography) or by changing chemical conditions such as pH to release the receptor from the antibody (antibody affinity chromatography). In some cases, a receptor can be purified as much as 100,000-fold in a single affinity-chromatographic step. After purification, membrane receptors can be studied either in their detergent-soluble form or after reconstitution into membrane bilayers in vitro (see Chapter 11). Immunoprecipitation Assays and Affinity Techniques Can Be Used to Study the Activity of Protein Kinases Following ligand binding, receptors activate one or more signal transduction proteins that, in turn, can affect the activity of multiple target effector proteins (see Figures 15-1 and 15-3). Understanding a signaling cascade requires the researcher to be able to quantitatively measure the activity of these signal transduction proteins. As kinases are found in many signaling cascades, in this section we describe several assays used for measuring their activity. As noted above, any particular kinase can be in an inactive form or in a partially or completely active form, depending in part on which signal transduction pathways have been activated. The amount of activity exhibited by any given kinase will depend on the amount of kinase protein present and the fraction of that kinase protein that is in the active form. Thus investigators are often interested in determining the fraction of a
Immunoprecipitation of Kinases
particular kinase protein in a cell that is enzymatically active as well as the total enzymatic activity of that kinase. Immunoprecipitation of Kinases Immunoprecipitation assays, a type of antibody affinity chromatography (see Figure 3-44c), are frequently used to measure the activity of a particular kinase in a cell extract. As there are hundreds of kinases in eukaryotic cells, it is necessary first to purify the kinase of interest in order to measure its enzymatic activity without interference from other kinases. In one version of the immunoprecipitation method, an antibody specific for the desired kinase is first incubated with small beads coated with protein A; this causes the antibody to bind to the beads via its Fc segment (see Figure 4-33). The beads are then mixed with an extract of the whole cell or of an organelle, such as the nucleus, then recovered by centrifugation and washed extensively with a salt solution to remove weakly bound proteins that are unlikely to be binding specifically to the antibody. Thus only cell proteins that specifically bind to the antibody — the kinase itself and proteins tightly bound to the kinase — are present on the beads. To measure its activity, the kinase isolated on the beads is exposed to its substrates. The beads are incubated in a buffered solution with a substrate protein and ATP, in which only the γ phosphate of the ATP is radiolabeled. The amount of transferred covalently to the substrate protein is a measure of the amount of active kinase on the beads. That
Western Blotting with a Monoclonal Antibody Specific for a Phosphorylated Amino Acid in a Protein
amount can be determined by separating the substrate protein and measuring the substrate-associated radioactivity. For example, the substrate can be isolated by polyacrylamide gel electrophoresis followed by autoradiography to determine the amount of covalently attached (see Figure 3-42), or it can be isolated by immunoprecipitation with an antibody specific for the substrate followed by measurement of the radioactivity in the immunoprecipitate. By comparing extracts from cells before and after ligand addition, for example, whether or not a particular kinase is activated in the signal transduction pathway(s) triggered by that ligand can be readily determined. Western Blotting with a Monoclonal Antibody Specific for a Phosphorylated Amino Acid in a Protein We noted above that many protein molecules can be phosphorylated by more than one kinase, each kinase phosphorylating the molecule on different serine, threonine, or tyrosine residues. To understand how such protein substrates are phosphorylated and how such multiple phosphorylations influence the protein’s activity and alter cell function, it is sometimes necessary to measure the extent of phosphorylation of only one of several phosphorylation sites in a specific protein, usually doing so before and after ligand addition.
Antibodies play a crucial role in detecting phosphorylation events at specific sites on the protein. It is often possible to generate an antibody that can bind to the protein of interest only when the site of interest on the protein — the hydroxyl group on the side chain of serine, threonine, or tyrosine — has been phosphorylated. To do so, a mouse is immunized (see
Chapter 24) with a small peptide, approximately 15-amino-acids long, that has the sequence of the phosphorylation site of interest and that is phosphorylated. The phosphopeptide is called an antigen and it is usually chemically synthesized and then coupled to an adjuvant (see Chapter 24) to increase its immunogenicity, prior to immunizing the mouse. From the immunized mouse a set of monoclonal antibodies can be generated (see
Figure 4-6). Then a particular monoclonal antibody is selected that reacts only with the phosphorylated but not the nonphosphorylated peptide; such an antibody generally will bind to the protein only when it is phosphorylated on the particular amino acid of interest. This specificity is possible because the antibody binds simultaneously to the phosphorylated amino acid and to side chains of adjacent amino acids. As an example of the use of such antibodies, Figure 15-10 shows that three signal transduction proteins in erythroid progenitor cells become phosphorylated on specific amino acid residues within 10 minutes of stimulation by varying concentrations of the hormone erythropoietin (Epo); phosphorylation, which is the first step in triggering the differentiation of these cells into red blood cells, increases with Epo concentration. As is described in the next chapter, each of these signal transduction proteins activates different downstream effectors, including different transcription factors.
EXPERIMENTAL FIGURE 15-10 Activation by the hormone erythropoietin (Epo) of three signal transduction proteins via their phosphorylation. Mouse erythrocyte progenitor cells were treated for 10 minutes with different concentrations of the hormone erythropoietin (Epo). Extracts of the cells were analyzed by Western blotting with three different antibodies specific for the phosphorylated forms of three signal transduction proteins and three other antibodies that recognize a nonphosphorylated segment of amino acids in each of the same proteins. These data show that with increasing concentrations of Epo, the three proteins become phosphorylated. Treatment with 1 unit Epo/ml is sufficient to maximally phosphorylate and thus activate all three pathways. phosphorylated on tyrosine 694; phosphorylated on serine 473; MAP kinase phosphorylated on threonine 202 and tyrosine 204. [Data from J. Zhang et al., 2003, Blood 102:3938.] Description The photo shows the western blot analysis of the three signal transduction proteins and their phosphorylated forms on exposure to different concentrations of erythropoietin.
GTP-Binding Signal Transduction Proteins Can Be Isolated and Their Activities Measured Using Pull-Down Assays
The concentrations used are 0, 0.01, 0.03, 0.1, 0.3, 1.0, and 5.0 units per milliliter. The total amount of protein and the amount of phosphorylated protein were assayed. For s t a t-5, the total amount remains constant, whereas the phosphorylated amount increases from 0.03 onward. For P K B, the total amount remains constant, while bands for the phosphorylated form appear at 0.1 units per milliliter of E P O and become heavier on increasing concentration. For p 4 2 or P 4 4, the total amount remains constant, and bands for the phosphorylated form appear at 0.01 units per milliliter of E P O and become darker with increasing concentration. GTP-Binding Signal Transduction Proteins Can Be Isolated and Their Activities Measured Using Pull-Down Assays We noted that two large classes of GTPase switch proteins are used in signal transduction pathways: heterotrimeric G proteins that directly bind to and are activated by certain cell-surface receptors, and monomeric (often called low-molecular-weight) G proteins. The principal assay for measuring activation of this class of proteins takes advantage of the fact that each switch protein has one or more targets to which it binds, but only when it is bound to GTP, not GDP; the target protein usually has a specific binding domain that binds to the switch segments of that GTP-bound protein. Pull-down assays used to quantify the activation of a specific GTP-binding protein are similar to immunoprecipitation assays, except that, rather than an antibody, the
domain of the target protein that binds the GTP-bound GTP-binding protein is immobilized on small beads (Figure 15-11a). The beads are mixed with a cell extract; the beads bind any of the GTP-bound GTPbinding protein present in the extract; and then the beads are separated from the unbound components in the cell extract by centrifugation. The amount of the active, GTP-bound GTP-binding protein on the beads can be quantified using an antibody to the GTP-binding protein and Western blotting. Figure 15-11b shows that in blood-forming stem cells, the fraction of the small GTPase Rac that has a bound GTP increases markedly after stimulation by the hormone platelet-derived growth factor (PDGF), indicating that Rac is a signal transduction protein activated by the PDGF receptor.
EXPERIMENTAL FIGURE 15-11 A pull-down assay shows that the small GTP-binding protein Rac is activated by platelet-derived growth factor (PDGF). Like other small GTPases, Rac regulates molecular events by cycling between an inactive GDP-bound form and an active GTP-bound form. In its active (GTP-bound) state, Rac binds specifically to the Rac binding (PBD) domain of p21-activated protein kinase (PAK1) to control downstream signaling cascades. (a) Assay principle: the Rac-binding PBD domain is generated by recombinant DNA techniques and attached to agarose beads, then mixed with cell extracts (step 1 ). The beads are specifically recovered by centrifugation (step 2 ), and the amount of GTP-bound Rac is quantified by Western blotting using an anti-Rac antibody (step 3 ). (b) Western blot showing activation of Rac after treatment of bloodforming stem cells for 1 minute with the hormone platelet-derived growth factor (PDGF). A Western blot for actin serves as a control to show that the same amount of total protein is loaded on each lane of the gel. [Part (b) Republished with permission from The American Society of Hematology, from G. Ghiaur et. al., 2006, “Inhibition of RhoA GTPase Activity Enhances Hematopoietic Stem and Progenitor Cell Proliferation and Engraftment,” Blood 108:2087–2094; permission conveyed through Copyright Clearance Center, Inc.] Description The illustration labeled (a) shows two test tubes containing lysate number 1, which has low G T P-bound R a c content and lysate 2, which has a high G T P-bound R a c content. The G T P-bound R a c and G D P-bound R a c are represented by tiny colored spheres. Step 1: P A K 1 P B D agarose represented by c shaped molecules is added to both the test tubes. Step 2: The test tubes are mixed and centrifuged which causes a pull-down of G T Pbound R a c, leaving the G D P-bound R a c float above. Step 3: R a c from both test tubes is washed and immunoblotted. The blot for the first test tube shows a dotted horizontal line. The blot for the second test tube shows a horizontal line. The photo labeled (b) shows Western blot results of blood-forming stem cells before and after treatment with P D G F. The result before treatment with P G D F shows a very
Concentrations of Free Ca2+ in the Mitochondrial Matrix, ER, and Cytosol Can Be Measured with Targeted Fluorescent Proteins
light band at 0 and a heavy dark band at 1. It is labeled R a c G T P (visualized with anti-R a c antibody). The result after P G D F shows dark bands on both 0 and 1. It is labeled beta actin (visualized with anti-actin antibody). Concentrations of Free in the Mitochondrial Matrix, ER, and Cytosol Can Be Measured with Targeted Fluorescent Proteins The concentration of the second messenger changes in response to many different signal transduction systems, and such changes can influence the activities of many cellular proteins. Chapter 4 describes how the fluorescent small-molecule dye fura-2 can be used to measure the concentration of free ( not bound to proteins) in the cytosol of live cells. Fura-2 fluorescence at a certain wavelength increases when is bound. The technique depends on the fact that a chemically modified version of fura-2, in which the carboxylic acid residues are in an ester linkage, spontaneously diffuses into the cytosol from extracellular fluids. Enzymes in the cell cytosol cleave off these ester groups, forming free fura-2 that cannot diffuse out of the cytosol and whose fluorescence reports the concentration of free in the cytosol. Several proteins also emit light or their emitted light changes color when they bind . An advantage of these proteins is that they can be used experimentally to determine the free concentration not just in the
cytosol but also within subcellular compartments. Cells can be transfected with cDNA expression vectors that encode these proteins, which have been altered to include a signal sequence that targets the protein to a particular subcellular compartment (Chapter 13). One such protein is aequorin, a calcium-activated bioluminescent protein isolated from the hydrozoan Aequorea victoria. As expressed in cells by recombinant DNA technologies, aequorin consists of a protein subunit fused with a signal sequence that targets it to a specific organelle, such as the ER lumen (see Figure 13-6) or the mitochondrial intermembrane space or matrix (see Figure 13-26). Aequorin contains three EF hands (see
Chapter 3) that function as binding sites for . When the smallmolecule prosthetic group coelenterazine is added to the culture medium, it diffuses into the cell and binds to aequorin, and the cell emits light at a specific wavelength proportional to the concentration of free in that subcellular space. KEY CONCEPTS OF SECTION 15.2 Studying Cell-Surface Receptors and Signal Transduction Proteins The concentration of ligand at which half the ligand’s receptors are occupied, the dissociation constant , can be determined experimentally and is a measure of the affinity of the receptor for the ligand. The near-maximal response of a cell to a particular ligand generally occurs at ligand concentrations at which less than 100 percent of its receptors are bound to the ligand. Affinity chromatography techniques can be used to purify receptors even when they are present in low abundance. Immunoprecipitation using antibodies specific for protein kinases can be used to measure the activity of these kinases.
Western blotting assays using antibodies specific for phosphorylated peptides can measure phosphorylation of a specific amino acid on any desired protein within a cell. Pull-down assays using the protein-binding domain of a target protein can be used to quantify activation of a GTP-binding protein within a cell. The concentration of free in a subcellular space can be measured using fura-2 or genetically engineered aequorin proteins.
15.3 Structure and Mechanism of G Protein–Coupled Receptors
15.3 Structure and Mechanism of G Protein–Coupled Receptors In this section, we introduce the most numerous class of receptors: the G protein– coupled receptors (GPCRs). The human genome encodes about 800 functional GPCRs, which constitute about 4 percent of the identified human proteins. These detect and respond to many different types of signals, including odorants, tastants, neurotransmitters, hormones involved in glycogen and fat metabolism, growth factors, and even physical stimuli (photons of light). Many GPCRs are found primarily in cells of the central nervous system and are used in neuronal signaling, as we will learn in Chapter 23. GPCRs are of immense medical importance, as approximately 35 percent of all drugs used in humans are agonists or antagonists of GPCRs, and at last count 134 GPCRs are targets of drugs approved in the United States or the European Union. Table 15-1 describes just a few of these drugs; note the wide variety of receptors targeted by these drugs and the diverse diseases that they treat.
TABLE 15-1 • Human G Protein–Coupled Receptors of Pharmaceutical Importance Receptor Natural Ligand Location Physiological Function Drug Medical Use Histamine H2 receptor Histamine Acidsecreting cells of the stomach Stimulates acid secretion Cimetidine (Tagamet) Ranitidine (Zantac) (antagonists) Prevent acid stomach; treat peptic ulcers Histamine H1 receptor Histamine Smooth muscles, vascular endothelial cells Increases vascular permeability and causes Fexofenadine (Allegra) Loratadine (Claritin) (antagonists) Reduce symptoms of allergy
symptoms of allergy Serotonin Serotonin Central nervous system Synaptic transmission between neurons Clozapine, risperidone (antagonists) Treat schizophrenia Serotonin Serotonin Central nervous system Synaptic transmission between neurons Buspirone (BuSpar) (agonist) Treat depression, general anxiety disorder Angiotensin Angiotensin II Vascular smooth muscle cells Constrict blood vessels and increase blood pressure Losartan (Cozarr) (antagonist) Reduce hypertension - adrenergic receptor Epinephrine Smooth muscle cells lining the airway Facilitate respiration Salmeterol (Severent) (agonist) Treatment of asthma, chronic obstructive pulmonary disease Leukotrienes Lungs, bronchial tubes, mast cells Contracts smooth muscles Montelukast (Singulair) (antagonist) Treatment of asthma, seasonal allergies SOURCE: A. Wise et al., 2002, Drug Discovery Today 7:235–246. All GPCR signal transduction pathways share the following common elements: (1) a membrane-imbedded receptor that contains seven membrane-spanning α helices; (2) a heterotrimeric G protein, which functions as a receptor-activated switch by cycling between an active GTP-bound and an inactive GDP-bound state; (3) a membrane-bound effector protein; and (4) proteins that participate in amplification and desensitization of the signaling pathway. Protein kinases and second messengers such as cAMP and often participate in GPCR-mediated signal transduction pathways. These pathways usually have short-term effects in the cell by quickly modifying the activities of existing proteins, including
Ligand-Activated G Protein–Coupled Receptors Catalyze Exchange of GTP for GDP on the α Subunit of a Heterotrimeric G Protein
The glutamate receptor is an excitatory neurotransmitter receptor in family C of GPCRs (Figure 15-13c). The long extracellular segment forms a sort of venus flytrap domain that clamps around and binds the glutamate ligand. Many members of this class of GPCRs dimerize through their venus flytrap domains. Like most receptors, GPCRs are allosteric proteins (Chapter 3). Binding of the ligand at the extracellular surface causes a conformational change in the receptor that enables the cytosol-facing segment of the receptor to bind to and activate the heteromeric G protein, the next intracellular component of the GPCR signal transduction pathway — hence the name G-protein coupled receptor. Ligand-Activated G Protein–Coupled Receptors Catalyze Exchange of GTP for GDP on the α Subunit of a Heterotrimeric G Protein The first signal transduction step after the activation of GPCRs by their ligands is the activation of heterotrimeric G proteins (Figure 15-16). These G proteins contain three subunits, designated α, β, and γ. Guanine nucleotides (GTP or GDP) bind to the subunit. The and subunits have covalently attached fatty acids that insert into the inner leaflet of the plasma membrane and allow the G protein subunits to be in close proximity to the GPCR. The β and γ subunits are always bound tightly together and are usually referred to as the subunit. As we see shortly, the subunit dissociates and reassociates with the subunit, depending on its activation state.
FIGURE 15-16 General mechanism of the activation of effector proteins associated with G protein–coupled receptors. Light green denotes the inactive and dark green the active conformations of the GPCR. The and subunits of a heterotrimeric G protein are tethered to the membrane by covalently attached lipid molecules (wiggly black lines). Following ligand binding, the receptor undergoes a conformational change enabling it to bind to the subunit of the G protein, triggering dissociation of the GDP and binding of GTP, concomitant with dissociation of the protein subunits. In some cases (a) the free subunit diffuses in the plasma membrane and binds to and activates an effector protein. In others (b), the free subunit binds to and activates an ion channel or other target protein. Hydrolysis of GTP terminates signaling and leads to reassembly of the heterotrimeric G protein, returning the system to the resting state. Binding of another ligand molecule causes repetition of the cycle. [Data from W. Weis and B. Kobilka, 2018, Annu. Rev. Biochem. 87:897.] Description The illustration labeled (a) shows the cell membrane and represented by a gray line. At the left, a yellow sphere travels toward the inactive receptor, which is in the membrane labeled agonist binding. Below the receptor is a group of structures labeled G D P bound G protein. The structures are labeled alpha, beta, and gamma. An arrow goes to the right (and includes an arrow that goes back to the left to indicate two-way movement), Once the yellow sphere attaches to the receptor, the G D P bound G protein binds to the receptor and activates it. After the attachment of G protein to the receptor, the G D P dissociates and the G T P binds to the G protein. To the right, a purple structure in the membrane is labeled effector enzyme protein, is attached to G T P bound alpha subunit of G protein. The illustration labeled (b) shows a two-part blue structure labeled
target ion channel protein on the membrane attached to beta and gamma subunits of G protein. A positive ion enters the cell through the target ion channel protein. In the resting state, when no ligand is bound to the receptor, the subunit has a GDP bound to its nucleotide binding site and the GDP is complexed with , forming a heterotrimer . Binding of a ligand to a G protein–coupled receptor alters the conformation of its transmembrane helices and enables the receptor to bind to the subunit of the intact heterotrimeric G protein containing GDP (Figures 15-14 and 15-16). The binding of epinephrine to the β-adrenergic receptor provides an example of how the change in receptor conformation allows binding to the subunit. When unbound by ligand and in the inactive conformation (R), the receptor (see Figure 15-14a) has no surface that is complementary to the G protein and thus cannot bind to it. The binding of the agonist induces major conformational changes in this receptor: there are substantial movements of transmembrane helices 5 and 6 and changes in the structure of the C3 cytosol-facing loop that connects these helices. Together, these changes create a surface that can now bind to a segment of the subunit of (see Figure 15-14b). Binding of the GPCR to the subunit of induces a change in the conformation of the GDP-binding site on , allowing a lobe of the protein to move and thus release the GDP. Next because of its higher concentration in the cytosol, GTP rapidly binds to the empty guanine nucleotide site in the subunit. Thus the activated ligand-bound receptor functions as a guanine nucleotide exchange factor for . GTP binding to induces a change in the conformation of its switch segments (see Figure 15-7), leading the subunit to dissociate from the subunit and from the GPCR. All three elements can now diffuse independently in the plane
of the cytosolic face of the plasma membrane. The freed, ligand-bound, activated
is then able to activate another , and thus amplify the signal from the receptor-ligand complex. In most cases the released then mediates the next step of the signal transduction pathway. While remaining anchored in the plasma membrane, binds to and activates a downstream effector protein (Figure 15-16a). In some cases, inhibits, rather than activates, the effector. As we see below, there are various types of protein subunits that interact with different receptors and effectors. In some cases (Figure 15-16b), depending on the type of cell and G protein involved, it is the subunit, freed from the subunit, that transduces a signal by interacting with an effector protein. For example, muscarinic acetylcholine receptors are a type of GPCR found in cardiac muscle; when activated by binding acetylcholine, these receptors slow the rate of heart muscle contraction. Following receptor activation, the released subunit binds to and opens a channel (the effector protein) in the plasma membrane (see Figure 1516b). The subsequent efflux of ions out of the cytosol causes an increase in the magnitude of the usual inside-negative potential across the plasma membrane that lasts for several seconds, a change that reduces muscle contraction. In all cases, the active state is relatively short-lived because the bound GTP is hydrolyzed to GDP in seconds to minutes. The hydrolysis of GTP is catalyzed by the intrinsic GTPase activity of the subunit itself. The subunit thus switches from the active to the inactive conformation that can no longer interact with downstream effector proteins but can quickly reassociate with forming . The cycle is complete and can interact with an activated receptor and start the process all over again.
The rate of GTP hydrolysis by is sometimes enhanced by its binding to an effector that also functions as a GTPase-activating protein (GAP). This feedback mechanism significantly reduces the duration of effector activation and prevents the cell from overreacting. In many cases, another type of GAP protein, called a regulator of G protein signaling (RGS), can accelerate GTP hydrolysis by , further reducing the time during which the can activate its downstream effector. Thus built-in feedback mechanisms ensure that the effector protein remains activated for only a few seconds or minutes following receptor activation. Prolonged signaling is possible only if receptors are kept continually active by ligand binding, so that these receptors can continue to activate the corresponding G protein. Early evidence supporting the model that hydrolysis of the GTP in (see
Figure 15-16) is important for GPCR signal transduction pathways came from studies using compounds that are structurally similar to GTP, called GTP analogues. These compounds can bind as well as GTP to the GTP binding sites in subunits but cannot be hydrolyzed by the intrinsic GTPase. In some of these compounds, the phosphodiester linkage connecting the β and γ phosphates of GTP is replaced by a nonhydrolyzable or linkage. Such a GTP analog can be added to a plasma-membrane preparation containing a particular receptor in the presence of an agonist. The nonhydrolyzable GTP analog is exchanged for GDP on , and thus both the protein and its associated effector protein remain activated for much longer than occurs when GTP is bound. Many investigators use a nonhydrolyzable analogue called GTP-γS for such studies.
The dissociation of heterotrimeric G proteins after binding to a GPCR can be detected in live cells. These studies have exploited the phenomenon of Förster resonance energy transfer (FRET), which changes the wavelength of emitted fluorescence when two fluorescent molecules interact (see Figure 4-23). Figure 15-17 shows how this experimental approach has demonstrated the dissociation of the complex within a few seconds after ligand addition, providing evidence for the rapid dissociation of the heterotrimeric G protein. This general experimental approach can be used to follow the formation and dissociation of other protein-protein complexes in live cells. EXPERIMENTAL FIGURE 15-17 Activation of a G protein occurs within seconds of ligand binding to its cell-surface G protein–coupled receptor. In the amoeba Dictyostelium discoideum, cAMP acts as an extracellular signaling molecule that binds to and signals via a G protein–coupled receptor; cAMP is not a second messenger. Amoeba cells were engineered to express two genes encoding two fusion proteins: a fused to cyan fluorescent protein (CFP) and a fused to yellow fluorescent protein (YFP). CFP normally fluoresces 490-nm light; YFP, 527-nm light. (a) When CFP and YFP are close to each other, as in the resting complex, resonance energy transfer can occur between them (left). As a result, irradiation of resting cells with 440-nm light (which directly excites CFP but not YFP) causes emission of 527-nm (yellow) light, characteristic of YFP, because of resonance energy transfer from CFP to YFP. However, if ligand binding leads to dissociation of the and subunits, then resonance energy transfer cannot occur. In this case, irradiation of cells at 440 nm causes emission of 490-nm (cyan) light, characteristic of CFP (right). (b) Plot of the emission of yellow light (527 nm) from a single transfected amoeba cell before and after addition of extracellular cAMP (arrow). The drop in yellow fluorescence, which results from the dissociation of the fusion protein from the fusion protein, occurs within seconds of cAMP addition. [Data from C. Janetopoulos et al., 2001, Science 291:2408.]
Different G Proteins Are Activated by Different GPCRs and in Turn Regulate Different Effector Proteins
Description The illustration labeled (a) shows a membrane containing a transmembrane inactive receptor and a signal molecule, cyclic A M P represented by a purple sphere is above the receptor. The cytosolic side of the membrane has a trimeric G-protein, with yellow fluorescent protein on the Gbeta-gamma subunit, and cyan fluorescent protein on the G-alpha subunit. When the G-protein trimer is associated, cyan fluorescent protein is excited at 440 nanometers and passes, by fluorescence energy transfer, energy to the yellow fluorescent protein, which fluoresces at 527 nanometers. When the trimer is dissociated due to the attachment of cyclic A M P with the receptor, excitation by light at 440 nanometers leads to cyan fluorescence at 490 nanometers. In the graph labeled (b), the vertical axis plots fluorescence of yellow light (fraction of the maximum fluorescence) ranging from 0.8 to 1 in an increment of 0.2. The horizontal axis plots time in seconds ranging from 0 to 60 in increments of 15. The approximate data values are as follows. The line graph starts at (0, 1.0), gradually decrease at (10, 0.98), after the addition of c A M P the line sharply declines and reaches (15, 0.8), gradually decreases and ends at (60, 0.75). Some bacterial toxins contain a subunit that penetrates the plasma membrane of cells, such as those that line the small intestine, and, once in the cytosol, catalyzes a chemical modification of proteins that prevents hydrolysis of bound GTP to GDP. An important example is the toxin produced by the bacterium Vibrio cholerae, which causes cholera. As a result, remains in the active state, continuously activating its effector protein adenylyl cyclase (described in Section 15.4) even though no hormone is present to activate the receptor. The resulting excessive rise in the intracellular second messenger cAMP leads to the loss of electrolytes and water from these intestinal cells into the intestinal lumen, producing the watery diarrhea characteristic of infection by these bacteria. Different G Proteins Are Activated by Different GPCRs and in Turn Regulate
Different Effector Proteins All effector proteins in GPCR signal transduction pathways are either membranebound ion channels or membrane-bound enzymes that catalyze the formation of one or more of the second messengers shown in Figure 15-9. The variations on the theme of GPCR signaling that we examine in Sections 15.4, 15.5, and 15.6 and in later chapters arise because eukaryotic genomes encode multiple G proteins with distinct activities. Humans have 21 different subunits: 6 subunits and 12 subunits. The 21 subunits are encoded by 16 genes, several of which undergo alternative splicing. So far as is known, the different subunits are interchangeable in their functions, while the different subunits provide specificity to the various G proteins. Thus we can refer to the entire three-subunit G protein by the name of its α subunit. The heterotrimeric G proteins are usually assigned to one of four classes based on the sequences of their α subunits.
Table 15-2 summarizes the functions of the major classes of G proteins with different subunits and the effector proteins they activate.
TABLE 15-2 • Major Classes of Mammalian Heterotrimeric G Proteins and Their Effectors Class Associated Effector Second Messenger Receptor Examples Adenylyl cyclase cAMP (increased) β-Adrenergic (epinephrine) receptor; receptors for glucagon, serotonin, vasopressin Adenylyl cyclase channel ( activates effector) cAMP (decreased) Change in membrane potential -Adrenergic receptor Muscarinic acetylcholine receptor Adenylyl cyclase cAMP (increased) Odorant receptors in nose Phospholipase C , DAG (increased) -Adrenergic receptor i
Analysis of GPCRs Has Identified Important Human Hormones
Phospholipase C , DAG (increased) Acetylcholine receptor in endothelial cells cGMP phosphodiesterase cGMP (decreased) Rhodopsin (light receptor) in rod cells A given subclass may be associated with more than one effector protein. To date, only one major has been identified, but multiple and proteins have been described. Effector proteins commonly are regulated by but in some cases by or the combined action of and . 1,4,5-trisphosphate; . SOURCES: L. Birnbaumer, 1992, Cell 71:1069; Z. Farfel et al., 1999, New Engl. J. Med. 340:1012; and K. Pierce et al., 2002, Nat. Rev. Mol. Cell Biol. 3:639. Analysis of GPCRs Has Identified Important Human Hormones The GPCRs represent the largest protein family in the human genome. Approximately half of the genes encoding these proteins are thought to encode sensory receptors; of these, the majority are in the olfactory system and bind odorants (see Chapter 23). The first GPCRs to be discovered were found by using their well-known hormone ligands as bait to fish for the corresponding receptor. Subsequently, many GPCRs were initially identified by searching genome sequences for genes whose protein coding sequences had high similarity to previously identified GPCRs (e.g., the β-adrenergic receptors and rhodopsin) and whose predicted proteins would have seven transmembrane α helices. The natural ligands for these putative receptors were not known, and so they were called orphan receptors — that is, putative GPCRs without known ligands. Over time, the natural ligands of some — but not all — of these have been identified. Many of the remaining orphan receptors are likely to bind signaling molecules that have not yet been identified, including novel peptide hormones. i
One approach that has proved fruitful in identifying the ligands of orphan GPCRs involves expressing the gene encoding the receptor in transfected cells and using the cells as a reporter system to detect substances in tissue extracts that activate the receptor and its downstream signal transduction pathway. This approach led to the discovery of two novel peptides, termed orexin-A and orexin-B (from the Greek orexis, meaning “appetite”), that were identified as the ligands for two orphan GPCRs that are members of the B family of GPCRs that includes the glucagon receptor (see Figure 15-13b). Further research showed that the orexin gene is expressed only in the hypothalamus, the part of the brain that regulates feeding. Injection of orexin into the brain ventricles of animals caused them to eat more, and expression of the orexin gene increased markedly during fasting. Both of these findings are consistent with orexin having a role in increasing appetite. Strikingly, mice deficient in orexins suffer from narcolepsy, a disorder characterized in humans by excessive daytime sleepiness (in mice, which are nocturnal, nighttime sleepiness). Moreover, recent reports suggest that the orexin system is dysfunctional in a majority of human narcolepsy patients: orexin peptides cannot be detected in their cerebrospinal fluid (although there is no evidence of mutation in their orexin genes). These findings firmly link orexin neuropeptides and their receptors to both feeding behavior and sleep in humans and other animals. They also illustrate the importance of GPCRs in human physiology. KEY CONCEPTS OF SECTION 15.3 Structure and Mechanism of G Protein–Coupled Receptors G protein–coupled receptors (GPCRs) are a large and diverse group of proteins with a common structure of seven membrane-spanning α helices and an internal ligand-binding pocket that is specific for particular ligands. Different families of GPCRs bind their ligands in different manners, but binding always alters receptor conformation so that it is able to bind to and activate a G protein. GPCRs are coupled to heterotrimeric G proteins, which contain three subunits designated α, β, and γ. The subunit is a GTPase switch protein that alternates between an active (“on”) state
with bound GTP and inactive (“off”) state with bound GDP. The “on” form dissociates from the β and γ subunits and activates a membrane-bound effector. The β and γ subunits remain bound together and in some cases activate an effector. Ligand binding causes a conformational change in certain membrane-spanning helices and intracellular loops of the GPCR, allowing it to bind to its coupled subunit and function as a guanine nucleotide exchange factor (GEF), catalyzing dissociation of GDP and allowing GTP to bind. The resulting change in the conformation of the switch region in causes it to dissociate from the subunit and the receptor and interact with an effector protein. Signaling is terminated when the GTP bound to the subunit is hydrolyzed to GDP, triggering reassociation of with . FRET experiments demonstrate receptor-mediated dissociation of coupled and subunits in live cells. The effector proteins activated (or inactivated) by heterotrimeric G proteins are either enzymes that form second messengers (e.g., adenylyl cyclase, phospholipase C) or ion channels. In each case, it is the subunit that determines the function of the G protein and affords its specificity. GPCRs can have a range of cellular effects depending on the subtype of receptor that binds a ligand. The hormone epinephrine, for example, which mediates the fight-or-flight response, binds to multiple subtypes of GPCRs in multiple cell types, with varying physiological effects. Efforts to de-orphan GPCRs led to the discovery of orexins, hormones that regulate feeding behavior and sleep in both animals and humans.
15.4 Regulating Metabolism of Many Cells: G Protein–Coupled Receptors That Activate or Inhibit Adenylyl Cyclase
15.4 Regulating Metabolism of Many Cells: G Protein–Coupled Receptors That Activate or Inhibit Adenylyl Cyclase To illustrate the importance of GPCRs in human metabolism and physiology, in this section we consider a GPCR that is activated by the hormone epinephrine. Epinephrine is particularly important in mediating the body’s response to stress, also known as the fight-or-flight response. During moments of fear or heavy exercise, when the need for energy may increase, epinephrine (or its derivative, norepinephrine) is released by the adrenal gland. This hormone binds to -adrenergic receptors on the surfaces of hepatic (liver) and adipose (fat) cells, and induces these target cells to rapidly break down either glycogen to glucose (liver) or triacylglycerols to fatty acids (fat). Within seconds of their generation, these metabolic fuels are secreted into the blood and taken up by muscle and other cells, which use them to generate ATP. The activated -adrenergic receptor induces exchange on a stimulatory G protein . The released GTP-bound alpha subunit activates a membrane-bound effector enzyme called adenylyl cyclase (see Figures 15-16 and 15-18). Once activated, this enzyme catalyzes synthesis from ATP of the second messenger cAMP, which is
able to diffuse throughout the cell (Figure 15-18). cAMP activates a specific protein kinase, called protein kinase A (PKA), that in turn phosphorylates effector proteins that mediate the diverse metabolic effects in different cells.
FIGURE 15-18 Synthesis of cAMP by adenylyl cyclase and hydrolysis of cAMP by cAMP phosphodiesterase (PDE). Similar reactions occur for production of cGMP from GTP and hydrolysis of cGMP. Description An illustration shows a reaction where A T P gets converted to c A M P in the presence of adenylyl cyclase. Here, P P subscript i is eliminated. c A M P gets converted to A M P in the presence of c A M P phosphodiesterase (P D E). A proton (H superscript plus) is released from water (H subscript 2 O). Adenosine triphosphate (A T P): A T P has a Haworth projection of ribose which has a pyranose ring where C 1 is bonded to N 9 of the adenine group at the top and a hydrogen atom at the bottom. C 2 and C 3 are each bonded to a hydrogen atom at the top and a hydroxyl group at the bottom. C 4 and is bonded to a methylene group on top and a hydrogen atom at the bottom. The methylene group is further bonded to the oxygen atom of a phosphate group further bonded to two more phosphate groups. Each phosphate group has a central phosphorus atom bonded to three oxygen atoms, two of which are anions; and double bonded to another oxygen atom. Adenine has a cyclohexane ring fused with a cyclopentane ring. C 1, C 3, C 7, and C 9 are each replaced by a nitrogen atom. C 2 and C 8 are each bonded to a hydrogen atom. C 6 is bonded to an amide group. Double bonds are present between C 2 and C 3, C 4 and C 5, and N 7 and C 8. Cyclic adenosine monophosphate: c A M P has a furanose ring where C 1 is bonded to N 9 of an adenine group on the top and a hydrogen atom at the bottom. C 2 is bonded to a hydrogen atom at the top and a hydroxyl group at the bottom, C 3 is bonded to a hydrogen atom at the top and an oxygen atom at the bottom which is further bonded to a phosphorous atom which is further double and single bonded to an oxygen atom, an oxygen anion, and another oxygen atom respectively. The single bonded oxygen atom is further bonded to C 5 which is a methylene group bonded to C 4. C 4 is bonded to a hydrogen atom at the bottom. Adenine has a cyclohexane ring fused with a cyclopentane ring. C 1, C 3, C 7, and C 9 are each replaced by a nitrogen atom. C 2 and C 8 are each bonded to a hydrogen atom. C 6 is bonded to an amide group. Double bonds are present between C 2 and C 3, C 4 and C 5, and N 7 and C 8.
Adenylyl Cyclase Is Stimulated and Inhibited by Different Receptor-Ligand Complexes
Adenosine monophosphate (A M P): A Haworth projection of ribose has a pyranose ring where C 1 is bonded to N 9 of the adenine group at the top and a hydrogen atom at the bottom. C 2 and C 3 are each bonded to a hydrogen atom at the top and a hydroxyl group at the bottom. C 4 is bonded to a methylene group on top and a hydrogen atom at the bottom. The methylene group is further bonded to the oxygen atom of a phosphate group. The phosphate group has a central phosphorus atom bonded to three oxygen atoms, two of which are anions; and double bonded to another oxygen atom. Adenine has a cyclohexane ring fused with a cyclopentane ring. C 1, C 3, C 7, and C 9 are each replaced by a nitrogen atom. C 2 and C 8 are each bonded to a hydrogen atom. C 6 is bonded to an amide group. Double bonds are present between C 2 and C 3, C 4 and C 5, and N 7 and C 8. In mammals, more than 30 different GPCRs activate and adenylyl cyclase; most cell types express one or more such GPCRs. Early studies of the mechanism of activation of adenylyl cyclase led to the discovery of the role of the first GTP-binding protein in receptor signaling and to a Nobel Prize. Adenylyl Cyclase Is Stimulated and Inhibited by Different ReceptorLigand Complexes To explore the pathways, we focus on an important metabolic pathway: the generation of glucose-1-phosphate from glycogen, a storage polymer of glucose (Figure 15-19). The breakdown of glycogen (glycogenolysis) is a principal way in which glucose is made available to cells in need of energy. Glycogen breakdown occurs in muscle and liver cells in response to hormones such as epinephrine and the polypeptide
hormone glucagon. This example shows how activation of a GPCR can stimulate or inhibit several intracellular enzymes, all coordinated to carry out a physiologically important task: glycogen metabolism.
FIGURE 15-19 Synthesis and degradation of glycogen. Incorporation of glucose from UDP-glucose into glycogen is catalyzed by glycogen synthase. Removal of glucose units from glycogen is catalyzed by glycogen phosphorylase. Because two different enzymes catalyze the formation and the degradation of glycogen, the two reactions can be independently regulated. Description U D P-glucose is added to Glycogen (n residues) on the top line. A downward arrow labeled glycogen synthesis (G S) shows a row labeled stepwise elongation of glycogen, and shows the U D P being added to glycogen (n plus 1 residues). A second downward arrow labeled glycogen phosphorylation (G P) shows a row labeled Stepwise
degradation of glycogen. This row shows glucose-1-phosphate being added to glycogen (n residues). U D P-glucose: The Haworth projection of U D P-glucose has a pyranose ring where C 1 is bonded to a hydrogen atom at the top and two phosphate groups at the bottom which are further bonded to a uridine group. The phosphate group has a central phosphorus atom bonded to three oxygen atoms of which one is an oxygen anion, and is double bonded to another oxygen atom. C 2 and C 4 are each bonded to a hydrogen atom at the top and a hydroxyl group at the bottom. C 3 is bonded to a hydroxyl group at the top and a hydrogen atom at the bottom. C 5 is bonded to C 6 of a hydroxymethyl group. Glycogen (n residues): The Haworth projection of glycogen is made of two Haworth projections of glucose combined together. The Haworth projection of a glucose molecule has a pyranose ring where C 1 is bonded to an oxygen atom which is further bonded to C 4 of another glucose molecule. C 2 and C 4 are each bonded to a hydrogen atom at the top and a hydroxyl group at the bottom. C 3 is bonded to a hydroxyl group at the top and a hydrogen atom at the bottom. C 5 is bonded to a hydroxymethyl group at the top and a hydrogen atom at the bottom. Glycogen (n plus 1 residues) have multiple Haworth projection of glucose molecules combined together. U D P: A uridine group is bonded to two phosphate groups. The phosphate group has a central phosphorus atom bonded to three oxygen atoms of which one is an oxygen anion, and is double bonded to another oxygen atom. Glucose 1-phosphate: The Haworth projection of glucose 1-phosphate has a pyranose ring where C 1 is bonded to a phosphate group. C 2 and C 4 are each bonded to a hydrogen atom at the top and a hydroxyl group at the bottom. C 3 is bonded to a hydroxyl group at the top and a hydrogen atom at the bottom. C 5 is bonded to a hydroxymethyl group at the top and a hydrogen atom at the bottom. In case of sudden danger, epinephrine is released by the adrenal glands. When body demand for glucose is high, such as when blood sugar is low
(hypoglycemia) or during exercise, glucagon is released by the α cells of the pancreatic islets. Epinephrine and glucagon bind to different G protein–coupled receptors — the -adrenergic receptor and the glucagon receptor, respectively — but both receptors activate the same protein, whose activates adenylyl cyclase. Hence both hormones induce the same metabolic responses. Regulation of adenylyl cyclase activity, which occurs in many cell types, provides fine-tuned control of the cAMP level and thus of the downstream cellular response (Figure 15-20). Whereas epinephrine and glucagon activate adenylyl cyclase, other GCPR ligands may inhibit it. For example, binding of two other hormones, prostaglandin and adenosine, to their respective G protein–coupled receptors activates the inhibitory protein, whose active subunit binds to and inhibits adenylyl cyclase, lowering cAMP levels and shutting off cellular responses.
FIGURE 15-20 Hormone-induced activation and inhibition of adenylyl cyclase in adipose cells. Ligand binding to -coupled receptors causes activation of adenylyl
cAMP Activates Protein Kinase A by Releasing Its Inhibitory Subunits
cyclase, whereas ligand binding to -coupled receptors causes inhibition of the enzyme. The subunit in stimulatory and in inhibitory G proteins is identical; the subunits and their corresponding receptors differ. Active complexes are formed by the same mechanism in both and proteins (see Figure 15-16). However, and interact differently with adenylyl cyclase, so that one stimulates and the other inhibits its catalytic activity. See A. G. Gilman, 1984, Cell 36:577. Description The illustration shows adenylyl cyclase, a transmembrane protein on the plasma membrane, which can be activated or deactivated by different protein complexes. On the left of adenylyl cyclase, stimulatory hormones such as epinephrine and glucagon represented by a purple sphere attach to the receptor with stimulatory G-protein complex and activate adenylyl cyclase for cyclic A M P production. On the right of adenylyl cyclase, inhibitory hormones such as P G E - 1 and adenosine represented by a diamond shape attach to the receptor with inhibitory G-protein complex and inactivate adenylyl cyclase. cAMP Activates Protein Kinase A by Releasing Its Inhibitory Subunits The second messenger cAMP, synthesized by adenylyl cyclase, is a component of many different signal transduction pathways initiated by different receptor-ligand complexes and leading to distinct cellular responses in different cell types in multicellular animals. Virtually all of the diverse effects of cAMP are mediated through its activation of protein kinase A (PKA), also called cAMP-dependent protein kinase. This protein kinase phosphorylates multiple intracellular target proteins expressed in different cell types.
Inactive PKA is a tetramer consisting of two regulatory (R) subunits and two catalytic (C) subunits (Figure 15-21a). Each of the two R subunits in an dimer has two cAMP-binding domains, called CNB-A and CNB-B, as well as a linker domain of unknown structure. At the C-terminus there is a dimerization domain that binds an AKAP protein discussed later. A segment of the CNB-A domain of the R subunit is a pseudosubstrate; its sequence resembles that of a peptide substrate and binds to the active site in the catalytic domain but is not phosphorylated. In the absence of cAMP the pseudosubstrate segment binds to this catalytic site and inhibits its activity.
FIGURE 15-21 Structure of PKA and its activation by cAMP. (a) PKA consists of two regulatory (R) subunits (blue) and two catalytic (C) subunits (pink). The two R subunits form a dimer, joined by a flexible linker and a dimerization/docking domain to which an A kinase–associated protein (AKAP; see Figure 15-25) can bind. Each R subunit has two cAMP-binding domains, CNB-A and CNB-B. In the absence of cAMP, the CNB-A domain of an R subunit binds to the catalytic site of a C subunit, inhibiting its activity. Binding of cAMP causes a conformational change in the CNB-A domain so that it can no longer bind to and inhibit the catalytic subunit, instantly activating its kinase activity. (b) Binding of cAMP to the CNB-A domain causes a subtle conformational change that displaces the C subunit from the R subunit, leading to kinase activation. Without bound cAMP, one loop of the CNB-A domain (purple) is in a conformation that can bind the catalytic (C) subunit. A glutamate (E200) and arginine (R209) residue participate in binding of cAMP (red), which causes the conformational change (green) in the loop that prevents binding of the loop to the C subunit. [Data from C. Kim, N. H. Xuong, and S. S. Taylor, 2005, Science 307:690, PDB ID 1u7e.] Description The illustration labeled (a) shows a space-filling three-dimensional model of P K A in two ways. The top model is labeled inactive and the bottom is labeled active. The pink sections are catalytic subunits. The blue sections are regulatory subunits with C N B-A domain and C N B-B domain. Below in the center, two blue lines connecting the regulatory and catalytic subunits to the binding site are labeled linker domain. The small blue area below is labeled A K A P binding site and dimerization and docking domain. A green section near the A K A P binding site is labeled A K A P. A downward arrow is labeled 4 c A M P and now the P K A is active where the regulatory and catalytic subunits separate. The illustration labeled (b) shows the conformational changes from c A M P binding. It shows a simple ribbon model with one blue and one green ribbon and c A M P in red. The green ribbon is labeled inactive inhibitory conformation with c A M P bound. The blue is labeled active inhibitory conformation with no bound c A M P and catalytic subunit-binding site. The c A M P ribbon is attached to the G L U 2000 area on the left and A R G 209 area on the right of green ribbon structure.
Glycogen Catabolism Is Stimulated by Hormone-Induced Activation of PKA
Inactive PKA is turned on by elevations in the cAMP level. Binding of cAMP to the CNB-A domain causes a change in its conformation so that it can no longer bind to and inhibit the catalytic subunit (Figure 15-21b); this releases the C subunit, instantly activating its kinase activity. cAMP binds to an R subunit of PKA in a cooperative fashion; that is, binding of the first cAMP molecule to CNB-B lowers the of CNB-A, and thus the binding of one cAMP stimulates the binding of the second cAMP and release of the R subunit from the kinase. Thus small changes in the level of cytosolic cAMP can cause relatively large changes in the number of dissociated active C subunits and, hence, in kinase activity. We will see that rapid activation of enzymes by signal-triggered dissociation of an inhibitor is a common feature of many signaling pathways. Glycogen Catabolism Is Stimulated by Hormone-Induced Activation of PKA Like all biopolymers, glycogen is synthesized by and degraded by distinct enzymes (see Figure 15-19). Glycogen degradation (glycogenolysis) involves the stepwise removal of single glucose residues from one end of the polymer, whereas glycogen synthesis (glycogenesis) involves the stepwise addition of single glucose residues. The enzyme glycogen phosphorylase (GP) catalyzes the degradation of glycogen via a phosphorolysis reaction yielding glucose-1-phosphate and a polymer shorter by one residue. The enzyme glycogen synthase (GS) uses UDPglucose and glycogen as substrates to generate glycogen that is one residue longer .
In both muscle and liver cells, glucose-1-phosphate produced by glycogen degradation is converted by the enzyme phosphoglucomutase to glucose-6phosphate. In muscle cells, glucose-6-phosphate enters the glycolytic pathway and is metabolized to generate ATP for use in powering muscle contraction (see Chapters 12 and 17). Unlike muscle cells, liver cells contain a phosphatase that hydrolyzes glucose-6-phosphate to glucose, which is exported from these cells in part by a glucose transporter (GLUT2) in the plasma membrane (see Chapter 11). Thus glycogen stores in the liver are primarily broken down to glucose, which is immediately released into the blood and transported to other tissues, particularly the muscles and brain, to nourish them. Glycogen breakdown is induced in both types of cells by increases in blood epinephrine, and hence activation of its GPCRs, as part of the fight-or-flight response. Now we can see the final steps in the signaling pathway leading to the cellular response: glycogen breakdown. Activated PKA enhances the conversion of glycogen to glucose-1-phosphate in two ways: by inhibiting glycogen synthesis and by stimulating glycogen degradation (Figure 1522a). PKA directly phosphorylates and, in so doing, inactivates glycogen synthase (GS). PKA promotes glycogen degradation indirectly by phosphorylating and thus activating an intermediate kinase, glycogen phosphorylase kinase (GPK). In turn, active GPK phosphorylates and activates GP, the enzyme that degrades glycogen.
FIGURE 15-22 Regulation of glycogen metabolism by cAMP and PKA. Active enzymes are highlighted in black; inactive forms, in gray. (a) An increase in cytosolic cAMP activates PKA, which phosphorylates glycogen synthase (GS), inhibiting its catalytic activity to synthesize glycogen. Active PKA also promotes glycogen degradation via a protein kinase cascade that activates glycogen phosphorylase, the enzyme that removes glucose moieties from glycogen (Figure 15-19). At high cAMP concentrations, PKA also phosphorylates an inhibitor of phosphoprotein phosphatase (PP). Binding of the phosphorylated inhibitor to PP prevents this phosphatase from de-phosphorylating the activated enzymes in the glycogen phosphorylase kinase cascade or the inactive glycogen
synthase. (b) A decrease in cAMP inactivates PKA, leading to release of the active form of PP. The activation of PP promotes glycogen synthesis and inhibits glycogen degradation. Description The flowchart labeled (a) shows a rectangle shape representing the plasma membrane. Along the membrane, the flow starts with the label add stimulatory hormone (epinephrine, glucagon). From the bottom left of the membrane, the highlighted steps are G P C R (R), G P C R (R asterisk), G s, G T P G s alpha, adenylate cyclase. The flow moves to the right inside of the cell and begins with c A M P, which makes the inactive P K A to active P K A. To the right, the flow goes to glycogen phosphorylase kinase (G P K), then downward to glycogen phosphorylase (G P), Glycogen (n plus 1). The flow then turns to the right to Glycogen (n) plus glucose - 1- phosphate, then downward to glucose-6-phosphate (liver) to Glucose. In the flowchart labeled (b), the flow starts with the label remove stimulatory hormone (epinephrine, glucagon). From the bottom left of the membrane, the steps involved are highlighted. The flow moves from G P C R (R) to the right inside of the cell and begins with inactive P K A. To the right, the flow goes to glycogen synthase and to Glycogen (n plus 1). The flow moves down to phosphoprotein phosphatase (P P) [inhibits G P K, G P; activates G S]. The GPK in skeletal muscle is a huge protein with multiple subunits. One subunit contains the kinase catalytic activity that activates GP and the other subunits are regulatory. One of the regulatory subunits is the ubiquitous protein calmodulin, which has four calcium ion binding sites (see Figure 3-34). In muscle, rises in the level of cytosolic trigger contraction and also an enhancement of glycogen breakdown to generate the ATP to power contraction. Two of the regulatory subunits contain phosphorylation sites for PKA. GPK enzyme activity is increased either by phosphorylation of these two regulatory subunits by PKA or by binding to the calmodulin subunit; maximal activity requires both.
Activated PKA enhances the conversion of glycogen to glucose-1phosphate in yet a third way. The activities of GPK and GP are inhibited by a phosphatase called phosphoprotein phosphatase (PP), which removes the phosphates added by PKA. In contrast, the activity of GS is increased when it is de-phosphorylated by PP. To prevent these reactions from happening, at high cAMP levels PKA phosphorylates an inhibitor of phosphoprotein phosphatase (IP), which enables it to bind to and keep this phosphatase in its inactive state (see Figure 15-22a). By this means, GPK, GP, and GS remain in their phosphorylated states, promoting glycogen breakdown. The entire process is reversed when epinephrine or another hormone activating , such as glucagon, is removed and the level of cAMP drops, inactivating PKA. When PKA is inactive, it can no longer phosphorylate IP, the inhibitor of phosphoprotein phosphatase, so the inhibitor is released and PP becomes active (Figure 15-22b). PP removes the phosphate residues previously added by PKA to GS and GPK, as well as the phosphates on GP added by GPK. As a consequence, GS becomes activated and the synthesis of glycogen by GS is enhanced. Conversely, GP becomes inactivated, and the degradation of glycogen by GP is inhibited. Thus less glucose-6-phosphate or glucose is produced. Whether induced by epinephrine or glucagon, glycogen breakdown thus exhibits dual regulation: activation of the enzymes catalyzing glycogen degradation and inhibition of enzymes promoting glycogen synthesis. Such dual regulation is an efficient mechanism for regulating a particular cellular response and is a common phenomenon in cell biology.
Signal Amplification Occurs in the cAMP-PKA Glycogen Degradation Pathway
Signal Amplification Occurs in the cAMP-PKA Glycogen Degradation Pathway Receptors such as the β-adrenergic receptor are low in abundance; typically only a few hundred or a thousand copies are present in a cell. Yet the cellular responses induced by a hormone such as epinephrine can require production of large numbers of cAMP and activated enzyme molecules per cell. As an example, following activation of -coupled receptors, the intracellular concentration of cAMP must rise to about to induce appropriate cellular responses. In a typical cell that is roughly a cube about on a side, this concentration is equivalent to 2 million molecules of cAMP per cell. Thus substantial amplification of the signal is necessary if it is to induce a significant cellular response. Signal amplification is possible in part because both receptors and G proteins can diffuse rapidly in the plane of the plasma membrane. A single epinephrine-GPCR complex converts up to a hundred inactive molecules to the active form before epinephrine dissociates from the receptor. Each active , in turn, activates a single adenylyl cyclase molecule, but that adenylyl cyclase molecule then catalyzes the synthesis of many cAMP molecules during the time is bound to it. The degree of amplification that occurs in such a signal transduction cascade depends on the number of steps in it and on the relative
concentrations of its various components. In the epinephrine-induced cascade shown in Figure 15-23, for example, blood levels of epinephrine as low as can stimulate glycogenolysis in the liver and release of glucose. An epinephrine stimulus of this magnitude generates an intracellular cAMP concentration of , an amplification of . Because three more catalytic steps precede the release of glucose, another amplification can occur, resulting in a amplification of the epinephrine signal.
FIGURE 15-23 Amplification of an extracellular signal by a signal transduction pathway involving cAMP and PKA. Binding of a single epinephrine molecule to one G protein–coupled receptor induces activation of many molecules of adenylyl cyclase, the enzyme that catalyzes the synthesis of cyclic AMP, and each of these enzyme molecules
cAMP-Mediated Activation of PKA Produces Diverse Responses in Different Cell Types
synthesizes a large number of cAMP molecules, the first level of amplification. Two molecules of cAMP activate one PKA, but each activated PKA phosphorylates and activates multiple target proteins. This second level of amplification involves several sequential reactions in which the product of one reaction activates the enzyme catalyzing the next reaction. The more steps in such a cascade, the greater the signal amplification possible. Description The flow chart starts with a red dot labeled epinephrine. On the left side of the diagram are four amplification labels, one for each layer. On the right, each layer is labeled, from top to bottom: 10 to the power minus 10 M, adenylyl cyclase, cyclic A M P (10 to the power minus 6 M), protein kinase A, activated enzyme, and product. Three arrows from the red dot, each point a triangle structure (Adenylyl cyclase). Five arrows from the center triangle, each point to two purple dots (Cyclic A M P). Five arrows from each pair of purple dots point to the green square (Protein kinase A). Five arrows from the center square, each point to orange dot (Activated enzyme). Five arrows from the center orange dot, each point to blue dot (Product). cAMP-Mediated Activation of PKA Produces Diverse Responses in Different Cell Types Epinephrine also induces the activation of PKA in adipose cells. In these cells, PKA promotes phosphorylation and activation of the lipase that hydrolyzes stored triglycerides to yield free fatty acids and glycerol. These fatty acids are released into the blood and taken up as an energy source by cells in other tissues, such as the kidney, heart, and muscles (see Chapter 12). Therefore, activation of PKA by epinephrine in two different cell types, liver and adipose cells, has different effects. Indeed, cAMP and
PKA mediate a large array of hormone-induced cellular responses in multiple tissues (Table 15-3).
TABLE 15-3 • Cellular Responses to Hormone-Induced Rise in cAMP in Various Tissues Tissue Hormone Inducing Rise in cAMP Cellular Response Adipose Epinephrine; ACTH; glucagon Increase in hydrolysis of triglyceride; decrease in amino acid uptake Liver Epinephrine; norepinephrine; glucagon Increase in conversion of glycogen to glucose; inhibition of glycogen synthesis; increase in amino acid uptake; increase in gluconeogenesis (synthesis of glucose from amino acids) Ovarian follicle FSH; LH Increase in synthesis of estrogen, progesterone Adrenal cortex
Increase in synthesis of aldosterone, cortisol Cardiac muscle Epinephrine Increase in contraction rate Thyroid gland TSH Secretion of thyroxine Bone Parathyroid hormone Increase in resorption of calcium from bone Skeletal muscle Epinephrine Conversion of glycogen to glucose-1-phosphate Intestine Epinephrine Fluid secretion Kidney Vasopressin Resorption of water ii
CREB Links cAMP and PKA to Activation of Gene Transcription
Blood platelets Prostaglandin I Inhibition of aggregation and secretion Nearly all the effects of cAMP are mediated through PKA, which is activated by binding of cAMP. SOURCE: E. W. Sutherland, 1972, Science 177:401. Although PKA acts on different substrates in different types of cells, it always phosphorylates a serine or threonine residue that is located within the common sequence motif: X-Arg-(Arg/Lys)-X-(Ser/Thr)-Φ, where X denotes any amino acid and Φ denotes a hydrophobic amino acid. The Ser or Thr whose side chain is phosphorylated is underlined. Thus many potential protein targets of PKA can be identified simply by analyzing their amino acid sequence. Other serine/threonine kinases phosphorylate target residues within other sequence motifs, and thus their potential targets can often be predicted as well. Some kinases recognize additional structural and sequence motifs in their targets in addition to the sequence adjacent to the residue to be phosphorylated. In these cases, analysis of the primary amino acid sequence of the protein may not predict whether or not it is a substrate of such kinases. CREB Links cAMP and PKA to Activation of Gene Transcription Activation of PKA also stimulates the expression of many genes, leading to long-term effects on cells. For instance, in liver cells, PKA induces the expression of several enzymes involved in gluconeogenesis — the conversion of three-carbon compounds such as pyruvate (see Figure 12-3) ii
to glucose. The expression of these genes thus leads to an increase in the concentration of glucose in the blood, thereby enhancing the rapid effects of activated PKA seen in Figure 15-22a. The promoter or enhancer segments of all genes regulated by PKA contain a cis-acting DNA sequence, the cAMP-response element (CRE), which contains the highly conserved nucleotide sequence, . Following the elevation of cAMP levels and the release of active PKA catalytic subunits, some of the catalytic subunits move into the nucleus. There they phosphorylate serine-133 on a transcription factor called CREbinding (CREB) protein. Phosphorylated CREB binds to CRE-containing target genes and also binds to the co-activator termed CBP/P300 (see
Figure 8-26). CBP/P300 links CREB to RNA polymerase II and other gene regulatory proteins, thereby stimulating gene transcription (Figure 15-24).
Anchoring Proteins Localize Effects of cAMP to Specific Regions of the Cell
FIGURE 15-24 Activation of CREB transcription factor following ligand binding to -coupled GPCRs. Receptor stimulation (step 1 ) leads to activation of PKA (step 2 ). Catalytic subunits of PKA translocate to the nucleus (step 3 ) and there phosphorylate and activate the CREB transcription factor (step 4 ). Phosphorylated CREB associates with the co-activator CBP/P300 (step 5 ) and other proteins to stimulate transcription of the various target genes controlled by a CRE regulatory element. See K. A. Lee and N. Masson, 1993, Biochim. Biophys. Acta 1174:221; and D. Parker et al., 1996, Mol. Cell Biol. 16(2):694. Description The illustration shows the cell membrane, the cytosol, nuclear membrane, and nucleus interior. The cell membrane has a rectangle labeled G s protein-coupled receptor and another rectangle labeled adenylyl cyclase. P K A in the cytosol has a pair of R and C subunits. Triangle shaped structures, cyclic A M P in the cytosol moves toward P K A. Then the two parts of the receptor separate and the C portion moves into the nucleus. C subunits phosphorylate from A T P to A D P and activate C R E B. The phosphorylated C R E B attaches to a structure labeled C B P/P 300 and both attach to C R E regulatory element and activates transcription. Anchoring Proteins Localize Effects of cAMP to Specific Regions of the Cell In many cell types, a rise in the cAMP level may produce a response that is required in one part of the cell but is unneeded, or perhaps deleterious, in another. Anchoring proteins confine members of the PKA family to specific locations in the cell, thereby restricting cAMP-dependent responses to these locations. Each of the roughly 50 anchoring proteins, referred to as A kinase–associated proteins (AKAPs), has a two-domain
structure: one domain confers a specific subcellular location by binding to a protein found only in a specific subcompartment, and the other binds to the regulatory (R) subunit of PKA. AKAPs regulate cAMP and PKA signaling within the cell both spatially and temporally. One AKAP in heart muscle anchors PKA to the outer nuclear membrane (Figure 15-25). From this location, the released, catalytically active C subunits readily enter the nucleus, where they phosphorylate and activate the CREB transcription factor (see Figure 15-24).
FIGURE 15-25 Localization of PKA and cAMP phosphodiesterase (PDE) to the nuclear membrane in heart muscle by an A kinase–associated protein (AKAP). This member of the AKAP family, designated mAKAP, anchors both PDE and the regulatory subunit (R, see
Figure 15-21a) of PKA to the cytosolic surface of the outer nuclear membrane, maintaining them in a negative feedback loop that closely controls the cAMP level and PKA activity in this local segment of the cell. Step 1 : The basal level of PDE activity in the absence of hormone (resting state) keeps cAMP levels below those necessary for PKA activation. Steps 2 and 3 : Activation of β-adrenergic receptors causes an increase in cAMP to a level in excess of that which can be degraded by PDE. The resulting binding of cAMP to the R subunits of PKA releases the active catalytic (C) subunits into the cytosol. Some C subunits enter the nucleus, where they phosphorylate and thus activate the transcription factor CREB (see Figure 15-24). C subunits also phosphorylate PDE, stimulating its catalytic activity. Active PDE hydrolyzes cAMP, thereby driving cAMP levels back to basal levels and
causing re-formation of the inactive PKA C-R complex. Step 4 : Subsequent dephosphorylation of PDE returns the complex to the resting state. See K. L. Dodge et al., 2001, EMBO J. 20:1921. Description The illustration shows m-A K A P tethering protein kinase A and phosphodiesterase to the outer nuclear membrane on the cytosolic side. The steps involved in the localization process are as follows. Step 1. Basal phosphodiesterase activity equals resting state. Step 2. Increased cyclic A M P results in protein kinase A activation. Step 3. Phosphodiesterase phosphorylation and activation lead to a reduction in cyclic A M P. Step 4. A line below step 3 returns to step 1, with the label: return to resting state. Also anchored to the same AKAP is cAMP phosphodiesterase (PDE), the enzyme that hydrolyzes cAMP to AMP (see Figure 15-18). The anchoring of PKA and PDE to the same AKAP keeps these two proteins in close proximity, where the action of PDE confines the activity of PKA to short local bursts. The cAMP concentration and hence local PKA activity is tightly controlled by negative feedback. As cAMP levels rise in response to hormone stimulation, PKA becomes activated and then phosphorylates and activates several target proteins, including PDE. The now active PDE, in turn, hydrolyzes cAMP, thus quickly returning PKA to its inactive state and allowing only a short burst of PKA activity. In certain heart muscle cells, a different AKAP is tethered to the cytosolic face of the plasma membrane near a particular type of gated channel. In the heart, these channels open in response to activation of β-adrenergic receptors by epinephrine (as part of the fight-or-flight response). The resulting influx of increases the rate of heart muscle contraction.
Multiple Feedback Mechanisms Suppress Signaling by the GPCR/cAMP/PKA Pathway
These channels open when phosphorylated by PKA. The binding of AKAP to PKA localizes the kinase next to these channels, thereby reducing the time that would otherwise be required for PKA catalytic subunits to diffuse from their sites of generation to their -channel substrates. Multiple Feedback Mechanisms Suppress Signaling by the GPCR/cAMP/PKA Pathway In Section 15.1 we stressed that, for cells to respond effectively to a hormone or to other changes in their environment, they must not only activate a signal transduction pathway, but also reduce or terminate the response once it is no longer needed; otherwise, signal transduction pathways would remain “on” too long, or at too high a level, and the cell would become overstimulated. The activity of most G protein–coupled receptors is reduced or even totally inhibited by multiple feedback mechanisms, as is exemplified by β-adrenergic and other receptors that are coupled to and that activate adenylyl cyclase. First, the intrinsic GTPase activity of converts bound GTP to GDP, thereby terminating the ability of to activate its downstream target adenylyl cyclase. Importantly, the rate of hydrolysis of GTP bound to is enhanced when binds to
adenylyl cyclase. Thus the downstream effector adenylyl cyclase also functions as a GAP for , increasing the rate of inactivation of and so lessening the duration of cAMP production. More generally, many effector proteins of subunits are also GAPs — the binding of most, if not all, ’s to their respective effector proteins accelerates the rate of GTP hydrolysis. Second, PDE (see Figure 15-18) acts to hydrolyze cAMP to , terminating the cellular response. Thus the hormone must be continuously present at a sufficient concentration in order to keep adenylyl cyclase activated and maintain an elevated cAMP level. Once the extracellular hormone concentration falls sufficiently, the cAMP level falls due to PDE action and most cAMP-dependent rapid cellular responses quickly wane. Most GPCRs are down-regulated by feedback repression, in which an end product of a signaling pathway blocks an early step in that pathway. For instance, when a protein–coupled receptor is exposed to hormonal stimulation for even short periods of time — seconds to minutes depending on the receptor — active PKA phosphorylates several serine and threonine residues typically in the third cytoplasmic loop or the C-terminal cytosol-facing tail domain of the receptor. The phosphorylated receptor can bind its ligand, but because these cytosolic domains participates in binding to the subunit, the receptor is less able to activate . In other words, ligand bound to the phosphorylated receptor is less efficient in activating adenylyl cyclase than is ligand bound to the nonphosphorylated receptor. Because the activity of PKA is enhanced by the high cAMP level induced by any hormone that activates , prolonged exposure to one such hormone — say, epinephrine — desensitizes not only β-
adrenergic receptors, but also other –coupled receptors that are phosphorylated by PKA, even though they bind different ligands (e.g., glucagon receptors in the liver). This cross-regulation is called heterologous desensitization. A second type of phosphorylation-mediated feedback control occurs only when the GPCR is in its ligand-bound, activated conformation . In the , but not R, conformation, serine and threonine residues in the third cytoplasmic loop or the C-terminal cytosol-facing domain of the receptor can be phosphorylated by a special group of kinases called G-protein– coupled receptor kinases (GRKs) (Figure 15-26a, b). GRKs recognize the subtle conformational differences between R and and phosphorylate only the active conformation. The longer the receptor remains in its active state, the greater the extent of its phosphorylation by GRKs. Importantly, the greater the extent of the phosphorylation by a GRK, the lower the ability of the receptor to activate the downstream G protein. This process is termed homologous desensitization because a ligand can only induce the deactivating phosphorylation of receptors to which it is bound — those in the conformation. Unlike what happens in heterologous desensitization, a ligand cannot induce the phosphorylation by GRK of a receptor to which it cannot bind.
FIGURE 15-26 Binding of β-arrestin to phosphorylated GPCRs triggers receptor desensitization as well as activation of different signal transduction proteins. (a) A Gprotein–coupled receptor kinase (GRK) phosphorylates serine and threonine residues in the cytoplasmic segments of activated G protein–coupled receptors (GPCRs), those that have bound agonists (step 1 ). β-Arrestin (Arr) then binds to these phosphorylated receptors (step 2 ). Steps 3 and 4 : Clathrin and AP2, two other proteins bound by β-arrestin, promote endocytosis of the receptor (see Figure 14-29). β-Arrestin also functions in transducing signals from activated receptors by binding to and activating several cytosolic protein kinases. One such kinase, Src, activates the MAP kinase pathway that, as detailed in the next chapter, leads to phosphorylation and activation of key transcription factors. (b) Three-dimensional structure of the GPCR rhodopsin bound to arrestin. Arrestin binds to
segments of the C-terminal cytosolic alpha helix of activated rhodopsin that includes the two phosphorylated resides as well as to parts of transmembrane helix 7. [Part (a) Data from W. Weis and B. Kobilka, 2018, Annu. Rev. Biochem. 87:897. Part (b) Data from Y. Kang et al., 2015, Nature 523:561–567, PDB ID 4zwj, and custom PDB.] Description The illustration labeled (a) shows agonist binding to the receptor in the cell membrane. A structure in the cytosol labeled G R K, is activated after agonist binding and leads to phosphorylation. Phosphate groups attach to the receptor. Beta-arrestin (A R R) binds to the agonist and phosphorylated receptor complex. Arrestin recruitment and activation leads to endocytosis. Finally, the A R R structure attaches to A P 2 and S R C and enters into the cytosol. The illustration labeled (b) shows a three-dimensional model of rhodopsin embedded in the plasma membrane. On the cytosolic side of the membrane, beta-arrestin binds to the phosphorylated sites in G- protein-coupled receptor, rhodopsin. An important breakthrough in understanding the control of GPCRmediated signal transduction came with the discovery of adapter proteins called arrestins. Arrestins bind tightly to GPCRs only when these receptors have been phosphorylated by GRKs on two or three of the serine residues in the cytosol facing C-terminal domain (see Figure 15-26a, step 2 ). Arrestin binding can dramatically speed up the inactivation process. Arrestin bound to the phosphorylated receptor completely prevents its interaction with a G protein, blocking formation of the active and preventing further downstream signaling. Eventually, phosphatase enzymes remove the phosphates added by a GRK and prevent arrestin binding, restoring the receptor to its original, hormone-sensitive state.
Another function of arrestin is to help terminate the signal by reducing the numbers of activated GPCRs on the cell surface. Subsequent studies revealed that β-arrestin binds not only to phosphorylated GPCRs, but also to clathrin and an associated protein termed AP2, two key components of the coated vesicles that are involved in endocytosis from the plasma membrane (see Figure 15-26a, steps 3 and 4 ; see also Chapter 14). These interactions promote the endocytosis of the associated receptors, thereby decreasing the number of receptors exposed on the cell surface. Eventually some of the receptors that have been moved inside the cell are degraded, and some are de-phosphorylated in endosomes. Following dissociation of β-arrestin, the resensitized, de-phosphorylated GPCRs are recycled to the cell surface in a manner similar to the recycling of the LDL receptor (see Chapter 14). In addition to their role in regulating receptor activity, arrestins bound to the phosphorylated GPCR can function as adapter proteins that recruit additional downstream signaling proteins to the GPCR. As a consequence, the GPCR can initiate a second signal transduction pathway that is independent of G proteins. The GPCR-arrestin complex acts as a scaffold for the binding and activation of several cytosolic kinases (see Figure 1526a, step 4 ), which we discuss in detail in subsequent chapters. These kinases include Src, a protein tyrosine kinase that activates the MAP kinase pathway and other pathways leading to the transcription of genes needed for cell division (see Chapters 16 and 19). Thus the phosphorylation of GPCRs by GRK followed by arrestin binding can function as a switch, turning off signaling by G proteins and turning
on other signaling pathways. The multiple functions of arrestins illustrate the importance of adapter proteins in both regulating signaling and transducing signals from cell-surface receptors. KEY CONCEPTS OF SECTION 15.4 Regulating Metabolism of Many Cells: G Protein–Coupled Receptors That Activate or Inhibit Adenylyl Cyclase Ligand binding by G protein–coupled receptors that activate results in the activation of the membrane-bound enzyme adenylyl cyclase, which converts ATP to the second messenger cAMP. Ligand binding of G protein–coupled receptors that activate results in the inhibition of adenylyl cyclase and lower levels of cAMP. and bind to the catalytic domain in adenylyl cyclase to activate or inhibit the enzyme, respectively. cAMP binds cooperatively to a regulatory subunit of PKA, releasing the active kinase catalytic subunit. In liver and muscle cells, activation of PKA induced by epinephrine and other hormones exerts a dual effect, inhibiting glycogen synthesis and stimulating glycogen breakdown via a kinase cascade. The result is an increase in glucose for production of ATP. PKA mediates the diverse effects of cAMP in most cells. The substrates for PKA, and thus the cellular responses to hormone-induced activation of PKA, vary among cell types. The signal that activates the GPCR/adenylyl cyclase/cAMP/PKA signaling pathway is amplified tremendously by second messengers and kinase cascades. Activation of PKA often leads to phosphorylation of nuclear CREB protein, which, together with the CBP/P300 co-activator, stimulates transcription of genes, thus initiating a long-term change in the cell’s protein composition. Localization of PKA to specific regions of the cell by anchoring proteins restricts the effects of cAMP to particular locations in the cell. Signaling from -coupled receptors is down-regulated by multiple mechanisms: first, the intrinsic GTPase activity of that converts the bound GTP to GDP is enhanced when binds to adenylyl cyclase (this occurs when many complexes bind to their respective effector proteins); and second, PDE acts to hydrolyze cAMP to , terminating the cellular response.
Most GPCRs are regulated by feedback repression. They are deactivated by kinases in the G-protein–receptor kinase (GRK) family, which phosphorylate cytosolic residues of the receptor in its active conformation. GRK phosphorylation of ligand-bound β-adrenergic receptors also leads to the binding of arrestin and endocytosis of the receptors. The consequent reduction in the number of cell-surface receptors renders the cell less sensitive to additional hormone. The GPCR-arrestin complex functions as a scaffold that activates several cytosolic kinases, initiating cascades that lead to transcriptional activation of many genes controlling cell growth.
15.5 Regulating Protein Secretion and Muscle Contraction: Ca2+ Ions as Second Messengers in Multiple Signal Transduction Pathways
15.5 Regulating Protein Secretion and Muscle Contraction: Ions as Second Messengers in Multiple Signal Transduction Pathways A small rise in cytosolic induces a variety of cellular responses, depending on cell type: endocrine cells secrete hormones, pancreatic acinar cells secrete digestive enzymes, neurons release neurotransmitter at the synapse, and muscle fibers contract (Table 15-4). For example, in response to acetylcholine stimulation of GPCRs, secretory cells of the pancreas and of the parotid (salivary) glands secrete digestive proteins. In this case, a rise in cytosolic triggers the fusion of secretory vesicles with the plasma membrane and release of their protein contents into the extracellular space. Thrombin, a proteolytic enzyme in the blood-clotting cascade, binds to a GPCR on blood platelets. The binding of thrombin (which activates the GPCR by proteolytic cleavage of the receptor extracellular domain) triggers a rise in cytosolic , which in turn causes a shape change in the platelets and other modifications that lead to their aggregation, an important step in blood clotting to prevent blood from leaking out of damaged blood vessels. Thrombin inhibitors are drugs that block blood coagulation.
TABLE 15-4 • Cellular Responses to Hormone-Induced Rise in Cytosolic in Various Tissuesiii
Tissue Hormone Inducing Rise in Cellular Response Pancreas (acinar cells) Acetylcholine Secretion of digestive enzymes, such as amylase and trypsinogen Parotid (salivary) gland Acetylcholine Secretion of amylase Vascular or stomach smooth muscle Acetylcholine Contraction Liver Vasopressin Conversion of glycogen to glucose Blood platelets Thrombin Aggregation, shape change, secretion of hormones Mast cells Antigen Histamine secretion Fibroblasts Peptide growth factors DNA synthesis, cell division (e.g., bombesin and PDGF) Nerve cells Many Secretion of neurotransmitters Hormone stimulation leads to production of inositol 1,4,5-trisphosphate , a second messenger that promotes release of stored in the endoplasmic reticulum. SOURCE: M. J. Berridge, 1987, Annu. Rev. Biochem. 56:159; and M. J. Berridge and R. F. Irvine, 1984, Nature 312:315. The total calcium present in a subcellular compartment is the sum of the free ions and bound . Free ions are ions that are not tightly bound to proteins and that can be quantified by the fluorescence techniques mentioned previously. In the ER and mitochondrial matrix space, the amounts of bound are thought to be much greater than those of free because these organelles contain abundant - binding proteins. As an example, the ER lumen contains several - iii
Products of the Hydrolysis of the Membrane Lipid Phosphatidylinositol 4,5-Bisphosphate by Phospholipase C Elevate Cytosolic Ca2+ Levels
binding proteins, including the chaperones calreticulin and calnexin (Chapter 13), which have a low affinity and large capacity for binding and that buffer the amount of calcium in the lumen of that organelle, . Measurements of free have indicated that, while the concentrations can vary considerably among different types of resting cells, typically , , and . The free concentration in organelles can vary in response to stimulation by hormones or neuronal signals, but often increases to about and to approximately , whereas decreases to about . We learned in Chapter 12 that increases in the concentration of free in the mitochondrial matrix accelerate pyruvate oxidation and ATP production. Thus, in muscle, increases in the concentration of are used both to induce contractions and to increase mitochondrial ATP synthesis to provide the energy to fuel those contractions. Products of the Hydrolysis of the Membrane Lipid Phosphatidylinositol 4,5-Bisphosphate by Phospholipase C Elevate Cytosolic Levels A number of important second messengers, used in several signal transduction pathways, are derived from the membrane lipid
phosphatidylinositol (PI; Figure 15-27). One of these, , triggers the elevation of in the cytosol and mitochondrial matrix. is generated in several steps from the precursor PI.
FIGURE 15-27 Synthesis of second messengers DAG and from phosphatidylinositol (PI). Each membrane-bound PI kinase places a phosphate (yellow circles) on a specific hydroxyl group on the inositol ring, producing the phosphorylated derivatives PI(4)P and . Cleavage of by phospholipase C yields the two important second messengers DAG and . Signaling is terminated when a phosphatase removes the 5-phosphate from ; a second phosphatase removes the 1phosphate, and the inositol 4-phosphate is reused to synthesize PI 4-phosphate. See A. Toker and L. C. Cantley, 1997, Nature 387:673; and C. L. Carpenter and L. C. Cantley, 1996, Curr. Opin. Cell Biol. 8:153. Description The steps involved in the synthesis of D A G and I P subscript 3 are as follows. Step 1. Phosphatidylinositol is phosphorylated at the fourth position by a P I-4 kinase.
Step 2. Second phosphorylation occurs at the fifth position by P I P-5 kinase. Step 3. By phosphorylation in the first position, phospholipase C catalytically cleaves the fatty acid (D A G) from inositol 1, 4, 5-trisphosphate. D A G activates protein kinase C, and 1, 4, 5-trisphosphate triggers release of calcium ions stored in the endoplasmic reticulum lumen into the cytosol. Step 4. The cleaved group is then reprocessed by phosphatases, which remove phosphate groups, allowing the reuse of inositol 4-phosphate. In the plasma membrane this phospholipid resides in the cytoplasmic leaflet with its inositol head group always facing the cytosol. Inositol can be phosphorylated on one or more hydroxyl groups by the combined actions of different kinases, and the phosphates can be removed by phosphatases, as discussed in Chapter 16. One derivative of PI, the lipid phosphatidylinositol 4,5-bis phosphate , is made by stepwise addition of two phosphates to PI to the hydroxyl groups attached to the #4 and #5 carbon atoms of the inositol ring. When the enzyme phospholipase C (PLC) is activated by a signal transduction pathway, it catalyzes the cleavage of in the plasma membrane into two important second messengers: 1,2-diacylglycerol (DAG), a lipophilic molecule that remains associated with the plasma membrane, and inositol 1,4,5-trisphosphate , which can freely diffuse in the cytosol (see Figures 15-27 and 15-28). We refer to downstream events involving these two second messengers collectively as the pathway. , in turn, triggers the release of from the ER into the cytosol and mitochondrial matrix.
FIGURE 15-28 The pathway and the elevation of cytosolic . Opening of endoplasmic reticulum channels can be triggered by ligand binding to GPCRs that primarily activate members of the family, leading to activation of phospholipase C (step 1 ). Cleavage of by phospholipase C yields and DAG (step 2 ). After diffusing through the cytosol, interacts with and opens -gated channels, often termed receptors or R’s in the membrane of the endoplasmic reticulum (step 3 ), causing release of ions stored in the ER lumen into the cytosol (step 4 ). One of several cellular responses induced by a rise in cytosolic is recruitment of protein kinase C (PKC) to the plasma membrane (step 5 ), where it is activated by binding DAG (step 6 ). The activated membrane-associated kinase can phosphorylate various cellular enzymes and receptors, thereby altering their activity (step 7 ). See J. W. Putney, 1999, Proc. Nat’l. Acad. Sci. USA 96:14669; Y. Zhou, 2010, Proc. Nat’l. Acad. Sci. USA 107:4896; M. Cahalan, 2010, Science 330:43; and Q. C. Wang, X. Wang, and T.-S. Tang, 2018, J. Cell Biol. 217(6):1899–1900, https://doi.org/10.1083/jcb.201805037. Description The illustration shows a receptor in the plasma membrane. The receptor has a sphere- shaped ligand at the top of the receptor in the exterior region and G protein (alpha, beta, and gamma regions) with G D P in the cytosol. An arrow labeled step 1 leads to G protein (alpha region) with G T P attached to phospholipase C structure in the plasma membrane. An arrow labeled step 2 shows D A G in the plasma membrane and I P 3 is
Ca2+ Release from the ER Triggered by IP3
released from phospholipase C. Step 3 shows the movement of I P subscript 3 to I P subscript 3- gated calcium channel going into the endoplasmic reticulum. Step 4 shows calcium moving out of the endoplasmic reticulum toward protein kinase C. Step 5 shows the calcium ions inside the protein kinase C. Step 6 shows the P K C at the plasma membrane with D A G added from the membrane. Step 7 is labeled phosphorylation of substrates. Phospholipase C is activated by binding either or subunits released after GPCR activation (Figure 15-28, step 1 ). In turn, activated phospholipase C cleaves into DAG and (see Figure 15-28, step 2 ). The two second messengers trigger distinct, but sometimes interrelated, downstream pathways. Some phospholipase C’s are activated by receptors other than GPCRs and are described in the following chapter. Release from the ER Triggered by Ligand binding to G protein–coupled receptors that activate phospholipase C induces an elevation in cytosolic even when ions are absent from the surrounding extracellular fluid. In this case, is released into the cytosol from the ER lumen (where, as noted above, can accumulate to almost millimolar concentrations by binding to - binding proteins) through the operation of -gated channels in the ER membrane, as depicted in Figure 15-28 (steps 3 and 4 ). Each of these large -gated channels is composed of four identical subunits, and each subunit contains an -binding site in its N-terminal cytosol-facing domain. binding induces opening of the channel, allowing to flow down its concentration gradient from the ER lumen into the cytosol.
This family of -gated channel proteins is similar in structure to the family of voltage-sensitive channels that are called ryanodine receptors and that reside in a specialized ER in muscle cells called the sarcoplasmic reticulum (see Chapter 17). The rise in the cytosolic level is transient because pumps located in the plasma membrane and in the ER membrane actively transport from the cytosol to the cell exterior or back into the ER lumen, respectively. Furthermore, within a second of its generation, the phosphate linked to carbon 5 of is hydrolyzed, yielding inositol 1,4bisphosphate (see Figure 15-27). cannot open -gated channels. Once released, the ions trigger further steps leading to the cellular response. As detailed in Chapter 3, the ubiquitous small cytosolic protein calmodulin functions as a multipurpose switch protein that mediates many cellular effects of ions. Binding of to four sites on calmodulin triggers a major conformational change that allows calmodulin to bind to and modulate the activity of many enzymes and other proteins (see Figure 3-34). Because four ions bind to calmodulin in a cooperative fashion, a small change in the level of cytosolic leads to a large change in the level of active calmodulin. One well-studied enzyme activated by the -calmodulin complex is myosin light-chain kinase, which regulates the activity of myosin and thus contraction in smooth muscle cells (see
Chapter 17). Another is cAMP phosphodiesterase (PDE), the enzyme that degrades cAMP to and terminates its effects (see Figure 15-18). This reaction thus links and cAMP, one of many examples in which
IP3-triggered Ca2+ Transport from the ER to the Mitochondrial Matrix
two second messenger–mediated pathways interact to fine-tune a cellular response. -triggered Transport from the ER to the Mitochondrial Matrix In some cells, a cellular response to takes place in the mitochondrial matrix in addition to the cytosol. In Chapter 12, we learned that there are direct contacts between specialized regions of the ER membrane, called mitochondria-associated membranes (MAMs), and the outer mitochondrial membrane. These contacts affect mitochondrial structure, dynamics, and function. In response to elevated is able to move from the ER lumen through the MAMs into the mitochondrial matrix (Figure 15-29). Once in the matrix, the elevated levels increase ATP synthesis as well as enhance mitochondrial activity in other ways.
FIGURE 15-29 Movement of between the cytosol, mitochondrion, and endoplasmic reticulum. The ER is the main intracellular storage depot for . Binding of to -gated channels in the membrane of the endoplasmic reticulum releases into the cytosol (step 1a ); the -gated channels in the mitochondria-associated membranes (MAMs) of the ER are also opened by binding of (step 1b ). Step 2 : VDAC channels in the outer mitochondrial membrane segments adjacent to MAMs are physically linked to by the GRP75 protein; they directly and efficiently pass the released from the MAMs into the mitochondrial intermembrane space. Step 3 : The high concentration of in the intermembrane space induces the opening of MCU channels and other channels in the inner membrane, resulting in the flow of into the mitochondrial matrix. Step 4 : Over time, is released from the mitochondrial matrix into the intermembrane space by and antiporters in the inner membrane, then transferred into the cytosol through VDAC or other channels in the outer membrane. Finally, pumping of from the cytosol by ATP-powered pumps in the ER membrane (step 5 ) or plasma membrane restores the high ER and low cytosolic levels. See M. Schäfer et al., 2014, Cell Tissue Res. 357:395; and K. Kamer and V. Mootha, 2015, Nat. Rev. Mol. Cell Biol. 16:545.
The has to cross three separate membranes to reach the mitochondrial matrix. As detailed above, -gated channels in the ER membrane (step 1a ), including those in the MAMs (step 1b ), open in response to a rise in cytosolic . Voltage-dependent anion channels (VDACs) in the outer mitochondrial membrane adjacent to the MAMs, and which are physically linked by the GRP75 protein to these -gated channels, efficiently pass the released from the ER lumen into the intermembrane space (step 2 ). A mitochondrial calcium uniporter (MCU) in the inner mitochondrial membrane then transports from the intermembrane space into the mitochondrial matrix (step 3 ). MCUs open only in the presence of a high concentration in the intermembrane space. Regulatory subunits of the MCU that face the intermembrane space have -binding EF hands (see Chapter 3) with relatively low binding affinity for ; these subunits must bind calcium for the MCU to open. Individuals with mutations in the gene encoding one of these subunits have skeletal muscle defects and learning disabilities, symptoms that can accompany other mitochondrial disorders. The consequences of these mutations attest to the importance of these uniporters in mitochondrial metabolism. Too much calcium in the mitochondrial matrix is potentially toxic. To avoid the buildup of excess calcium, the mitochondrial matrix gradually releases into the cytosol. The calcium first moves across the inner mitochondrial membrane into the intermembrane space via and
The Store-Operated Ca2+ Channel in the Plasma Membrane
antiporters, then crosses the outer mitochondrial membrane into the cytosol, most likely via VDACs (step 4 ). The calcium transport cycle is completed when cytosolic calcium enters the ER via an ATP-powered pump (step 5 ; see Figure 11-10) or is pumped out of the cell by ATP-powered pumps in the plasma membrane. The Store-Operated Channel in the Plasma Membrane If the -gated channel in the ER membrane stays open long enough, coupled with operation of the plasma-membrane export pump, the outflow of would eventually deplete the stores of in both the ER and mitochondrial matrix, and a cell would soon be unable to increase the cytosolic level in response to hormone-induced generation of . Using patch-clamping studies (see Figure 11-22), investigators established that cells must have a channel in the plasma membrane, called the store-operated channel (SOC), that opens and admits extracellular into the cytosol when stores in the ER are depleted. The SOC thereby provides to replenish the ER and mitochondrial stores. To function, a SOC would require some additional ER-associated protein that could sense depletion in the ER and signal the SOC to open. Initial attempts to identify a SOC were not successful because investigators focused on potential channel proteins with typical channel sequences and structures. Eventually investigators established the
identity of this channel protein as Orai1; the sequence and threedimensional structure of Orai1 is unlike that of any other known ionchannel protein. The protein that senses depletion in the ER is called STIM1. It is a transmembrane protein in the ER membrane (Figure 15-30a) that binds when its concentration in the lumen of the ER is high. To bind , STIM1 uses an EF hand motif, similar to that in calmodulin (see Figure 334), located on the luminal side of the ER membrane. STIM1 is also bound to several cytosolic proteins and, via the EB1 protein, to cytosolic microtubules, all of which keep STIM1 away from the plasma membrane. As stores of in the ER are depleted, the STIM proteins lose their bound , oligomerize, and dissociate from EB1 and other cytosolic proteins. No longer anchored by these proteins, STIM proteins diffuse in the ER membrane to segments closely juxtaposed to the plasma membrane (Figure 15-30b). There portions of the STIM, called CAD domains, bind to and trigger the opening of Orai1, allowing the influx of extracellular ; these two proteins are the key components of the store-operated pathway. Once the level of cytosolic rises to normal, a complex of bound to the protein calmodulin (Chapter 3) binds to Orai1, preventing STIM1 from binding to the ion channel and shutting down entry.
Feedback Loops in ER and Cytosol Cycling of Ca2+ Trigger Oscillations in the Cytosolic Ca2+ Concentration
FIGURE 15-30 Opening of store-operated channels in the plasma membrane. (a) In the resting cell, levels in the ER lumen are high. ions (blue circles) bind to the luminal EF hand domains of the transmembrane STIM1 proteins, which are distributed throughout the ER. STIM1 binds to EB1, a protein that also binds to the ends of cytosolic microtubules. Binding to EB1 traps STIM1 molecules from translocating to sites where the ER and plasma membrane are juxtaposed. (b) As stores in the ER are depleted, ions dissociate from the EF hands. STIMs undergo oligomerization, weakening their binding to EB1, and relocate to areas of the ER membrane near the plasma membrane. There the STIM CAD domains (orange) bind to and trigger the opening of the store-operated channels (Orai1) in the plasma membrane, allowing influx (black arrow) of extracellular into the cytosol. Feedback Loops in ER and Cytosol Cycling of Trigger Oscillations in the Cytosolic Concentration In the case of certain G protein–coupled receptors, their continuous activation induces rapid, repeated spikes in the level of cytosolic (Figure 15-31) rather than a prolonged elevation in cytosolic . These oscillations are caused by complex feedback interactions between the cytosolic concentration and the -gated channels in the ER membrane. In unstimulated, resting cells, activation of a GPCR triggers a rise in , and the rise in in turn leads to a rapid rise in cytosolic . However, the high cytosolic level reached at the peak of the spike inhibits the further release of from ER stores by binding to the -gated channels and decreasing their affinity for . As a result, these channels close, and the cytosolic level drops rapidly as
is pumped back into the ER lumen or out of the cell. Thus cytosolic is a feedback inhibitor of the -gated channels that, when open, trigger a rise in cytosolic .
FIGURE 15-31 Oscillations in the cytosolic concentration following treatment of human HeLa cells with histamine. Like the LH receptors described in the text, the histamine GPCR activates the -DAG signaling pathway. The feedback loops generating the spikes in the cytosolic concentration are detailed in the text. [Data from A. Miyawaki et al., 1997, Nature 388:882.] Description In the graph, the vertical axis plots free calcium ion concentration in moles and ranges from 10 to the power minus 7 to 10 to the power minus 5. The horizontal axis plots time in minutes and ranges from 0 to 60. The free calcium concentration starts at (0 seconds, 10 to the power minus 7), after the administration of 0.5 micromoles of
DAG Activates Protein Kinase C
histamine the concentration of free calcium reaches (7 seconds, 10 to the power minus 5), the free calcium gradually decreases at (8 seconds, 10 to the power minus 6), peaks at (15 seconds, between 10 to the power minus 5 and 10 to the power of minus 4), after this increase, the concentration drops, but over the course of an hour the concentration peaks and falls sharply roughly every 3 minutes and ends at (75 seconds, 10 to the power minus 7.) As an example, this mechanism produces calcium ion oscillations in the pituitary gland cells that secrete luteinizing hormone (LH), which plays an important role in controlling ovulation and thus female fertility. LH secretion is induced by the binding of luteinizing hormone–releasing hormone (LHRH) to its G protein–coupled receptors on the surfaces of these cells; LHRH binding induces repeated spikes. Each spike induces exocytosis of a few LH-containing secretory vesicles, presumably those close to the plasma membrane, increasing the level of LH in the circulation. DAG Activates Protein Kinase C Recall that the hydrolysis of by phospholipase C produces two products, and DAG. DAG is also a second messenger, and its principal function is to activate a family of protein kinases collectively termed protein kinase C (PKC). After its formation, the hydrophobic DAG (see Figure 15-28) remains associated with the inner leaflet of the plasma membrane. In the absence of hormone stimulation, its target protein kinase C is present in the cytosol
Integration of Ca2+ and cAMP Second Messengers Regulates Glycogenolysis
as a soluble protein that is catalytically inactive. A rise in the cytosolic level causes protein kinase C to translocate to the cytosolic surface of the plasma membrane, where it can bind to and become activated by phosphatidylserine and DAG (see Figure 15-28, steps 5 and 6 ). Activation of PKC thus depends on an increase of both ions and DAG, suggesting an interaction between the two branches of the pathway. The activation of PKC in different cells results in a varied array of cellular responses, indicating that it plays a key role in many aspects of cellular growth and metabolism. In many cells, PKC phosphorylates transcription factors that are localized in the cytosol, triggering their movement into the nucleus, where they activate genes necessary for cell division. In liver cells, PKC helps regulate glycogen metabolism by phosphorylating and so inhibiting glycogen synthase. Integration of and cAMP Second Messengers Regulates Glycogenolysis All cells constantly receive multiple signals from their environment, including changes in levels of hormones and metabolites, and all of these signals must be integrated. The breakdown of glycogen to glucose (glycogenolysis) provides an excellent example of how cells can integrate their responses to more than one signal. As discussed in Section 15.4, stimulation of muscle and liver cells by epinephrine leads to a rise in the second messenger cAMP, which promotes glycogen breakdown (see
Figure 15-22a). In both muscle and liver cells, other signaling pathways produce the same cellular response of enhanced glycogenolysis. In striated muscle cells (see Figure 17-29), stimulation by nerve impulses causes the release of ions from the sarcoplasmic reticulum and an increase in the cytosolic concentration, which triggers muscle contraction. With the rise in cytosolic also binds to the calmodulin subunit of glycogen phosphorylase kinase (GPK), thus partially stimulating its kinase catalytic activity. GPK then phosphorylates and thus activates its target glycogen phosphorylase. That enzyme stimulates the degradation of glycogen to glucose-1-phosphate, which provides fuel for prolonged muscle contraction. As blood epinephrine concentrations rise, adenylyl cyclase is activated and cAMP concentrations increase, activating PKA. Recall that phosphorylation by PKA also activates GPK (see Figure 15-22). We see that maximal activation of GPK, and therefore a maximal rate of glycogenolysis, requires both phosphorylation and . Thus, in muscle, a key regulator of glycogenolysis, GPK, is subject to regulation by both nerve signals and hormones and integrates both signal transduction pathways (Figure 15-32).
FIGURE 15-32 Integrated regulation of glycogenolysis by and cAMP/PKA pathways. Neuronal stimulation of striated muscle cells or the binding of epinephrine to β-adrenergic receptors on their surfaces leads to an increase in the cytosolic concentrations of the second messengers and cAMP, respectively. The key regulatory enzyme glycogen phosphorylase kinase (GPK) is activated both by binding ions and by phosphorylation by cAMP-dependent PKA. Enzymes are marked by white boxes. . Description On the left of the illustration, Neural stimulation leads to an increase in calcium ion concentration (Ca superscript 2 plus) which further leads to G P K. G P K leads to G P and results in increased glycogen degradation. On the right of the illustration, Hormonal stimulation leads to cyclic A M P which further leads to P K A. P K A leads to G S and results in decreased glycogen synthesis. A box at the bottom gives the full names of the 4 abbreviations used. P K A: Protein kinase A, G P K: Glycogen phosphorylase kinase, G P: Glycogen phosphorylase, G S: Glycogen synthase. KEY CONCEPTS OF SECTION 15.5 Regulating Protein Secretion and Muscle Contraction: Ions as Second Messengers in Multiple Signal Transduction Pathways A small rise in cytosolic induces a variety of responses in different cells, including hormone secretion, contraction of muscle, and platelet aggregation. Many hormones bind GPCRs coupled to G proteins containing a subunit. The effector protein activated by GTP-bound is a phospholipase C enzyme. Phospholipase C cleaves a phospholipid in the cytosolic leaflet of the plasma membrane known as , generating two second messengers: water-soluble and membrane-bound DAG. triggers the opening of -gated channels in the endoplasmic reticulum and elevation of cytosolic free . Opening of -gated channels in the endoplasmic reticulum also leads to an increase in in the mitochondrial matrix and an acceleration of ATP synthesis.
Depletion of ER stores leads to the opening of plasma-membrane storeoperated channels and an influx of from the extracellular medium. In response to elevated cytosolic , protein kinase C is recruited to the plasma membrane, where it is activated by DAG. Glycogen breakdown and synthesis in muscle is coordinately regulated by the second messengers and cAMP, whose levels are regulated by neural and hormonal stimulation, respectively.
15.6 Vision: How the Eye Senses Light
15.6 Vision: How the Eye Senses Light Animals have a remarkable ability to perceive the world thanks to their ability to sense and respond to physical stimuli. One of the most important of these stimuli is light. To understand light-initiated signal transduction, we will focus on one of the two types of photoreceptor cells in the human retina, the rods (Figure 15-33).
Light Activates Rhodopsin in Rod Cells of the Eye
FIGURE 15-33 Human rod cell. (a) Schematic diagram of an entire rod cell. At the synaptic terminal (also called the spherule), the rod cell forms synapses with one or more interneurons. Rhodopsin, a light-sensitive G protein–coupled receptor, is located in the flattened membrane disks of the cell’s outer segment. (b) Electron micrograph of the region of the rod cell indicated by the bracket in (a). This region includes the junction of the inner and outer segments. (c) Structure of the human retina, illustrating the layer of pigment epithelial cells that underlie the rods and cones and in which all-trans-retinol is converted to 11-cis-retinal before being shuttled back to the rod and cone cells. [Part (b) Don W. Fawcett/Science Source. Part (c) after drawing by Alapakkam P. Sampath.] Description The illustration labeled (a) and micrograph labeled (b) share labels. From top to bottom, the labels are disks containing rhodopsin in the outer segment, microtubules, mitochondria, rough endoplasmic reticulum in the inner segment. Additional labels in the illustration are nucleus, Golgi, and synaptic terminal. Additional labels in the micrograph are cilium and basal body. The scale bar reads, 0.5 micrometers. The illustration labeled (c) shows rows of photoreceptors on retinal pigment epithelium that is on top of Bruch's membrane. A label at the top is direction of light. Light Activates Rhodopsin in Rod Cells of the Eye Rod cells are stimulated by weak light such as moonlight and are almost entirely responsible for night vision; they have little role in color vision. The other type of human photoreceptor cells, cones, are involved in color vision and use a similar signal transduction pathway. These photoreceptor cells signal to (synapse with) layer upon layer of interneurons at the back of the eye that are innervated by different combinations of photoreceptor
cells. All these signals are processed and relayed through the visual thalamus to the part of the brain called the visual cortex, where they are interpreted. Rod cells sense light with the aid of a light-sensitive GPCR called rhodopsin. Rhodopsin has two components: the protein opsin, a typical member of the GPCR A family with seven transmembrane α-helical segments, and a light-absorbing pigment called 11-cis-retinal that is covalently bound to opsin (Figure 15-34a). The bound 11-cis-retinal locks the rhodopsin into its inactive (R) conformation, preventing any signaling in the absence of light. Rhodopsin, found only in rod cells (cone cells have homologous photoreceptor molecules), is localized to the thousand or so flattened membrane disks that make up the outer segment of each of these rod-shaped cells (see Figure 15-33). There are about 90 million rod cells in the human retina, and each contains about molecules of rhodopsin that are very densely packed in the membrane disks. The heterotrimeric G protein coupled to rhodopsin, called transducin , contains a subunit referred to as ; like rhodopsin, is found only in rod cells.
FIGURE 15-34 Vision depends on the light-triggered isomerization of the retinal moiety of rhodopsin. (a) Rhodopsin consists of the light-absorbing pigment 11-cis-retinal covalently attached to the amino group of lysine residue 296 in the opsin protein. (b) Absorption of light causes rapid photoisomerization of the bound cis-retinal to the all-trans isomer, triggering a conformational change in opsin that enables it to activate the G protein transducin. Description The illustration labeled (a) shows the Rhodopsin ribbon model on the membrane. The exterior and cytosol are labeled. In the center of the green rhodopsin model is a red area labeled 11-cis-retinal. The illustration labeled (b) shows the absorption of rhodopsin. At the top is the chemical model for 11-cis-retinal moiety with parts labeled lysine side chain and opsin. This forms rhodopsin. A downward arrow is labeled lightinduced isomerization (less than 10 power minus 2 seconds), and at the bottom is metarhodopsin 2 with All-trans-retinal moiety and activated opsin. Rhodopsin differs from other GPCRs in that binding of a ligand does not activate the receptor. Rather, the activating signal is the absorption of a
photon of light by the bound retinal (Figure 15-34b). On absorption of a photon, the retinal moiety of rhodopsin is rapidly converted from the cis isomeric form (11-cis-retinal) to the all-trans isomeric form. This change of shape of the retinal induces a change in the protein from its inactive (R) to active conformation, equivalent to the activating conformational change that occurs upon ligand binding to other GPCRs. As a consequence, the form of rhodopsin binds to transducin, triggering exchange of GTP for GDP on its subunit. At the same time, transducin also dissociates into its and subunits. A single activated rhodopsin protein activates transducin molecules in the few seconds before the covalent bond between the opsin protein and all-trans-retinal is spontaneously cleaved; once the all-trans-retinal has dissociated opsin can no longer activate transducin. The free all-trans-retinal is converted back to 11-cis-retinal in multiple steps. First, all-trans-retinal is converted to an intermediate, all-transretinol, by an enzyme in the outer segment of the rod. This intermediate is then shuttled by a series of transport proteins to the adjacent pigment epithelial cells in the retina (Figure 15-33c), where it is converted to 11cis-retinal. The 11-cis-retinal is then shuttled back to the rod cells where it binds to opsin, forming rhodopsin and completing the rhodopsin visual cycle. RPE65 is the enzyme in the pigment epithelial cells of the retina that catalyzes the isomerization of the intermediate esterified all-transretinol to 11-cis-retinol. Autosomal recessive mutations in the RPE65
Activation of Rhodopsin by Light Leads to Closing of cGMP-Gated Cation Channels
gene are a frequent cause of blindness in children. In 2017, the U.S. Food and Drug Administration approved the first in vivo human gene therapy in the United States, one to treat blindness based on a defective RPE65 enzyme. In this treatment, an adeno-associated virus vector injected directly into the retina is used to introduce a complete copy of the RPE65 gene into the pigment epithelial cells. All young recipients reported an increase in visual acuity and improved ability to negotiate mazes. Activation of Rhodopsin by Light Leads to Closing of cGMP-Gated Cation Channels In the dark, the potential across the plasma membrane of a rod cell is about . That is considerably more positive (less negative) than the resting potential typical of neurons and other electrically active cells (see Chapter 11). This state of the membrane, called the depolarized state, causes rod cells in the dark to release neurotransmitters constantly. Thus the neurons with which they synapse are constantly being stimulated; the signal they send to the brain through a series of neurons is perceived as darkness. The plasma membrane of a resting rod cell remains in this depolarized state because a large number of open ion channels admit both and into the cell (hence they are called nonselective). Recall from Chapter 11 that movement of cations (positively charged ions) such as and from the outside of the cell to the inside will reduce the magnitude of the inside-negative membrane potential, or depolarize the membrane.
These nonselective cation channels open in response to (are “gated” by) binding of the second messenger cyclic guanosine monophosphate, or cGMP (see Figure 15-5). The outer segments of resting rod cells contain an unusually high concentration of cGMP, which is generated from GTP in a reaction catalyzed by guanylyl cyclase. Thus in the dark the high cGMP concentration holds many of the cGMP-gated channels in the open state, depolarizing the membrane. Light acts by lowering the concentration of cGMP and thereby closing these nonselective cation channels (Figure 15-35). Absorption of light by rhodopsin leads to receptor and then activation. Almost instantaneously, triggers the activation of cGMP phosphodiesterase (PDE), which hydrolyzes cGMP to . As the cGMP concentration drops, the nonselective cation channels close and the membrane potential becomes more negative inside (see Figure 15-35, step 6 ). This repolarization of the plasma membrane, in turn, causes a reduction in neurotransmitter release. The more photons are absorbed by rhodopsin, the more cGMP is hydrolyzed, and the more channels are closed. The fewer and ions cross the membrane from the outside, the more inside negative the membrane potential becomes, and so the less neurotransmitter is released. The reduction in neurotransmitter release is transmitted to the brain by a series of neurons, where it is perceived as light.
FIGURE 15-35 The light-activated rhodopsin pathway and the closing of cation channels in rod cells. In dark-adapted rod cells, a high level of cGMP keeps cGMP-gated plasma membrane nonselective cation channels open, leading to influx of and , depolarization of the plasma membrane, and neurotransmitter release. Light absorption generates activated rhodopsin, (step 1 ), which binds inactive, GDP-bound protein and mediates the exchange of GDP for GTP (step 2 ). The free generated then activates PDE by binding to its inhibitory γ subunits (step 3 ) thus dissociating them from the catalytic α and β subunits (step 4 ). Relieved of their inhibition, the α and β subunits of PDE hydrolyze cGMP to GMP (step 5 ). The resulting decrease in cytosolic cGMP leads cGMP to dissociate from the cation channels in the plasma membrane and causes these channels to close (step 6 ). As a result the plasma membrane then becomes transiently hyperpolarized, and neurotransmitter release is reduced. The complex of and the PDE γ subunits binds a GTPase-activating complex formed of the components RGS9 and Gβ5 (step 7 ); by hydrolyzing the bound GTP, this complex triggers the physiologically important rapid inactivation of the PDE (step 8 ). See V. Arshavsky and E. Pugh, 1998, Neuron 20:11; and V. Arshavsky, 2002, Trends Neurosci. 25:124.
Signal Amplification Makes the Rhodopsin Signal Transduction Pathway Exquisitely Sensitive
As depicted in Figure 15-35, lipid anchors confine both and its effector, PDE, to the cytosolic face of the disk membranes of the rod cell. The complexes that are generated through activation of rhodopsin are able to move laterally along the membrane surface and bind to the two inhibitory γ subunits of PDE (see Figure 15-35); note that the stoichiometry is 1:1, that is, one binds to one γ subunit. The binding of to the γ subunits releases the catalytically active αβ dimer, which then converts cGMP to GMP. This is another example of how removal of an inhibitory subunit can quickly activate an enzyme, a common mechanism in signaling pathways. Direct support for the role of cGMP in rod-cell activity has been obtained in patch-clamping studies using isolated patches of plasma membrane taken from the rod outer segment, which contains abundant cGMP-gated cation channels. When cGMP is added to the cytosolic surface of these patches, the number of open cation channels increases rapidly; cGMP binds directly to a site on the cytosolic surface of the channel proteins to keep them open. Like the channels discussed in Chapter 11, the cGMPgated channel protein contains four subunits. In this case, each of the subunits is able to bind a cGMP molecule. Three or four cGMP molecules must bind to each channel in order to open it; because of this cooperative allosteric interaction, channel opening is very sensitive to small changes in cGMP levels. Signal Amplification Makes the Rhodopsin Signal Transduction
Rapid Termination of the Rhodopsin Signal Transduction Pathway Is Essential for the Temporal Resolution of Vision
Pathway Exquisitely Sensitive Remarkably, a single photon absorbed by a resting rod cell produces a measurable response in the form of a small hyperpolarization in the membrane potential of about 1 mV, which in amphibians lasts a second or two. With their 90 million rod cells, dark-adapted human eyes are able to perceive as light the absorption of as few as five photons; the ability to respond to a very few photons is critical to night vision. The light-detecting system is very sensitive because the signal is greatly amplified by the signal transduction pathway. During the time it is active, each rhodopsin molecule in the disk membrane of a rod cell can activate molecules, two of which in turn activate a single phosphodiesterase molecule (see Figure 15-35). Each PDE molecule hydrolyzes hundreds of cGMP molecules during the fraction of a second it remains active. The absorption of a single photon — yielding a single activated rhodopsin molecule — can reduce the cGMP concentration enough to trigger the closing of thousands of cation channels (or about 5 percent of the open channels) in the plasma membrane, causing a measurable change in the membrane potential of the cell. Rapid Termination of the Rhodopsin Signal Transduction Pathway Is Essential for the Temporal Resolution of Vision
Termination of the Signal from Light-Activated Rhodopsin (R*) by Rhodopsin Phosphorylation and Binding of Arrestin
In many organisms a fast response to rapidly changing light conditions (dark-to-light and light-to-dark) is critical for survival. As in all GPCRmediated signaling pathways, after a light-to-dark transition all the activated intermediates must be inactivated rapidly to shut down the signaling pathway, restoring the system to its basal, dark state, ready for signaling by the reappearance of light. Thus the three protein intermediates generated during periods of light — activated rhodopsin , , and activated PDE — must all be inactivated when the light goes off. Once these intermediates are inactivated, the concentration of cytoplasmic cGMP is restored rapidly to its dark level as cGMP is resynthesized by the guanylyl cyclase enzyme. Termination of the Signal from LightActivated Rhodopsin by Rhodopsin Phosphorylation and Binding of Arrestin As noted above, the spontaneous cleavage of the covalent bond between an opsin and its all-trans-retinal and the release of the all-trans-retinal terminates signaling from that activated rhodopsin molecule. Refilling the retinal binding site with 11-cis-retinal restores the protein to the inactive (R) state. This process, called dark adaptation, is relatively slow compared to potentially very rapid changes in external illumination. Thus there are additional mechanisms that suppress the activity of activated rhodopsin more rapidly.
Termination of the Signal from Activated Gαt ⋅ GTP by GTP Hydrolysis
One important process that helps to terminate the response to light quickly is the phosphorylation of rhodopsin when it is in its activated form, but not its inactivated, or dark (R), form. The enzyme that catalyzes this phosphorylation is rhodopsin kinase, a member of the GRK family of kinases (see Figure 15-26a). Each opsin molecule has multiple principal serine and threonine phosphorylation sites on its cytosol-facing C-terminal segment; the more sites that are phosphorylated by rhodopsin kinase, the less is able to bind to and activate . The binding of arrestin to rhodopsin dramatically speeds up the inactivation process. Arrestin binds tightly to rhodopsin only when rhodopsin kinase has phosphorylated a sufficient number of C-terminal serines and threonines. Arrestin binding to the phosphorylated rhodopsin completely prevents its interaction with , thus blocking formation of the active complex and further activation of PDE. The entire process of rhodopsin phosphorylation and its inactivation by arrestin is fast — it is completed within 50 milliseconds in mammals. The phosphorylated rhodopsin is restored to its original, light-sensitive state (R) during dark adaptation. During the dark, a specific rhodopsin phosphatase slowly removes the phosphates and 11-cis-retinal binds to opsin. Termination of the Signal from Activated G ⋅GTP by GTP Hydrolysis automatically shuts itself off after a brief period: it contains an intrinsic GTPase activity that hydrolyzes the bound GTP to GDP, αt
Rod Cells Adapt to Varying Levels of Ambient Light by Intracellular Trafficking of Arrestin and Transducin
producing an inactive complex. That inactive reassociates with a and can no longer bind to a PDE γ subunit. The bound PDE γ subunits are released (see Figure 15-35, step 7 ), and then rejoin the PDE α and β subunits to regenerate an inactive PDE tetramer (step 8 ). Thus PDE rapidly loses its activity, and the cGMP concentration begins to rise to its levels before light induction. Through this process, the eye can respond quickly to changing patterns of light created by moving objects or a change in the direction of gaze. The intrinsic GTPase activity of in rod cells is accelerated by the action of a specific heterodimeric GTPase-activating protein (GAP) that is recruited to the complex of the γ subunit of PDE and . As a result, the normally remains in the active GTP-containing state for only a fraction of a second. The components of this GAP are RGS9 and Gβ5 (see Figure 15-35, step 7 ). Experiments with mice in which the gene encoding RGS9 had been knocked out showed that this protein is essential for normal inactivation of the signaling cascade in vivo. In individual mouse rod cells, the time required for recovery from a single flash of light increased from 0.2 second in the normal mouse to about 9 seconds in the RGS9-deficient mouse. This represents a 45-fold increase, attesting to the importance of RGS9 as a component of the complex. Rod Cells Adapt to Varying Levels of Ambient Light by Intracellular
Trafficking of Arrestin and Transducin When we move from bright sunlight into a dimly lit room, we are temporarily insensitive to low levels of light and initially cannot easily see the objects around us. However, after some time spent in the low-light conditions, our eyes adjust and we are better able to see and distinguish objects; we become more sensitive to lower levels of light. On the other hand, when we move quickly from a dimly lit room into bright sunshine, we are initially “blinded” by the bright light (hypersensitivity), but with time we become less sensitive (desensitized) and can once again see clearly. As the result of this process, called light adaptation, rod cells are able to perceive clearly objects over a 100,000-fold range of ambient light levels, all the way from a dimly lit room to bright sunlight. This wide range of sensitivities is possible because it is the difference in light levels in the visual field, rather than the absolute amount of light absorbed, that is ultimately used by the brain to form visual images. Much of the visual adaptation occurs in the photoreceptor cells, which are able to adjust the rhodopsin-initiated signal transduction pathway (see Figure 15-34) to respond to low or high ambient light intensities. In dark-adapted rod cells, 80–90 percent of the and transducin subunits are located in the outer segments, while fewer than 10 percent of the molecules of the inhibitor arrestin are located there (Figure 15-36). This spatial distribution allows maximal activation of the downstream effector PDE and thus maximal sensitivity to small changes in light.
Exposure for 10 minutes to moderate daytime intensities of light causes a redistribution of these proteins such that over 80 percent of the and subunits move out of the outer segment into other parts of the cell, while over 80 percent of arrestin moves into the outer segment.
FIGURE 15-36 Schematic illustration of transducin and arrestin distribution in darkadapted and light-adapted rod cells. (a) In the dark, most transducin (blue circles) is localized to the outer segment, while most arrestin (green circles) is found in other parts of the cell; in this condition, vision is most sensitive to very low light levels. (b) In bright light, little transducin is found in the outer segment, and abundant arrestin is found there; in this condition, vision is relatively insensitive to small changes in light. The coordinated movement of these proteins contributes to our ability to perceive images over a 100,000fold range of ambient light levels. See P. Calvert et al., 2006, Trends Cell Biol. 16:560. Description The illustration labeled (a) shows dark-adapted rods. Transducin on the left and arrestin on the right. In the outer segment under transducin, there are many blue spheres representing transducin and only 2 in the inner segment. In the arrestin side, there are only 2 arrestin spheres at the outer segment and many at the inner segment. The illustration labeled (b) shows two bright light-adapted rods. On the transducin side, the larger amount is in the inner segment. In the arrestin side, the larger amount is in the outer segment. The mechanism by which these proteins move within the cell is not yet known, but most likely microtubule-attached motors carry the proteins into and out of the outer segment (see Chapter 18); note the microtubules in the diagram and micrograph in Figure 15-33. In bright light, the level of transducin, with its and subunits, is so reduced in the outer segment that is simply not available for binding to and activation by rhodopsin. As a result, less PDE is activated. At the same time, the increase in the arrestin level in the outer segment means that any activated rhodopsin that has been phosphorylated by rhodopsin kinase will become rapidly inactivated. These protein movements are reversed when the ambient light level is lowered. Thus our visual system is desensitized in
bright light by the drop in transducin level and the increase in arrestin level in the outer segment. KEY CONCEPTS OF SECTION 15.6 Vision: How the Eye Senses Light Rhodopsin, the photosensitive GPCR in rod cells, comprises the protein opsin linked to 11-cis-retinal. The presence of light induces isomerization of the 11-cis-retinal moiety to all-trans-retinal. This changes the opsin conformation so that it activates the coupled heterotrimeric G protein transducin by catalyzing exchange of free GTP for bound GDP on the subunit (see Figures 15-34 and 15-35). The effector protein in the rhodopsin pathway is PDE, which is activated by binding to and releasing its inhibitory γ subunits. This enzyme reduces the cGMP level, and, as a result, cGMP-gated channels close, the membrane becomes hyperpolarized, and the release of neurotransmitter decreases (see Figure 15-35). Several mechanisms act to terminate visual signaling: GAP proteins inactivate , and rhodopsin phosphorylation and binding of arrestin inhibit activation of transducin. Adaptation to a wide range of ambient light levels is mediated by movements of transducin and arrestin into and out of the rod-cell outer segment. Together, these two proteins modulate the ability of small increases in light levels to activate the downstream effector PDE, and thus the sensitivity of the rod cell to different ambient levels of light.
Key Terms
End of Chapter Visit Achieve to access study tools and to learn more about the content in this chapter: Perspectives for the Future Classic Experiment 15-1: The Infancy of Signal Transduction Studies: GTP Stimulation of cAMP Synthesis Analyze the Data Chapter References Additional study tools, including videos, animations, and quizzes Key Terms adenylyl cyclase agonist antagonist β-adrenergic receptor cell-surface receptors cellular communication cyclic guanosine monophosphate (cGMP) depolarized state dissociation constant effector protein epinephrine G protein–coupled receptor (GPCR)
Review the Concepts
growth factor GTPase superfamily of proteins heterotrimeric G protein hormone ligand monomeric G protein protein kinase (PK) protein phosphatase receptor second messenger signal transduction pathway target cell Review the Concepts 1. What common features are shared by most cell-signaling systems? 2. Signaling by soluble extracellular molecules can be classified as endocrine, paracrine, or autocrine. Describe how these three types of cellular signaling differ. Growth hormone is secreted from the pituitary, which is located at the base of the brain and acts through growth hormone receptors located on the liver. Is this an example of endocrine, paracrine, or autocrine signaling? Why? 3. A ligand binds two different receptors with a value of for receptor 1 and a value of for receptor 2. For which receptor does the ligand show the greater affinity?
Calculate the fraction of receptors that have a bound ligand in the case of receptor 1 and receptor 2 if the concentration of free ligand is . 4. To understand how a signaling pathway works, it is often useful to isolate the cell-surface receptor and to measure the activity of downstream effector proteins under different conditions. How could you use affinity chromatography to isolate a cell-surface receptor? With what technique could you measure the amount of activated G protein (the GTP-bound form) in ligand-stimulated cells? Describe the approach you would take. 5. How do seven–transmembrane domain G protein–coupled receptors transmit a signal across the plasma membrane? In your answer, include the conformational changes that occur in the receptor in response to ligand binding. 6. Signal-transducing heterotrimeric G proteins consist of three subunits designated α, β, and γ. The subunit is a GTPase switch protein that cycles between active and inactive states depending on whether it is bound to GTP or to GDP. Review the steps for ligand-induced activation of effector proteins mediated by the heterotrimeric G proteins. Suppose that you have isolated a mutant subunit that has an increased GTPase activity. What effect would this mutation have on the G protein and the effector protein? 7. Explain how FRET could be used to monitor the association of and adenylyl cyclase following activation of the epinephrine receptor. 8. Which of the following steps amplify the epinephrine signal response in cells: receptor activation of G protein, G protein
activation of adenylyl cyclase, cAMP activation of PKA, or PKA phosphorylation of glycogen phosphorylase kinase (GPK)? Which change will have a greater effect on signal amplification: an increase in the number of epinephrine receptors or an increase in the number of proteins? 9. The cholera toxin, produced by the bacterium Vibrio cholerae, causes a watery diarrhea in infected individuals. What is the molecular basis for this effect of cholera toxin? 10. Both rhodopsin in vision and the muscarinic acetylcholine receptor in cardiac muscle are coupled to ion channels via G proteins. Describe the similarities and differences between these two systems. 11. In liver and muscle, epinephrine stimulation of the cAMP pathway activates glycogen breakdown and inhibits glycogen synthesis, whereas in adipose tissue, epinephrine activates hydrolysis of triglycerides, and in other cells, it causes a diversity of other responses. What step in the cAMP signaling pathways in these cells specifies the cell response? 12. Continuous exposure of a G protein–coupled receptor to its ligand leads to a phenomenon known as desensitization. Describe several molecular mechanisms for receptor desensitization. How can a receptor be reset to its original sensitized state? What effect would a mutant receptor lacking serine or threonine phosphorylation sites have on a cell? 13. What is the purpose of A kinase–anchoring proteins (AKAPs)? Describe how AKAPs work in heart muscle cells. 14. Inositol 1,4,5-trisphosphate and diacylglycerol (DAG) are second messenger molecules derived from the cleavage of
phosphatidylinositol 4,5-bisphosphate by activated phospholipase C. Describe the role of in causing a rise in cytosolic concentration. How do cells restore resting levels of cytosolic ? What is the principal function of DAG? 15. In Chapter 3, the of calmodulin EF hands for binding is given as . Many proteins have much higher affinities for their respective ligands. Why is the specific affinity of calmodulin important for signaling processes such as that initiated by production of ? 16. Most of the short-term physiological responses of cells to cAMP are mediated by activation of PKA. Another common second messenger is cGMP. What are the targets of cGMP in rod cells?