Introduction
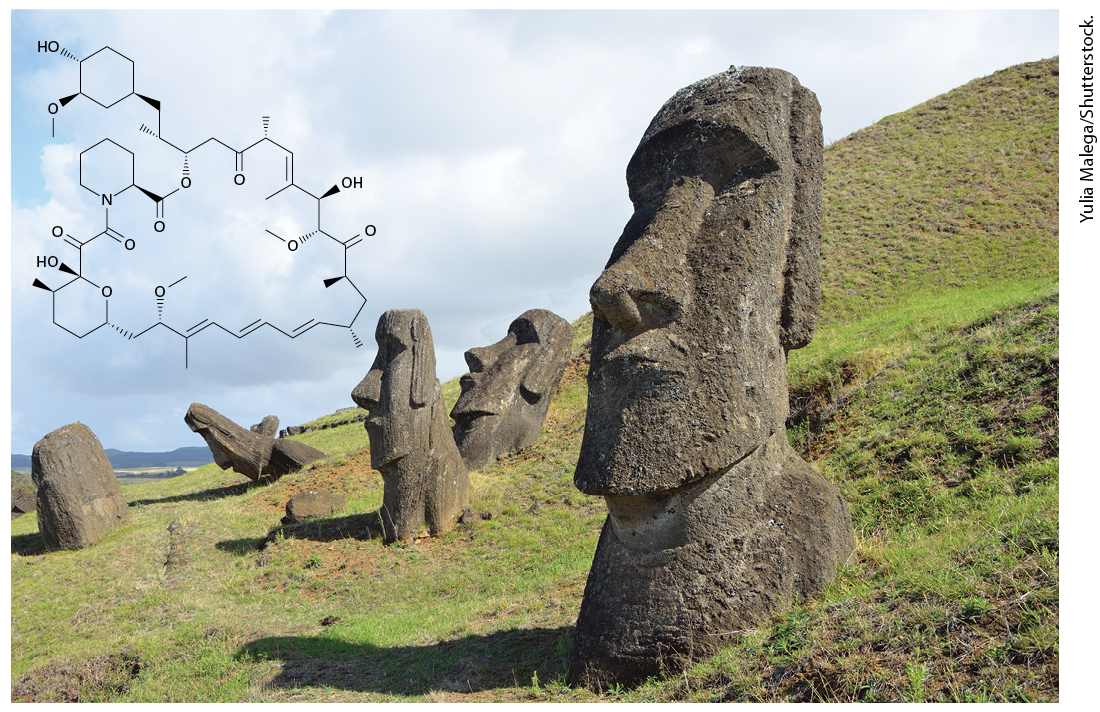
Chapter 21 Responding to the Cellular Environment Rapamycin (in black), a clinically important antifungal drug and inhibitor of the mTORC kinase complex, was isolated from the bacterium Streptomyces hygroscopicus found on Easter Island. It was named after the native name of the island, Rapa Nui.
21.2 Integrating Cell Growth Signals with Nutrient and Energy Levels
21.3 Responding to Changes in the Levels of Cholesterol and Unsaturated Fatty Acids
21.7 Sensing and Responding to the Physical Environment All cells sense and respond to changes in their environment, often by changing their pattern of gene expression. Bacteria constantly monitor the levels of sugars and amino acids in their environment and respond by swimming toward sources of these nutrients and inducing or repressing genes that enable them to most efficiently metabolize these molecules. Yeasts and other unicellular, eukaryotic organisms also sense the presence of sugars, amino acids, and many other metabolites in their environment and adjust their biosynthetic pathways, membrane transporters, and metabolism accordingly. In Chapter 1, we saw how the green unicellular alga Chlamydomonas reinhardtii senses light and swims toward or away from the light source depending on its intensity. This chapter focuses on the multiple ways cells in metazoans, and particularly vertebrates, sense the levels of glucose, amino acids, lipids such as cholesterol, oxygen, and other chemicals in their environment, as well as day and night and contact with other cells, and respond
appropriately. These extracellular signals can have short-term effects that usually occur within minutes and are induced by modification of existing enzymes or other proteins, as we learned in Chapters 3 and 15. All of the extracellular signals we discuss also affect gene expression and thus induce long-term changes in cell function. The pathways we describe have much in common with the signaling pathways described in Chapters 8, 15, and 16. Sensors, like receptors for extracellular signaling molecules, generally bind a specific target molecule and then undergo a conformational change; mechanoreceptors sense changes in the physical environment (e.g., pressure or tension, see
Chapter 20). These sensors activate signal transduction pathways that can have one or many steps. Ultimately one or more effector proteins become activated that induces the cell’s response, which can be a shortterm change in a metabolic pathway, or induction or repression of specific genes, or both. Signal amplification and feedback repression (see
Chapter 15) characterize all of the signal transduction pathways we describe in this chapter, enabling an appropriate but not overreactive adjustment of the cell’s metabolism and pattern of gene expression. These pathways enable a cell to respond to a variety of stresses, for instance, lack of a nutrient or an elevated temperature, and enable homeostasis, the restoration of the cell’s normal chemical and physical conditions and even the survival of the cell itself. The availability of blood glucose is regulated during periods of abundance (following a meal) or scarcity (fasting) principally by two hormones, insulin and glucagon. As we learn in Section 21.1, when blood glucose
concentrations rise too high, β islet cells in the pancreas, cells that synthesize and store insulin, secrete insulin into the bloodstream. (The 1923 Nobel Prize in Physiology or Medicine was awarded for the discovery of insulin.) Insulin signals fat and muscle cells to increase their uptake of glucose from the blood; it also signals liver cells to store glucose as glycogen, lowering the glucose concentration in the blood. When blood glucose concentration falls too low, other cells in the islets, α cells, release glucagon from secretory vesicles; glucagon instructs liver cells to release glucose into the blood (see Chapter 15). Working together, insulin and glucagon maintain blood glucose homeostasis, restoring the normal glucose levels of about 5 mM in humans. Defects in these pathways lead to major diseases, including diabetes and cardiovascular disease, with dire consequences for the individual and increasingly for public health. Cell proliferation, the doubling of cell numbers, requires the presence of one or more growth factors, as discussed in Chapter 16. Cell division also requires the presence of sufficient ATP, amino acids, and other nutrients to produce all of the proteins, nucleic acids, membranes, and other components required to double the cell mass in preparation for division. In Section 21.2 we discuss the mTOR protein kinase, a component of a large multiprotein complex called mTORC1. mTORC1 contains multiple sensor proteins that detect the levels of specific nutrients, energy availability (ATP levels), and the activity of intracellular signal transduction proteins activated downstream of growth factor receptors. mTOR kinase becomes activated and consequently stimulates cell growth, metabolism, and proliferation only when all of these signals are present
simultaneously; we will see how multiple sensors in the mTORC1 complex interact to activate the mTOR kinase. Among the many nutrients essential for cell growth and function are membrane lipids and their biosynthetic precursors, including cholesterol and unsaturated fatty acids (see Chapters 2 and 10). Cells obtain the necessary lipids either by biosynthesis or import from the extracellular environment. If there are not enough of these lipids, the cells cannot grow, divide, or function properly. If there is too much, the excess can interfere with normal cell function. In Section 21.3, we learn how cells sense levels of intracellular cholesterol and unsaturated fatty acids and how they respond by adjusting the rates of fatty acid and cholesterol biosynthesis and import so that the cholesterol:phospholipid ratio is kept within the narrow, desirable range required for normal membrane functions. Accumulation of excess cholesterol in our arteries is a major cause of cardiovascular diseases and strokes, and in Chapter 10 we learned how the anti-atherosclerosis medications called statins inhibit cholesterol biosynthesis and reduce the concentration of low-density lipoproteins (often called “bad cholesterol”; see Chapter 14) and reduce the formation of atherosclerotic plaques. The 1985 Nobel Prize in Physiology or Medicine was awarded for discoveries of how cholesterol metabolism is regulated. The Nobel Prize in Physiology or Medicine was awarded in 2019 to three physician scientists for elucidating how metazoan cells sense and adapt to oxygen availability. In Section 21.4, we learn how a reduction in oxygen levels in blood is sensed by many cells in the body and how the
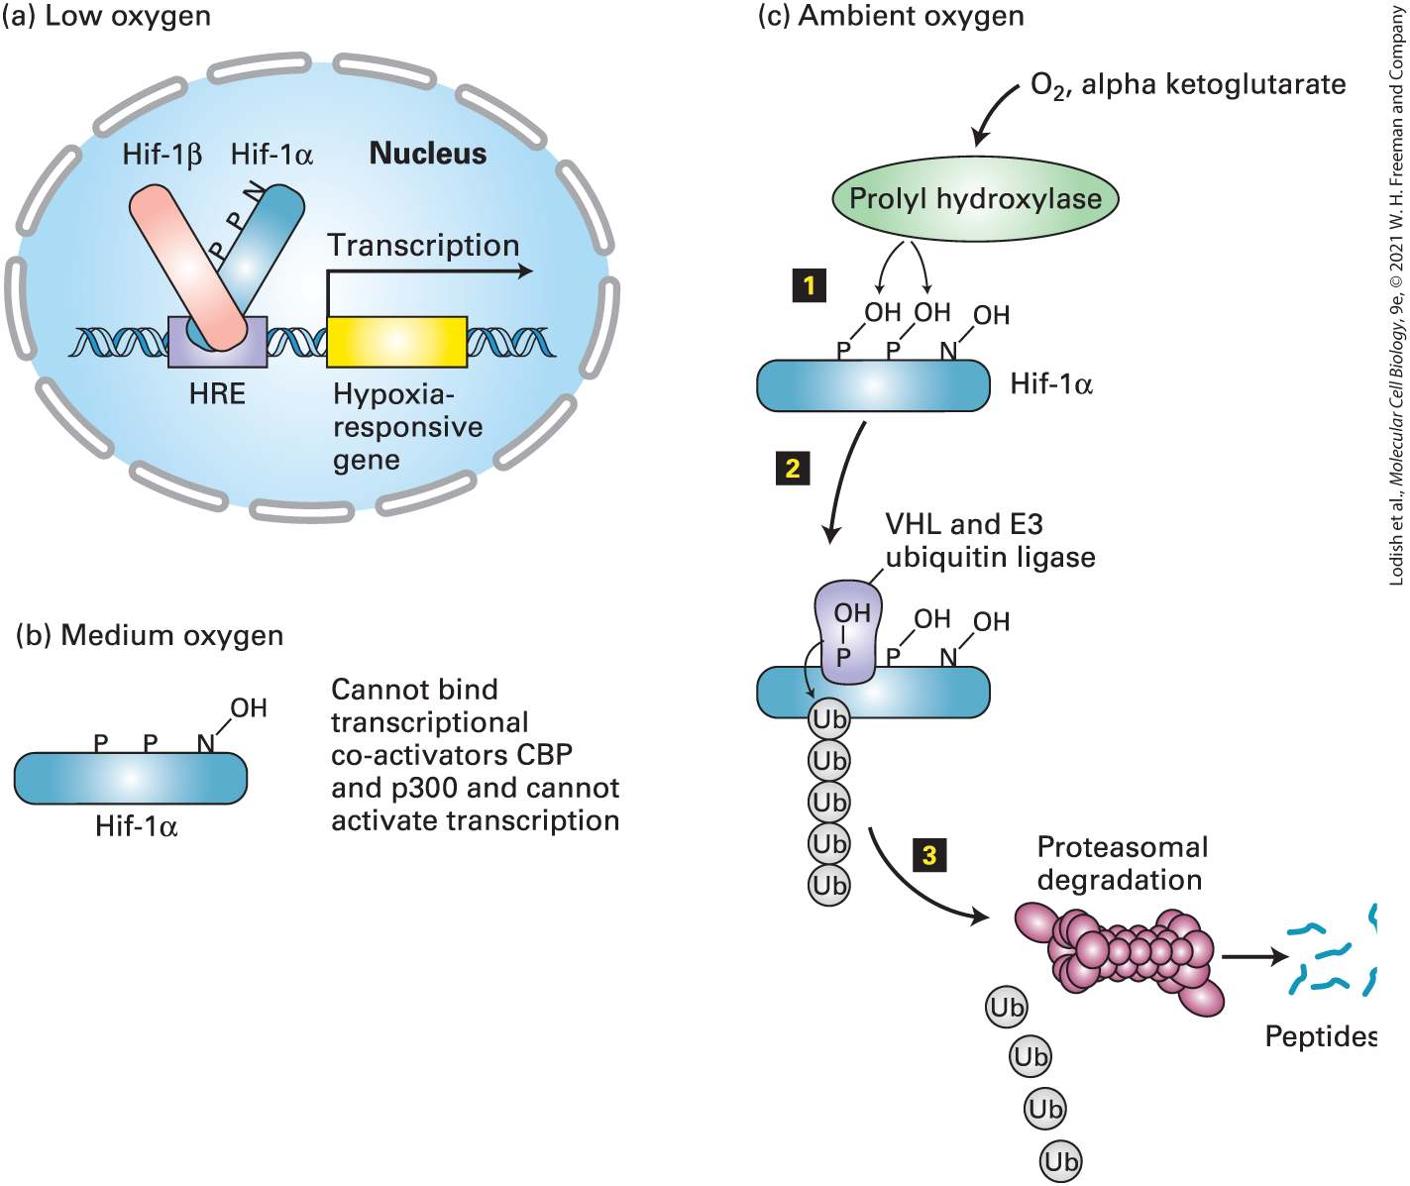
transcription factor Hif-1α coordinates many body responses to low oxygen. At ambient oxygen levels, Hif-1α undergoes covalent modifications by oxygen-requiring enzymes that trigger its polyubiquitination and destruction by proteasomes. Hif-1α becomes progressively more stable as oxygen levels decrease. In certain kidney cells, Hif-1α induces the expression of the erythropoietin gene; erythropoietin in turn increases the production of red blood cells that transport oxygen from the lungs to body tissues (see Chapter 16). In other cells, Hif-1α induces expression of genes to promote survival in lowoxygen conditions. Hif-1α is found only in metazoan animals; we also discuss a different family of oxygen-sensing transcription factors that are expressed both in plants and animals and that arose very early in evolution. All organisms, be they unicellular, plants, invertebrates, or cold-blooded vertebrates, are subject to changes in the temperatures of their internal and external environments. Even vertebrates feel the effects of elevated temperature during fevers or during the hottest periods of summer days. One of the effects of elevated temperatures is partial unfolding or complete denaturation of many cellular proteins that, if uncorrected, could have lethal consequences for the cell. We learn in Section 21.5 how all studied eukaryotes sense the presence of unfolded proteins by the binding of chaperones to unfolded protein domains (see Chapter 3) and how this leads to the heat-shock response, during which a particular transcription factor becomes activated and then induces the synthesis of many chaperones that enable the cell to survive an elevated temperature until the temperature is reduced to normal. Similar chaperones play key roles in
facilitating folding of proteins within the endoplasmic reticulum lumen and mitochondria, as discussed in Chapter 13. Most living things on Earth are subject to a day-night cycle of almost exactly 24 hours. Their cells contain a circadian clock, or circadian oscillator — a group of proteins whose signaling oscillates with an endogenous period of 24 hours and that receives daily signals from the environment, primarily daylight and darkness, that keep it on time. These synchronized cell clocks, which we discuss in Section 21.6, make it possible for the organism to anticipate the environmental changes that derive from the day-night cycle and adjust its biology and behavior accordingly. In 2017, the Nobel Prize in Physiology or Medicine was awarded to three scientists for their discoveries of molecular mechanisms controlling the circadian rhythm in fruit flies; similar clocks are found in plant, fungal, and vertebrate cells that adjust many aspects of their function to a day-night cycle. Circadian rhythms in certain brain neurons control aspects of organismal behavior, such that mice and lions are active at night while humans are more active during the day. During development, cells proliferate and differentiate to generate organs of specific sizes. Indeed, certain mutations in the fly Drosophila melanogaster (see Chapter 1) result in excessive organ growth; one was called Hippo, as mutations caused massive overgrowth of larvae that looked like a hippopotamus. When part of an adult liver is surgically removed, the liver rapidly regenerates to its former size; clearly gene products must exist that negatively regulate growth when the appropriate organ size is achieved. In Section 21.7, we discuss the Hippo pathway, a
protein kinase signaling cascade conserved in all metazoans that senses and integrates multiple environmental cues and modulates cell growth in response to the physical environment. This pathway senses physical and mechanical cues from the extracellular matrix in which the cell is imbedded, senses tension (mechanotransduction), and receives signals from the adherens junctions (Chapter 20) that connect them with other cells. The Hippo pathway regulates the expression of multiple genes involved in growth control and differentiation, and we will see that abnormalities in components of this pathway contribute to developmental disorders, cell transformation, and metastases by many types of cancers.
Insulin and Glucagon Work Together to Maintain a Stable Blood Glucose Level
21.1 Regulating Blood Glucose Level In this section, we consider how multiple hormones and signal transduction pathways interact, focusing on one of the most important physiological control systems: regulation of the body’s need for glucose. Defects in these pathways lead to major diseases, particularly type 2 or adult-onset diabetes, a principal cause of blindness, kidney failure, and limb amputations in adults. Cellular responses to changes in amino acids and other nutrients, which are largely reflected in alterations in gene expression, are covered in Section 21.2. Insulin and Glucagon Work Together to Maintain a Stable Blood Glucose Level Our focus in this section is mainly on vertebrates, whose normal blood glucose concentration is about 5 mM. Because most body cells, including brain neurons, utilize glucose as their primary energy source, a prolonged fall in blood glucose, called hypoglycemia, can cause seizures, loss of consciousness, and death. In contrast, prolonged elevations in blood glucose above 9–10 mM can cause diabetes. During normal daily living, the maintenance of normal blood glucose concentrations depends on the
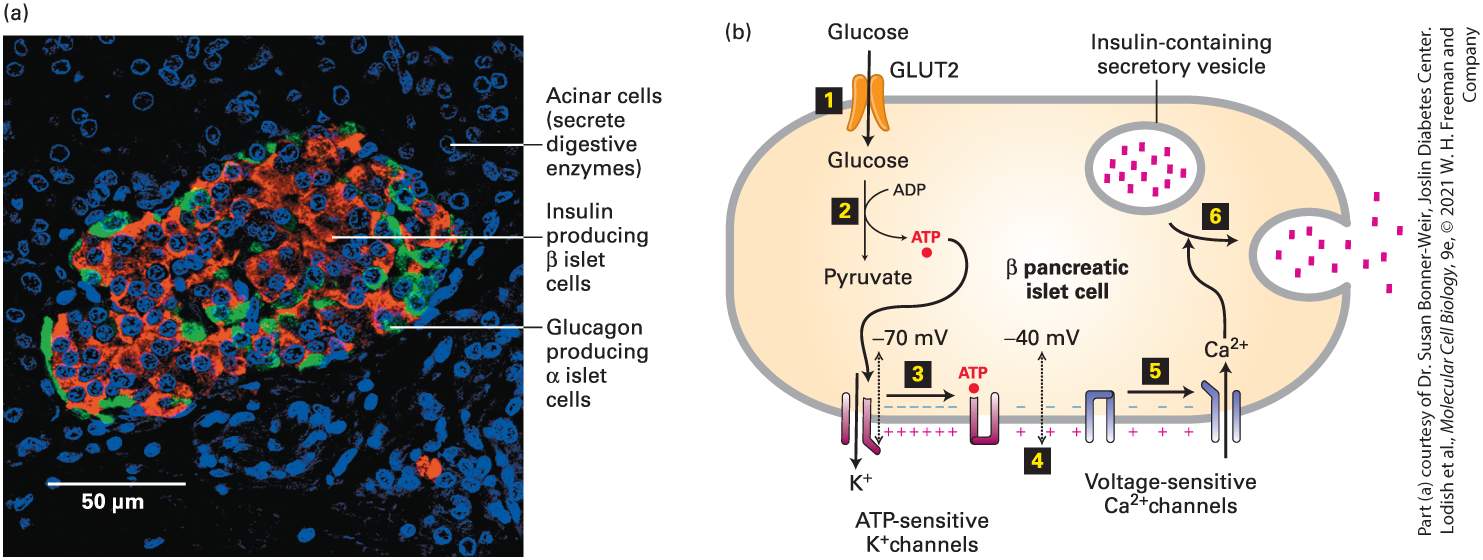
balance between two peptide hormones, insulin and glucagon, which are made in distinct and adjacent endocrine cells in island-like domains of the pancreas termed pancreatic islet cells (Figure 21-1a) and are stored in secretory vesicles prior to regulated secretion (see Figure 14-2). Insulin, which lowers blood glucose, contains two polypeptide chains linked by disulfide bonds and is synthesized by the β cells in the islets (see Figure 14-24). Glucagon is produced by the α cells in the islets and acts to raise blood glucose by inducing cleavage of glycogen into glucose in the liver and secretion of the glucose into the blood (see Chapter 15). The availability of blood glucose is regulated during periods of abundance (following a meal) or scarcity (following fasting) by the amounts of insulin and glucagon secreted from pancreatic islet β and α cells.
FIGURE 21-1 Secretion of insulin by pancreatic islet β cells in response to a rise in blood glucose above 5 mM. (a) A section of an islet in a human pancreas. Islets comprise about 2 percent of the mass of a pancreas. A human pancreas contains about one million islets, each of which contains about 1000 β cells. β cells, which comprise ~70 percent of islet cells, are revealed by a red histochemical stain for insulin. Glucagon, synthesized in the α cells largely on the periphery of the islet, is visualized by a green stain. The DAPI dye, blue, stains all nuclei. (b) Regulation of insulin secretion. Entry of glucose into pancreatic β cells is mediated by the GLUT2 glucose transporter (step 1 ). Because the of GLUT2
for glucose is 20 mM, a rise in extracellular glucose from 5 mM, characteristic of the fasting state, causes a proportional increase in the rate of glucose entry (see Figure 11-5). The conversion of glucose into pyruvate (Figure 12-3) is thus accelerated, resulting in an increase in the concentration of ATP in the cytosol (step 2 ). The binding of ATP to ATPsensitive channels in the β cells closes those channels (step 3 ), thus reducing the efflux of ions from the cell. The resulting small depolarization of the plasma membrane from ~ −70 mV to ~ −40 mV (step 4 ) triggers the opening of voltage-sensitive channels (step 5 ). The influx of ions raises the cytosolic concentration, triggering the fusion of insulin-containing secretory vesicles with the plasma membrane and the secretion of insulin (step 6 ). See J. C. Henquin, 2000, Diabetes 49:1751. Description The micrograph labeled (a) shows blue spots that are labeled acinar cells (secrete digestive enzymes). Insulin-producing beta islet cells are in red. Glucagon producing alpha islet cells are in green. The illustration (b) shows a rounded rectangular model of a pancreatic beta cell. At the top left of the cell, glucose enters through a G L U T 2 opening in the membrane. A D P is converted into A T P and goes down to A T P sensitive K plus channels, which release K plus ions from the cell. This causes the voltage channel to open to add C a 2 plus into the cell in response. The calcium goes to the insulin-containing secretory vesicle, which then opens to let insulin out of the cell. Secretion of glucagon from pancreatic α cells is inhibited by insulin when blood glucose is high; secretion is enhanced by signals from the central nervous system when blood glucose should increase. Like the epinephrine receptor, the glucagon receptor, found primarily on liver cells, is coupled to the protein, whose effector protein is adenylyl cyclase. The binding of glucagon to its receptor induces a rise in cAMP, leading to activation of protein kinase A, which inhibits glycogen synthesis and promotes glycogenolysis, yielding glucose 1-phosphate (see Figure 15-22). Liver
A Rise in Blood Glucose Triggers Insulin Secretion from the β Islet Cells
cells convert glucose 1-phosphate into glucose, which is released into the blood, thus raising blood glucose back toward its normal fasting level. Our focus here will be on the hormone insulin, which acts in several shortterm and long-term ways to reduce the level of blood glucose: Within seconds of its secretion, insulin induces an increase in the uptake of glucose from the blood into muscle and fat cells, primarily by increasing the number of glucose transporters in the plasma membrane. Within seconds to minutes, insulin acts on the liver to both stimulate glycogen synthesis from glucose and accelerate glucose flux through the glycolytic pathway; both processes provide a sink that helps lower glucose levels in the blood. Insulin released from β cells acts on the nearby α cells in the pancreatic islets to inhibit glucagon synthesis. Over a longer time frame of hours, insulin acts on the liver to inhibit synthesis of enzymes that catalyze the process termed gluconeogenesis — the synthesis of glucose from smaller metabolites. In the following sections, we see how insulin secretion is stimulated by a rise in blood glucose and then the multiple ways insulin acts to lower blood glucose. A Rise in Blood Glucose Triggers Insulin Secretion from the β Islet Cells
In Fat and Muscle Cells, Insulin Triggers Fusion of Intracellular Vesicles Containing the GLUT4 Glucose Transporter with the Plasma Membrane, Thus Increasing the Rate of Glucose Uptake
After a meal, when blood glucose rises above its normal level of 5 mM, the pancreatic β cells respond to the rise in glucose (and a concurrent rise in amino acids in the blood) by releasing insulin into the blood (Figure 211b). We saw in Chapter 14 that these cells store insulin in a dehydrated, almost crystalline form in secretory vesicles; as with all regulated secretory pathways, fusion of these vesicles with the plasma membrane and secretion of their contents is triggered by a rise in cytosolic . Insulin secretion is triggered by a rise in extracellular glucose, which, via GLUT2 glucose transporters (Figure 11-5), causes a proportionate increase in the rate of glucose entry into the cells and a corresponding increase in the rate of glycolysis. The resulting rise in the ratio of cytosolic ATP:ADP concentrations causes closing of an ion channel unique to the β cells, an ATP-gated channel, reducing the efflux of ions from the cell. As occurs at the axon termini of nerve cells (see Chapter 23), the resulting depolarization of the plasma membrane from ∼ −70 mV to ∼ −40 mV triggers the opening of voltage-sensitive channels, an increase in cytosolic , and insulin secretion. In Fat and Muscle Cells, Insulin Triggers Fusion of Intracellular Vesicles Containing the GLUT4 Glucose Transporter with the Plasma Membrane, Thus Increasing the Rate of Glucose Uptake
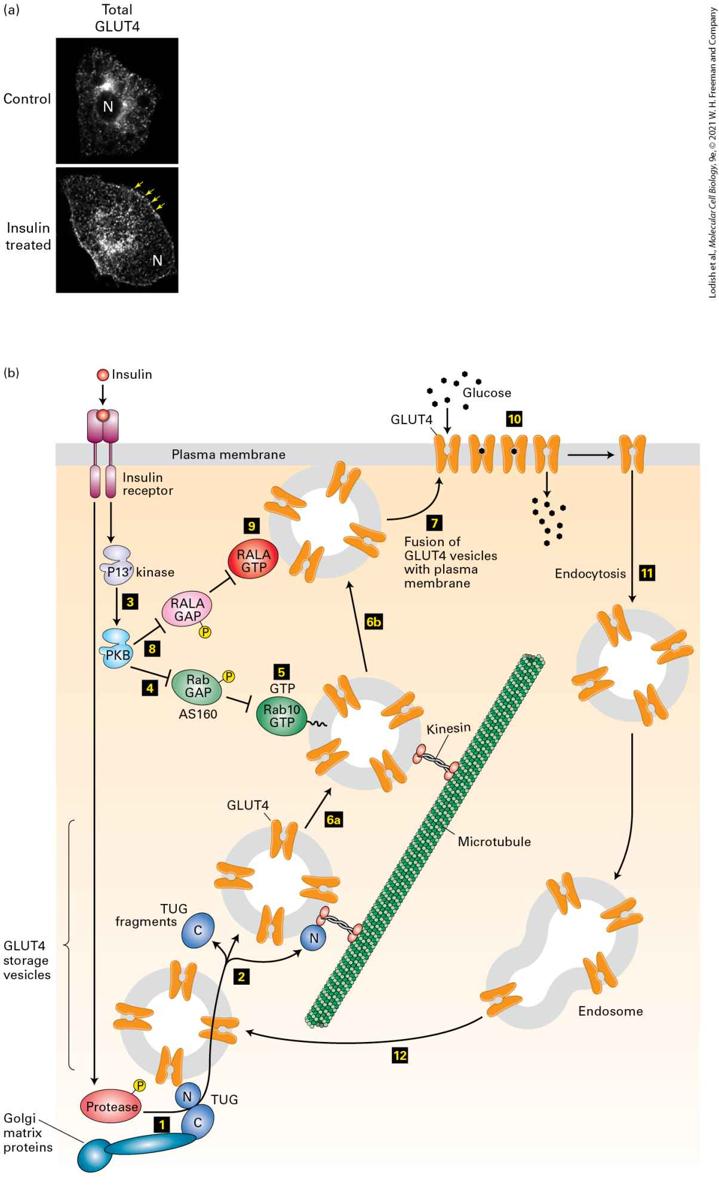
Once secreted from pancreatic β cells, insulin circulates in the blood and binds to insulin receptors, which are present on many different kinds of cells, including liver, muscle and adipocyte (fat) cells. In fat and muscle cells the insulin receptor, a receptor tyrosine kinase (see Chapter 16), activates several signal transduction pathways leading, within minutes, to a ~10-fold increase in the rate of uptake of glucose from the blood. Once imported, glucose is rapidly phosphorylated by hexokinase to form glucose 6-phosphate (Figure 12-3), which cannot be transported out of the cell; the increase in glucose import therefore results in rapid lowering of the level of blood glucose. Like the plasma membranes of most body cells, the membranes of fat and muscle cells contain the GLUT1 glucose transporter, which allows the cell to import sufficient glucose for its basal metabolic needs. Fat and muscle cells also express large amounts of a glucose transporter, the insulinresponsive glucose transporter GLUT4, made only by these cells. In resting (unstimulated) cells, virtually all of the GLUT4 is located in small vesicles in the cytosol (Figure 21-2a). While some GLUT4 is in endosomes, most is in a small organelle unique to fat and muscle cells termed the GLUT4 storage vesicle (GSV; Figure 21-2b). These vesicles, which are separate from but, as we will see, derived from endosomes, are tethered to the Golgi matrix, a network of coiled-coil proteins surrounding the Golgi complex, by a protein termed TUG (Tether containing a UBX domain for GLUT4). The N-terminal domain of TUG binds GLUT4 and other vesicle proteins while its C-terminal domain binds Golgi matrix proteins, preventing the movement of GSVs to the plasma membrane in the absence of insulin signaling.
EXPERIMENTAL FIGURE 21-2 Insulin stimulation of fat cells induces translocation of GLUT4 from intracellular vesicles to the plasma membrane. (a) Cultured adipose cells were engineered to express a chimeric protein comprising GLUT4 with a green fluorescent protein (GFP) fused to its C-terminus; live cells were visualized with a confocal fluorescence microscope. In the absence of insulin, virtually all of the GLUT4 is in intracellular membranes that are not connected to the plasma membrane; there is little surface staining. Treatment with insulin triggers fusion of the GLUT4-containing membranes with the plasma membrane, thereby moving GLUT4 to the cell surface and enabling it to transport glucose from the blood into the cell. Arrows highlight GLUT4 present at the plasma membrane; N indicates the position of the nucleus. (b) In fat and muscle cells, insulin signaling acts at multiple steps to increase the level of GLUT4 at the plasma membrane. In resting cells, the majority of the GLUT4 protein is localized to specialized GLUT4 storage vesicles (GSVs); much of the GLUT4 is tethered to proteins surrounding the Golgi complex, termed Golgi matrix proteins, by the TUG protein and is thus unable to move to the cell surface. Binding of insulin to the insulin receptor leads to activation of a protease (step 1 ) that cleaves the TUG protein, releasing GLUT4containing vesicles from the Golgi matrix (step 2 ). The N-terminal fragment of TUG remains bound to the GSVs and binds to the microtubule motor protein kinesin (step 6a ; see Chapter 18), enabling the GSVs to move along microtubules to the cell surface (step 6b ; below). Insulin also activates PKB (step 3 ; see Figure 16-17). PKB then phosphorylates the Rab GAP protein AS160 (step 4 ), inhibiting its ability to accelerate GTP hydrolysis by the GTP-binding protein Rab10 that is attached to a GSV by a covalently attached lipid. Rab10 then accumulates in its active GTP-bound state (step 5 ) and directs the GLUT4 storage vesicles to move along microtubules and interact with target proteins on the cell surface (steps 6a and 6b ). Finally, these GSVs fuse with the plasma membrane (step 7 ). This step is catalyzed by another monomeric GTP-binding protein, RalA, when in its active GTP-bound state. PKB stimulates this membrane fusion event by phosphorylating and thus inactivating the RalA GAP protein (step 8 ), allowing RalA to bind GTP (step 9 ). The resultant increase in plasma membrane GLUT4 allows the cell to incorporate glucose from the extracellular fluids at a rate of about 10 times that of unstimulated cells (step 10 ). Following removal of insulin, the plasma membrane GLUT4 is internalized by endocytosis (step 11 ) and eventually transported to GSVs (step 12 ). Many other proteins, not shown here, participate in these signaling and vesicle budding and fusion events; some of these proteins are also activated downstream of the insulin receptor
in pathways other than those requiring PKB. See J. S. Bogan, 2012, Annu. Rev. Biochem. 81:507; A. Klip, T. E. McGraw, and D. E. James, 2019, J. Biol. Chem. 294:11369. [Part (a) republished with permission from American Society for Biochemistry and Molecular Biology, from C. Yu et al., 2007, “The Glucose Transporter 4-Regulating Protein TUG Is Essential for Highly Insulin-Responsive Glucose Uptake in 3T3-L1 Adipocytes,” 2007, J. Biol. Chem. 282:7710; permission conveyed through Copyright Clearance Center, Inc.] Description The micrographs labeled (a) show adipose cells. In the first one, without insulin, the white spots are mostly inside the cell, not many on the edge. In the second, the cell is treated with insulin and now the white spots are mostly on the membrane of the cell, which allows glucose into the cell. The illustration labeled starts at the top left with a red dot of insulin being allowed into the cell through a receptor. One arrow moves the insulin down to Golgi matrix proteins, where it helps to make orange H shaped G L U T 4 proteins. The G L U T 4 proteins move in groups of 4 toward microtubules where some go to the cell membrane, and some do not. Another arrow from the insulin receptor at the top left goes to several proteins in multicolor shapes, which attach to the groups of 4 G L U T 4 proteins and help them in the fusion with the surface of the cell. Binding of insulin to its receptor triggers activation of a protease that catalyzes a site-specific endoproteolytic cleavage of TUG, separating the N-terminal GLUT4-binding segment from the C-terminus that is anchored to the Golgi matrix. (The signaling pathway by which this takes place is only now being completely identified.) The cleavage of TUG releases GLUT4 storage vesicles from the Golgi matrix and allows the released N-terminal TUG fragment to bind the microtubule motor protein kinesin (see
Chapter 18). This initiates the microtubule-based movement of the GSVs to the plasma membrane.
Movement of the GSVs to the plasma membrane is also regulated by two monomeric GTP-binding proteins, RalA and Rab10. Recall that several monomeric GTP-binding proteins are essential for the budding of intracellular transport vesicles (e.g., Sar proteins; see Figures 14-7 and 149); others, the Rabs, are essential for vesicle fusion (see Figure 14-11). As with other monomeric GTP-binding proteins, RalA and Rab10 (see Figure 21-2b) switch between the inactive GDP-bound and active GTP-bound state. Rab10 is bound to a GSV by a covalently attached lipid and regulates the movement of GLUT4 vesicles to the plasma membrane; RalA regulates vesicle fusion with the plasma membrane. Like other receptor tyrosine kinases, the insulin receptor activates the PI-3 kinase/PKB pathway (Figure 16-17). Active PKB, in turn, phosphorylates and by so doing inhibits the hydrolysis activity of two GAP proteins termed AS160 and RGC; phosphorylation also causes the binding of AS160 to the 14-3-3 protein (Figure 16-13) that sequesters it in the cytosol away from its target Rab proteins. In the basal (unstimulated) state, these GAPs inhibit RalA and Rab10 function by enhancing their rates of GTP hydrolysis, thus keeping the GLUT4 storage vesicles from moving along microtubules to and then fusing with the plasma membrane. Phosphorylation of both GAPs by PKB allows RalA and the Rab10 to accumulate in their active GTP-bound states, enabling them to facilitate multiple steps in the GLUT4 pathway, including transport of the GLUT4 storage vesicles along microtubules to the cell surface and fusion of these vesicles with the plasma membrane (see Figure 21-2b). The mechanisms by which RalA and Rab10 regulate GSV targeting and fusion are the subject of much current research.
In the Liver, Insulin Inhibits Glucose Synthesis, Accelerates the Rate of Glycolysis, and Enhances Storage of Glucose as Glycogen
As blood glucose level drops, insulin secretion and insulin blood levels drop, and insulin receptors are no longer activated as strongly. In fat and muscle cells, plasma-membrane GLUT4 becomes internalized by endocytosis. When insulin levels are low, GLUT4 diverges from other endocytosed cargo, and moves from endosomes to a segment of the transGolgi network, and from there to the GSVs where it is stored, thus lowering the level of cell-surface GLUT4 and thus of glucose import. In the Liver, Insulin Inhibits Glucose Synthesis, Accelerates the Rate of Glycolysis, and Enhances Storage of Glucose as Glycogen In Chapter 15, we learned that hepatocytes, the major cell type in the liver, are important regulators of glucose metabolism; these cells store excess glucose as glycogen. Insulin acts on the liver in several ways: by inhibiting gluconeogenesis (the metabolic pathway by which metabolites including pyruvate, oxaloacetate, and acetyl CoA are converted to glucose), by accelerating the rate of glycolysis, and by enhancing storage of glucose as glycogen. All of these actions have a common end point — reducing the generation by and release of glucose from hepatocytes and thus reducing the level of glucose in the blood. Insulin Promotes Glycogen Synthesis from Glucose
Within minutes, insulin stimulation of hepatocytes enhances the conversion of glucose to glycogen; PKB, which is activated downstream of the insulin receptor, plays a crucial role in this process as well. Active PKB phosphorylates GSK3 (the same enzyme that functions in the Wnt and Hh pathways; see Chapter 16). In resting (non-insulin-stimulated) cells, GSK3 is catalytically active and phosphorylates glycogen synthase, inhibiting its activity and thus blocking glycogen synthesis from glucose (see Figure 15-22). In contrast, in insulin-treated liver, when GSK3 becomes phosphorylated by PKB its catalytic activity is inhibited, so it cannot phosphorylate and thus inhibit glycogen synthase. Insulinstimulated activation of PKB therefore results in rapid activation of glycogen synthase and glycogen synthesis, helping remove glucose from the circulation and storing it as glycogen in muscle and liver. Insulin Accelerates the Rate of Glycolysis As we learned in Chapter 12, phosphofructokinase-1, the enzyme that catalyzes the reaction of fructose 6-phosphate and ATP to form fructose 1,6-bisphosphate and ADP, is a key rate-limiting enzyme in glycolysis. Insulin stimulation results in an enhancement of the activity of phosphofructokinase-1, thus accelerating the catabolism of glucose. It does so in part by enhancing the concentration of fructose 2,6bisphosphate, as fructose 2,6-bisphosphate allosterically activates phosphofructokinase-1 in liver cells (see Figure 12-4). Through a signal transduction pathway activated downstream of the insulin receptor, the activity of phosphofructokinase-2, the enzyme that forms fructose 2,6bisphosphate from fructose 6-phosphate and ATP, is enhanced, while the
activity of fructose bisphosphate phosphatase-2, the enzyme that hydrolyzes fructose 2,6-bisphosphate back to fructose 6-phosphate and , is inhibited. The end result is enhancement of phosphofructokinase-1 activity by fructose 2,6-bisphosphate, acceleration of glucose catabolism through the glycolytic pathway, and a reduction in blood glucose levels. Insulin Inhibits Synthesis of Key Enzymes Essential for Gluconeogenesis Insulin also acts on hepatocytes to inhibit glucose synthesis from smaller molecules (gluconeogenesis), such as lactate, pyruvate, and acetate (see
Chapter 12) and to enhance glycogen synthesis from glucose. Many of these effects are manifest at the level of gene transcription because insulin signaling reduces the expression of genes that encode enzymes that catalyze key steps in gluconeogenesis. The net effect of all these actions is to lower blood glucose to the fasting concentration of about 5 mM while storing the excess glucose intracellularly as glycogen for future use. If the blood glucose level falls below about 5 mM, for example, due to sudden muscular activity, the reduced insulin secretion from pancreatic β cells results in increased glucagon secretion from the adjacent pancreatic α cells. The secretion of glucagon into the blood quickly triggers the breakdown of glycogen (Figure 15-22) to increase blood glucose levels and thus to restore blood glucose to the normal range.
Unfortunately, these intricate and powerful control systems sometimes fail, causing serious, even life-threatening, diseases, mainly diabetes mellitus. In diabetes, the regulation of blood glucose is impaired, leading to persistent elevation of the blood glucose concentration (hyperglycemia) that, if left untreated, leads to the major complications noted above. Type 1 diabetes mellitus, common in children and young adults, is caused by an autoimmune process that destroys the insulinproducing β cells in the pancreas. Sometimes called insulin-dependent diabetes, this form of the disease is generally responsive to regulated, lifelong insulin injections and constant external monitoring of blood glucose levels. Most adults in developed countries with diabetes mellitus have type 2, sometimes called non-insulin-dependent diabetes; this condition results from a decrease in the ability of muscle, fat, and liver cells to respond to insulin and from a loss of functional insulin-producing β cells as the body tries to compensate for an elevated glucose level by overproducing insulin. While the underlying causes of this form of the disease are not well understood, obesity is correlated with a huge increase in the incidence of type 2 diabetes. Obesity also contributes to the malfunction of adipocytes, the cells that store fatty acids as triglycerides. The resulting accumulation of lipids (particularly diacylglycerols and sphingolipids) in muscle and liver impairs insulin action in these tissues. Further identification of the signaling pathways that control energy metabolism is expected to provide insight into the pathophysiology of diabetes, hopefully leading to new methods for its prevention and treatment.

KEY CONCEPTS OF SECTION 21.1 Regulating Blood Glucose Level The maintenance of normal blood glucose concentrations depends on the balance between two hormones, insulin and glucagon, which are made in adjacent pancreatic islet cells. Insulin acts to lower blood glucose when the level rises above the normal 5 mM, while glucagon raises blood glucose levels. Insulin secretion by β islet cells is triggered by an increase in glucose influx, which leads to an increase in glycolysis, a rise in ATP levels, a closing of channels, and an opening of channels. Insulin acts on fat and muscle cells to increase the rate of glucose import. Activation of insulin receptors triggers several signal transduction pathways that lead to movement of GLUT4 glucose transporters from internal GSVs to and fusion with the plasma membrane. Insulin acts on hepatocytes to inhibit glucose synthesis, accelerate the rate of glycolysis, and enhance storage of glucose as glycogen.
21.2 Integrating Cell Growth Signals with Nutrient and Energy Levels
21.2 Integrating Cell Growth Signals with Nutrient and Energy Levels In the previous section, we saw how sensing and maintaining the level of a single molecule, glucose, is essential to the metabolism of vertebrate cells and organisms. However, for some processes cells must be able to sense multiple diverse molecules simultaneously and integrate these signaling inputs into a signal transduction pathway that allows activation of multiple downstream pathways. An important example is the decision of a cell to enter the cell division cycle (see Chapter 19). Initiation of cell division requires not only stimulation by specific growth factors that are on the surface of adjacent cells or in the surrounding medium (see Chapter 16) but also the presence of sufficient amino acids, nucleotides, and other small molecules in the cell’s environment. Additionally, the rate of metabolism of glucose, fatty acids, and other energy sources must be sufficient to produce a level of ATP that can power synthesis of all of the proteins, nucleic acids, membranes, and other components necessary for the cell mass to double in preparation for its division. In this section, we discuss the TOR pathway and its key component, the mTORC1 protein kinase, a large multisubunit complex that regulates cell growth by integrating inputs from multiple cytosolic sensor proteins. We will see in detail how the activity of this kinase is regulated by levels of
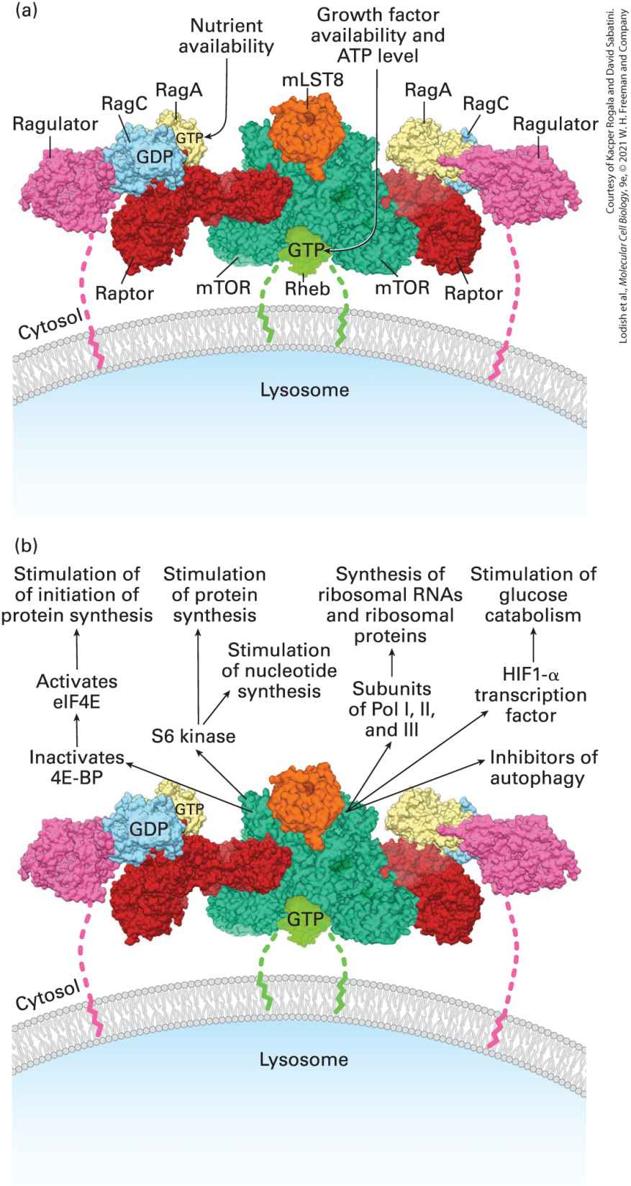
certain amino acids in the cytosol and within the lysosome, by the level of ATP, and by the levels of several intracellular signal transduction proteins, mainly kinases, activated downstream of growth-factor receptors. We also learn how the multiple substrates of active mTORC1 kinase in turn activate many signaling pathways necessary for cell growth and proliferation and repress autophagy, which otherwise would recycle these macromolecules back to their small molecule constituents. We also will see how improper activation of the mTORC1 signaling network contributes to human disease and learn that inhibitors of this kinase are used in the clinic. The TOR pathway was discovered through research into the mechanism of action of rapamycin, an antibiotic produced by a strain of Streptomyces bacteria (see the chapter-opening figure). Rapamycin also proved to be useful for suppressing the immune response in organ transplant patients, initially, without knowledge of how it functioned. The target of rapamycin (TOR), a protein that is inhibited by rapamycin, was identified by isolating yeast mutants resistant to rapamycin inhibition of cell growth. Yeast TOR is a large (~2400 amino acid) protein kinase that regulates several cellular processes in yeast cells in response to nutritional status. Both yeast TOR and metazoan TOR (mTOR) are incorporated into two multisubunit complexes, mTORC1 and mTORC2. Here we will focus on the better understood mTORC1 complex (Figure 21-3). The large mTORC1 complex is assembled on the cytosolic surface of the lysosome. We first discuss the multiple signal transduction pathways mTORC1 activates that in turn stimulate cell growth and division, and then the mechanism of mTORC1 activation.
FIGURE 21-3 The mTORC1 complex. (a) Model of the active mTORC1 complex on the surface of the lysosome. The mTORC1 kinase consists of the kinase mTOR, Raptor (regulatory protein associated with mTOR), and many other proteins that regulate mTOR activity. Activation of the mTORC kinase requires its localization to the lysosome surface by the simultaneous conversion of two small GTP-binding proteins, Rheb and RagA, to their active GTP-bound state. Conversion of RagA to its active GTP-bound state occurs when there are sufficient levels of amino acids and other nutrients in the cytosol (Figure 21- 4). Conversion of Rheb to its active GTP-bound state occurs downstream of activated kinases such as ERK and PKB that in turn are part of the signal transduction pathways activated downstream of many growth-factor receptors (Figure 21-5); conversion of Rheb to its active GTP-bound state also requires a high level of ATP. Thus mTORC1 integrates signals from many cellular states and in turn regulates many aspects of cell growth and metabolism. Note that both Rheb and the Ragulator protein that binds RagA (and its associated RagC) have lipid-modified terminal residues that tether these components of the supercomplex to the lysosomal membrane. (b) Multiple anabolic signal transduction pathways activated by the mTORC1 complex. Shown are some of the target proteins directly phosphorylated by active mTORC1 that stimulate RNA and protein synthesis and accelerate glycolysis, processes essential for cell growth. See text for details. [Part (a) data from K. B. Rogala et al., 2019, Science 366(6464):468–475; https://doi.org/10.1126/science.aay0166.] Description The illustration labeled (a) shows the three-dimensional space-filling model of m T O R C 1. The names of proteins are listed and each one is color-coded to show their position. From left to right, the names across the top are Ragulator, Rag C, G D P, R a g A, G T P, m L S T 8, R a g A, R a g C, Ragulator. Along the bottom of this diagram is another list of names, from right to left: Raptor, m T O R, R h e b, G T P, m T O R, Raptor. At the top, a label pointing to G T P reads nutrient availability. Also at the top, another label reads Growth factor availability and A T P level and points to the G T P under the m T O R at the bottom. The illustration labeled (b) shows the same three- dimensional space-filling model. However, the names of the proteins are removed and a set of pathways are listed. Five pathways move up from the m T O R protein. The leftmost path, from m T O R to top reads, inactivates 4 E-B P, activates e l F 4 E, stimulation of initiation of protein synthesis. The next pathway reads, from m T O R to
The Active mTORC1 Complex Activates Many Anabolic Signal Transduction Pathways
top reads, S 6 kinase, stimulation of nucleotide and protein synthesis. The middle pathway from m T O R to top reads, Subunits of Pol 1, 2, and 3, synthesis of ribosomal R N A's and ribosomal proteins. The fourth path from m T O R to top reads, H I F 1 alpha transcription factor, stimulation of glucose catabolism. The last path points to inhibitors of autophagy. The Active mTORC1 Complex Activates Many Anabolic Signal Transduction Pathways In this section, we describe some of the target proteins directly phosphorylated by active mTORC1 that in turn stimulate ribosome, RNA, and protein synthesis, and accelerate the rate of glucose metabolism, all processes essential for cell growth (Figure 21-3b). In the next section, we detail how mTORC1 activity is regulated (Figure 21-3a). Enhancing the Rate of Messenger RNA Translation and Protein Synthesis mTORC1 stimulates the rate of messenger RNA translation, and thus overall protein synthesis, through two principal mechanisms: stimulating the production of ribosomes and other molecules necessary for protein synthesis and stimulating the rate of polypeptide chain initiation by ribosomes on mRNAs.
Recall that the first step in translation of a eukaryotic mRNA is binding of the eIF4 initiation complex to the cap on mRNAs via its eIF4E capbinding subunit (see Figure 5-36). The concentration of active eIF4E, and thus the rate of polypeptide chain initiation, is down-regulated by a small family of homologous eIF4E-binding proteins (4E-BPs) that bind to and in so doing inhibit the interaction of eIF4E with mRNA caps. 4E-BPs are directly phosphorylated by active mTORC1. When phosphorylated by mTORC1, 4E-BPs release eIF4E, stimulating the assembly of a translation initiation complex on the mRNA and thus initiation of protein translation. mTORC1 also phosphorylates and activates another protein kinase, S6K, that in turn phosphorylates and thus activates several translation initiation factors, leading to a further increase in the rate of protein synthesis. Translation of a specific subset of mRNAs that have a string of pyrimidines in their untranslated regions (called TOP mRNAs for tract of oligopyrimidine) is stimulated particularly strongly by phosphorylation of 4E-BP and S6K phosphorylation of another substrate of mTORC1, the RNA binding protein LARP1. TOP mRNAs encode ribosomal proteins and translation initiation and elongation factors; thus enhanced production of these proteins contributes to the production of additional ribosomes in the cell and further enhances the rate of mRNA translation. S6K also phosphorylates its namesake substrate, the S6 subunit of the small ribosomal subunit, but the effects of this phosphorylation on protein synthesis are not understood.
Enhancing the Synthesis of Ribosomal RNAs and tRNAs Ribosomes constitute about 15 percent of the mass of an average metazoan cell. Active mTORC1 stimulates ribosome production by enhancing the synthesis not only of ribosomal proteins, as noted above, but also of ribosomal RNAs. In ways that are not fully understood, mTORC1 activates the RNA polymerase I transcription factor TIF-1A, stimulating transcription of the large rRNA precursor (see Figure 8-51). mTOR activates transcription by RNA polymerase III as well, by phosphorylating and thereby activating protein kinases that phosphorylate MAF1, a protein inhibitor of RNA polymerase III transcription. MAF1 phosphorylation causes it to be exported from the nucleus, relieving repression of RNA polymerase III transcription and enabling it to synthesize 5S ribosomal RNA as well as many tRNAs. When mTOR activity falls, MAF1 in the cytoplasm is rapidly de-phosphorylated and imported into the nucleus, where it represses transcription by RNA polymerase III. In addition, mTOR activates two RNA polymerase II activators that stimulate transcription of ribosomal protein and translation factor genes. Finally, mTOR stimulates processing of the rRNA precursor (see Section 9.5) into mature ribosomal RNAs. As a consequence of phosphorylation of these several mTOR substrates, the synthesis and assembly of ribosomes as well as the synthesis of translation factors and tRNAs are greatly increased. Additionally, mTORC1 stimulates the synthesis of pyrimidines, a principal building block of RNA, from smaller molecules, again
contributing to the enhanced production of ribosomal and other RNAs. Alternatively, when mTOR kinase activity is inhibited, these substrates become de-phosphorylated, greatly decreasing the rate of protein synthesis and the production of ribosomes, translation factors, and tRNAs, thus slowing or halting cell growth. In summary, active mTORC1 stimulates the overall rate of protein synthesis and thus of cell growth by activating transcription factors that enhance expression of ribosomal components, tRNAs, and translation factors. mTORC1 also activates two critical proteins that directly enhance mRNA translation. Stimulating Glycolysis Cell growth requires a ready supply of ATP, and activated mTORC1 stimulates glycolysis, the conversion of glucose to pyruvate with the concomitant production of ATP, by increasing expression of the glucose transporter GLUT1, which enhances the rate of glucose import into the cell (see Chapter 11). Activated mTORC1 also increases the production of many enzymes in the glycolytic pathway (see Chapter 12) through increasing the level of the transcription factor hypoxia-inducible factor 1α (HIF-1α). As we will learn in Section 21.4, the HIF-1α protein is rapidly degraded under normal oxygen concentrations but is stabilized during oxygen depletion, a regulation independent of mTORC1 activity. However, because of the selective increase in the rate of translation of HIF-1α mRNA induced by mTORC1, mTORC1 activation leads to an increase in HIF-1α levels even under normal levels of oxygen. HIF-1α in turn
mTORC1 Kinase Activation Requires Amino Acids, a High ATP:AMP Ratio, and Activation of Signal Transduction Pathways Downstream of Growth-Factor Receptors
increases the rate of transcription of many genes encoding enzymes in the glycolytic pathway, enhancing ATP levels even in the presence of oxygen. Inhibiting Autophagy In addition to enhancing the global rate of cellular protein synthesis and the production of ribosomes, tRNAs, and translation factors, mTORC1 regulates other processes involved in the response to low levels of nutrients, particularly macroautophagy (or simply autophagy). During starvation of one or more essential nutrients, when mTOR activity falls, cells degrade cytoplasmic constituents, including whole organelles, to supply energy and precursors for essential cellular processes (see Chapter 14). During this process, a large, double-membrane structure engulfs a region of cytoplasm to form an autophagosome, which then fuses with a lysosome where the entrapped proteins, lipids, and other macromolecules are degraded and their nutrient constituents recycled. Activated mTORC1 inhibits macroautophagy in growing cells when nutrients are plentiful, in part by phosphorylation and inhibition of the autophagy-initiating kinase Unc-51-like kinase-1 (abbreviated ULK1). Many of the details of this and other actions of mTORC1 are only now being discovered. mTORC1 Kinase Activation Requires Amino Acids, a High ATP:AMP Ratio, and Activation of Signal
Transduction Pathways Downstream of Growth-Factor Receptors Having learned how activated mTORC1 stimulates many aspects of macromolecular synthesis and cell growth, we turn now to its mechanism of activation: how mTORC1 kinase activation simultaneously requires high levels of cytosolic amino acids, a high ATP:AMP ratio, and signals from growth-factor receptors. This process involves the assembly on the cytosolic surface of lysosomes of the huge multisubunit mTORC1 complex depicted in Figure 21-3a. Activation by Cytosolic Amino Acids A high level of all 20 amino acids is obviously necessary for protein synthesis to proceed, but somehow vertebrate evolution has selected the levels of only three amino acids, leucine, arginine, and the methionine metabolite S-adenosylmethionine (SAM), as the ones that regulate mTORC1 kinase activity (Figure 21-4). (Flies and yeasts utilize different sets of amino acids and nutrients.) The levels of these amino acids in the cytosol regulate a pair of small GTP-binding proteins, RagA and RagC, which are always anchored to a lysosome surface by a lipid attached to Ragulator, a Rag-binding protein.
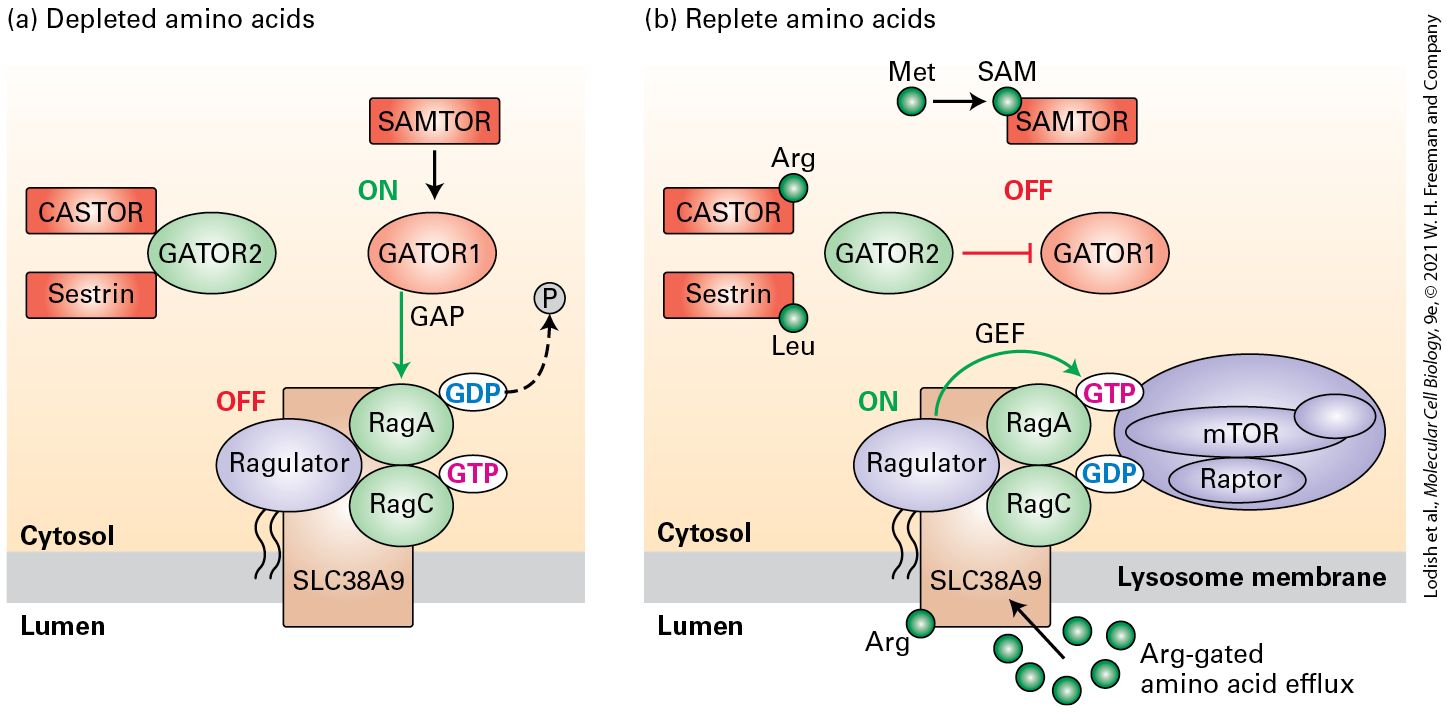
FIGURE 21-4 Model of the activation of the RagA regulator of the mTORC1 complex by three cytosolic amino acids. RagA and RagC are bound to the Ragulator protein that is tethered to the cytosolic surface of a lysosome membrane by a long covalently attached lipid. Like all small GTP-binding proteins, RagA cycles between an active state with bound GTP and an inactive state with bound GDP. RagA must be in its GTP-bound state (and oddly, RagC in its GDP state) to recruit the core mTORC1 complex to the lysosome surface where it can become activated by other signals downstream of growth-factor receptors. GATOR1 is the GAP that converts active RagA⋅GTP to inactive RagA⋅GDP and its activity is regulated by the level of three amino acids, leucine, arginine, and a metabolite of methionine, S-adenosylmethionine (SAM). (a) Under conditions of amino acid depletion, GATOR1 is active and promotes the conversion of RagA⋅GTP to RagA⋅GDP, thus generating RagA/C heterodimers that cannot bind mTORC1. GATOR2, a protein that binds to and inhibits GATOR1 GAP activity, is constrained from doing so by binding to the unoccupied cytosolic leucine receptor Sestrin and the unoccupied arginine receptor CASTOR. SAMTOR, the cytosolic receptor for SAM, when not bound to SAM binds to and activates GATOR1 activity, further favoring the conversion of RagA⋅GTP to RagA⋅GDP. (b) In the presence of sufficient arginine, leucine, and SAM, the GAP activity of GATOR1 becomes inactivated and RagA accumulates in the active GTP-bound state. Under these amino acid–replete conditions, leucine, arginine, and methionine-derived SAM directly bind to their sensors, Sestrin, CASTOR, and SAMTOR, respectively. This triggers inhibition of GATOR1 GAP activity: release of Sestrin and CASTOR from GATOR2 allows GATOR2 to bind to and inhibit GATOR1 through an unknown mechanism, and SAMTOR is unable to activate GATOR1 GAP activity. Efflux of arginine from the lumen of the lysosome into the
cytosol, catalyzed by the transport protein SLC38A9, also contributes to accumulation of RagA in its GTP bound active state. RagA⋅GTP in turn binds mTOR kinase to the lysosome surface, but activation of mTORC1 kinase activity requires additional signals downstream of growth-factor receptors (Figure 21-5). See A. J. Valvezan and B. D. Manning, 2019, Nat. Metab. 1:321. Description The illustration labeled (a) shows, at left, two red rectangles, labeled CASTOR and Sestrin and both are attached to a green oval labeled GATOR 2. This combination separate from the rest. At right, the diagram starts at the top with a red rectangle labeled SAMTOR. A downward arrow is labeled ON and goes to a red oval labeled GATOR 1. A red arrow at a downward angle from the oval points to a gray circle labeled P coming off of a blue oval labeled G D P. The G D P is attached to a green oval labeled R a g A. Below the G D P is a green oval with R a g C attached to a pink oval labeled G T P. The green ovals are attached on the left side to Ragulator in a blue oval with a corresponding text off. Holding these three large ovals together is a brown rectangle labeled S L C 3 8 A 9, which is located between the lumen and the cytosol. The illustration labeled (b) is a similar diagram, except now the CASTOR and Sestrin rectangles are not attached to GATOR 2. CASTOR has a green Arg oval attached and Sestrin has a green Leu oval attached. GATOR 2 is changed to GATOR 1, which is not attached to the upper rectangle or the lower ovals. The G D P and G T P ovals are now attached to a large blue oval on the right that has m T O R, Raptor, and the lysosome membrane is near. An arrow from the green Arg oval in the lumen points to the brown rectangle labeled S L C 3 8 A 9 located between the lumen and the cytosol. The small GTP-binding protein RagA is a key regulator of mTORC1 activity; it enables mTORC1 kinase activity to become activated only when the levels of leucine, arginine, and SAM in the cytosol are sufficiently high. (The associated GTP-binding protein RagC has a minor role in mTORC regulation, and oddly its active state is one with a bound GDP, not GTP.) Like all small GTP-binding proteins, RagA shuttles
between its active GTP-bound and inactive GDP bound state; RagA must be in its GTP-bound state to recruit the core mTOR kinase complex to the lysosome surface where it can become activated by other signals downstream of growth-factor receptors. The RagA GEF, the lysosome membrane protein SLC38A9 that also functions as an arginine regulated transport protein for several amino acids, continuously triggers the dissociation of the GDP from RagA⋅GDP, promoting the binding of GTP to RagA to form RagA⋅GTP. Rag regulation focuses on GATOR1, the GAP that converts active RagA⋅GTP to the inactive RagA⋅GDP. GATOR1 is active when any of the three crucial amino acids, leucine, arginine, and SAM, are depleted in the cytosol, putting RagA in the GDP state and blocking recruitment of mTOR to the lysosome (Figure 21-4a). Binding of another protein complex, termed GATOR2, to GATOR1 inhibits the GATOR1 GAP activity. However, if the levels of arginine or leucine are low, the binding of GATOR2 to GATOR1 is blocked, probably because GATOR2 becomes bound instead to the unoccupied arginine sensor CASTOR (cellular arginine sensor for mTORC1) or the unoccupied leucine sensor Sestrin2. When present at sufficient levels, arginine and leucine bind to defined sites on CASTOR and Sestrin2, respectively. This binding triggers conformational changes that cause CASTOR and Sestrin2 to dissociate from their inhibitory interactions with GATOR2, allowing GATOR2 to bind to GATOR1 and inhibit GATOR1 GAP activity; this promotes accumulation of RagA in its active GTP-bound state (Figure 214b), capable of recruiting mTOR to the complex on the surface of the lysosome.
SAMTOR, the SAM-binding protein, works differently. In the absence of SAM, SAMTOR binds directly to GATOR1 and enhances its GAP activity; binding of SAM to SAMTOR prevents its binding to GATOR1 and reduces GATOR1 GAP activity. Efflux of arginine from the lumen of the lysosome into the cytosol, catalyzed by the transport protein SLC38A9, also contributes to accumulation of RagA in its GTP bound active state. Thus RagA accumulates in the active GTP-bound state only when there are sufficient levels of leucine, arginine, and SAM in the cytosol. RagA⋅GTP in turn recruits the inactive mTOR from the cytosol to the lysosome surface, but activation of mTORC1 kinase activity requires additional signals downstream of growth factor receptors, as we see in the next section. The mTORC1 Complex Is Activated by a High ATP:AMP Ratio and by ERK and PKB Kinases Activated Downstream of Growth Factor Receptors Having sufficient levels of amino acids, nucleotides, and other small molecules is necessary for a cell to undergo division, but it is not sufficient. The key to understanding how activation of growth factor receptors also promotes the activation of mTORC1 is another small GTPbinding protein, Rheb (Figure 21-5). Like RagA, Rheb switches between its active GTP-bound and inactive GDP-bound state. Rheb is tethered to the surface of the lysosome by a covalently attached lipid, and it must be
in its GTP-bound state to bind to and activate the mTOR complex that has been brought to the lysosome surface by RagA⋅GTP.
FIGURE 21-5 Model of the activation of the mTORC1 complex by a high ATP:AMP ratio and by kinases activated downstream of growth factor receptors. The presence of sufficient levels of three amino acids in the cytosol is required to bind the mTOR complex to the lysosome surface (see Figure 21-4). Full activation of mTORC1 kinase activity requires the conversion of the inactive Rheb⋅GDP protein to its active Rheb⋅GTP state by kinases activated downstream of growth factor receptors and by a high ATP:AMP ratio. The TSC GAP complex is the only well-established regulator of Rheb identified to date. (a) In absence of growth factors or in a state of low ATP, the mTORC1 kinase is anchored to the lysosome surface (Figure 12-4) but is catalytically inactive because Rheb accumulates in the GDP-bound state and is unable to activate mTORC1 kinase activity. In the absence of growth factor signaling the TSC protein complex, comprising TSC1 and TSC2, localizes to the lysosome surface. TSC possesses highly specific GTPase-activating protein (GAP) activity toward Rheb and thus converts Rheb to the inactive GDP-bound state. A lowenergy state, such as during glucose deprivation, results in an increase in the level of cytosolic AMP, which activates the AMP-activated protein kinase AMPK. AMPK phosphorylates TSC2 at a site that further activates the GAP activity of the TSC complex toward Rheb⋅GTP. Thus a low ATP:AMP ratio also causes Rheb to accumulate in the inactive GDP-bound state and prevents binding and activation of the mTORC1 complex. (b) Addition of growth factors causes Rheb to accumulate in the GTP-bound state, activating mTORC1 kinase activity. TSC2 is a heavily phosphorylated protein, and several protein kinases activated downstream of different growth factor receptors phosphorylate sites on the TSC2 subunit of the TSC complex, inactivating TSC GAP activity and causing dissociation of the TSC complex from lysosomal-bound Rheb. Two such kinases are depicted here, protein kinase B (PKB), activated by the PI-3 kinase pathway (Figure 16-17) and MAP kinase (MAPK), activated by the Ras/MAP kinase pathway (Figure 16-13). Inhibition of TSC GAP activity by these phosphorylation events causes Rheb to accumulate in its active GTP-bound state, able to bind a subunit of the mTORC1 complex already linked to the lysosome membrane, and by so doing activating mTORC1 kinase activity and triggering multiple downstream signal transduction pathways. See A. J. Valvezan and B. D. Manning, 2019, Nat. Metab. 1:321. Description In the illustration labeled (a) R h e b. G D P protein is attached to the lysosome membrane. It is attached to a T S C complex that contains T S C 1 and T S C 2. Text
above the T S C complex reads on. The low energy low A T P : A M P ratio activates the A M P activated protein kinase (A M P K), which phosphorylates T S C 2 and activates G A P. To the left of T S C complex is m T O R, Raptor, and L S T 8. Above the blue oval is a red rectangle labeled kinase off. The blue oval is attached to ovalshaped G D P and G T P. G T P is attached to a green oval labeled R a g A. Below the G T P is a green oval with R a g C attached to G D P. The green ovals are attached on the left side to Ragulator in a blue oval with a corresponding text on. Holding these three large ovals together is a brown rectangle labeled S L C 3 8 A 9, which is located between the lumen and the cytosol. The illustration labeled (b) shows the attachment of growth factors to the plasma membrane with receptor tyrosine kinases which forms R h e b. G T P. The R h e b.G T P attaches to the blue oval with m T O R, Raptor, activates it, and dissociates T S C complex. The blue oval attaches to S L C 3 8 A 9 in the cytosol. Above the blue oval is a green rectangle labeled kinase on. Phosphorylation takes place in the receptor tyrosine kinase. Two arrows from the receptor point to two pathways P I 3 K and R A S. An arrow from P I 3 K leads to P K B and an arrow from R A S leads to M A P K. Arrow from P K B and M A P K points to several phosphorylate sites on the T S C 2 subunit of T S C complex. Text above the T S C complex reads off. As with RagA, GEF proteins, whose identity is unknown, continuously trigger dissociation of the GDP from Rheb⋅GDP and allow formation of Rheb⋅GTP and thus activation of mTORC1. Regulation is focused on the GAP that converts the active Rheb⋅GTP to inactive Rheb⋅GDP, a heterodimer composed of subunits TSC1 and TSC2, named for their involvement in the medical syndrome tuberous sclerosis complex, as discussed below. This TSC complex converts Rheb to its GDP-bound conformation, which does not bind mTOR or activate mTORC1 kinase activity. TSC2 is phosphorylated by multiple protein kinases that regulate its activity and thus the ability of mTORC1 to accumulate in its active state
on the lysosomal surface (Figures 21-5a and b). As we learned in Chapter 16, signaling from many cell-surface growth factor receptor tyrosine kinases leads to activation of the Ras MAPK pathway and MAP kinase (MAPK) in particular. Protein kinase B (PKB) is also activated as part of the PI-3 kinase signaling pathway downstream of many receptor tyrosine kinases. Both MAPK and PKB phosphorylate TSC1/TSC2 at sites that inhibit its GAP activity, causing an increase in accumulation of Rheb⋅GTP and activation of mTORC1 kinase activity (Figure 21-5b). This type of regulation through cell-surface receptors links the control of cell growth to developmental processes controlled by cell-cell interactions. Cells also require a high concentration of ATP to undergo proliferation. A reduction in ATP levels cause an increase in ADP and AMP levels; an accumulation of AMP triggers activation of AMP-activated protein kinase (AMPK). Active AMPK phosphorylates distinct sites on TSC2 that enhance its GAP activity and thus turn off Rheb⋅GTP–mTORC1 signaling under conditions of cellular energy depletion (Figure 21-5a). AMPK is inactive under conditions of sufficient ATP, but hypoxia and other cellular stresses also activate the TSC1/TSC2 Rheb-GAP. In summary, activation of MAPK, PKB, and other kinases downstream of growth factor receptors, together with a high cytosolic level of ATP, cause Rheb to accumulate in its active GTP state and to bind to and activate the mTORC1 kinase already at the surface of the lysosome, triggering the multiple downstream anabolic processes discussed above.
Genes encoding components of the mTOR pathway are mutated in many human cancers, resulting in cell growth in the absence of normal growth signals. TSC1 and TSC2 (see Figure 21-5) were initially identified because one or the other of these proteins is mutated in a rare human genetic syndrome: tuberous sclerosis complex. Patients with this disorder develop benign tumors in multiple tissues. The disease results because inactivation of either TSC1 or TSC2 eliminates the Rheb-GAP activity of the TSC1/TSC2 heterodimer, resulting in an abnormally high and unregulated level of Rheb⋅GTP and in the resulting high, unregulated activity of mTORC1. Mutations in components of cell-surface receptor signal transduction pathways that lead to inhibition of TSC1/TSC2 RhebGAP activity are also common in human tumors and contribute to cell growth and replication in the absence of normal signals for growth and proliferation (see Chapter 25). High mTORC1 protein kinase activity in tumors correlates with a poor clinical prognosis. Consequently, mTOR inhibitors are currently in clinical trials to test their effectiveness for treating cancers in conjunction with other modes of therapy. Rapamycin and other structurally related mTOR inhibitors are potent suppressors of the immune response because they inhibit activation and replication of T lymphocytes in response to foreign antigens (see Chapter 24). Several viruses encode proteins that activate mTOR early after viral infection. The resulting stimulation of translation has an obvious selective advantage for these cellular parasites. KEY CONCEPTS OF SECTION 21.2
Integrating Cell Growth Signals with Nutrient and Energy Levels The mTORC1 kinase complex is assembled on the cytosolic surface of the lysosome and consists of the kinase mTOR, the small GTP-binding proteins RagA and Rheb, and many other proteins that regulate mTOR kinase activity (see Figure 21-3). The active mTORC1 kinase activates many anabolic signal transduction pathways, including mRNA translation, synthesis of ribosomal RNAs and proteins and tRNAs, and glycolysis, and inhibits autophagy (see Figure 21-3b). mTORC1 kinase activation requires the presence in the cytosol of the amino acids arginine, leucine, and S-adenosylmethionine. In the absence of any these amino acids GATOR1, the GAP for RagA, causes RagA to accumulate in the GDP-bound state; the RagA⋅GDP complex is unable to bring the mTOR kinase to the lysosome surface where it can become activated. Binding of these three amino acids to their respective cytosolic sensor proteins triggers an inhibition of the GATOR GAP activity, allowing RagA to accumulate in the active GTP-bound state where it tethers the mTOR kinase to the surface of the lysosome (see Figure 21-4). Activation of the mTOR kinase also requires a high ATP:AMP ratio and active ERK and PKB, kinases that are activated downstream of receptor tyrosine kinases. These signaling pathways act on the TSC complex, a GAP for another small GTP-binding protein called Rheb, to allow Rheb to accumulate in the active GTP-bound state. Accumulation of Rheb⋅GTP triggers activation of the mTOR kinase that has been tethered to the lysosome surface by RagA⋅GTP (see Figure 21-5).
Fatty Acid and Cholesterol Biosynthesis as Well as Cholesterol Import Are Regulated at the Level of Gene Transcription
21.3 Responding to Changes in the Levels of Cholesterol and Unsaturated Fatty Acids All cells need to control the amount and composition of membrane lipids. We learned in Chapter 10 that cells must maintain an appropriate fluidity of their membranes and that this is determined by both the amount of cholesterol or other steroids in each cellular membrane and the percentage of unsaturated fatty acids in membrane phospholipids. Indeed, a cell would soon face a crisis if it did not have enough phospholipids to make adequate amounts of membranes or had so much cholesterol that large crystals formed and damaged cellular structures (see Chapter 10). Here we describe how cells maintain cholesterol and fatty acid homeostasis by regulating both the synthesis of enzymes that catalyze key steps in their biosynthesis and the import of exogenous cholesterol from the extracellular fluid. Critical features of this regulation are the sensing of these metabolites by proteins in the endoplasmic reticulum. Fatty Acid and Cholesterol Biosynthesis as Well as Cholesterol Import Are Regulated at the Level of Gene Transcription
The transcription of genes encoding many enzymes in the cholesterol biosynthetic pathway (see Figure 10-26) is subject to feedback regulation. When cellular cholesterol levels are adequate, cholesterol biosynthesis is suppressed so that excess unesterified cholesterol, which can be toxic, does not accumulate. When cellular cholesterol levels fall too low, threatening the integrity of many cell membranes, biosynthesis is increased. Synthesis of one of the enzymes in the cholesterol biosynthetic pathway, HMG-CoA reductase, is tightly regulated as is the ratecontrolling enzyme in cholesterol biosynthesis. Feedback regulation also controls the import of extracellular cholesterol. As we learned in Chapter 14, lipoproteins are lipid-filled particles that transport hydrophobic molecules through the circulatory system. In humans, the most abundant transporter of cholesterol, in the form of cholesteryl esters, is low-density lipoprotein (LDL; see Figure 14-27). LDL delivers its cholesterol to cells by binding to cell-surface LDL receptors, which mediate the endocytic uptake of LDL particles and their subsequent disassembly in lysosomes, from where the cholesterol enters the cellular pool of cholesterol (see Figure 14-29). The transcription of LDL receptors is transcriptionally regulated to maintain cellular cholesterol homeostasis, and similar systems are used to control unsaturated fatty acid levels. Sterol Regulatory Elements (SREs) The levels of sterols such as cholesterol, as well as unsaturated fatty acids, regulate the levels of expression of a number of genes in a cell. The
promoters of most cholesterol-sensitive and unsaturated fatty acid– sensitive genes, including HMG-CoA and the LDL receptor, contain one or more 10-base-pair sterol regulatory elements (SREs), or SRE half-sites, in their promoters. (These SREs differ from the serum response elements that control many early response genes, discussed in Section 16.2.) The interaction of lipid-regulated transcription factors called SRE-binding proteins (SREBPs) with these response elements modulates the expression of the target genes. Mammals express three isoforms of SREBP: SREBP-1a and SREBP-1c, which are generated from alternatively spliced RNAs produced from the same gene; and SREBP-2, which is encoded by a different gene. Together, these transcription factors control expression of proteins that regulate availability not only of cholesterol, but also of fatty acids and the triglycerides and phospholipids made from fatty acids. In mammalian cells, SREBP-1a and SREBP-1c exert a greater influence on fatty acid metabolism than on cholesterol metabolism, whereas the reverse is the case for SREBP-2. How do cells sense how much cholesterol and unsaturated fatty acids they have, and how are these signals used to control the level of SREBPs in the nucleus and thus gene expression? The SREBP-mediated pathway begins in the membranes of the endoplasmic reticulum (ER) and includes several other proteins besides SREBP. In Chapter 16, we saw how regulated intramembrane proteolysis plays a key role in the Notch and EGF signaling pathways; here we see that regulated intramembrane proteolysis
The Endoplasmic Reticulum SCAP Protein Senses the Level of Cellular Cholesterol
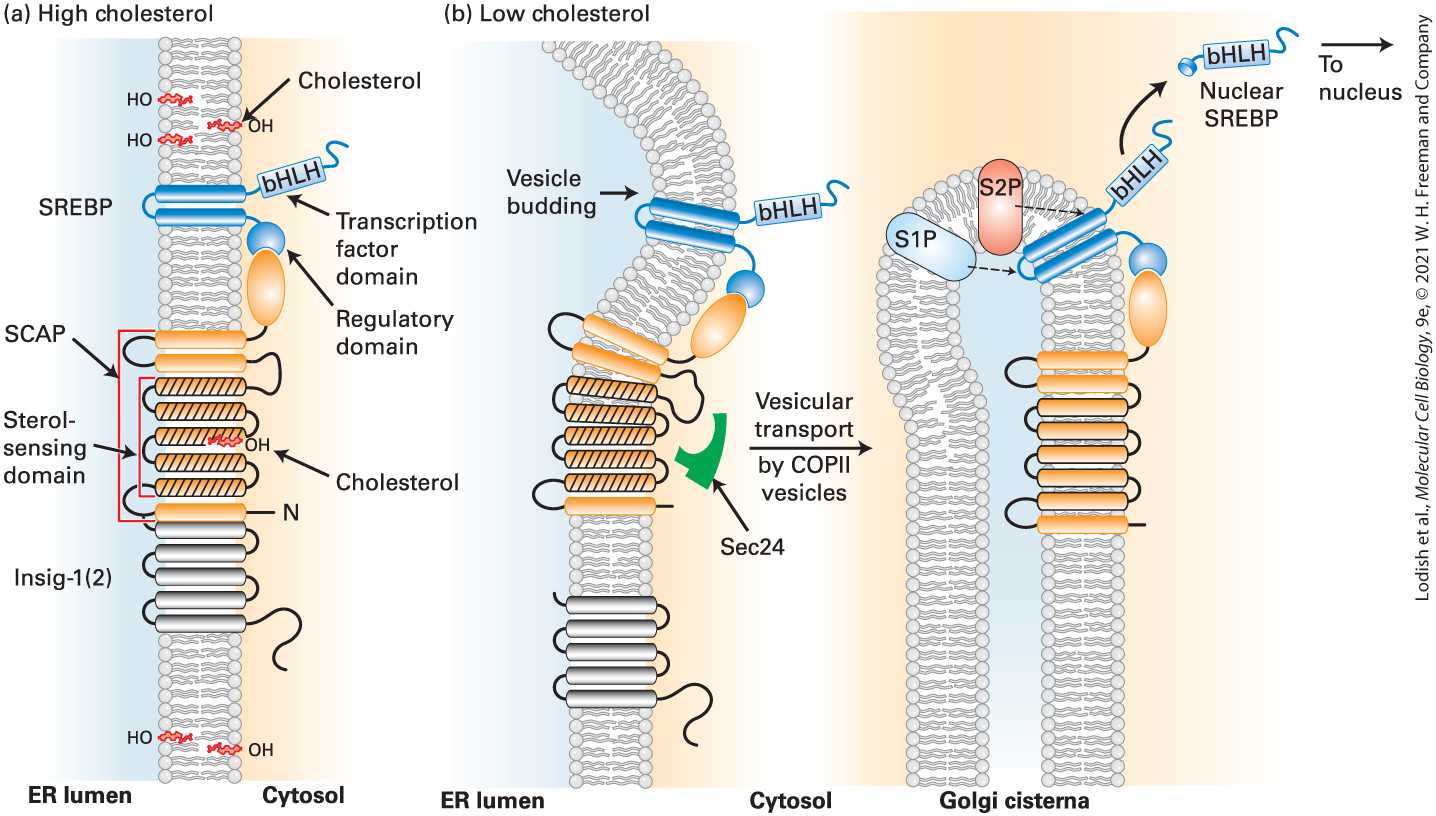
also plays an important role in this cellular response to altered cholesterol and fatty acid levels. The Endoplasmic Reticulum SCAP Protein Senses the Level of Cellular Cholesterol When cells have adequate levels of cholesterol, SREBP is found in the ER membrane complexed with SCAP (SREBP cleavage-activating protein), insig-1 (or its close homolog insig-2), and perhaps other proteins (Figure 21-6a). SREBP has three distinct domains: an N-terminal cytosolic domain, containing a basic helix-loop-helix (bHLH) DNA-binding motif (see Figure 8-25d), that functions as a transcription factor when cleaved from the rest of SREBP; a central membrane-anchoring domain containing two transmembrane α helices; and a C-terminal cytosolic-facing regulatory domain.
FIGURE 21-6 Cholesterol-sensitive control of SREBP activation. The cellular pool of cholesterol is monitored by the cholesterol-sensor SCAP, located in the ER membrane and stably bound via its C-terminus to the C-terminus of the membrane protein SREBP. Membrane-spanning helices 2–6 of SCAP (orange with black lines) form the sterol-sensing domain. (a) When cholesterol levels are high enough that ER cholesterol exceeds 5 percent of total ER membrane lipid molecules, cholesterol binds to the sterol-sensing domain in SCAP, triggering a conformational change that enables the SREBP/SCAP-cholesterol complex to bind to insig-1(2), anchoring the entire SCAP-SREBP complex in the ER membrane. (b) At low-cholesterol levels, cholesterol dissociates from the SCAP sterolsensing domain, triggering a reverse conformational change that both dissociates SCAP from insig-1(2) and enables SCAP to bind to Sec24 (green), a subunit of the COPII complex (see Figure 14-9). As a consequence, the SCAP-SREBP complex enters COPII-coated vesicles that transport it to the Golgi. In the Golgi, the sequential cleavage of SREBP by the site 1 and site 2 proteases (S1P, S2P) releases the N-terminal bHLH transcription factor domain of SREBP into the cytosol, which then translocates to the nucleus. There the released bHLH domain of SREBP, called nuclear SREBP (nSREBP), controls the transcription of genes containing sterol regulatory elements (SREs) in their promoters The SCAP protein recycles from the Golgi back to the ER (not shown). See M. S. Brown, A. Radhakrishnan, and J. L. Goldstein, 2018, Annu. Rev. Biochem. 87:783–807; and R. A. DeBose-Boyd and J. Ye, 2018, Trends Biochem. Sci. 43:358–368.
Regulated Intramembrane Proteolysis of SREBP in the Golgi Releases a bHLH Transcription Factor That Acts to Maintain Appropriate Phospholipid and Cholesterol Levels
Description The illustration labeled (a) shows a vertical membrane between the E R and the cytosol. This membrane has little lightning marks labeled cholesterol breaking into the membrane at various points and in the sterol sensing domain. The S R E B P is represented as two blue oblongs above the sterol domain and an orange oblong is labeled S C A P. The illustration labeled (b) shows the same diagram, without cholesterol and the membrane is now flexible and curves backward to form a loop. The b H L H protein is now able to release and translocate to the nucleus. SCAP has eight transmembrane α helices and a large C-terminal cytosolic domain that binds to the regulatory domain of SREBP. Five of the transmembrane α helices in SCAP form a sterol-sensing domain similar to that in HMG-CoA reductase (see Figure 21-6a; also see Section 10.3). When cholesterol binds to the sterol-sensing domain in SCAP, SCAP assumes a conformation such that it binds to insig-1(2). When the SCAPcholesterol complex is tightly bound to insig-1(2), it is in a conformation that blocks its binding to the Sec24 subunit of the COPII vesicle coat complex (see Figure 14-9). This prevents incorporation of the SCAPSREBP complex into COPII ER-to-Golgi transport vesicles (see Chapter 14). As a consequence the SCAP-SREBP complex is retained in the ER, and thus the transcription factor in SREBP’s N-terminal domain cannot enter the nucleus and regulate gene expression. This occurs when cholesterol levels in the ER membrane exceed 5 percent of total ER membrane lipids. Regulated Intramembrane Proteolysis of SREBP in the Golgi Releases a
bHLH Transcription Factor That Acts to Maintain Appropriate Phospholipid and Cholesterol Levels SCAP releases its bound cholesterol when cholesterol levels in the ER membrane drop to less than 5 percent of ER lipids, a value that reflects normal cellular cholesterol levels. Consequently, Insig-1(2) can no longer bind to the cholesterol-free SCAP, and the SCAP-SREBP complex moves from the ER to the Golgi complex via COPII vesicles (Figure 21-6b). SREBP is then cleaved sequentially at two sites by two proteases that are resident in the Golgi membrane. Site-1 protease (S1P) cleaves SREBP in its luminal loop, separating the protein into two membrane-bound halves. S1P-mediated cleavage renders the N-terminal half of SREBP a substrate for the Site-2 protease (S2P), which releases the N-terminal bHLHcontaining domain of SREBP into the cytosol by cleaving the intermediate near the cytosol-membrane boundary, an example of regulated intramembrane proteolysis. This protein, also called nSREBP (nuclear SREBP), is rapidly translocated into the nucleus, where it activates transcription of genes containing sterol regulatory elements (SREs) in their promoters. SREBP-2 primarily activates transcription of genes required for cholesterol synthesis and uptake such as those encoding the LDL receptor and HMG-CoA reductase. Thus a reduction in cellular cholesterol, by activating the Insig-1(2)/SCAP/SREBP pathway, triggers expression of genes encoding proteins that both import cholesterol into the cell (the LDL
receptor) and synthesize cholesterol from small precursor molecules (HMG-CoA reductase). SREBP-1a and SREBP-1c preferentially activate transcription of genes required for fatty acid and triglyceride synthesis. The level of unsaturated (but not saturated) fatty acids also regulates cleavage of SREBP-1, but by a slightly different mechanism. In cells deprived of unsaturated fatty acids, Insig-1 becomes a substrate for polyubiquitination, extraction from the ER membrane into the cytosol by the process known as ERAD (ERassociated degradation; end of Section 13.3), and subsequent degradation by proteasomes. In the absence of Insig-1, SCAP-1 assumes a conformation enabling it to bind the Sec24 subunit of COPII vesicles, similar to the low-cholesterol situation diagrammed in Figure 21-6b. This initiates transport of SCAP-bound SREBP from the ER to the Golgi, where it undergoes proteolytic cleavage by S1P and S2P that releases its bHLHcontaining SREBP-1 transcription factor domain, enabling it to activate expression of genes required for synthesis of fatty acids and triglycerides. In all cases, after cleavage of SREBP in the Golgi, SCAP apparently recycles back to the ER, where it can interact with insig-1(2) and another intact SREBP molecule. High-level transcription of SRE-controlled genes requires the ongoing generation of new nSREBP because this transcription factor is degraded fairly rapidly by the ubiquitin-mediated proteasomal pathway (see Chapter 3). The rapid generation and degradation of nSREBP also helps cells respond quickly to changes in levels of intracellular cholesterol and fatty acids.
Under some circumstances (e.g., during cell growth), cells need an increased supply of all essential membrane lipids and their fatty acid precursors, processes that require coordinate regulation of many metabolic pathways. In the liver, mTOR, after it becomes activated following stimulation by many growth factor receptors (Section 21.2), directly activates transcription of the SREB-1c gene. This in turn results in increased transcription of all of its downstream target genes that encode proteins catalyzing steps in fatty acid synthesis. KEY CONCEPTS OF SECTION 21.3 Responding to Changes in the Levels of Cholesterol and Unsaturated Fatty Acids Vertebrate cells maintain a constant level of cholesterol in their membranes. The cellular pool of cholesterol is monitored in the ER membrane by the SCAP protein, which is in a stable complex with full-length SREBP. At high-cholesterol levels, cholesterol is bound to the SREBP-SCAP complex, which in turn is bound to the ER protein Insig-1(2), anchoring the entire SREBP-SCAPcholesterol complex in the ER membrane and preventing its transport to the Golgi and subsequent release of its active nSREBP domain, a transcription factor. At low-cholesterol levels, cholesterol dissociates from the SREBP-SCAP complex, triggering conformational changes that lead to the dissociation of SCAP from Insig1(2), the binding of SREBP and SCAP to the COPII coat, and transport of the SREBPSCAP complex to the Golgi. In the Golgi, cleavage of SREBP by two proteases releases the N-terminal transcription factor, bHLH domain of SREBP (nSREBP), which translocates to the nucleus and activates expression of genes containing sterol regulatory elements (SREs) in their promoters. Among these genes are those that encode proteins that import cholesterol into the cell and enzymes that catalyze key steps in the biosynthesis of cholesterol. SREBP-2 primarily regulates cholesterol import and synthesis while SREBP-1a and SREBP-1c primarily regulates unesterified fatty acid synthesis.
Induction of the Erythropoietin Gene at Low Oxygen Levels
21.4 Responding to Low Oxygen Oxygen is essential for metazoan life, and in Chapter 12 we learned how mitochondria produce ATP from ADP and by oxidizing metabolites derived from glucose, fatty acids, and amino acids. Many organs, such as the brain and heart, cannot use anaerobic glycolysis to produce sufficient ATP and thus are completely dependent on production of ATP through oxidative phosphorylation. In this section, we describe how cells sense drops in the level of oxygen in their environment and respond to this stress, as happens when we ascend to a high altitude or during disease states such as cardiopulmonary failure, where the heart or lungs cannot generate sufficient levels of oxygen-bound hemoglobin in the bloodstream. We will learn how, in metazoans, one transcription factor, Hif-1α coordinates the many cellular responses to low oxygen, how Hif-1α is produced but rapidly degraded by cells under ambient oxygen levels, and how as oxygen levels decrease Hif-1α becomes progressively more stable. Hif-1α activates transcription of hypoxia-induced genes by binding to hypoxia-responsive elements (HRE) in the promoter or enhancer of oxygen-responsive genes. Hif-1α is found only in metazoan animals, but recent work has uncovered a different family of oxygen-sensing transcription factors that are conserved in both animals and plants. Like Hif-1α these proteins are degraded at ambient oxygen, but by a different mechanism.
Induction of the Erythropoietin Gene at Low Oxygen Levels Red blood cells transport oxygen from the lungs to all body cells, and maintaining a precise level of red blood cells of about 40–50 percent of blood volume is important for normal body functions. We learned in
Chapter 16 (Figure 16-18a) that the cytokine erythropoietin (Epo) is the principal hormone that stimulates red blood cell formation, and that Epo is synthesized by certain cells in the liver and kidney as oxygen levels drop. At one time these cells were thought to be one of the few in the body that respond to low oxygen. In the early 1990s, the key discovery was made that when liver cells were subjected to low oxygen, a then-novel protein bound to the HRE, with a core sequence , in the enhancer segment of the erythropoietin gene. Characterization of the protein, now called hypoxiainducible factor 1 alpha or simply Hif-1α showed that it was present only in cells cultured in a low-oxygen environment and that Hif-1α bound to HREs as a homodimer with a second protein, called Hif-1β, whose level was not regulated by oxygen (Figure 21-7a).
FIGURE 21-7 Degradation of the Hif-1α transcription factor at ambient oxygen levels. (a) Low (0.5 percent) oxygen. Hif-1α is stable and functional. It forms a heterodimer with Hif-1β, binds to HRE elements in the promoters or enhancers of many hypoxia-responsive genes, and induces their transcription. (b) Medium (1–2 percent) oxygen. The asparaginyl hydroxylase FIH is able to bind sufficient oxygen to become catalytically active and transfer an OH group to an asparagine residue on the Hif-1α protein. Hydroxylation blocks the ability of Hif-1α to bind the transcriptional co-activators CBP and p300 and thus activate gene transcription. (c) High (above 4 percent) oxygen. (step 1 ) The prolyl hydroxylase PHD2 is able to bind sufficient oxygen to become activated and transfer an OH group to two proline residues in Hif-1α protein. (step 2 ) Each of these hydroxyproline residues form a part of a binding site for the VHL subunit of an E3 ubiquitin ligase. (step 3 ) The E3 ligase then adds a polyubiquitin chain that triggers immediate degradation of the Hif-1α protein by the proteasome. See text for details.
Oxygen Sensing and Regulated Hif-1α Expression Is a Property of All Nucleated Mammalian Cells
Description The illustration labeled (a) shows an oval made with dashed lines, the oval is labeled nucleus. Inside the nucleus, a pink rectangle labeled H i f 1 beta attaches to a blue rectangle labeled H i f 1 alpha with P P N at the point in the D N A labeled H R E. To the right of that is a yellow rectangle labeled hypoxia sensitive gene where the transcription begins. The illustration labeled (b) shows a close up of the H i f 1 alpha with O H group attached to N. Corresponding text reads, cannot bind transcriptional co-activators C B P and P 300 and cannot activate transcription. The illustration labeled (c) shows O 2, alpha-ketoglutarate moving into a green oval labeled prolyl hydroxylase, which in turn adds O H groups to the H i f 1 alpha protein. A downward arrow shows the attachment of V H L and E 3 ubiquitin ligase to the H i f 1 alpha, which now produces gray circles labeled U b. A last downward arrow leads to proteasomal degradation, which releases blue string segments, labeled peptides. Oxygen Sensing and Regulated Hif-1α Expression Is a Property of All Nucleated Mammalian Cells Soon after this discovery, it was shown that the Hif-1α gene is transcribed into mRNA in all body cells regardless of oxygen levels, but that the Hif1α protein is present only when oxygen levels are very low. As an example, in cultured HeLa cells, the levels of Hif-1α protein and Hif-1α DNA-binding activity increased exponentially as the cellular oxygen concentration decreased, with maximum values at 0.5 percent oxygen and half-maximal values at 1.5 to 2 percent oxygen, compared to ~20 percent oxygen at ambient levels. Indeed, it was soon demonstrated that Hif-1α expression triggered synthesis of vascular endothelial growth factor
Hif-1α Function and Stability Are Blocked at Ambient Oxygen Levels
(VEGF), a secreted hormone that stimulates formation of capillaries, tiny blood vessels that connect arteries and veins and increase oxygen delivery to the surrounding tissues. HRE sequences were also found in the enhancers of many genes encoding glycolytic enzymes, and Hif-1α stabilization triggered expression of these genes. In particular, genes encoding several proteins that catalyze regulated and rate-limiting steps in the glycolytic pathway [phosphofructokinase, pyruvate kinase, and lactate dehydrogenase (see Section 12.1)] are strongly induced by Hif-1α at low oxygen levels and promote ATP synthesis in an oxygen-independent manner. Hif-1α Function and Stability Are Blocked at Ambient Oxygen Levels Hif-1α protein is synthesized at almost the same rate at low and ambient oxygen levels, but it is rapidly degraded in ambient oxygen. The key to understanding how this happens came with the discovery of a set of proline and asparagine hydroxylation enzymes, iron-containing enzymes that utilize as substrates molecular oxygen and the citric acid cycle intermediate alpha ketoglutarate (see Figure 12-13) and that add a hydroxyl group to the 4-carbon atom of a proline residue or to the 3carbon atom of an asparagine residue in a protein (as shown below).
Clearly the proline hydroxylase (PHD) enzyme as shown above and the similar asparagine hydroxylase can function only when there is sufficient oxygen in the cell! There are two checkpoints, both based on oxygen-dependent hydroxylase enzymes, which prevent Hif-1α activity at ambient oxygen. As oxygen levels rise above 0.5 percent, the asparaginyl hydroxylase FIH is the first to become activated (Figure 21-7b). FIH transfers an OH group to a specific asparagine residue in the C-terminal transactivation domain of the Hif-1α protein; hydroxylation blocks the ability of the Hif-1α protein, bound to an HRE, to bind the transcriptional co-activators CBP and p300 (Chapter 8) and thus blocks the ability of Hif-1α to activate transcription. At slightly higher oxygen concentrations, the PHD2 enzyme becomes activated and adds a hydroxyl group to two proline residues in the Hif-1α protein (Figure 21-7c). Each of these hydroxyl proline residues on Hif-1α forms a part of a separate binding site for the VHL subunit of a specific E3 ubiquitin ligase. The ligase then adds a polyubiquitin chain to the Hif-1α protein, triggering immediate degradation of Hif-1α by the proteasome. Thus the Hif-1α protein is present in cells only when the oxygen level is very low, and any residual Hif-1α protein remaining at moderate oxygen levels becomes inactive because of asparagine hydroxylation. Interestingly, Hif-1α is the only known target of the PHD enzyme PHD2, and inactivation of PHD2 in mice causes polycythemia, a production of excess numbers of red blood cells. However, the two other human proline hydroxylase enzymes, PHD1 and PHD3, use molecular oxygen as a
substrate to add hydroxyl groups to many other proteins with known functions, and current research is uncovering the regulation of these targets by proline hydroxylation. Flies and worms have a single prolyl hydroxylase, attesting to the evolutionary conservation of this oxygendependent signaling pathway in defense against hypoxic stress. The E3 ubiquitin ligase that adds the ubiquitin chain to Hif-1α was discovered not in a study of oxygen sensing but of kidney tumors. Early work showed that certain kidney tumors had inactivating mutations in a tumor suppressor gene, the von Hippel-Lindau (VHL) protein and that these tumors had an abnormally increased number of capillaries surrounding them because they were producing enhanced amounts of VEGF. Trying to identify the function of the VHL protein, investigators soon found that it was in a complex with other proteins that were known to be part of an E3 ubiquitin ligase enzyme. This complex turned out to be the ubiquitin ligase that adds the ubiquitin chains to Hif-1α in which one or both proline residues was modified to hydroxyproline. Indeed, VHL was shown to directly bind to the two segments of the Hif-1α protein that contain a hydroxyproline, and tumor cells with VHL deficiency exhibited up-regulation of all known Hif-1α target proteins, including many enzymes in the glycolytic pathway. An enhancement of glycolysis was known to be important for the growth of many cancer cells; as we learn in
Chapter 25, many cancer cells carry out glycolysis even in the presence of high oxygen levels. While producing less ATP per mole of glucose metabolized than does mitochondrial oxidative phosphorylation, aerobic glycolysis produces many intermediates that are siphoned off the
A Conserved Family of Oxygen-Sensitive Transcription Factors Found in Plants and Animals Is Regulated by Post-Translational Addition of an Arginine Residue
glycolytic pathway as building blocks for amino acids and other molecules that are necessary for the rapid growth of cancer cells. A Conserved Family of OxygenSensitive Transcription Factors Found in Plants and Animals Is Regulated by Post-Translational Addition of an Arginine Residue Like animal cells, plant cells can also become anoxic; often during flooding or waterlogging, cells inside seeds or meristems (see Chapter 22) can also suffer from reduced diffusion. Recent work has shown that plants such as rice, Arabidopsis, and barley respond to hypoxia by increasing the level of a group of oxygen-sensing transcription factors termed group VII ethylene response factors (ERFs). Similar oxygensensing factors have been detected in human and other animal cells, indicating that this signaling pathway evolved very early in eukaryotic evolution. Like Hif-1α, ERF proteins promote the synthesis of proteins that enhance survival under low oxygen, including key enzymes in the glycolytic pathway that facilitate anaerobic metabolism, such as alcohol dehydrogenase and pyruvate decarboxylase (see Chapter 12). ERF proteins all contain an N-terminal cysteine residue that undergoes an unusual series of enzyme-catalyzed reactions at ambient oxygen levels that targets them for degradation by the proteasome (Figure 21-8). The
first step, the oxygen-sensing step, is catalyzed by an enzyme termed cysteine dioxygenase that binds and transfers its two oxygen atoms to the N-terminal cysteine residue, forming cysteine sulfinic acid. Note that this is a different reaction than catalyzed by the PHD2 enzyme, but like PHD2 this reaction only occurs at high oxygen levels. The N-terminal cysteine sulfinic acid, in turn, serves as a binding site for an enzyme termed arginyl-tRNA-protein transferase (ATE). This enzyme catalyzes the transfer of the arginine residue from an arginyl tRNA to the amino group of the cysteine sulfinic acid. (Note that this is an unusual reaction in which an aminoacyl tRNA does not participate in ribosome-catalyzed protein synthesis.) Proteins with N-terminal arginine residues are unstable and are immediately subjected to ubiquitination and degradation in the proteasome. In fact, well before this oxygen-sensing pathway was discovered, researchers had defined the so-called N-end rule, in which the in vivo half-life of a protein is determined by the identity of its N-terminal residue. Primary destabilizing N-terminal residues were shown to be recognized directly by the ubiquitin targeting machinery, and proteins with an N-terminal arginine were known to be very unstable.
FIGURE 21-8 Degradation of ERF transcription factors at ambient oxygen levels. This pathway occurs in a similar fashion in both plants and animals. Step 1 : At ambient oxygen, but not at reduced oxygen levels, cysteine dioxygenase adds the two oxygen atoms from to the cysteine residue that is found on the N-terminus of all ERF proteins, forming an N-terminal cysteine sulfinic acid residue. Step 2 : The N-terminal cysteine sulfinic acid serves as a binding site for an arginyl-tRNA-protein transferase (ATE), which then transfers the arginine residue from an arginyl tRNA to the amino group of the cysteine
sulfinic acid. Step 3 : An E3 ubiquitin ligase enzyme that uses as substrates proteins with N-terminal arginine residues adds a ubiquitin chain to the ERF protein that (step 4 ) triggers immediate degradation of it by the proteasome. [Data from D. J. Gibbs and M. J. Holdsworth, 2020, Cell 180(1):22–24.] Description The illustration shows the chemical structure of cysteine with E R F. The chemical structure from left to right shows H S single bonded to C H subscript 2 which is single bonded to C H. C H is single-bonded N H subscript 2 and C, which is further double bonded to oxygen. C is single bonded to E R F. By the action of cysteine dioxygenase, oxygen is added to cysteine to produces cysteine sulfinic acid. In cysteine sulfinic acid H S is replaced with S and single bonded to O minus and double-bonded to oxygen. In the second downward arrow arginine t R N A is converted into t R N A. In this reaction, C H is single bonded to N H, which is further single bonded to C minus. C minus is double bonded to oxygen and single bonded to arginine. The third arrow labeled ubiquitination shows gray U b circles being added to the E R F. A sideward arrow then shows the proteasomal degradation and the release of peptides. Thus at least two classes of oxygen-sensing transcription factors have evolved, ERFs and HIF-1α’s. Both induce synthesis of proteins that help the cell or organism survive at low oxygen levels, and both are degraded at ambient oxygen levels by processes initiated by enzyme-catalyzed attachment of O atoms from . KEY CONCEPTS OF SECTION 21.4 Responding to Low Oxygen In metazoans, at low oxygen levels the transcription factor Hif-1α accumulates and induces the transcription of many genes that enable the cell or organism to survive this stress. Proteins that catalyze regulated and rate-limiting steps in the glycolytic pathway are induced in many body cells, and erythropoietin in certain kidney cells.
At high oxygen levels the prolyl hydroxylase PHD2 transfers an OH group to two proline residues in Hif-1α leading to binding of the tumor-suppressor protein VHL, polyubiquitinylation by an E3 complex, and destruction by the proteasome (see
Figure 21-7). Many plants and animals express a different family of oxygen-sensitive transcription factors that involves cysteine oxidation and post-translational addition of an arginine residue, leading to polyubiquitinylation and degradation (see Figure 21-8).
21.5 Responding to Elevated Temperatures
21.5 Responding to Elevated Temperatures The heat-shock response is part of a general cellular response to the accumulation of unfolded proteins caused by one or more cellular stresses, including elevated temperature (giving rise to the name of the response). Other stresses that cause protein denaturation also induce the heat-shock response, such as oxidative stress (which causes oxidation of sulfur atoms in cysteine and methionine), hypoxia, heavy metals, ethanol, and other toxic substances. A similar mechanism induces high-level expression of roughly 50–200 genes in different organisms from archaea to cultured human cells, indicating that this response evolved early in eukaryotic evolution. The heat-shock proteins (or HSPs) encoded by these genes perform several processes that protect cells from the consequences of unfolding a large fraction of cellular proteins. In this section, we will discuss two main actors in the heat-shock response. The accumulation of unfolded proteins is sensed by HSP70 proteins expressed at moderate levels in unstressed cells. If these molecular chaperones are unable to restore correct protein folding, a pathway is activated to induce further expression of HSP70 genes and other heatshock genes that function to prevent aggregation of unfolded proteins. This gene expression program is mediated by the transcription factor HSF (heat-shock factor). This protein is normally kept in check and is released
when high concentrations of unfolded proteins are present in the cell. Below, we will see how HSPs interact with unfolded proteins to restore the correct conformations, how the HSF transcription factor is activated, and how the heat-shock response is induced. Before describing the details of the heat-shock response, we should note one of its most remarkable and surprising aspects: it is triggered by a temperature increase of just a few degrees. For human cells cultured at 37 °C (310 K), a shift in temperature to 42 °C (315 K) activates transcription of heat-shock protein genes to maximum levels, >100 times the rate in unstressed cells. Since the kinetic energy of molecules in solution is proportional to their temperature in K, this represents only a 1 percent increase in the kinetic energy of protein molecules. How does such a small increase in kinetic energy lead to maximum activation of heat-shock gene transcription? The answer to this puzzle is thought to result from the fact that proteins have evolved to be conformationally flexible at the normal growth temperature of the organisms in which they occur. This flexibility is necessary for the functions of many proteins, both structural and enzymatic. Consequently, most proteins have been optimized by evolution of their primary sequence to be only marginally stable at the normal growth temperature. A small increase in temperature can cause protein unfolding. Without the defenses against protein unfolding from induced heat-shock proteins, these regions of unfolded polypeptide can become entangled, leading to nonspecific protein aggregation and cell death. The heat-shock response that protects against this is triggered by the large increase in the amount of unfolded polypeptide that results from an increase in temperature of only a few degrees.
The Heat-Shock Response Is Induced by Unfolded Polypeptide Chains
The Heat-Shock Response Is Induced by Unfolded Polypeptide Chains The most conserved heat-shock proteins are molecular chaperones that prevent the formation of nonspecific protein aggregates and assist unfolded proteins in refolding into their native structures. Humans express 11 small HSPs (<45 kDa) exemplified by HSP27. These bind to unfolded, hydrophobic polypeptides, inhibiting them from forming large multimolecular aggregates. The human genes most highly induced in response to elevated temperature encode a group of closely related proteins called HSP70s. These are among the most highly conserved protein chaperones throughout all kingdoms of life. The bacterial version, called DnaK, shares about 60 percent sequence identity with eukaryotic HSP70 proteins. HSP70s are found principally in the cytosol and in organelles, such as the ER, mitochondria, and chloroplasts. Under normal physiological conditions, HSP70s assist in the de novo folding of nascent and newly synthesized proteins (see Figure 3-19a). In humans, HSPA8 (also known as HSC70, “C” for constitutive) serves this function and is expressed constitutively in all cells; it is not induced by heat shock. The two major HSP70s induced by heat shock, encoded by HSPA1A (also known as HSP70-1) and HSPA1B (HSP70-2), are nearly identical in sequence and are ~90 percent identical to HSC70. The two HSP70s are thought to function similarly; in the discussion below they will be referred to together as simply HSP70.
HSP70s (including HSC70) contain two domains, an ATPase domain and a protein-binding domain (see Figure 3-19a). When ATP is bound to the nucleotide-binding pocket in the ATPase domain, the protein-binding domain is held in an open conformation that binds a sequence of seven mainly hydrophobic amino acid residues in an extended conformation. Stretches of hydrophobic amino acids this long generally occur only in the hydrophobic core of properly folded proteins and in transmembrane α helices. Consequently, HSP70s bind unfolded polypeptides or unfolded regions in a polypeptide where such hydrophobic stretches are exposed. This initial binding is low affinity and reversible. In the following discussion about the control of heat-shock gene transcription, we will be concerned primarily with this ATP-bound form of HSP70s. As discussed in Chapter 3, with the assistance of an HSP40 cochaperone, an HSP70 weakly bound to an unfolded region of the client protein hydrolyzes the ATP to ADP, resulting in a conformational change of the HSP70 protein-binding domain, so that it unfolds the bound region of the client protein into a conformation that is amenable to proper spontaneous refolding when it is released. ATP hydrolysis also results in very high affinity binding of the client protein. Then, with the assistance of a nucleotide exchange factor, both the ADP and the client protein are released as ATP becomes bound by the HSP70 ATPase domain. This moves the protein-binding domain into its open conformation. The released, unfolded client polypeptide then has another opportunity to fold into the correct native conformation. Repeated cycles of binding, ATPdependent unfolding, and spontaneous refolding of the released
The Heat-Shock Response Is Regulated Primarily by Related Transcription Factors in All Eukaryotes Called Heat-Shock Factors, Including HSF1 in Humans
polypeptide may occur and even lead to the proper refolding of polypeptides in large aggregates. The Heat-Shock Response Is Regulated Primarily by Related Transcription Factors in All Eukaryotes Called Heat-Shock Factors, Including HSF1 in Humans When the amount of unfolded protein in the cell increases in response to heat shock, HSC70 and any HSP70 induced by heat shock associate with the unfolded regions of polypeptide generated and with any protein aggregates that have formed (Figure 21-9b). Nascent polypeptides still associated with ribosomes are generally the first proteins to unfold because the incomplete polypeptides have fewer stabilizing interactions than the complete protein (see Figure 21-9b). As a result, most of the HSC70 and HSP70s in the cell become associated with unfolded nascent polypeptides. It is this depletion of free HSC70s and HSP70s that triggers the heat-shock response.
FIGURE 21-9 Regulation of the heat-shock response. HSF1 is inactivated by binding to free HSP70 that has a bound ATP. (a) Regulation of HSF1 by HSP70. Under normal physiological conditions of temperature and the absence of protein denaturants (right), most HSF1 is in a latent form complexed with HSC70–ATP in the cytoplasm. If the amount of unfolded protein in the cell increases substantially, most of the cellular HSC70 becomes associated with the denatured proteins. This releases HSF1 to form trimers that are imported into nuclei and activate transcription of genes with promoter proximal HSEs (left). (b) During heat shock, nascent polypeptides associated with ribosomes are generally the first to denature because they have fewer interactions stabilizing the correct fold than in full-length proteins. Regions of exposed stretches of hydrophobic amino acids and denatured protein aggregates are bound by the open protein-binding domain of HSP70-ATP, titrating HSP70ATP away from HSF1 by mass action. The released HSF1 forms trimers that are bound by importins and transported into nuclei where they bind to HSEs and activate transcription of HSP genes, as diagrammed in (a). See A. E. Masser et al., 2019, eLife 8:e47791. Description
The illustration labeled (a) shows a length of helix material moving through a three-part structure labeled activated H S F 1. A double-headed arrow to the right shows that H S P 70 and A T P are given off in the reaction and forms latent H S F 1 plus the H S E strand. The illustration labeled (b) shows a white structure with a line of transcription R N A moving through it as a red line below a row of blue dots representing the material produced. An arrow pointing to the right is labeled heat shock above and misfolding below leads to a tangled blue chain of dots. The addition of H S P 70 and A T P to the tangled chain of dots leads to aggregation of six A T P ovals in random places among the tangle of blue dot chains. An arrow from H S P 70, A T P, and tangled chain of dots before the aggregation lead to A T P hydrolysis and protein refolding with the aid of co-chaperones H S P 40 and H S P 110. As mentioned above, the heat-shock response involves the sharp increase in the levels of chaperone and other proteins. This is achieved via the release of the HSF1 transcription factor. In its activated form, HSF1 forms a trimer, and an α helix of each monomer interacts with the major groove of three successive alternating inverted repeats with the sequence nGAAn, where n denotes any nucleotide (e.g., nTTCnnGAAnnTTCn; Figure 21-9a). HSF-binding sites are known as heat-shock elements (HSEs). Virtually all genes activated by the heat-shock response have one or more HSEs in their promoter proximal region. An activation domain at the C-terminus of HSF1 activates transcription through interactions with the mediator complex and other co-activators, as described in Chapter 8. Studies of the Drosophila Hsp70 gene led to the discovery of a pause in transcription approximately 50 bases downstream from the transcription start site of many genes in metazoans (see Figure 8-16). In Drosophila cells cultured at normal temperature, RNA polymerase II remains paused at this site. Following heat shock, HSF is activated and binds to promoter proximal HSEs of the heat-shock genes and stimulates polymerase release through
activation of cyclin T-Cdk9 (see Figure 8-16). This results in a very rapid transcriptional response to protein denaturation since RNA polymerase is already engaged in transcription. As the concentration of unfolded proteins increases following heat shock, the concentration of free HSC70 and HSP70 available to interact with HSF1 drops precipitously. Since the interaction between HSP70s and HSF1 is reversible, HSF1 is released from HSC70 and HSP70s and is free to trimerize and interact with importins. Then it is transported into nuclei and binds HSEs, stimulating transcription of all genes with promoter proximal HSEs. Recent studies using purified recombinant yeast HSP70 and derivatives of HSF1 strongly support the following model for heat-shock regulation of HSF1: before activation by heat shock, most HSF1 is located in the cytosol in a latent form associated with HSC70s, which are in excess over HSF1 (Figure 21-9a, right). HSC70 in its ATP-bound conformation binds reversibly to several regions in HSF through HSC70’s open proteinbinding domain that associates with extended, largely hydrophobic regions of polypeptide (Figure 3-19, step 1 ). This reversible association of HSC70 with HSF1 inhibits HSF1 interactions with importins required for HSF1 nuclear import. In vertebrates, HSC70 also dissociates a large fraction of the HSF1 trimers into inactive HSF1 monomers bound by HSC70. Importantly, there are HSEs in the promoter proximal region of the HSF1 gene itself, so HSF1 is also a heat-shock activated gene. HSF1 mRNA and
protein accumulate during extended heat shock, leading to increasing expression of heat-shock genes to the point that they become major cellular proteins. The process is reversed when human cells incubated at 42 °C for several hours, to maximally induce the heat-shock response, are returned to 37 °C. Transcription of heat-shock genes returns to the level in unshocked cells within a few hours. This occurs because renaturation of unfolded polypeptides catalyzed by HSP70s and other protein chaperones induced by heat shock releases free HSP70s that then associate with activated HSF1, inhibiting its DNA-binding and transcriptional activation and thus repressing transcription of all heat-shock genes. In the immediate period following extended heat shock, HSF1, HSP70s and other protein chaperones induced by heat shock remain at high concentration. This makes the previously heat-shocked cells resistant to higher temperatures and resistant to higher concentrations of denaturing agents, such as ethanol, than naive cells cultured in normal medium continuously at 37 °C. In this way, the heat-shock response helps cells to both survive acute protein denaturation and also adapts cells to an environment in which they are exposed to denaturing conditions repeatedly. This also explains why cells initially treated with a denaturing agent, such as ethanol, are more resistant to alternative denaturing agents, such as elevated temperature, than cells that were continuously cultured at 37 °C and that did not induce expression of HSPs. KEY CONCEPTS OF SECTION 21.5 Responding to Elevated Temperatures
The heat-shock response is induced by unfolded polypeptide chains generated by various conditions, including elevated temperature. Most proteins are evolutionarily optimized to be only marginally stable at the normal growth temperature so that they have the flexibility to perform their functions. Consequently, an increase in temperature of only a few K is sufficient to unfold a large fraction of polypeptide chains. Nascent polypeptides associated with ribosomes are especially sensitive to denaturation because they generally have fewer interactions holding them in the proper conformation than the full-length protein (see Figure 219b). Closely related heat-shock transcription factors (HSF1 in humans) are expressed in all eukaryotes and activate transcription of heat-shock genes when a substantial fraction of unfolded polypeptides accumulate. The heat-shock proteins encoded by these genes bind to and prevent aggregation of unfolded regions of polypeptides and assist in refolding proteins into their proper conformations. HSF1 binds to heat-shock response elements in the DNA sequences of promoter proximal regions and activates high levels of transcription. At normal temperature, RNA polymerase II remains paused at approximately +50 in the many heat-shock genes, until HSF is activated, binds to promoter proximal HSEs, and stimulates polymerase release through activation of cyclin T-Cdk9 (see Figure 816). This results in a very rapid transcriptional response to protein denaturation, since RNA polymerase is already engaged in transcription and does not have to go through the steps of chromatin decondensation and preinitiation complex assembly before transcription begins. At elevated temperature, HSP70s are sequestered away from HSF1 because most HSP70s bind to unfolded regions of polypeptides (see Figure 21-9b). This allows HSF1 to trimerize and become transported into nuclei, where it binds to HSEs in promoter proximal regions of heat-shock genes. HSF1 then stimulates release of the paused RNA polymerase II and high rates of transcription re-initiation of heat-shock genes.
21.6 Sensing Night and Day: Circadian Rhythms
21.6 Sensing Night and Day: Circadian Rhythms The Earth rotates around an axis passing through the North and South Poles on a 24-hour cycle, with night facing away from and day facing toward the sun. To adapt to this, all organisms have evolved endogenous circadian rhythms that are modulated by dark and light. The word circadian derives from circa diem, Latin for “about a day,” reflecting the fact that circadian rhythms repeat approximately every 24 hours. The study of the biology of circadian rhythms is called chronobiology, from the Greek chronos, which means “time.” Perhaps the most familiar behavioral circadian rhythm for human and nonhuman animals is the sleep-wake cycle, which for humans and other diurnal animals follows night (sleep) and day (wake). Circadian rhythms are driven by internal molecular clocks within cells that oscillate over a 24-hour period. In addition, there is a process by which these endogenous clocks can be reset by the external cues, called zeitgeber, German for “time giver.” In fact, the definition of a circadian rhythm requires that it include an endogenous, self-running clock that can be entrained by external cues. The sleep-wake cycle in humans meets both of these criteria. In 1938, two researchers did an experiment in which they spent 32 days in a cave in Kentucky and monitored their sleep-wake cycle. They found that even in the absence of any light, they continued to exhibit
circadian sleep-wake rhythms, although over time the rhythms shifted relative to the actual onset of dark and light in the outside world. Once they left the cave, their sleep-wake cycle resynchronized to the external dark-light cues. As this early experiment demonstrated, human circadian rhythms are not only intrinsic and self-running, but they are also entrainable by external cues. Jet lag provides another commonly experienced example of our internal yet modifiable biological clock: after traveling to a different time zone, individuals usually continue to follow their usual, intrinsic sleep-wake pattern, but within a few days adapt to the dark-light cycle of their new environment. All eukaryotes and some prokaryotes exhibit circadian rhythms. In addition to sleep-wake cycles in humans and other organisms, examples of biological processes that exhibit circadian rhythms include the release of hormones such as insulin and glucagon (described in Section 21.1), feeding behavior in rodents, leaf movement in plants, locomotor activity in flies, and even nitrogen fixation in cyanobacteria. In each case, the behavior involves an intrinsic molecular clock within cells that can be entrained by the external environment. While the most powerful external cue, or zeitgeber, is the dark-light cycle, other cues that impact circadian rhythms include medication, temperature, social interactions, exercise, eating and drinking, and weather. Remarkable progress has been made in understanding the genes and molecules that constitute the molecular clock and the pathways and cues that entrain that clock, together giving rise to circadian rhythms. In this section, we will first consider the mechanisms that give rise to the molecular clock and then turn our attention to the
The Circadian Clock in Most Organisms Relies on a Negative Feedback Loop
question of how external cues modulate the molecular clock to entrain circadian rhythms. The Circadian Clock in Most Organisms Relies on a Negative Feedback Loop The molecular dissection of circadian clocks provides one of biology’s most powerful demonstrations of the genetic basis of behavior, advances that were recognized by the 2017 Nobel Prize in Physiology or Medicine. The initial discoveries on circadian rhythms were conducted in the fruit fly Drosophila melanogaster, which, like all organisms, exhibits circadian rhythms in many behaviors. In a series of genetic screens done in the early 1970s, scientists searched for mutant flies that had alterations in their circadian rhythms. This led to the identification of a gene they called period or per, because mutations altered the periodicity of the circadian rhythm without impacting any other aspect of Drosophila physiology. The discovery of the per gene opened a field of study that in turn elucidated an entire oscillatory molecular feedback loop that takes ~24 hours to complete. This feedback loop involves transcriptional and posttranslational regulatory steps that together form a biological clock that is present in almost all eukaryotic cells and in some prokaryotic cells. As shown in Figure 21-10, the central components of the clock in Drosophila cells constitute a negative feedback loop in which clock genes are regulated by their own protein products. The components of this loop
include: two transcriptional repressors, PER and TIMELESS (TIM), encoded by the per and timeless (tim) genes; two transcriptional activators, CLOCK (CLK) and CYCLE (CYC), encoded by the clock (clk) and cycle (cyc) genes; and several kinases and E3 ubiquitin ligases. CRY, a cryptochrome (a protein with an attached flavin group that undergoes a conformation change when it absorbs blue light), encoded by the cry gene, plays a key role. TIM and PER levels cycle every 24 hours; they accumulate during the day and are degraded during the night.
FIGURE 21-10 Molecular circadian clock in eukaryotes. The circadian clock in Drosophila melanogaster cells consists of two transcriptional repressors, PER and TIM, two transcriptional activators, CLK and CYC, several kinases (including the DBT kinase) and E3 ligases, and the light-sensitive protein CRY. During the day CLK and CYC dimerize to stimulate the transcription of PER and TIM, but TIM and PER proteins both undergo regulated degradation. In the case of PER, it is phosphorylated by the DBT kinase during the day, leading to ubiquitylation by E3 ligases and degradation. Concentrations of PER and TIM peak at dusk, when TIM binds to PER and protects it from DBT phosphorylation and subsequent degradation. During the night, the TIM-PER dimer is transported into the nucleus where it binds to CLK and CYC, blocking their ability to stimulate transcription of the per and tim mRNAs throughout the night. At dawn, the light triggers a conformational
change in the CRY-photosensitive protein, which then binds to TIM, releasing it from PER, and from CLK and CYC. CRY binding to TIM triggers its ubiquitylation and degradation, and in the absence of TIM binding, PER also undergoes DBT-mediated phosphorylation, ubiquitylation, and degradation. This now allows CLK and CYC to bind to the per and tim promoters to induce their transcription. This entire cycle takes approximately 24 hours to complete. Description The illustration shows the cycle that has the times of Dawn, Noon, Dusk, and Midnight at 9 o'clock, 12 o'clock, 3 o'clock, and 6 o'clock, respectively. At each time, a circle represents the cell and a dashed line circle within represents a nucleus. At dawn, the nucleus shows the T I M and C R Y proteins exiting the nucleus and the C R Y, T I M complex degrades. P E R on binding with D B T undergoes phosphorylation and further P E R undergoes ubiquitylation and degradation. At noon, the R N A transcribes p e r and t i m. At dusk, T I M and P E R goes into the nucleus, and D B T represented in a yellow rectangle is located outside the nucleus. At midnight, the transcription arrow in the nucleus has a red X on it and C R Y is represented in a gray structure outside the nucleus.
FIGURE 21-11 Molecular circadian clock in prokaryotes. (a) The circadian clock in the cyanobacteria Synechococcus elongatus consists of three proteins, KaiA, KaiB, and KaiC. KaiC possesses intrinsic kinase and phosphatase activity. At dawn, KaiC exists in a dephosphorylated state. After binding of KaiA, however, its kinase activity is activated and it autophosphorylates itself at two residues. One of the residues in KaiC slowly becomes dephosphorylated, leading to the binding of the KaiB protein and release of KaiA. KaiB binding to KaiC inhibits its kinase activity, leading to fully de-phosphorylated of KaiC and release of KaiB. (b) This entire cyanobacteria cycle can be reconstituted in a test tube, where the phosphorylation state of KaiC undergoes a 24-hour oscillation, as shown in an immunoblot, in which the phosphorylation form of KaiC (P-KaiC) is separated from its nonphosphorylated form (NP-KaiC). (c) Quantification of the ratio of P-KaiC to NP-KaiC in part (c) reveals a 24-hour circadian rhythm. [Parts (b) and (c) republished with permission from American Association for the Advancement of Science, from M. Nakajima et al., 2005, “Reconstitution of Circadian Oscillation of Cyanobacterial KaiC Phosphorylation In Vitro,” Science 308(5720):414–415; permission conveyed through Copyright Clearance Center, Inc.] Description
The illustration labeled (a) shows the cycle again, with these differences: At dawn, the green rectangle K a i C, blue oval K a i A is oval and a green diamond K a i B are nearby but separate. At noon, the K a i C is attached along with two yellows phosphorus circles, K a i B is still separate. At dusk, one phosphate circle is gone and the K a i B is attached to the K a i C. At midnight, the K a i A is separated while K a i B is still attached. The immunoblot labeled (b) shows P K a i C and N P K a i C proteins from 0 to 60 hours in 12 hours intervals. In the graph labeled (c), the vertical axis represents ratio of P K a i C in hertz ranging from 0 to 1.0 in increments of 0.2. The horizontal axis represents hours at 30 degrees Celsius ranging from 0 to 72 in increments of 24 hours. A line in the graph shows even waves going from 0.4 up to 0.8, then down to 0.3 and up to 0.6 repeated. CLK and CYC are both basic helix-loop-helix transcription factors (see Section 8.4) that form a heterodimer and during the day bind to the promoter regions of the per and tim genes to induce their expression. The levels of PER and TIM proteins are low when their transcription is initially induced because they undergo protein degradation. In the case of the PER protein, its stability is regulated by phosphorylation by the DOUBLETIME (DBT) kinase, which in turn leads to the recruitment of an E3 ubiquitin ligase that targets PER for proteasome-mediated degradation. The concentrations of PER and TIM peak in the evening, with TIM binding to and stabilizing PER. The TIM-PER complex is then phosphorylated by another set of kinases, which promotes nuclear translocation of the TIM-PER complex. In the nucleus, the TIM-PER complex associates with the CLK-CYC dimer, thereby repressing its transcriptional ability and inhibiting expression of their own per and time genes throughout the night.
The Circadian Clock in Bacteria: A Different Solution
CRY is a flavin-containing photosensitive protein (see Figure 2-33), and light exposure at dawn triggers a conformational change in CRY, followed by CRY binding to TIM. Upon association with CRY, TIM is ubiquitinated and degraded by the proteasome, freeing up PER to once again be phosphorylated by DBT, ubiquitinated, and degraded. Degradation of TIM and PER relieves the inhibition of CLK-CYC and thereby reactivates the transcriptional activation of PER and TIM during the day. This feedback mechanism occurs over an approximately 24-hour period, constituting the molecular circadian clock. In simplistic terms, the clock involves two transcriptional repressors, PER and TIM, whose stability is regulated by phosphorylation, ubiquitination, and degradation. PER and TIM repress expression of their own genes by binding to and inactivating the CLK and CYC transcriptional activators (which promote expression of the per and tim genes). The Circadian Clock in Bacteria: A Different Solution Most, but not all, molecular clocks achieve oscillation through the type of transcriptional feedback loop shown in Figure 21-10. In the cyanobacteria Synechococcus elongatus, the clock is composed of three proteins, KaiA, KaiB, and KaiC, and the oscillatory feedback loop involves a series of post-translational modifications to KaiC (Figure 21-11a). KaiC has intrinsic kinase and phosphatase activities. As an isolated protein, the phosphatase is most active and KaiC exists mostly in its de-
Suprachiasmatic Nucleus: The Master Clock in Mammals
phosphorylated state. KaiA binding to KaiC inhibits the phosphatase activity and promotes the kinase activity, leading to autophosphorylation of KaiC at two sites. KaiC then slowly de-phosphorylates itself at one of the two sites, and the singly-phosphorylated KaiC now binds to KaiB. KaiB inhibits the kinase activity of KaiC, such that over time KaiC returns to its de-phosphorylated state. This simple feedback loop, consisting of a single protein (KaiC) that alternately phosphorylates and dephosphorylated itself depending on its protein-protein interactions (with KaiA and KaiB) can actually be fully reconstituted in a test tube (Figures 21-11b and c), creating a 24-hour cycle of phosphorylated and dephosphorylated KaiC! Suprachiasmatic Nucleus: The Master Clock in Mammals While molecular clocks are distributed in cells throughout the body, the suprachiasmatic nucleus (SCN), a collection of neurons in a region of the brain called the hypothalamus (Figure 21-12a), functions as a master clock or central pacemaker for circadian rhythms in mammals. Indicative of the central role of the SCN in synchronizing all clocks, destruction of the SCN abolishes all regular circadian rhythms and transplantation of an SCN into SCN-ablated animals restores circadian rhythms. Neurons in the SCN receive input from photoreceptor-containing ganglion cells in the retina. This information is then relayed by SCN neurons to downstream neurons and glands to trigger the release of hormones that in turn regulate an array of biological rhythms. For example, light and dark regulate the release of
melatonin from the pineal gland. Melatonin production, a hormone believed to promote sleep onset, is inhibited by light and stimulated by darkness, with the light and dark information being relayed from the retina to the SCN to the pineal gland. As another example, light activates release of cortisol from the adrenal gland. Cortisol, a stress hormone, is highest in daytime and regulates many physiological processes, including blood pressure, blood glucose levels, and inflammation.
FIGURE 21-12 The suprachiasmatic nucleus (SCN) is the master clock in mammals. (a) Light is detected by cells in the retina and relayed via a neuronal pathway (lavender) to the suprachiasmatic nucleus (SCN) in the brain. The SCN in turn sends signals to other neuronal centers and glands to induce signals that regulate molecular clocks throughout the body. One of these signals is to the pineal gland, which releases melatonin, a hormone that modulates the onset of sleep. (b) Individual neurons isolated from the SCN show 24-hour oscillating rhythms in action-potential firing (see Chapter 23 for discussion of action potentials) that persist for as long as the neurons are maintained in culture. [Part (b) Data from D. K. Welsh et al., 1995, Neuron 14:697–706.] Description The illustration labeled (a) shows the sun shining into the eye. In the brain, a blue oval is labeled S C N and attached at the end of the optic nerve. A label here reads neuronal and humoral outputs to peripheral clocks. After the S C N is a lighter blue oval labeled pineal gland. An arrow from the pineal gland shows the release of melatonin. In the graph labeled (b), the vertical axis represents firing rate in hertz ranging from 0 to 3 in increments of 1. The horizontal axis represents hours ranging from 0 to 72 in increments of 24. A line starts from 0 to 2.5 at about 16 hours, then back to 0 at about 28 hours, then back up and down again. The points labeled from a to f are at 0.1, 26 hours, 0, 28 hours, 2.2, 34 hours, 2.2, 38 hours, 0.3, 43 hours, and 0.05, 47 hours. In addition to relaying information about light and dark, the SCN possesses a particularly robust intrinsic molecular clock. The SCN consists of a heterogeneous cluster of about 10,000 neurons on each side of the brain. When SCN neurons are isolated and placed in culture, they show circadian rhythms in levels of free calcium in the cytosol and electrical firing that follows a 24-hour period for as long as they are maintained in culture (Figure 21-12b). In addition to these cellautonomous circadian rhythms, signaling between neurons in the SCN
demonstrate circadian rhythms, such that the circuit properties of the SCN are critical to the generation of circadian rhythms throughout the body. Recent research has revealed the impact of circadian rhythms on many aspects of cell biology, from transcriptional, translational, and posttranslational regulation to the dynamics of intracellular organelles, to cell differentiation, and to cell death. In research laboratories, this realization has motivated many scientists to consider the time of day during which they conduct their experiments. Circadian rhythms are also clinically important. In addition to primary diseases of circadian rhythms, which include narcolepsy (a syndrome characterized by daytime sleepiness and involuntary, uncontrollable sleep episodes) and sleep disorders in which the phase of sleep is altered, many other diseases are accompanied by alterations in circadian rhythms. For example, nearly 25 percent of individuals with Alzheimer’s disease have significant sleep disorders, and up to 75 percent of children with autism spectrum disorders have sleep disturbances. Increased molecular and cell biological insights into the functioning of molecular clocks and the mechanisms by which external cues entrain these clocks are likely to have important therapeutic implications for these clinical disorders. KEY CONCEPTS OF SECTION 21.6 Sensing Day and Night: Circadian Rhythms All organisms exhibit ~24-hour circadian rhythms that are driven by molecular clocks within cells and that can be reset by external cues such as light and dark. A negative feedback loop in which clock genes are regulated by their own protein products is conserved from flies to humans. This feedback loop consists of two
transcriptional repressors, PERIOD and TIMELESS, two transcriptional activators, CLOCK and CYCLE, and several kinases and E3 ubiquitin ligases. PERIOD and TIMELESS levels cycle every 24 hours, accumulating during the day and being degraded at night. Bacteria have a different circadian clock, consisting of three proteins, KaiA, KaiB, and KaiC, that form a transcriptional feedback loop that oscillates on a 24-hour cycle. In mammals, the suprachiasmatic nucleus (SCN) in a region of the brain called the hypothalamus serves as a master clock or central pacemaker. Ablation of the SCN abolishes all regular circadian rhythms.
21.7 Sensing and Responding to the Physical Environment
21.7 Sensing and Responding to the Physical Environment We learned in Chapters 16 and 17 how cells coordinate their activities by communicating with each other through receptors that bind soluble molecules secreted by a signaling cell or signaling proteins bound to the plasma membrane of a neighboring cell. Earlier in this chapter, we saw how cells regulate their metabolism and gene-expression patterns by sensors that respond to changes in many small molecules in their environment, as well as to changes in temperature and light. Cells also perceive their microenvironment through physical and mechanical cues (mechanotransduction) from the extracellular matrix (ECM) in which they are imbedded and by tension across intercellular adherens junctions generated from the indirect connections of these junctions to the actin cytoskeleton (see Figures 20-1 and 20-38). In this section, we discuss the Hippo pathway, a protein kinase signaling cascade conserved in all metazoans that senses and integrates these cues about the physical properties of the ECM and modulates cell growth and differentiation in response. As an example, during development, cells proliferate and differentiate to generate organs of specific sizes, and we will see how mutations in this pathway can result in excessive organ growth and how the Hippo pathway regulates the expression of multiple genes involved in growth control and differentiation. Abnormalities in this pathway
The Hippo Kinase Cascade Pathway in Drosophila and Mammals
contribute to many developmental disorders and generation of many types of cancers. The Hippo Kinase Cascade Pathway in Drosophila and Mammals The Hippo kinase pathway (Figure 21-13a) is conserved in all metazoans and their closest unicellular relatives, suggesting that it evolved before multicellularity. The discovery of the Hippo pathway came from studies by Drosophila geneticists searching for genes that control cell replication, genes now known as tumor suppressors (see Chapter 25). Examination of progeny derived from flies treated with a mutagen (see Figure 6-4) revealed that homozygous recessive mutations in a gene named Hippo resulted, as mentioned previously, in abnormally fat larvae that resemble a small hippopotamus, leading to the name of the gene. Further examination revealed that this phenotype was due to the growth of an abnormally large fat body, the Drosophila larva physiological equivalent of the vertebrate liver. Isolation and characterization of other Drosophila mutants with a similar homozygous recessive phenotype led to identification of genes encoding the core components of the Hippo pathway, heterodimeric protein kinases Hpo-Sav and Wts-Mats, which regulate the nuclear import of the transcriptional co-activator Yki (Figure 21-13a). Once imported into the nucleus, Yki activates transcription by binding to a sequence-specific DNA-binding protein encoded by Sd, which does not affect transcription in the absence of Yki. Later in this section, we learn about some of the many genes involved in cell proliferation and differentiation induced by the
human orthologs of Yki, called YAP and TAZ, and the human counterparts of Drosophila Sd, DNA-binding proteins TEAD 1 to 4.
FIGURE 21-13 The Hippo pathway has similar components and functions in Drosophila and mammals. (a) Proteins with orthologous functions in the Hippo pathway in Drosophila
and humans are indicated in italics and regular fonts, respectively. Arrows indicate activation of the downstream signaling component; see text for details. (b, c) Consequences of overexpression during embryogenesis of Yki in Drosophila wing imaginal disk (b), or of YAP in mouse liver (c) during embryogenesis. Normal tissues are shown to the left and tissues overexpressing Yki or YAP are shown to the right. [Parts (b) and (c) republished with permission from Elsevier, from D. Pan, 2010, “The Hippo Signaling Pathway in Development and Cancer,” Dev. Cell 19(4):491–505; permission conveyed through Copyright Clearance Center, Inc.] Description The illustration labeled (a) shows one vertical diagram starting with a red rectangle labeled Low F-actin. A downward arrow moves to two attached shapes, the left one labeled M s t 1/2 H p o and the right one labeled S A V 1 S a v. A downward arrow goes to a repeat of these shapes now with phosphate yellow circles added. A last downward arrow leads to a hexagon labeled Y A P/T A Z Y k i. This hexagon has a blue circle labeled 14-3-3 surrounding a phosphate circle. At the bottom, the nucleus is with D N A-binding latent T F and an oval labeled T E A D S d. The transcription process does not take place. The second vertical diagram is the same, except the red rectangle reads High F-actin, and there are no phosphate yellow circles. In the nucleus, the Y A P/T A Z hexagon is attached to the T E A D S d and activates the transcription process. A micrograph labeled (b) shows a small imaginal disc of a firefly wing and a larger one on the right. The photo labeled (c) shows a normal mouse liver on the left and an overexpressed large mouse liver on the right. When the Hippo pathway is active, activated Hpo-Sav kinase phosphorylates and activates the Wts-Mats protein kinase, which then phosphorylates and inactivates the Yki transcriptional co-activator. Yki phosphorylated at specific serine residues is inactive as a transcriptional co-activator because it is bound by a class of 14-3-3 proteins anchored in the cytoplasm (see Chapter 16) that bind phosphoserine and closely related phosphothreonine residues, preventing nuclear import of Yki.
The Hippo pathway is highly conserved in mammals (see Figure 21-13a), except that there are duplicates of the orthologous Drosophila genes. Human genes MST1 and MST2 are closely related to the orthologous Drosophila Hpo gene, encoding the catalytic subunit of the first protein kinase in the pathway. LATS1 and LATS2 are both orthologous to Drosophila Wts and encode the catalytic subunit of the second protein kinase in the pathway. And YAP and TAZ are ~60 percent identical in amino acid sequence and are both orthologs of the Drosophila transcription factor gene Yki. As discussed in Chapter 7 for β-globin gene family members, the proteins encoded by these duplicated and diverged Hippo pathway genes probably have similar but somewhat specialized functions. Inactivation of the Hippo pathway leads by default to nuclear import of the YAP/TAZ transcriptional co-activators, directed by their nuclear localization signals (NLSs). This leads to transcriptional activation of genes that have TEAD transcription factors prebound to enhancers that regulate them. This requirement for pre-binding of TEAD factors for gene activation by the imported YAP and TAZ co-activators determines which genes respond to regulation of Hippo signaling in different cell types. The functional similarity between the Hippo pathway in Drosophila and mammals was dramatically demonstrated by experiments in which Drosophila Yki or the human YAP gene were overexpressed in cells in developing embryos. Overexpression of Yki in the Drosophila wing imaginal disc that normally develops into a wing during larval morphogenesis led to a great increase in the size of the imaginal disk, while the overall morphology of the developing organ was much less
Regulation of the Hippo Kinase Cascade by Cell Interactions with the Extracellular Matrix and by Tension on Actin Filaments
affected (Figure 21-13b). Analogously, overexpression of YAP in the developing mouse liver led to a greatly increased size of the liver compared to normal, but the overall morphology of the developing organ was near normal (Figure 21-13c). Further analysis showed that increased organ size in both Drosophila and mice was due to an increase in the number of cell divisions and a decrease in apoptosis in the developing organs. Further, YAP and TAZ are considered to be oncogenes (see
Chapter 25) because they are expressed at much higher than normal level in several types of human cancers where they likely contribute to oncogenesis by stimulating cell cycling (see Chapter 19) and inhibiting apoptosis (see Chapter 22). Regulation of the Hippo Kinase Cascade by Cell Interactions with the Extracellular Matrix and by Tension on Actin Filaments We learned in Chapter 4 that most types of animal cells will grow in culture only when attached to a solid surface. Many cells secrete extracellular matrix proteins such as fibronectin and collagen that stick to the surface of the plastic or glass culture dish and that in turn bind to integrins on the cell surface and allow the cell to spread on the culture dish. Evidence that the Hippo pathway, and consequently the nuclear localization of YAP and TAZ, is regulated by cellular interactions with the ECM was observed when wild-type human epithelial and mesenchymal
stem cells were cultured on either a stiff or a soft surface (Figure 21-14a). Stiffness of the substratum is measured in units of pressure, kilopascals (KPa), required to deform its shape. At high stiffness (40 KPa) comparable to a glass coverslip routinely used to culture a monolayer of cells for immunofluorescence studies, the Hippo pathway was off and YAP was nuclear. However, at low-substrate stiffness (0.7 KPa) the Hippo pathway was on and YAP was primarily cytoplasmic (see Figure 21-14a).
EXPERIMENTAL FIGURE 21-14 Regulation of Hippo pathway activity by physical properties of the ECM. (a) YAP localization in mesenchymal stem cells attached to a stiff (40 KPa) or soft (0.7 KPa) substratum, as detected by immunofluorescence. TOTO3 is a fluorescent stain for DNA and shows the location of nuclei. (b) Influence of the area of a square of fibronectin on nuclear localization of YAP and TAZ (both immunostained green). (c) Summary of the influence of substrate stiffness and the area of cell spreading on assembly of actin stress fibers and YAP/TAZ subcellular localization. [Parts (a) and (b) republished with permission from Springer Nature, from S. Dupont et al., 2011, “Role from YAP/TAZ in Mechanotransduction,” Nature 474:179–183; permission conveyed through Copyright Clearance Center, Inc.; Images courtesy of Sirio Dupont.] Description In the micrographs labeled (a) the top row of two is labeled alpha Y A P and the bottom row is labeled T O T O 3. The first column is labeled 40 K P a and the second one 0.7 K P a. In the top row, the first photo shows a small green fluorescent blob, and the second one shows the green blob is spreading out. In the bottom row, red fluorescence is used and the red blob stays the same, but a little larger in the second micrograph. The illustration labeled (b) shows a row of five schematics, from left to right; a gray square starts large and has a spreading cell in it, then the next four squares get smaller. Under these schematics, above the micrographs, are these labels, left to right: unpatterened, 10,000, 2025, 1024, and 300 micrometers squared. The top row of 5 micrographs labeled under alpha Y A P/T A Z shows the green fluorescent blob separating and spreading out from left to right. The bottom row of 5 micrographs labeled under T O T O 3 shows red fluorescent blobs staying in blob shape but getting a little bit larger. In the illustration labeled (c), the first schematic shows the spread of attachment sites in the cell under stiff E C M and cell spreading with labels actin stress fibers, Hippo signaling OFF, Y A P/T A Z active in nucleus. The second schematic shows the limited attachment sites in the cell under soft E C M and confined adhesion with labels no actin stress fibers, Hippo signaling ON, Y A P/T A Z inactive in cytosol. In another revealing experiment, mesenchymal stem cells cultured from an early mouse embryo were plated on successively smaller squares of
fibronectin dried onto a surface that cells do not otherwise attach to (Figure 21-14b). Individual cells spread only on the patches of fibronectin. At areas where the cell could spread out to near the area it covers on a continuous surface of fibronectin, YAP was nuclear, indicating that the Hippo pathway was off. However, in cells plated on smaller fibronectin squares of only where they could not spread out, YAP was primarily cytoplasmic (see Figure 21-14b), indicating that the Hippo pathway was active, leading to phosphorylation of YAP and TAZ and their retention in the cytoplasm. These experiments revealed that the activity of the Hippo pathway responded to the physical properties of the ECM and the area of cell adhesion (Figure 21-14c). We learned in Chapter 17 that interactions of actin filaments with proteins attached to the plasma membrane is important for many aspects of cell adhesion. Indeed, cells that spread out on a stiff substratum contained extensive actin stress fibers visualized by staining with the fluorescently labeled fungal toxin phalloidin (Figure 21-15a). These are the cells in which the Hippo pathway was off, as indicated by their nuclear YAP (see
Figure 21-14a). In contrast, no actin stress fibers were observed in cells plated on a soft substratum (see Figure 21-15a); in these cells Hippo signaling was active, as indicated by cytoplasmic YAP (see Figure 2114a). This correlation suggested that actin stress fibers somehow inhibit the Hippo pathway, leading to nuclear import of YAP that is not bound by cytoplasmic 14-3-3 proteins. Further experiments using the fungal toxin Latrunculin, which disrupts actin filaments, showed that actin fibers are
indeed required for inhibition of Hippo signaling and nuclear localization of YAP (Figure 21-15b). EXPERIMENTAL FIGURE 21-15 Regulation of Hippo pathway activity by tension on actin filaments. (a) Visualization of actin stress fibers with fluorescently labeled (green)
The Hippo Pathway and Early Embryogenesis
phalloidin, a fungal toxin that binds actin filaments, but not actin monomers, in mesenchymal stem cells attached to a stiff (40 KPa) or soft (0.7 KPa) substratum. (b) Actin stress fibers are required for YAP nuclear localization. E1AKD293 cells are flattened against the substratum by tension on actin fibers running from apical to basal adherens junctions. The tension results from myosin motor proteins that move actin fibers extending from apical adherens junctions past actin fibers extending from basal adherens junctions (see Chapter 17). This flattens the whole cell against the substratum, including the nucleus, making it appear large when viewed from the top (control). Thirty minutes after addition of Latrunculin B (LatB) to the media, actin cables were dissociated into actin monomers and nuclei took on a globular morphology that appeared much smaller when viewed from the top. In the absence of actin fibers, the Hippo pathway was on and YAP was sequestered in the cytoplasm. [Part (a) republished with permission from Springer Nature, from S. Dupont et al., 2011, “Role of YAP/TAZ in Mechanotransduction,” Nature 474:179–183; permission conveyed through Copyright Clearance Center, Inc.; Part (b) republished with permission of the authors, from N. R. Zemke, D. Gou, and A. J. Berk, 2019, “Dedifferentiation by Adenovirus E1A Due to Inactivation of Hippo Pathway Effectors YAP and TAZ,” Genes Dev. 33(13–14):828–843.] Description In the micrographs labeled (a) the columns of the micrographs are labeled 40 K P a and
0.7 K P a. The rows of the micrographs are labeled phalloidin and T O T O 3. In the top row, the green fluorescence is diffused all over the photo at the left, and then begins to show an oval outline in the right side photo. In the bottom photos, the red blob is small in the left one and smaller in the right one. In the micrographs labeled (b), the four columns are labeled Y A P, D A P I, Actin, and Overlay. For the control row, the Y A P is green blobs, the D A P I is blue blobs and the Actin is several tiny red dots. In the overlay, all three are together. In the bottom row, there are four green blobs under Y A P, four very dim blue blobs under D A P I, some dim red rings and random-looking dots in Actin, and the overlay shows them together.
The Hippo Pathway and Early Embryogenesis The Hippo pathway is essential for many steps in development including the very first example of cellular differentiation during embryogenesis in mammals, the differentiation of cells on the surface of a 16–32 cell embryo, called a morula, into trophectoderm cells (see Figure 22-2). The inner cells of the morula remain undifferentiated and divide to form the inner cell mass of the early blastocyst that later develops into the embryo itself. The outer trophectoderm is required for implantation of the blastocyst in the uterine epithelium; it will later form extraembryonic tissues including the embryonic portion of the placenta (see Figure 22-3). The Hippo pathway is active only in the inner cells of the morula; these are the cells that are surrounded on all sides by other cells and connected to them by adherens junctions (Figure 20-14e; Figures 21-16a and b). In these cells, YAP and TAZ are phosphorylated by the LATS kinase and retained in the cytoplasm (Figure 21-16a). In contrast, the outer cells of the morula have a free surface not attached to other cells. Under this segment of the plasma membrane are long filaments of F-actin, and as we will see this causes the Hippo pathway to become inactive. As a result, YAP/TAZ are imported into the nucleus where, together with a TEAD (see
Figure 21-13a), they activate transcription of genes that initiate the trophectoderm differentiation program.
FIGURE 21-16 Regulation of the Hippo pathway in the morula by the subcellular localization of angiomotin. (a) Active Hippo signaling in the inner cells of the morula is indicated by the cytoplasmic localization of both phospho-YAP (upper panel) and total YAP (lower panel). In the outer cells, the Hippo pathway is off and YAP is unphosphorylated and nuclear. (b) Diagram of angiomotin (Amot) associated with adherens junctions on all cell surfaces of the inner cells (lower panel) and with the apical actin fibers in the outer cells (upper panel). In inner cells, association of Amot with Nf2 at adherens junctions stimulates Amot phosphorylation by LATS1 and 2, activating the Hippo pathway. In the outer cells, sequestration of Amot at the apical surface inactivates Hippo signaling. (c)
Immunofluorescent staining of Amot in the morula demonstrating its localization to all surfaces of the two inner cells shown and its sequestration to the apical surface of outer cells. (d) Summary of Hippo pathway activity and YAP nuclear localization in inner and outer cells of the morula. [Part (c) republished with permission from John Wiley & Sons, Inc., from H. Sasaki, 2017, “Roles and Regulations of Hippo Signaling During Preimplantation Mouse Development,” Dev., Growth Differ. 59:12–20; permission conveyed through Copyright Clearance Center, Inc.] Description The illustration labeled (a) shows a top diagram of pink outer cells around three blue inner cells. All the nuclei are pink. The label reads Hippo signaling (Phospho Y A P). In the bottom diagram, the same cells appear, but the outer cells now have blue nuclei. The label reads No Hippo signaling (un-phosphorylated YAP). The outer cells are labeled morula outer cells and the inner cells are labeled morula inner cells. The illustration labeled (b) titled morula outer cells shows two cells. Inside the top square, labeled outer cell, a chain of red beads labeled F-actin has a blue oval labeled Amot on it. Below this is a structure labeled L A T S. Below to the left of this is a set of three circles labeled Beta, alpha, and N f 2, attached to the structure in the adherens junction. Hippo signaling is inactive in the outer cell. The square below this is labeled inner cell and shows these structures all connected with phosphorus yellow circles. Hippo signaling is active in the inner cell. The integrins are in the inner cells. The micrograph labeled (c) titled Amot shows two light red cells labeled inner cells surrounded by the dark red outer. The illustration labeled (d) titled outer cell; Hippo inactive and inner cell; Hippo active shows a close up of each cell. The outer cell shows two structures joined and labeled M s t and S A V 1. Below this are two more of the same structure, also joined, labeled L A T S and M O B 1. Below this is a nucleus with the Y A P hexagon joined to the T E A D on the D N A and an arrow indicating active transcription. The second close-up, labeled inner cell, shows the same parts but yellow phosphorus circles are on each structure and the Y A P is not in the nucleus. The process of transcription does not take place.
In the morula, Hippo pathway signaling is controlled by an actin-binding protein called angiomotin (Amot; Figure 21-16b). In the inner cells, Amot is associated with the adherens junctions present on all surfaces of the cell (Figure 21-16c). The interaction between Amot and adherens junctions requires another junction-associated Hippo pathway component, neurofibromatosis 2 (Nf2), discussed below. In this adherens-junctionassociated protein complex, a specific Amot serine residue becomes phosphorylated by the Hippo pathway protein kinases LATS1 and 2. In these preimplantation embryos, the phosphorylation of Amot stimulates phosphorylation of YAP/TAZ by LATS1/2, causing retention of YAP/TAZ in the cytosol. Amot proteins (three paralogs in mice and humans) have an F-actin binding and polymerizing activity, and the Amot serines phosphorylated by LATS1/2 are in their actin-binding domain. Phosphorylation of Amots at these sites inhibits their ability to bind F-actin and enhances their phosphorylation by LATS1/2. This enhanced Amot phosphorylation stimulates Hippo signaling at adherens junctions (see Figure 21-16b), maintaining cytoplasmic sequestration of YAP/TAZ in the inner cells of the morula (see Figure 21-16a). However, in the outer cells of the 16–32 cell embryo, cell polarization through the Par-aPKC system (see Chapter 22) induces assembly of a thick band of cortical actin filaments at the apical surface of the cell, where adherens junctions do not form because there are no neighboring cells. In these outer cells unphosphorylated Amot is sequestered away from the adherens junctions by binding to the cortical actin filaments. Consequently, Amot does not get phosphorylated by LATS, the Hippo pathway is inactive, and YAP/TAZ are imported into the
nucleus (Figure 21-16d). In these cells nuclear YAP/TAZ together with TEAD (see Figure 21-13a) activate transcription of the homeodomain gene Cdx2 and the zinc-finger transcription factor Gata3, which in turn initiate the developmental program of trophectoderm cells. In this way, cell-cell interactions via E-cadherins on the outside of the plasma membrane control Hippo signaling in the cytoplasm. The experiments in Figures 21-14 and 21-15 indicate that the signals that control the activity of the Hippo pathway are regulated by physical properties of the ECM, such as stiffness, the area of the interacting adhesive cell surfaces, and tension on the actin cytoskeleton. These in turn are controlled by the changing cellular and tissue environment during embryogenesis and later stages of development to control Hippo signaling and the proliferation and differentiation of progenitor cells in the developing embryo. Such adhesive and mechanical forces ultimately control the sizes and morphology of tissues and organs during development and during tissue regeneration after injury. Mutations that inactivate one allele of human NF2, a component of the Hippo pathway (see Figure 21-16b), cause abnormal growth of peripheral nervous system tissue in the dominant genetic disease neurofibromatosis type II. NF2 associates with the cadherin-associated protein α-catenin on the cytoplasmic side of adhesion junctions (Figure 20-14e). As noted above, a specific Amot serine residue becomes phosphorylated by Hippo pathway protein kinases LATS1 and 2 in these adherens junction-associated protein complexes (Figure 21-16b). In
preimplantation embryos, this phosphorylation of Amot stimulates phosphorylation of YAP/TAZ by LATS1/2, causing sequestration of YAP/TAZ in the cytoplasm. Phosphorylation at this site also blocks Amot association with actin filaments. In patients with one inactivated NF2 gene, half the normal amount of the NF2 protein is expressed. This decreases the activity of the Hippo pathway leading to abnormally high activation by YAP/TAZ and excessive cell proliferation. Much remains to be learned about how regulation of the Hippo pathway in response to tension on the actin cytoskeleton contributes to tissue size and morphology, although it is clear that the overall process helps to sculpt the size and shape of metazoan organs. Understanding Hippo pathway regulation is medically important because abnormalities in the Hippo pathway function contribute to oncogenic transformation and the invasiveness and metastasis of human tumors. Deeper understanding of Hippo pathway regulation may allow the logical design of therapeutic interventions in these diseases. KEY CONCEPTS OF SECTION 21.7 Sensing and Responding to the Physical Environment The Hippo protein kinase pathway controls the sizes and morphologies of several organs during embryonic development of metazoans. The Hippo pathway is also required for regeneration of damaged tissues and organs in many metazoan tissues capable of regenerating after injury. The core components of the pathway are two heterodimeric protein kinases (Hpo-Sav and Wts-Mats in Drosophila). The activity of the pathway is regulated by signals from adherens junctions, mechanical forces acting on the actin cytoskeleton, and other aspects of the physical properties of the cellular environment.
The principal targets of the pathway are the transcriptional co-activators YAP and TAZ (in mammals). Phosphorylation of YAP/TAZ causes their cytoplasmic sequestration and consequently inactivation of their transcriptional co-activator function. In the absence of this phosphorylation, YAP/TAZ are imported into the nucleus where they bind to inactive TEAD transcription factors (in mammals) prebound to multiple cell-type-specific enhancers, leading to transcriptional activation of these genes. Because of this, nonoverlapping sets of genes are regulated by the Hippo pathway in different cell types, depending on where TEAD factors are bound. In many cell types, activation of the Hippo pathway promotes apoptosis and inhibits cell cycling, limiting tissue growth. Inactivation of the Hippo pathway stimulates cell replication and inhibits apoptosis, stimulating tissue growth. Abnormal regulation of the Hippo pathway contributes to the uncontrolled growth of several types of human cancers and also to invasion of normal surrounding tissue and metastasis by cancers because of abnormal regulation of the actin cytoskeleton.
Key Terms
End of Chapter Visit Achieve to access study tools and to learn more about the content in this chapter. Perspectives for the Future Analyze the Data Chapter References Additional study tools, including videos, animations, and quizzes Key Terms autophagy circadian clock (circadian oscillator) effector proteins feedback repression glucagon gluconeogenesis GLUT4 storage vesicle (GSV) heat-shock proteins (HSP) heat-shock response Hif-1α Hippo pathway homeostasis insulin mechanoreceptors
Review the Concepts
mTOR protein kinase mTORC1 sensors signal amplification signal transduction pathways SRE-binding proteins (SREBPs) suprachiasmatic nucleus (SCN) Review the Concepts 1. How are insulin and glucagon secretion in the pancreas regulated? How does each hormone affect blood glucose levels? 2. What is GLUT4, and how is it regulated by insulin? 3. What parts of the blood glucose regulation pathways are affected in type 1 diabetes? In type 2 diabetes? 4. List and briefly describe the anabolic signal transduction pathways activated by mTORC1. How do these pathways contribute to cell growth? 5. One of the signals that activates mTOR are levels of cytosolic amino acids. How does this pathway function? 6. To what class of proteins does Rheb belong? Where is Rheb found in cells? Explain the mechanisms that regulate Rheb and describe the downstream consequences when a cell accumulates active Rheb. 7. How do SCAP and SREBP proteins work to prevent the expression of genes containing sterol regulatory elements when
sufficient cholesterol is present in the endoplasmic reticulum (ER) membrane? 8. Describe the changes that are triggered in the cell when the cholesterol levels in the ER membrane drop to less than 5 percent of the total ER lipids. 9. What is nSREBP? Where is it generated? What is its function? 10. The expression of what two types of proteins is induced in mammals by Hif-1α? How do these proteins contribute to survival under low-oxygen conditions? 11. How do an aspargine hydroxylase, a proline hydroxylase, and an E3 ubiquitin ligase keep Hif-1α in check under normal oxygen levels? 12. How are ERF proteins in plants kept in check at ambient oxygen levels? 13. Why are proteins so sensitive to very small changes in temperature? 14. What is the role of heat-shock proteins (HSPs) in the proteinfolding process? 15. In unstressed cells, how do HSPs and heat-shock factor (HSF) proteins interact to keep the heat-shock response in check? 16. What are the key genes or proteins in the circadian clock in Drosophila melanogaster? How does a negative feedback loop play a role in the circadian clock? 17. Describe the circadian clock in cyanobacteria. 18. What is a zeitgeber? How would a zeitgeber affect an organism’s circadian rhythms? What are some examples of a zeitgeber? 19. What role does the Hippo pathway play in flies and mammals?
20. Based on the experiments described in this section, explain how input about the extracellular matrix (ECM) is translated to the on or off state of the Hippo pathway. How is subcellular localization of pathway components involved? 21. How does the Hippo pathway play a role in differentiation of the inner and outer cells of the morula?