Introduction
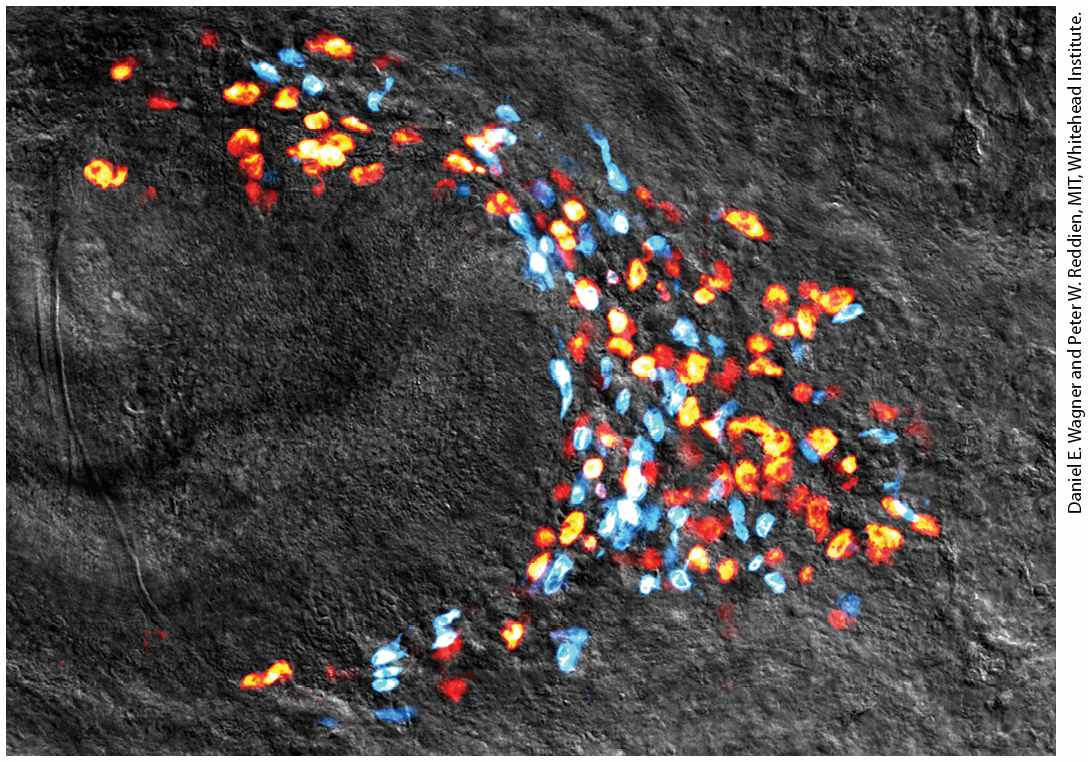
Chapter 22 Stem Cells, Cell Asymmetry, and Regulated Cell Death Pluripotent stem cells called neoblasts provide the cellular basis for regeneration in planarian flatworms. Shown is a colony of neoblasts (yellow, orange, and red), all derived from a single neoblast 14 days after regeneration of the tail was initiated by amputation; differentiating cells (blue), also derived from the single neoblast, are shown as well.
22.1 Early Mammalian Development, Embryonic Stem Cells, and Induced Pluripotent Stem Cells
22.2 Stem Cells and Niches in Multicellular Organisms
22.3 Mechanisms of Cell Polarity and Asymmetric Cell Division
22.4 Cell Death and Its Regulation Many descriptions of cell division imply that the parent cell gives rise to two daughter cells that look and function exactly like the parent cell. In other words, they imply that cell division is symmetric and that the progeny have properties similar to those of the parent (Figure 22-1a). Many yeasts, fungi, and other single-celled eukaryotes do divide this way. Mature liver cells — hepatocytes — also divide symmetrically, each giving rise to two daughter hepatocytes.
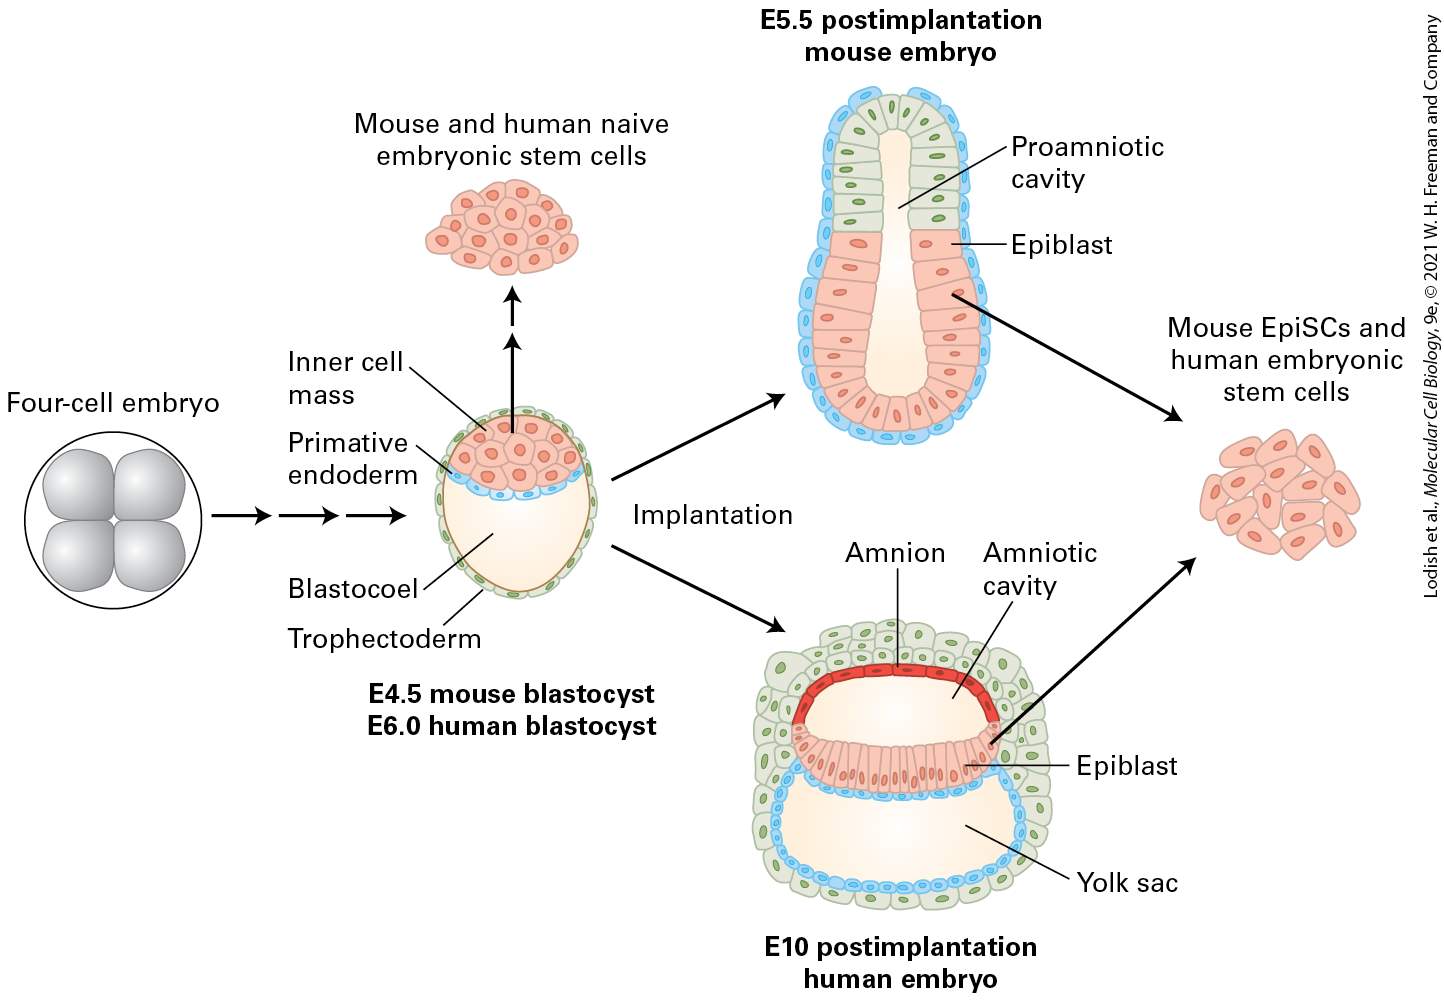
FIGURE 22-1 Overview of the birth, lineage, and death of cells. Following growth, daughter cells are born as the result of symmetric or asymmetric cell division. (a) The two daughter cells resulting from symmetric division are essentially identical to each other and to the parent cell. Such daughter cells can subsequently have different fates if they are exposed to different signals. (b) The two daughter cells resulting from asymmetric cell division differ from birth and consequently have different fates. In some cases (left), both daughter cells are different from each other and from the parent cell. In others (right), one daughter cell is essentially identical to the parent and the other assumes a different fate. Asymmetric division is common when the parent cell is a stem cell and one of the daughters is also a stem cell; this allows the number of stem cells (yellow) to remain constant while the other daughter generates other cells (orange) that divide and then mature into one or more differentiated cell types. (c) A series of symmetric and asymmetric cell divisions, called a cell lineage, gives birth to each of the specialized cell types found in a multicellular organism and is under tight genetic control. Description The illustration labeled (a) shows symmetric cell division, with one cell undergoes cell division and yielding two cells with the same genetic information. In the illustration labeled (b) asymmetric cell division, there are two cells side by side, each one dividing into two cells. The two new cells of both parent cells are in orange and green. The illustration labeled (c) has one red cell dividing into one red and one pink cell. The pink cell then divides and produces one yellow cell and a pink cell labeled cell death and drawn in several pieces. The yellow cell goes on to reproduce two yellow cells, and one yellow cell reproduces again with an orange and a green cell as the new cells. An arrow from the parent red cell points to the orange cell and labeled cell lineage. But if this were always the case, none of the hundreds of differentiated cell types and functioning tissues present in complex multicellular plants and animals would ever be formed. Differences among cells can arise when
two initially identical daughter cells diverge upon receiving distinct developmental or environmental signals. Alternatively, the two daughter cells may differ from birth, with each inheriting different portions of the parent cell (Figure 22-1b). Daughter cells produced by such asymmetric cell division may differ in size, shape, or protein composition, or their genes may be in different states of activity or potential activity. The differences in these internal signals confer different fates on the two cells. In certain asymmetric cell divisions, one of the daughters is similar to the parent cell and the other forms a different type of cell. In multicellular organisms, the formation of working tissues and organs, during both development and cell replacement, depends on specific patterns of mitotic cell divisions. A series of such cell divisions akin to a family tree is called a cell lineage. A cell lineage traces the birth order of cells as they progressively become more restricted in their developmental potential and differentiate into specialized cell types such as skin cells, neurons, or muscle cells (Figure 22-1c). The development of a new metazoan organism begins with the egg, carrying a set of chromosomes from the mother, and the sperm, carrying a set of chromosomes from the father. These gametes, or sex cells, are haploid because they have gone through meiosis (see Chapter 19). In the process called fertilization, they combine to create the initial single cell, the zygote, which has two sets of chromosomes and is therefore diploid. During embryogenesis, the zygote undergoes numerous cell divisions, both symmetric and asymmetric, ultimately giving rise to an entire organism. As we will see later in the chapter, many of the early divisions
of the nematode Caenorhabditis elegans follow a mosaic development strategy, in which all of the early cell divisions are asymmetric and each daughter cell gives rise to a discrete set of differentiated cell types (see
Figure 22-26). However, the focus of the first section of this chapter is early mammalian development, quite different from that of Caenorhabditis, and the generation of embryonic stem cells. Both mouse and human embryos pass through an eight-cell stage; each of these cells can still form every type of tissue — both the embryo itself and the extraembryonic tissues — making all eight cells totipotent. At the 16-cell stage, this is no longer true: some of the cells have become committed to particular differentiation paths. A group of cells called the inner cell mass will ultimately give rise to all tissues of the embryo proper, and another set of cells, the extraembryonic trophectoderm, will form the placental tissue (see Figures 22-2 and 22-3). Cells such as those in the inner mass that can generate all embryonic tissues, but not extraembryonic tissues, are called pluripotent. As we will learn in Section 22.1, cells of the inner cell mass can be cultured in defined media, forming embryonic stem (ES) cells. ES cells can be grown indefinitely in culture, where they divide symmetrically, so that each daughter cell remains pluripotent and can potentially give rise to all of the tissues of an animal. We will discuss the use of ES cells in uncovering the transcriptional network of gene expression underlying pluripotency as well as in forming specific types of differentiated cells for research purposes or, potentially, as replacement parts for worn-out or diseased cells in patients.
For many years, animal cell differentiation was thought to be unidirectional, but recent data reveal that differentiation can be reversed experimentally. Through recombinant expression of specific transcription factors, several types of specialized, differentiated cells can be converted into another type of differentiated cell. Strikingly, introducing just a small number of the transcription factors that control the pluripotency of ES cells, under defined conditions, can over time convert at least some types of somatic cells into induced pluripotent stem (iPS) cells that have properties seemingly indistinguishable from those of ES cells. We will learn that, like ES cells, iPS cells have profound utility for experimental biology and medicine. Many types of stem cells are important during both metazoan development and adult life. They are unspecialized cells that can reproduce themselves as well as generate specific kinds of more specialized cells (see Figure 22-1b). Their name comes from the image of a plant stem, which grows upward, continuing to form more stem, while also sending off leaves and branches to the side. In the second section of this chapter, we explore several types of stem cells that differ in the variety of specialized cell types they can form, including those that give rise to germ cells, intestinal cells, and the variety of cell types found in blood. Unlike ES cells, the stem cells in adults are multipotent: they can give rise to multiple types of differentiated cells found in the organism but not all of them. Some stem cells can undergo symmetric divisions in which both of the daughters are stem cells, thus increasing the number of stem cells. Many
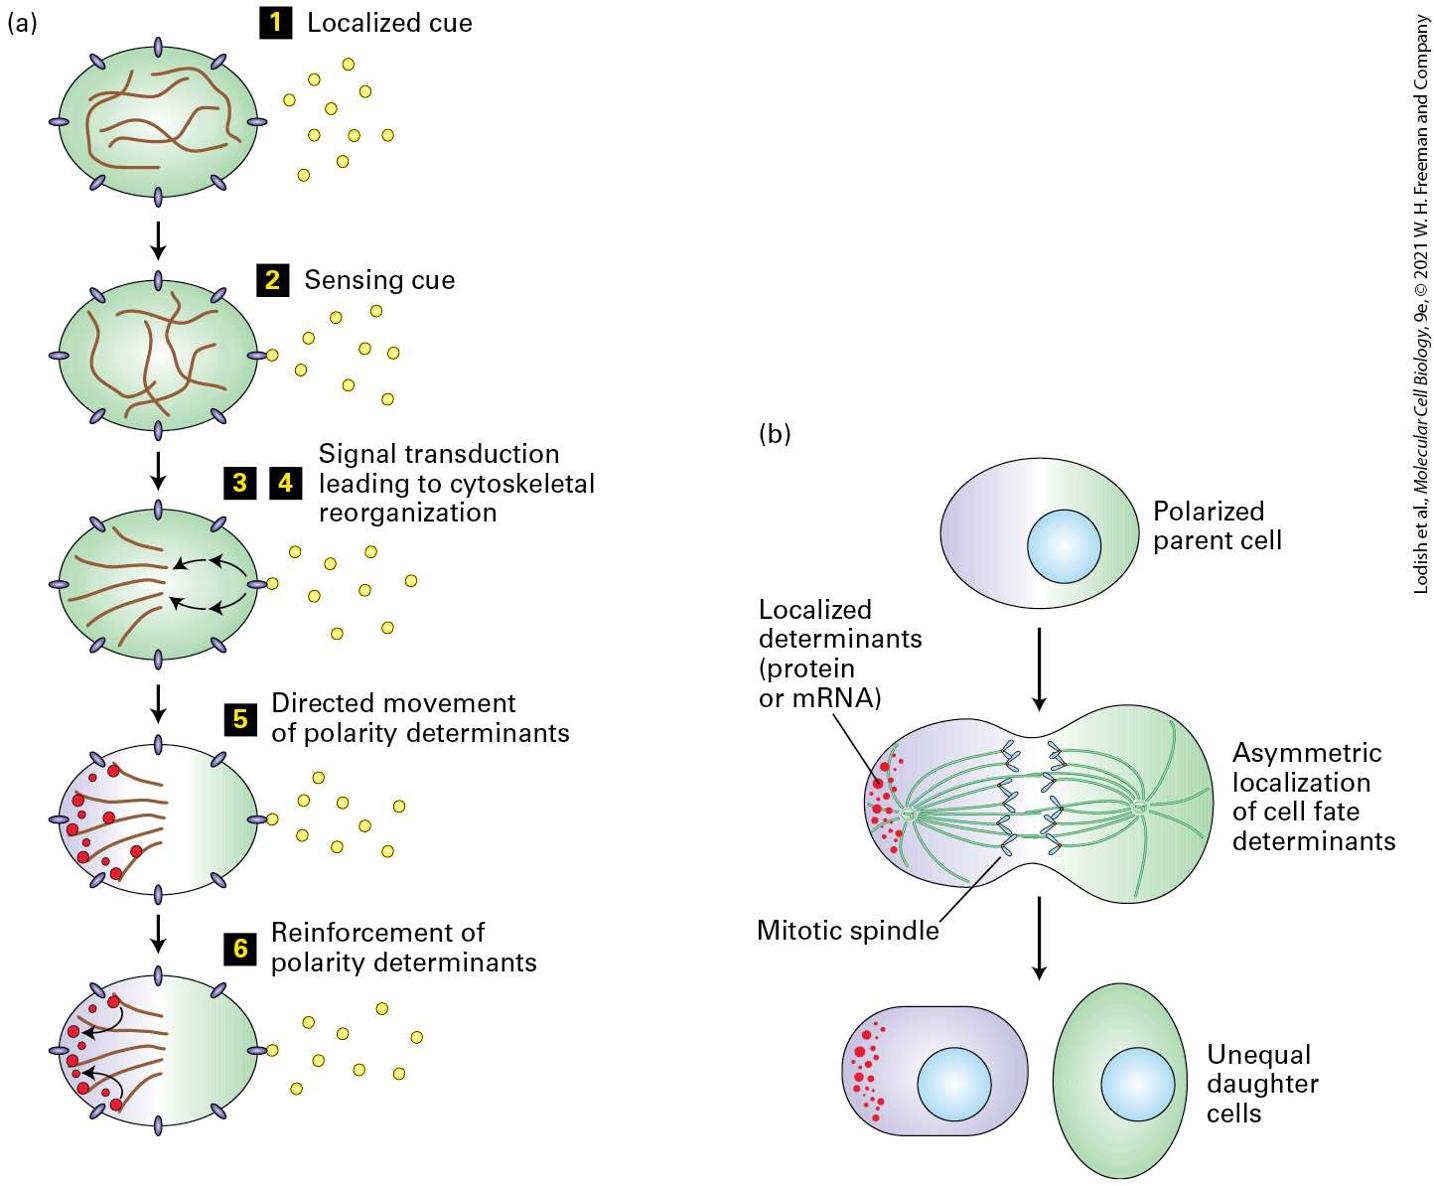
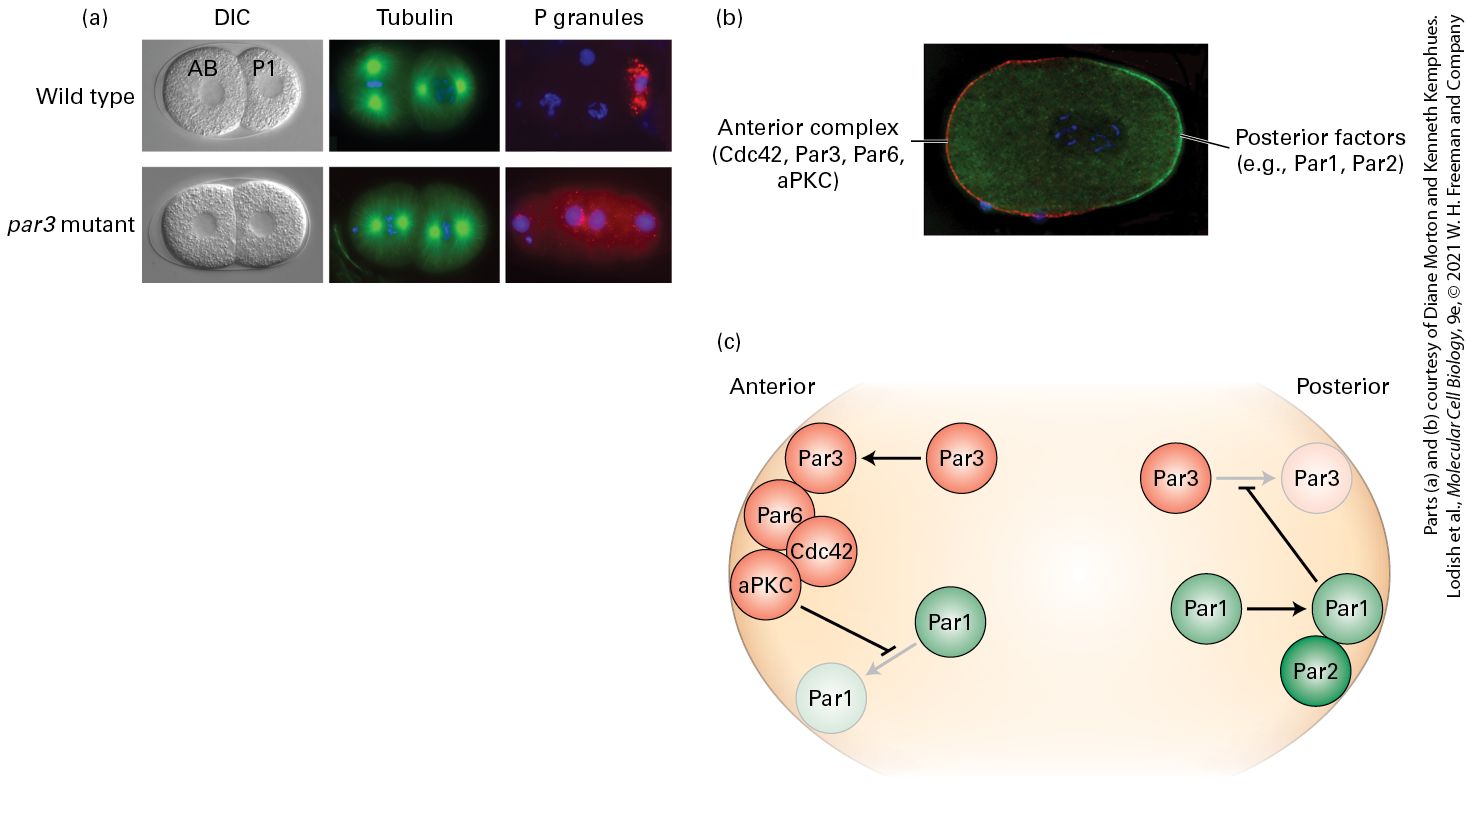
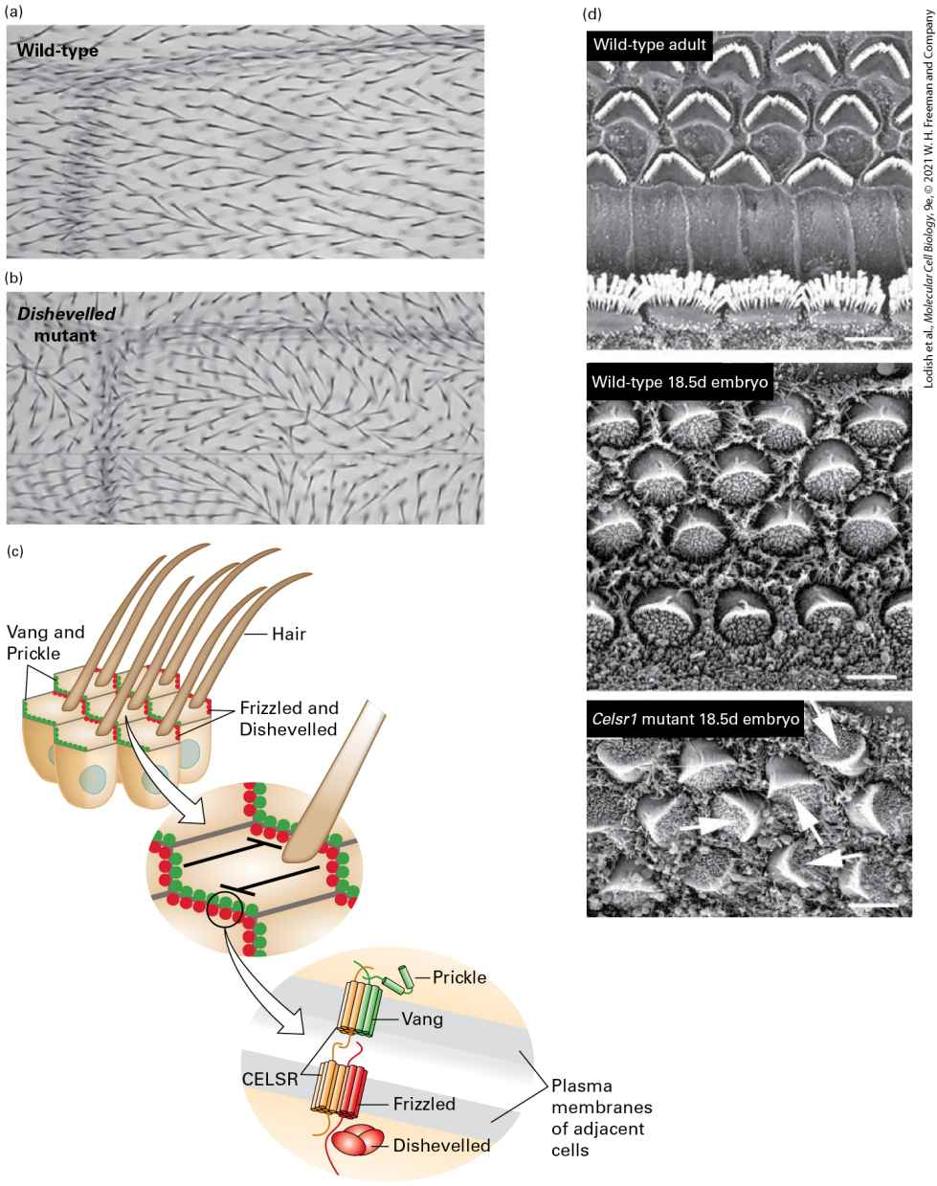
stem cells in animals and plants undergo asymmetric divisions in which one of the daughter cells is a stem cell; thus the numbers of stem cells can remain constant or can increase during the early stages of the organism’s life. Many cells have life spans much shorter than that of the organism as a whole and so need to be constantly replaced. In mammals, for instance, cells lining the intestine and phagocytic macrophages live for only a few days. Stem cells are therefore important not only during development but also for replacement of worn-out cells in adult organisms. However, the numbers of certain stem cells often decreases as the organism ages, limiting their ability to replace certain outworn cells or tissues. The zygote is totipotent in that it has the capacity to generate every cell type in the body as well as the supportive placental cells that are required for embryonic development, but because the zygote does not self-renew (make more of itself), it is not considered a stem cell. We have already mentioned that the diversity of cell types in an animal requires asymmetric cell divisions in which the compositions and fates of the two daughter cells differ. This process requires the parent cell to become asymmetric, or polarized, before cell division, so that the cell contents are unequally distributed between the two daughters. This process of polarization is critical not only during development but also for the function of many types of differentiated cells. For example, transporting epithelial cells, such as those that line the intestine, are polarized, with their free apical surface facing the lumen to absorb nutrients and their basolateral surface contacting the extracellular matrix to transport nutrients toward the blood (see Figures 11-30 and 20-1). Other examples
include cells that migrate up a chemotactic gradient (see Figure 18-54) and neurons, which have multiple dendrites extending from one side of the cell body that receive signals and a single axon extending from the other side that transmits signals to target cells (see Chapter 23). Thus the mechanisms that cells use to polarize are important and general aspects of their function. Not surprisingly, these mechanisms integrate elements of cell signaling pathways (see Chapters 15 and 16), cytoskeletal reorganization (see Chapters 17 and 18), and membrane trafficking (see
Chapter 14). In the third section of this chapter, we discuss how cells become polarized as well as the mechanism of asymmetric cell division for maintaining stem cells and generating differentiated cells. Death — of both organisms and the cells within them — is an essential part of life; without carefully regulated death, there could not be life. In the last section of this chapter, we discuss the regulation of cell death, termed programmed cell death. We learn that apoptosis, one type of evolutionarily conserved programmed cell death, is absolutely crucial for the formation and maintenance of many tissues (see Figure 22-1c). We also learn about a second type of programmed cell death, necroptosis, that vertebrates employ to kill virus-infected cells and thus block the spread of infection. Cells also die from environmental stresses or because they are no longer needed by the organism. Precise genetic regulatory systems, each with checks and balances, control cell death — just as other genetic programs control cell division and differentiation. These aspects of cell biology — cell birth, the establishment of cell polarity, and programmed cell death — converge with developmental
biology, and they are among the most important processes regulated by the signaling pathways discussed in earlier chapters.
Fertilization Unifies the Genome
22.1 Early Mammalian Development, Embryonic Stem Cells, and Induced Pluripotent Stem Cells Fertilization Unifies the Genome It is remarkable that a mammalian sperm is ever able to reach and insert its nucleus into an egg; in humans, each sperm is competing with more than 100 million others for a single oocyte. After the first sperm succeeds in fusing its membrane with the oocyte membrane, a flux of calcium flows into the oocyte cytosol, spreading outward from the site of sperm binding. As in other regulated secretory pathways, one of the effects of the rise in calcium is to trigger fusion of vesicles located just under the plasma membrane of the egg, called cortical granules, with the plasma membrane, releasing their contents to the outside of the plasma membrane and forming a shielding fertilization membrane that blocks other sperm from binding to the egg. Finally the sperm nucleus enters the egg cytoplasm, and the egg and sperm nuclei fuse to create the diploid zygote nucleus. Oocytes contain multiple mitochondria, and in mammals and many other species inheritance of mitochondrial DNA is exclusively maternal; little if
Cleavage of the Mammalian Embryo Leads to the First Differentiation Events
any sperm mitochondrial DNA enters the oocyte (see Chapter 12). Femalespecific mitochondrial DNA inheritance has been used to trace maternal heritage in human history, for example, to follow early humans from their origins in Africa. The egg cytoplasm is also packed with maternal mRNA: transcripts of genes whose products are essential for the earliest stages of development. There is little or no transcription during oocyte meiosis and the first embryonic cleavages, so during this time the oocyte’s mRNA is crucial for protein production. Cleavage of the Mammalian Embryo Leads to the First Differentiation Events The fertilized egg, or zygote, does not remain a single cell for long. Fertilization is quickly followed by cleavage, a series of cell divisions that take about one day each (Figure 22-2); these divisions happen before the embryo is implanted in the uterine wall. Initially, the cells are fairly spherical and loosely attached to one another. As demonstrated experimentally, each cell at the eight-cell stage is totipotent and has the potential to give rise to a complete animal when implanted into the uterus of a pseudopregnant animal (one treated with hormones to make her uterus responsive to embryos). It is likely that each of the cells in eight-cell human and other mammalian embryos are also totipotent and that totipotency is lost during later cleavages, though the timing may be different from that of a mouse embryo.
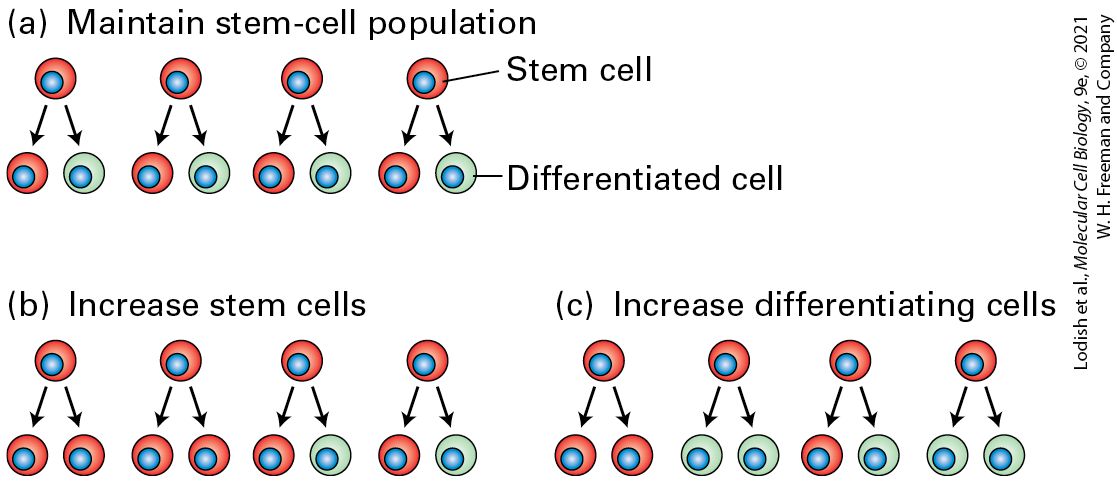
FIGURE 22-2 Early cleavage divisions in the mouse embryo. There is little cell growth during these early divisions, so the cells become progressively smaller. See text for discussion. The eight-cell embryo undergoes compaction — a process that depends in part on induction of the cell-surface homotypic cell-adhesion protein Ecadherin (see Figure 20-14) that both causes substantial increases in the affinities of the blastomere cells for one another and polarizes the cells. Three days after fertilization, the eight-cell embryo divides to form the 16-cell morula (from the Greek for “raspberry”; see Figure 22-2); during this division one of the daughters of each blastomere ends up in an internal position of the 16-cell embryo whereas the other remains on the surface. The outer cells of the 16-cell embryo are fated to become the trophectoderm (TE) of the later 64-cell stage termed the blastocyst (see Figures 22-2 and 22-3) and will form extraembryonic tissues such as the placenta. The inner cells of the 16-cell embryo are fated to become the inner cell mass (ICM) of the blastocyst (just 10–15 cells in a mouse), which gives rise to the embryo proper (Figure 22-3). During these divisions, fluid flows into an internal cavity called the blastocoel.
FIGURE 22-3 Schematic representation of mouse and human pre- and postimplantation embryos and the stem-cell lines that can be derived from them. In both mice and humans, a four-cell embryo normally develops into a blastocyst consisting of trophectoderm (TE) cells on the outside and inner cell mass (ICM) cells inside (see Figure 22-2); the ICM gives rise to cells that will form the extraembryonic primitive endoderm (PE) and the remaining cells differentiate into epiblast cells that will give rise to the embryo proper. After implantation into the wall of the uterus the detailed development of the mouse and human embryo differ, but in both cases the epiblast cells form the embryo proper; these cells and the earlier ICM cells can form embryonic stem cells when placed in culture. The extraembryonic cells form part of the placenta together with cells from the uterine wall. Extraembryonic tissues are shown in different shades of teal and epiblast derivatives in pink. [Information from M. N. Shahbazi, E. D. Siggia, and M. Zernicka-Goetz, 2019, Science 364:948.] Description
In the illustration, at left is a circle with a four-cell embryo represented by 4 gray spheres. Sideward arrows point to an oval made of cells that are labeled trophectoderm. The lower inside of this oval is labeled blastocoel. A blue line of cells moving across this oval is labeled primitive endoderm. Above this oval is a group of several pink cells with the label: mouse and human naive embryonic stem cells. Below this diagram are two labels; E 4.5 mouse blastocyst and E 6.0 human blastocyst. Two arrows move to the upper and lower right and are both labeled implantation. The upper arrow points to a structure labeled E 5.5 post-implantation mouse embryo. The proamniotic cavity and epiblast are labeled on this oval shape. The lower arrow points to a structure labeled E 10 post-implantation human embryo. This one is wider and more detailed oval with a centerline across it labeled epiblast. The amnion and amniotic cavity are labeled at the top, and a yolk sac is labeled at the bottom of this oval. Arrows from both embryos converge to another group of pink cells labeled Mouse Epi S C s and human embryonic stem cells. In the blastocyst, the ICM is found on one side of the blastocoel, while the TE cells form a hollow ball around the ICM and blastocoel. At this point, the TE cells are in an epithelial sheet, while the ICM cells are a loose mass that can be described as mesenchyme. Mesenchyme, a term most commonly applied to mesoderm-derived cells, refers to loosely organized and loosely attached cells. The fate of a cell in the early embryo — TE or ICM — is determined by the cell’s location. If a labeled cell is placed on the outside of a very early embryo, it is likely to form extraembryonic tissues, while a cell placed inside an embryo is likely to form embryonic tissues. Both ICM and TE cells are stem cells: each starts its own distinct lineage and divides prolifically to produce diverse populations of cells. Gene expression measurements of each stage of early development show dramatic changes in which genes are expressed in ICM and TC cells and their descendants. Even these very early embryos use Wnt, Notch, and TGF-β signals to regulate gene expression (see Chapter 16).
Pluripotent Cells of the Inner Cell Mass Are the Source of ES Cells
Pluripotent Cells of the Inner Cell Mass Are the Source of ES Cells ES cells can be isolated from the inner cell mass of early mammalian embryos and grown indefinitely in culture when attached to a feeder-cell layer that provides certain essential growth factors (Figure 22-4a). As mentioned in the chapter introduction, cultured ES cells are pluripotent: they can differentiate into a wide range of cell types of the three primary germ layers, either in culture or after reinsertion into a host embryo. More specifically, mouse ES cells can be injected into the blastocoel of an early mouse embryo and the cell aggregate surgically transplanted into the uterus of a pseudopregnant female. The injected ES cells will participate in forming most, if not all, tissues of the resultant chimeric mice. Furthermore, the injected ES cells will often give rise to functional sperm and eggs that, in turn, can generate normal live mice.
EXPERIMENTAL FIGURE 22-4 ES cells can be maintained in culture and can form differentiated cell types. (a) Human or mouse blastocysts are grown from cleavage-stage embryos produced by in vitro fertilization. The ICM or the developmentally later epiblast (see Figure 22-3) is separated from the surrounding extraembryonic tissues and plated onto a layer of fibroblast cells, which help to nourish the embryonic cells by providing specific growth factors. When individual cells are replated, they form colonies of ES cells, which can be maintained for many generations and can be stored frozen. ES cells can also be cultured without a fibroblast feeder layer if specific cytokines are added; leukemia inhibitory factor (LIF), for instance, supports growth of mouse ES cells by triggering activation of the Stat3 transcription factor; see J. S. Odorico et al., 2001, Stem Cells 19:193. (b) Embryonic stem cells allowed to differentiate in suspension culture form multicellular aggregates termed embryoid bodies. (c) Hematoxylin- and eosin-stained sections of embryoid bodies that contain derivatives of all three germ layers formed from the ICM during embryogenesis. Arrows in the images point to the following tissue types: (left) gut
epithelium (endoderm), (middle) cartilage (mesoderm), and (right) neuroepithelial rosettes (ectoderm). Black bar = 100 μm. Description The illustration labeled (a) starts at the top with four cleavage-stage embryo cells, matures, and forms a blastocyst. The blastocyst has a group of cells at the top-labeled inner cell mass, and labels are on the center space (blastocoel) and the outer edge of the structure (trophoblast). A downward arrow shows that the inner cell mass is removed, and the cells are plated onto a dish of cultured fibroblast feeder cells. After growth, the stem cells are replated onto a new feeder cell plate, which also shows feeder cells. Finally, the embryonic stem cells are established. The micrograph labeled (b) shows several gray and black structures of embryoid bodies. In a more recent variation on these experiments, a host zygote is treated with drugs that transiently block mitosis so that it and the blastocyst it forms are tetraploid (with four copies of each chromosome), incapable of forming differentiated cells and tissues. When normal diploid ES cells are injected into such a blastocyst, all the cells in the live mice that are born after transplantation of the blastocyst aggregate derive from the donor ES cells. This finding is powerful evidence that single mouse ES cells are indeed pluripotent. Because ethical considerations and, in many countries, legal restrictions preclude similar transplantation experiments with human ES cells, formal proof that human ES are pluripotent is lacking. Importantly, both human and mouse ES cells can differentiate into a wide range of cell types in culture. When cultured in suspension, ES cells form multicellular aggregates, called embryoid bodies (Figure 22-4b), that resemble early embryos in the variety of tissues they form. When
Multiple Factors Control the Pluripotency of ES Cells
embryoid bodies are subsequently treated with various combinations of growth factors or transferred to a solid surface, they produce a variety of differentiated cell types, including gut epithelia, cartilage, and neural cells (Figure 22-4c). Under other conditions, ES cells have been induced to differentiate in culture into precursors for multiple specific cell types, including blood cells and pigmented epithelia; for this reason, ES cells have proved extremely useful in identifying the factors that commit a pluripotent cell to differentiating down a particular cell lineage. What properties give these cells of the early embryo their remarkable plasticity? As we will see in the next section, a variety of actors play a role: DNA methylation, transcription factors, chromatin regulators, and micro-RNAs all affect which genes become active. Multiple Factors Control the Pluripotency of ES Cells During the earliest stages of embryogenesis, as the zygote begins to divide, both the paternal and maternal DNA become demethylated (see the discussion of DNA methylation in Chapter 8). This happens in part because a key maintenance methyl transferase, Dnmt1, is transiently excluded from the nucleus and in part because demethylase enzymes actively remove (or “erase”) methylation marks from 5-methyl cytosine residues during early development. As a result, the pattern of DNA methylation is reset during the first few cell divisions, erasing earlier epigenetic marking of the DNA and creating conditions in which cells
have greater potential for diverse pathways of development. Mice engineered to lack Dnmt1 die as early embryos with drastically undermethylated DNA. ES cells prepared from such embryos are able to divide in culture, but in contrast to normal ES cells, cannot undergo in vitro differentiation. ES cell properties are also critically dependent on the action of master transcription factors produced shortly after fertilization. The transcription factors Oct4, Sox2, and Nanog have essential roles in early development and are required for the specification of ICM cells in the embryo as well as for the specification of ES cells in culture. The expression of Oct4 and Nanog is exclusive to pluripotent cells such as the cells of the ICM and cultured ES cells. Sox2 is expressed in pluripotent cells, but its expression is also necessary in the multipotent neural stem cells that give rise exclusively to neuronal and glial cell types (discussed in Chapter 23). Genetic studies in mice suggest that these three regulators have distinct roles but function in related pathways to maintain the developmental potential of pluripotent cells. For example, disruption of Oct4 or Sox2 results in the inappropriate differentiation of ICM and ES cells into trophectoderm. Thus knowledge of the set of genes regulated by these transcription factors might reveal their essential roles during development. The genes that are bound by these three transcription factors have been identified using chromatin immunoprecipitation experiments (see Chapter 8); each protein is found at more than a thousand chromosomal locations. The target genes encode a wide variety of proteins, including the Oct4, Nanog, and Sox2 proteins themselves, forming an autoregulatory loop in
which each of these three transcription factors induces its own expression as well as that of the others (Figure 22-5). These transcription factors also bind to the transcription-control regions of many genes encoding proteins and micro-RNAs important for the proliferation and self-renewal of ES cells.
FIGURE 22-5 Basic transcriptional network regulating pluripotency of ES cells. The master transcription factors Oct4 and Sox2 form a dimer, and each of the three transcription factors, Oct4, Sox2, and Nanog, binds to its own promoter as well as to the promoters of the other two (black lines), forming a positive autoregulatory loop that activates transcription of each of these three genes. These transcription factors also bind to the transcription-control regions of many active genes encoding proteins and micro-RNAs important for the proliferation and self-renewal of ES cells as well as to those of many genes that are silenced in undifferentiated ES cells and that encode proteins and micro-RNAs essential for the formation of many differentiated cell types (magenta lines). See M. Li and J. C. Izpisua Belmonte, 2018, Nat. Cell Biol. 20:382. Description The O c t 4 gene (top rectangle in the list of genes) codes the O c t 4 protein (top oval in the list of proteins); S o x 2 (middle rectangle), the S o x 2 protein (middle oval); and
Nano g (bottom rectangle), the Nano g protein (bottom oval). All of these proteins show arrows that feedback to the genes. All of these proteins also have arrows pointing to these actions: Activate genes for self-renewal and induce pluripotency and repress genes that induce specific differentiation pathways. Several protein hormones are provided by feeder cells or added to culture media to prevent differentiation of ES cells. These hormones include leukemia inhibitory factor (LIF), which activates Stat3; Wnt, which activates the β-catenin transcription factor; and bone morphogenetic protein 4 (BMP4), which activates the Smad1 transcription factor (see
Chapter 16). In ES cells, these three transcription factors bind at multiple genomic sites co-occupied by Oct4, Nanog, and Sox2 proteins. Thus signaling pathways activated by cell-surface receptors are directly coupled to regulation of genes in the core pluripotency circuitry; this observation reinforces a point made in Chapter 16 that transcription factors activated by cell-surface receptors frequently bind at sites in the genome occupied by master transcription factors specific to that type of cell. Chromatin regulators that control gene transcription (see Chapter 8) are also important in ES cells. In Drosophila, Polycomb group proteins form complexes to maintain gene repression states that have been previously established by DNA-binding transcription factors. Two mammalian protein complexes related to the fly Polycomb proteins, PRC1 and PRC2 (see Figure 8-48), are abundant in ES cells. Early mouse embryos lacking components of PRC2 display early developmental defects. The PRC2 complex acts by adding methyl groups to lysine 27 of histone H3, thus altering chromatin structure to repress genes. (Note that the methylation
here is on an amino acid in a protein, a type of regulation distinct from the methylation of cytosine residues in DNA.) In ES cells, PRC1 and PRC2 both silence genes whose encoded proteins or micro-RNAs (miRNAs) would otherwise induce differentiation into particular types of cells; the Polycomb proteins also maintain these genes in an epigenetic preactivation state such that they are poised to become activated later as part of the proper execution of specific developmental gene expression programs. Thus ES cells lacking PRC2 functions fail to differentiate properly. Many other regulators play important roles in controlling gene expression and maintaining pluripotency during very early development. For example, the gene encoding the miRNA let-7 is transcribed in ES cells, but the precursor RNA transcript is not cleaved to form the mature, functional miRNA. ES cells express a developmentally regulated RNA-binding protein termed Lin28 that binds to the let-7 precursor RNA and prevents its cleavage. Let-7 is essential for differentiation of ES cells, and experimental expression of mature let-7 miRNA in ES cells blocks their ability to undergo self-renewal. Thus repression of let-7 processing by Lin28 is essential for pluripotency. As we will see later in this section, the possibility of using embryonic stem cells therapeutically to restore or replace damaged tissue is fueling much research on how to induce them to differentiate into specific cell types. Apart from their possible benefit in treating disease, ES cells have already proved invaluable for producing mouse mutants useful in studying a wide range of diseases, developmental mechanisms, behavior, and
Animal Cloning Shows That Epigenetic Changes During Differentiation Can Be Reversed
physiology. Using the recombinant DNA techniques described in Chapter 6, one can eliminate or modify the function of a specific gene in ES cells. The mutated ES cells can then be employed to produce mice with a gene knockout or modification (see Figure 6-40). Analysis of the effects of deleting or modifying a gene in this way often provides clues about the normal function of the gene and its encoded protein. Animal Cloning Shows That Epigenetic Changes During Differentiation Can Be Reversed Although different cell types may transcribe different parts of the genome, for the most part the genome is identical in all cells. Segments of the genome are rearranged and lost during development of the T and B lymphocytes of the immune system from hematopoietic precursors (see
Chapter 24), but most somatic cells appear to have an intact genome, equivalent to that in the germ line. Evidence that at least some somatic cells have a complete and functional genome comes from the successful production of cloned animals by nuclear transfer. In this procedure, often called somatic-cell nuclear transfer (SCNT), the nucleus of an adult somatic cell is introduced into an egg whose nucleus has been removed; the manipulated egg, which contains the diploid number of chromosomes and is equivalent to a zygote, is then implanted into a foster mother. Outside of the few genes in mitochondrial DNAs that remain in the egg, the only source of genetic information to guide development of the embryo is the nuclear genome of the donor somatic cell. The low
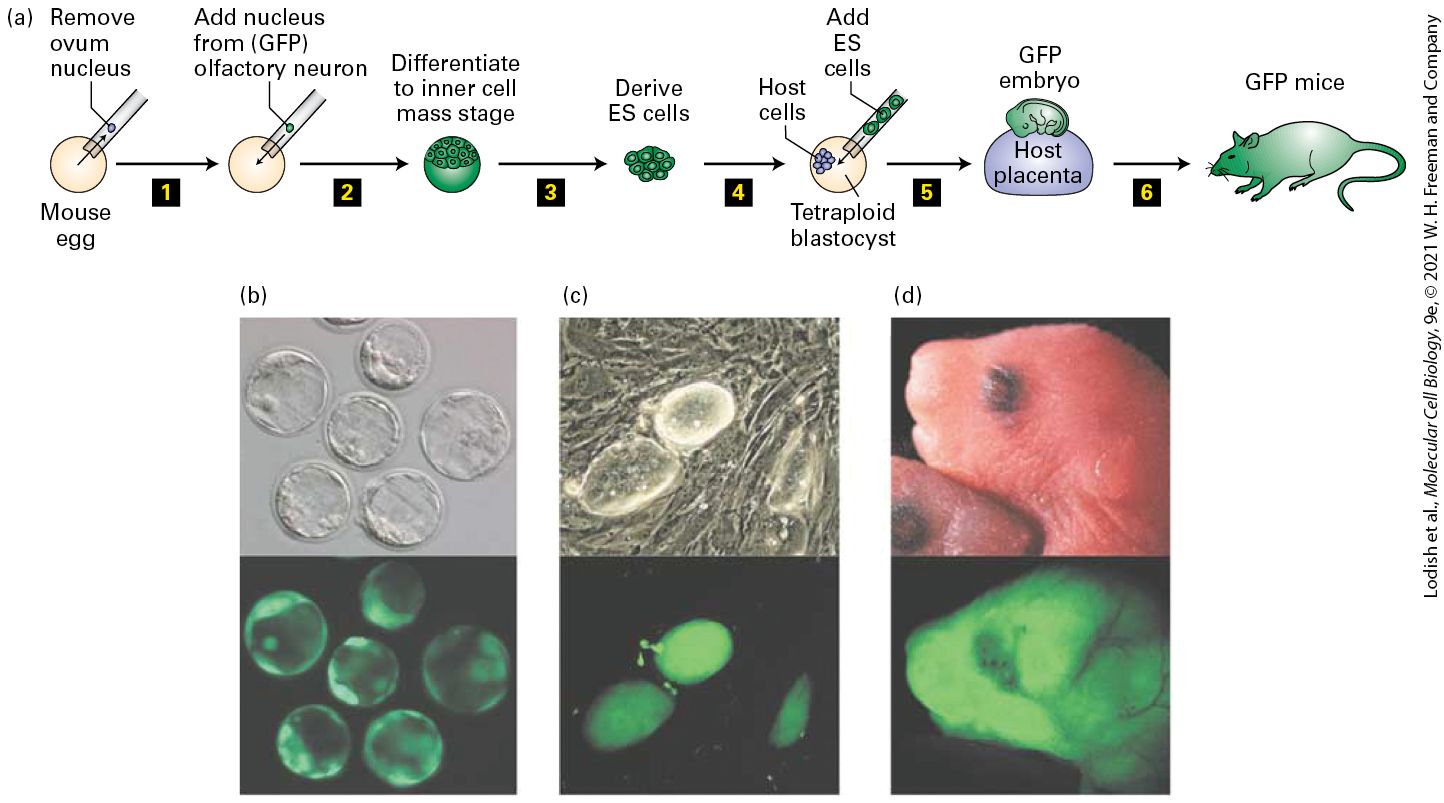
efficiency of generating cloned animals by SCNT, combined with a high frequency of diseases such as obesity in the animals that are cloned, however, raises questions about how many adult somatic cells do in fact have a complete functional genome and whether those that do can be completely reprogrammed into a pluripotent undifferentiated state. Even the successes, such as the famous cloned sheep “Dolly,” have some medical problems. If differentiated cells do have a physically complete genome, clearly only parts of it are transcriptionally active (see Chapter 8). A cell could, for example, have an intact genome, but be unable to properly reactivate specific genes due to inherited chromatin epigenetic states. Further evidence that the genome of a differentiated cell can revert to having the full developmental potential characteristic of an ES cell comes from experiments in which olfactory sensory neurons — postmitotic cells that normally will not divide again — were genetically marked with green fluorescence protein (GFP) and then used as donors of nuclei (Figure 226). When the nuclei from differentiated olfactory sensory neurons were implanted into enucleated mouse oocytes, a small fraction of them developed into blastocysts that produced GFP. The blastocysts were used to derive ES cell lines, which were then injected into tetraploid blastocysts. These manipulated embryos, derived entirely from olfactory sensory neuron genomes, formed healthy mice in which all cells expressed the GFP. Thus, at least in some cases, the genome of a terminally differentiated cell can be reprogrammed completely to form all tissues of a mouse.
EXPERIMENTAL FIGURE 22-6 Mice can be cloned by somatic-cell nuclear transfer from olfactory neurons. (a) Procedure for generating cloned ES cell lines using nuclei from olfactory sensory neurons and using them to generate cloned mice. Step 1 : A nucleus from an olfactory sensory neuron isolated from a mouse that expresses green fluorescent protein (GFP) only in its olfactory neurons was used to replace the nucleus of a mouse egg. Step 2 : The resultant zygote was cultured to the blastocyst stage. Step 3 : The ICM cells, all of which were clones of the original olfactory sensory neuron, and all of which expressed GFP, were used to generate lines of ES cells. Step 4 : These ES cells were injected into a tetraploid blastocyst. Step 5 : When the blastocyst was transplanted into the uterus of a pseudopregnant mouse, the tetraploid cells from the host blastocyst could form the placenta (violet), but not the embryo proper. Step 6 : Therefore, all of cells in the embryo proper and in the mouse that developed from it expressed GFP. (b–c) Bright-field (top) and fluorescence images (bottom) of (b) nuclear-transfer blastocysts and (c) the ES cells that were isolated from the ICM. (d) A control 12-hour-old mouse (top) and a mouse cloned from an olfactory sensory neuron, all of whose cells expressed GFP (bottom). [Parts (b–d) reprinted with permission from Nature Publishing Group, from K. Eggan et al., 2004, “Mice Cloned from Olfactory Sensory Neurons,” Nature 428(6978):44–49; permission conveyed through Copyright Clearance Center, Inc.] Description
Somatic Cells Can Generate iPS Cells
In the illustration labeled (a) the following steps are presented from left to right: (1) Remove ovum nucleus (Diagram of a circle representing mouse egg and needle removing nucleus), (2) Add nucleus from (G F P) olfactory neuron. (3) Differentiate to inner cell mass stage (A group of cells is at top of circle structure.) (4) Derive E S cells (just shows the group of cells.) (5) Add E S cells (E S cells are in the needle, transferred into tetraploid blastocyst with host cells.) (6) G F P embryo is in the host placenta. A structure labeled host placenta has an embryo on top of it. A drawing of a mouse is labeled G F P mice. In micrographs labeled (b), the top and bottom micrographs show 6 circular cells. In the top, the bright field micrograph shows gray cells with very dim details. In the bottom, the fluorescence micrograph shows the cells in detail. In micrographs labeled (c), the top and bottom micrographs show two large oval cells and one small one. The top bright field micrograph shows gray cells with gray details behind them, and the bottom fluorescence micrograph just shows the cells in green fluorescence. In the illustration labeled (d), the top photo shows a mouse embryo head with eyes, and the bottom micrograph shows the same mouse with green fluorescence. Somatic Cells Can Generate iPS Cells Because of the inefficiency of SCNT, it remained unclear whether all types of somatic mammalian cells retained an intact genome and whether they could be induced to dedifferentiate into an ES cell–like state. Shinya Yamanaka, who won the 2012 Nobel Prize for this research, used retrovirus vectors to express a wide variety of transcription factors, singly and in combination, in cultured fibroblast cells. Remarkably, he found that both human and mouse fibroblasts could be reprogrammed to a pluripotent state, called an induced pluripotent stem-cell state, similar to that of an ES cell, by transformation with retroviruses encoding just four proteins: KLF4, Sox2, Oct4, and Myc. Note that two of these, Sox2 and Oct4, are two of the master transcription factors expressed in ES cells, as discussed
previously. In addition to fibroblasts, keratinocytes (skin-forming cells) and other types of differentiated cells have been reprogrammed to iPS cells. Like ES cells, single mouse iPS cells can be experimentally introduced into a blastocyst and form all of the tissues of a mouse, including germ cells, attesting to the fact that somatic cells can indeed be reprogrammed to an embryonic pluripotent state. Several other transcription factors, and even certain small organic molecules, can replace the Oct4 gene in the Yamanaka reprogramming cocktail. Subsequent analysis led to the discovery that each of these factors directly activates transcription of the endogenous (cellular) Oct4 gene, leading to induction of pluripotency. Thus it was hypothesized that, over time, forced expression of transcription-factor genes activates expression of many cellular genes, including those encoding Oct4 and other pluripotency proteins; over the course of several weeks, this activation reprograms at least some of the somatic cells to an ES-like state. To experimentally establish the point that activation of endogenous genes leads to reprogramming to an ES-like state, cultured keratinocytes were repeatedly transfected with synthetic mRNAs encoding the four canonical Yamanaka transcription factors, KLF4, Sox2, Oct4, and Myc. These cultured cells generated normal iPS cells that had no trace of any of the exogenously added mRNAs, attesting to the reprogramming of keratinocytes into iPS cells by inducing expression of only normal cellular genes. In fibroblasts, the chromatin of most pluripotency-associated genes is inaccessible to transcription-factor binding, primarily due to the
Patient-Specific iPS Cells Can Be Used to Develop Potential Treatments for Many Diseases
repressive histone H3 lysine 9 trimethylation mark. Among the genes activated by Oct4 are two that encode H3K9 demethylases, which remove these repressive chromatin marks and, over time, result in activation of pluripotency genes. Consistent with this notion, expression of these H3K9 demethylases increases during reprogramming, and their knockdown inhibits efficient iPS-cell generation. Indeed, reprogramming involves other major changes in epigenetic modifications as well, including DNA methylation and several other types of histone modifications that serve to repress or allow potential activation of hundreds of genes. Among the genes up-regulated during reprogramming is LIN28. As discussed above, LIN28 promotes pluripotency by blocking biogenesis of members of the let-7 family of micro-RNAs. Expression of telomerase (see Figure 7-40) is also induced during reprogramming; telomerase restores the normal length of telomeres that are shortened during the many rounds of cell divisions required for certain types of differentiated cells to form. Cellular reprogramming to pluripotency is also accompanied by a rewiring of metabolic pathways: a metabolic shift from a highly respiratory metabolism characteristic of most types of differentiated cells, which depend on mitochondria for ATP production, to a highly glycolytic carbon flux characteristic of ICM cells in a normal embryo. Patient-Specific iPS Cells Can Be Used to Develop Potential Treatments for Many Diseases
Because iPS cells can be derived from somatic cells of patients with difficult-to-understand diseases, they have already proved invaluable in uncovering the molecular and cellular basis of several afflictions (Figure 22-7). Consider amyotrophic lateral sclerosis (ALS), often called Lou Gehrig’s disease, a fatal disease in which the motor neurons that connect the spinal cord to the muscles of the body progressively die off, causing muscle weakness and death, limb paralysis, and ultimately death due to respiratory failure. There is no cure.
FIGURE 22-7 Medical applications of iPS cells. In this example, the patient has a neurodegenerative disorder caused by abnormalities in certain nerve cells (neurons). Patient-specific iPS cells — in this case derived by recombinant expression of the four Yamanaka transcription factors in cells isolated from a skin biopsy — can be used in one of two ways. In cases in which the disease-causing mutation is known (e.g., familial Parkinson’s disease), gene targeting could be used to repair the DNA sequence (right). The gene-corrected patient-specific iPS cells would then undergo directed differentiation into the affected neuronal subtype (e.g., midbrain dopaminergic neurons) and be transplanted into the patient’s brain (to engraft the nigrostriatal axis). Alternatively, directed differentiation of the patient-specific iPS cells into the affected neuronal subtype (left) will allow the patient’s disease to be modeled in vitro, and potential drugs can be screened, aiding in the discovery of novel therapeutic compounds. [Information from D. A. Robinton and G. Q. Daley, 2012, Nature 481:295.] Description In the illustration, a drawing of a person has an arrow pointing downward to a petri dish that contains the skin biopsy. Four circles labeled M Y C, O C T 4, S O X 2, K L F 4 are in the cells. Another downward arrow points to another petri dish labeled Patientspecific I P S cells. An arrow moves upward left and is labeled In vitro differentiation and leads to a drawing of 3 nerve-like cells. Another label reads, screen for therapeutic compounds. An upward arrow from this is labeled disease-specific drugs and shows the same 3 cells. The last arrow on the left goes to the patient and is labeled treat with therapeutic compounds. Back at the bottom petri dish, another path starts with an arrow to the right labeled Repair disease-causing mutation using gene targeting and points to a Petri dish with repaired I P S cells in it. The next arrow upward is labeled in vitro differentiation and leads to 3 neuron cells labeled healthy neurons. The last arrow points to the patient and is labeled genetically matched healthy cells. In approximately 10 percent of patients, the disease is dominantly inherited (familial ALS), but in 90 percent of patients, there is no apparent genetic linkage (sporadic ALS). An analysis of the underlying causes of
ES and iPS Cells Can Generate Functional Differentiated Human Cells
the disease at a molecular and cellular level was impossible for many years because one cannot simply extract neurons or the surrounding glial cells (see Chapter 23) to analyze or culture from living humans. In several studies, iPS cells derived from the skin cells of elderly patients with these and other familial and sporadic forms of the disease were successfully differentiated in culture to form motor neurons; this success demonstrated the feasibility of leveraging the self-renewal of iPS cells to generate a potentially limitless supply of the cells specifically affected by ALS. Early studies showed that motor neurons bearing several types of ALS mutations were hyperexcitable, generating more of the electrical signals called action potentials (see Chapter 23) than normal. Using these differentiated neurons, researchers screened thousands of small organic molecules, including many approved as drugs for treatment of other unrelated diseases, for those that could reverse the abnormalities in the ALS iPS cell–derived motor neurons. Several were identified and are in clinical trials to see if they can slow or stop the devastating effects of ALS. These experiments illustrate the value of iPS and ES cells in generating cell culture models of many types of difficult-to-study human diseases that can be used to screen for drugs that could treat many as yet untreatable afflictions. ES and iPS Cells Can Generate Functional Differentiated Human Cells
Neurons and glial cells, as well as other cell types derived from human iPS cells have been implanted into mice with some promising results. Specifically, mouse stem cell–derived cardiomyocytes (heart muscle cells) can correct heart arrhythmias in mice; certain glial cells — oligodendrocytes — show promise in aiding recovery from experimental spinal injury in mice; and retinal epithelial cells can partially correct defects in mouse models of blindness. It is not yet known whether similar differentiated cells derived from human iPS cells can function when transplanted into humans. One recent advance — the generation of normal insulin-secreting β islet cells from human iPS and ES cells — shows promise for treatment of both type 1 and type 2 diabetes. Type 1 diabetes results from autoimmune destruction of pancreatic β cells, whereas the more common type 2 diabetes results from insulin resistance in liver and muscle (see Figures 21-1 and 21-2), eventually leading to dysfunction and death of β cells. Patients who receive transplants of human islets from cadavers can be made insulin independent for 5 years or longer, but this approach is limited because of the scarcity and quality of donor islets; the possibility of an unlimited supply of human β cells from stem cells could potentially extend this therapy to millions of new patients. One key to this successful generation of β cells was employing successive treatment with different combinations of growth factors that stimulated iPS or ES cells to traverse the multiple steps of the normal embryonic developmental sequence by which the progeny of undifferentiated ICM cells form mature functional β cells (Figure 22-8a). The so-called SC-β
cells that resulted have a structure very similar to that of normal β islet cells, including secretory granules filled with almost crystalline insulin; they also secrete normal amounts of insulin in response to elevation of the glucose level in their culture medium. Shortly after their transplantation into mice, these cells secrete human insulin into the blood in a glucoseregulated manner. Most important, after transplantation of these cells into immunocompromised diabetic mice, their high glucose levels are lowered to normal (Figure 22-8b), indicating the potential use of these β islet cells — which can be produced in culture in essentially unlimited numbers — for the treatment of diabetes. Screening to identify new drugs that improve β cell function, survival, or proliferation can also make use of such a uniform supply of stem cell–derived β cells. As detailed in Chapter 21 (Figure 21-1), normal islets also contain α cells that secrete glucagon as well as other cell types; one goal is to generate from iPS cells islet-like cell aggregates that contain both α and β cells.
FIGURE 22-8 Production of normal insulin-secreting β islet cells from human iPS or ES cells. (a) Schematic of directed differentiation of human ES or iPS cells into insulinsecreting β islet cells. Clusters of a few hundred human ES or iPS cells were sequentially cultured in media containing the indicated growth factors for the indicated number of days to first produce definitive endoderm cells, then a series of embryonic pancreatic progenitor cells, then pancreatic endocrine progenitors, and finally stem cell–derived insulin-producing β islet cells (termed SC-β cells). Abbreviations indicate the multiple signaling molecules that are employed: Act A, activin A; CHIR, GSK3 inhibitor; KGF, keratinocyte growth factor; RA, retinoic acid; SANT1, Sonic Hedgehog pathway antagonist; LDN, a BMP type 1 receptor inhibitor; PdbU, a protein kinase C activator; Alk5i, Alk5 receptor inhibitor II; T3, triiodothyronine, a thyroid hormone; XXI, γ-secretase inhibitor; betacellulin, an EGF family member. (b) These experiments used a strain of diabetic mice with a mutation in the insulin gene as well as in several immune-system genes such that the animals did not reject transplants of human tissue. Previous work had shown that the elevated glucose levels in these mice could be restored to normal by transplantation with human pancreatic islets. In this experiment, mice were transplanted with SC-β cells (black circles) or a similar number of control pancreatic progenitor cells (white circles). At the start of the experiment, the
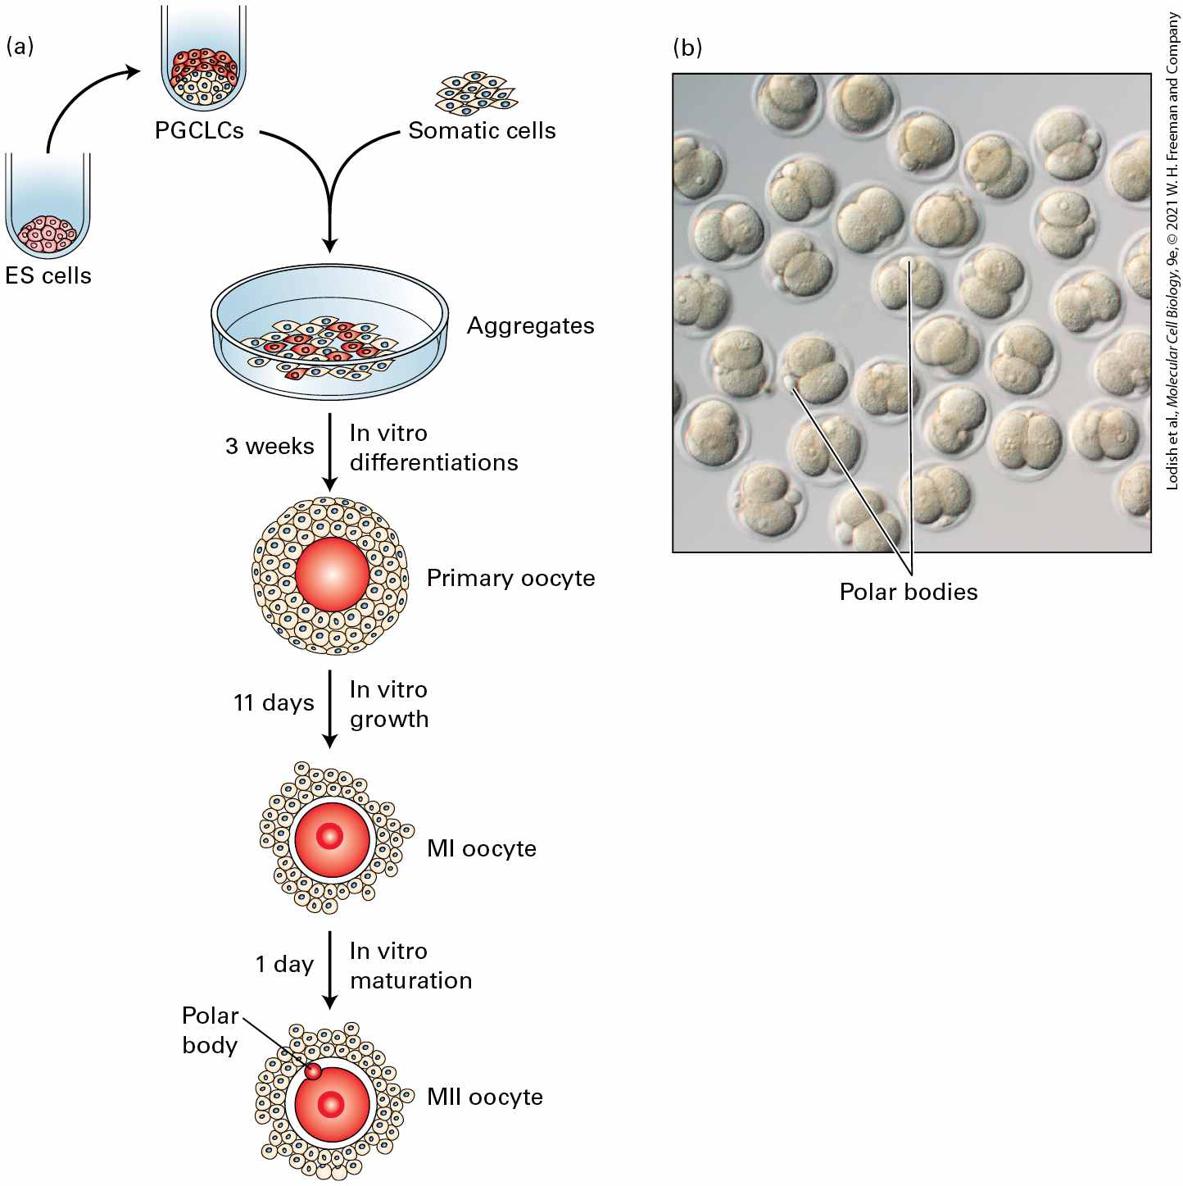
average blood glucose level in these mice was about 11 mM, well above the normal 5 mM. The average blood glucose level in the control mice rose continuously to about 30 mM, indicating severe diabetes, while in the mice transplanted with the human SC-β cells, blood glucose dropped to nearly the normal 5 mM. [Part (b) Data from F. W. Pagliuca et al., 2014, Cell 159:428.] Description In the illustration labeled (a) the first cell is labeled h P S C. A right arrow is labeled 3 days and A c t A CH I R. The second cell is labeled Definitive endoderm. A right arrow after this one is labeled 3 days and K G F. The third cell has no label. The next right arrow is labeled 2 days and K G F, R A, S A N T 1, L D N, P d b U. The fourth cell is labeled pancreatic progenitor 1. The arrow after this one is labeled 5 days and K G F, R A, S A N T 1. The fifth cell is labeled pancreatic progenitor 2. The arrow after this one is labeled 7 days and R A, S A N T 1, T 3, X X I, Betacellulin, A l k 5 i. The sixth cell is labeled endocrine progenitor. The arrow after this is labeled 7-14 days and T 3, A l k 5 i, C M R L, Supplemented. The last cell is labeled pancreatic beta cells. In the graph labeled (b), the horizontal axis represents time post-transplantation in days ranging from 0 to 112 varying increments. The vertical axis represents fasting blood glucose in millimoles ranging from 0 to 30 in increments of 10. A top line on the graph starts at 0 days and 11 millimoles, goes upward at 54 days and 30 millimoles, falls at 84 days and 28 millimoles, and goes upward again at 112 days and 29 millimoles. The lower line starts in the same place but goes down instead of up. A line starts at 0 days and 11 millimoles, goes downward at 18 days and 9 millimoles, goes upward at 28 days and 10 millimoles, and gradually goes down at 112 days and 7 millimoles. The coming years are certain to see the development of many other types of differentiated cells from human iPS cells that can be used as replacement parts for a variety of maladies. Indeed, fully functional mouse oocytes have been generated in culture from mouse ES cells and also from induced pluripotent stem cells derived from both embryonic fibroblasts and adult tail tip fibroblasts (Figure 22-9). When subjected to in vitro
fertilization with wild-type sperm, all of these in vitro–generated oocytes developed to two-cell embryos. Remarkably, several of these two-cell embryos transferred to pseudopregnant females were successfully delivered as viable pups.
FIGURE 22-9 Production of functional mouse oocytes from pluripotent stem cells. (a) A schematic of oocyte production in vitro. Female mouse ES cells were first differentiated in culture to form primordial germ cell-like cells (PGCLCs) and then cultured together with
female gonadal somatic cells isolated from a Day 12.5 mouse embryo to form primitive ovary-like aggregates. After 2–3 weeks in culture, primary oocytes had formed in which the developing oocytes were surrounded by stromal cells; many oocyte progenitors were undergoing meiosis. After further culture, mature haploid oocytes — metaphase II (MII) — had formed. (b) After the final MII stage of differentiation, in vitro–generated oocytes were subjected to in vitro fertilization with wild-type sperm; all of these in vitro–generated oocytes were fertilized and developed to two-cell embryos. Note the polar bodies, small haploid cells that are the other products of meiosis and do not have the ability to be fertilized. [Part (b) republished with permission from Springer Nature, from O. Hikabe et al., 2016, “Reconstitution In Vitro of the Entire Cycle of the Mouse Female Germ Line,” Nature 539:299–303; permission conveyed through Copyright Clearance Center, Inc.] Description In the illustration labeled (a) the top shows a test tube with cells in the bottom, labeled E S cells. An arrow points to a test tube with the cells and then darker cells on top in the tube and labeled P G C L C's. At the right, the cells are labeled somatic cells. Both the somatic cells and the P G C L C's are transferred into a petri dish labeled aggregates. A downward arrow is labeled 3 weeks and in vitro differentiations. A red circle surrounded by many cells is labeled primary oocyte. Another downward arrow is labeled 11 days and in vitro growth. A red circle with a smaller red circle in the center is surrounded by cells and labeled M 1 oocyte. A downward arrow is labeled 1 day and in vitro maturation. One more red circle is with the center circle and a smaller red circle on the edge labeled polar body. The whole drawing is labeled M 2 oocyte. The micrograph labeled (b) shows several oocytes and an arrow points out various polar bodies in the oocytes. Many important questions must be answered, however, before the feasibility of using differentiated cells or eggs derived from human ES or iPS cells for therapeutic purposes can be assessed adequately. For instance, when undifferentiated human or mouse ES or iPS cells are transplanted into an experimental mouse, they form teratomas, tumors that contains
masses of partially differentiated cell types. Thus it is essential to ensure that all of the ES or iPS cells used to generate an implant have indeed undergone differentiation and have lost their pluripotency and their ability to induce teratomas or cause other problems. Many groups are trying to generate fully functional oocytes from human ES or iPS cells as a treatment for certain types of female infertility. With the prospect of making babies from in vitro–derived oocytes on the horizon, combined with the possibility of editing the genomes of the ES cells that give rise to these oocytes, it is incumbent on society at large to grapple with the complex ethical issues at stake. Scientists and nonscientists alike should prioritize and expedite these debates. KEY CONCEPTS OF SECTION 22.1 Early Mammalian Development, Embryonic Stem Cells, and Induced Pluripotent Stem Cells In asymmetric cell division, two different types of daughter cells are formed from one parent cell. In contrast, both daughter cells formed in symmetric cell divisions are identical but may have different fates if they are exposed to different external signals (see Figure 22-1). Fusion of a haploid sperm and haploid egg nucleus generates a diploid zygote. The initial divisions of the mammalian embryo yield equivalent totipotent cells (see Figure 22-2), but subsequent divisions yield the first differentiation event, the separation of the trophectoderm from the inner cell mass (see Figure 22-3). The inner cell mass is the source of the embryo proper as well as of embryonic stem cells (ES cells). Cultured ES cells are pluripotent, capable of giving rise to all differentiated cell types of the organism with the exception of extraembryonic tissues. They are useful in the production of genetically altered mice and offer the potential for therapeutic uses. The pluripotency of ES cells is controlled by multiple factors, including the state of DNA methylation, chromatin regulators, certain micro-RNAs, and the transcription factors Oct4, Sox2, and Nanog. Animal cloning establishes that cell differentiation can be reversed.
Induced pluripotent stem (iPS) cells can be formed from somatic cells by expression of combinations of key transcription factors, including KLF4, Sox2, Oct4, and Myc. As exemplified by ALS, differentiated cells produced in culture from human iPS cells can be used to understand the underlying cause of a disease as well as to screen drugs that could be used to treat the disease. β islet cells produced in culture from human iPS cells secrete insulin normally in response to an elevation of glucose in the media and reverse the high glucose levels in diabetic mice. Fully functional mouse oocytes can be produced in culture from mouse ES and iPS cells.
Adult Planarians Contain Pluripotent Stem Cells
22.2 Stem Cells and Niches in Multicellular Organisms Many types of differentiated cells are sloughed from the body or have life spans that are shorter than that of the organism. Disease and trauma can also lead to losses of differentiated cells. Since most types of differentiated cells do not divide, they must be replenished from nearby somatic stem-cell populations. In vertebrates and most invertebrates, such stem cells, in contrast to pluripotent ES cells, are unipotent or multipotent in that they can give rise to one or several, but not all, of the cell types found in the organism. Postnatal (adult) vertebrate animals contain stem cells for many tissues, including the blood, intestines, skin, ovaries, testes, and muscle. Even some parts of the adult brain, where little cell division occurs, have populations of neuronal stem cells (see Chapter 23). In striated muscle, stem cells are most important in healing, as relatively little cell division occurs at other times. Some other cell types, such as liver cells (hepatocytes) and insulin-producing β islet cells, reproduce mainly by division of already differentiated cells, as exemplified by regeneration of the liver when large pieces are surgically removed. Adult Planarians Contain Pluripotent Stem Cells
We noted in Chapters 1 and 16 that small body segments of planaria can regenerate whole animals. Regeneration was known to require a population of proliferating stem cell–like cells, termed neoblasts, that are present throughout the adult body, but a key question was whether regeneration is accomplished, as in many animals with this capability, by the collective activity of multiple lineage-restricted stem or progenitor cells, or whether pluripotent stem cells are involved. Recent experiments showed that adult planarians contain lineage-restricted neoblasts as well as pluripotent stem cells, termed clonogenic neoblasts, or cNeoblasts. The key studies used gamma irradiation to inhibit most or all cell division in adult planarians; the treated animals could not regenerate and suffered massive tissue loss because of failed replacement of aged, differentiated cells. The few functional proliferating neoblast cells remaining after irradiation could be identified by a marker gene termed smedwi-1. Several days after irradiation, individual neoblasts formed colonies of smedwi-1positive cells that contained multiple types of differentiated body cells, and it was hypothesized that this smedwi-1-positive subpopulation of neoblasts was pluripotent (Figure 22-10). To test this hypothesis, single neoblasts were transplanted into lethally irradiated planaria that lacked all of their own neoblasts. Remarkably, several transplant recipients lived past 7 weeks and regenerated, from the single transplanted cell, neuronal, intestinal, and other differentiated cell types that were distributed throughout the body. The animals eventually regained feeding behavior and regenerated complex tissues, including eyes. These experiments indicated that at least some of the neoblast stem cells in adult planarians are indeed pluripotent, providing a cellular basis for the remarkable
Multipotent Somatic Stem Cells Give Rise to Both Stem Cells and Differentiating Cells
regenerative abilities of planarians. Despite much effort, no pluripotent stem cells have ever been reliably identified in any adult vertebrate organism. EXPERIMENTAL FIGURE 22-10 Broad differentiation potential of individual neoblasts in planarians. Planarians were subjected to subtotal irradiation, which leaves few surviving neoblasts, but one surviving neoblast grew into a colony of neoblasts in the head. (a) Neoblasts are labeled in green with an antibody to the SMEDWI-1 protein. The smedwi1 gene is specifically transcribed in neoblasts, and transcription stops when a neoblast progeny cell stops dividing and differentiates. The SMEDWI-1 protein produced in neoblasts slowly degrades during differentiation into mature cell types, but enough remains to detect the progeny of this neoblast. (b) Double-labeling with the SMEDWI-1 antibody and fluorescent in situ hybridization with RNA probes for markers for differentiated cells therefore detects newly produced differentiated cells derived from the single neoblast. Neurons are labeled in magenta with an RNA probe to the gene chat and intestine cells are labeled in blue with an RNA probe to the gene gata4/5/6. Anterior is up. See D. E. Wagner, I. E. Wang, and P. W. Reddien, 2011, Science 332:811.
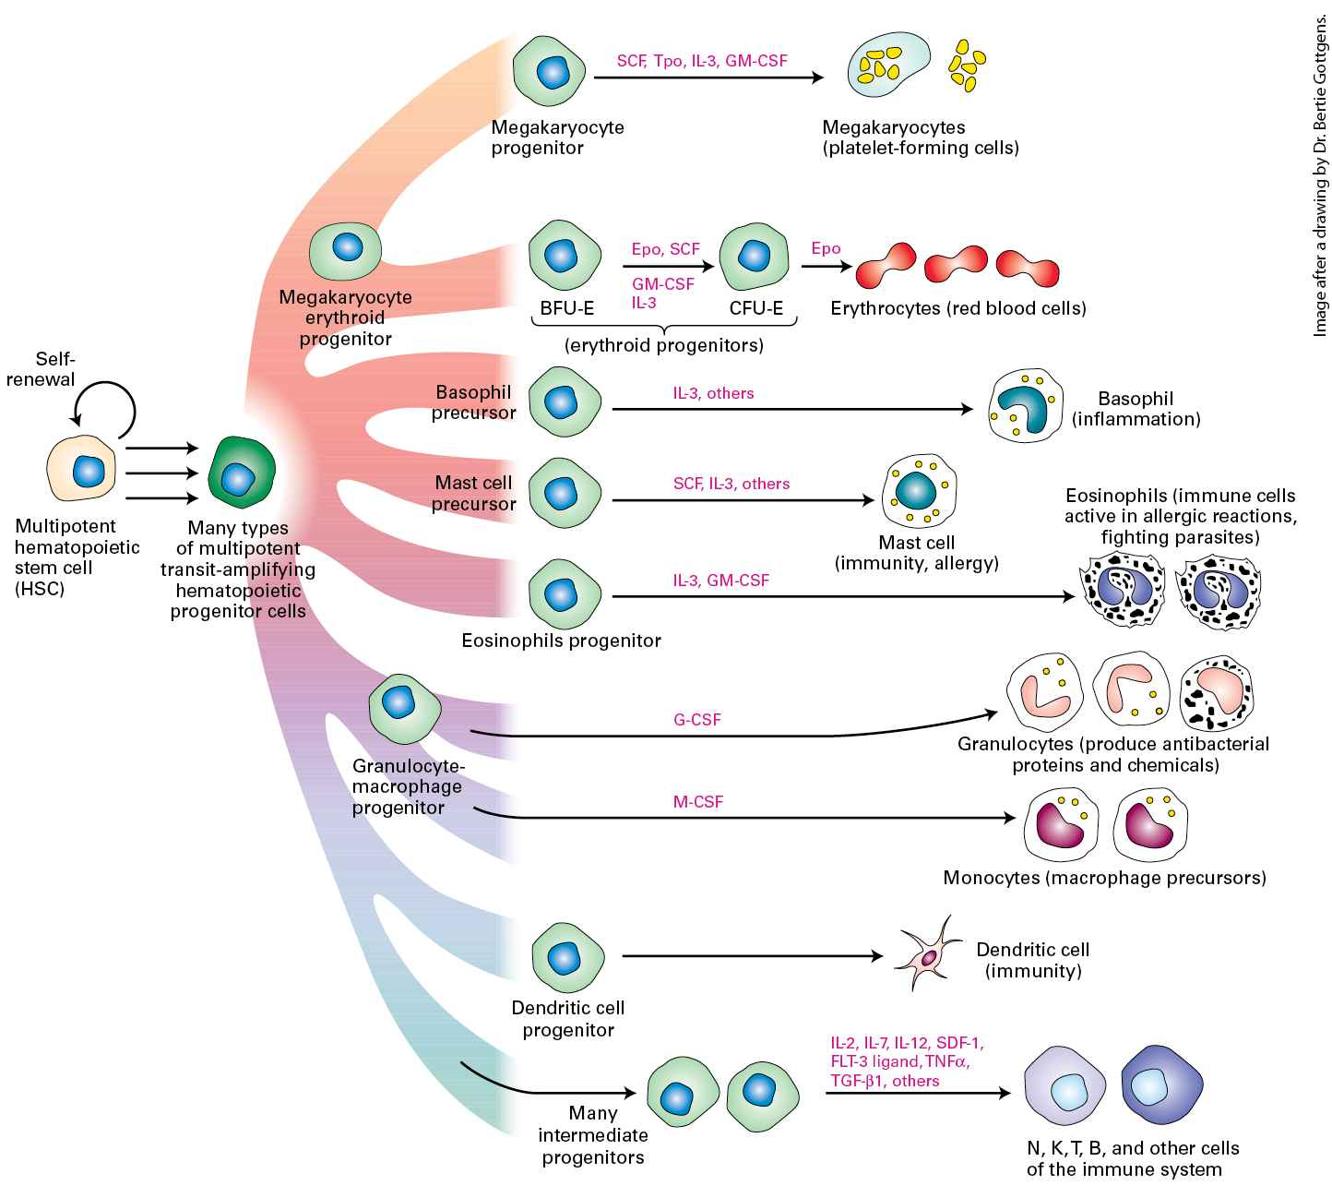
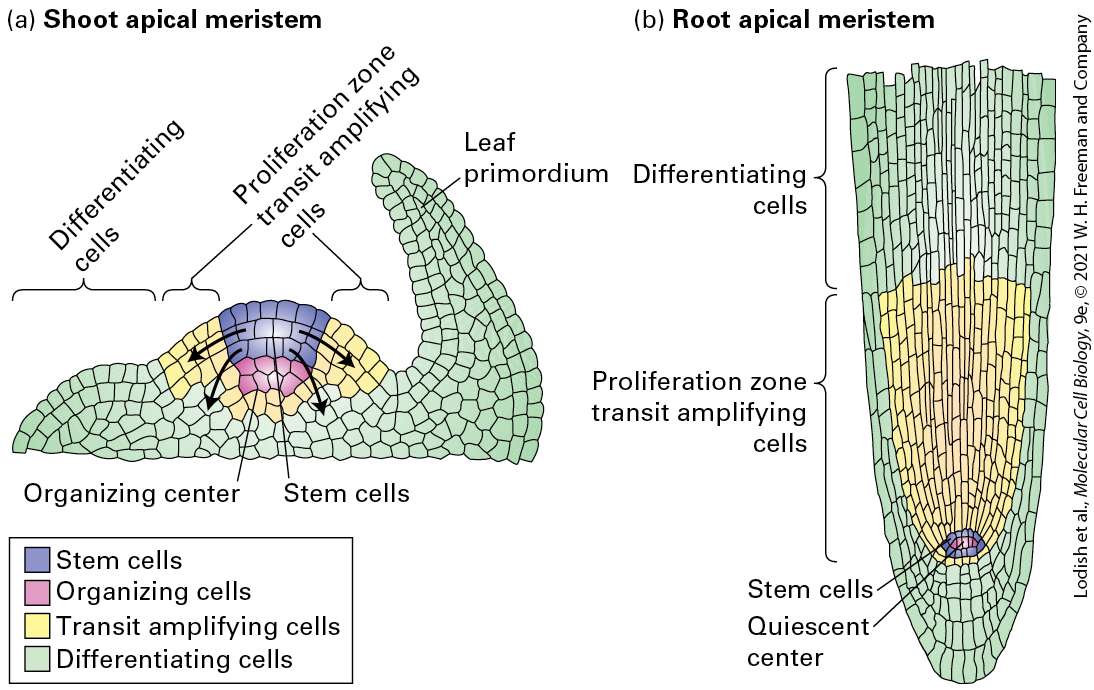
Multipotent Somatic Stem Cells Give Rise to Both Stem Cells and Differentiating Cells The most common type of stem cells in adult metazoans, multipotent somatic stem cells, give rise to the specialized cells composing body tissues. The two critical properties of these stem cells that together distinguish them from all other cells are the ability to reproduce themselves during many cell divisions (self-renewal) and the ability to generate progeny of more restricted potential. Multipotent somatic stem cells have two other key properties (Figure 22-11): 1. They can give rise to multiple types of differentiated cells. In this sense, they differ from progenitor cells (also called precursor cells), which generally give rise to only one or two types of differentiated cells. A stem cell has the capability of generating a number of different cell types, but not all cell types: it is not pluripotent like an ES cell. For instance, a multipotent hematopoietic (blood) stem cell will form more of itself plus multiple types of blood and immune cells, but never a skin or a liver cell. 2. They are stem cells in that they are undifferentiated; in general, they do not express mRNAs or proteins characteristic of the differentiated cell types formed by their descendants. Stem cells of a particular type generally appear during embryonic development and rapidly increase in number; their progeny produce the many types of differentiated cells that make up the embryo and juvenile. Once adulthood is reached, the number of stem cells remains relatively constant and
often declines with age. In that sense, stem cells are often said to be immortal, although no single stem cell survives for the life of the animal. Indeed, when pushed to divide more frequently than normal by chronic tissue injury, repeated rounds of chemotherapy, or genetic defects that impair genomic integrity, stem cells consistently exhibit a finite replicative capacity.
FIGURE 22-11 The pathway from stem cells to lineage-restricted progenitors to differentiated cells. On average, during each division of a multipotent somatic stem cell, at least one of the daughter cells becomes a stem cell like the parent cell. Stem cells thus undergo self-renewal divisions such that the number of stem cells of a particular type can stay constant during the organism’s lifetime. Other daughter cells, termed transit amplifying cells, divide rapidly and can undergo limited numbers of self-renewal divisions in which the properties of the daughter cells closely resemble those of the parent. These cells ultimately
produce lineage-restricted progenitor cells, which cannot undergo self-renewal divisions but can divide and produce differentiated cells of a particular type. Description A tree diagram, starting from a single stem cell, expands to the right, first into daughter stem cells, then into transit-amplifying cells, followed by lineage-restricted progenitor cells, finally ending in differentiated cells with four labeled differentiated cell type A and four labeled differentiated cell type B. At each stage, the number of cells increases. At the bottom of the lineage-restricted progenitor cells is a cell labeled cell type B progenitor, and at the top is a cell labeled cell type A progenitor. Many types of stem cells in the adult body divide infrequently; they are kept in reserve in case certain types of differentiated cells are required. In contrast, their non-stem-cell daughters frequently undergo many rapid rounds of cell division. Such cells, often called transit amplifying cells (see Figure 22-11), can undergo limited numbers of self-renewal divisions, but eventually their many progeny form lineage-restricted progenitor cells. These cells, in turn, can divide and generate very specific types of terminally differentiated cells. Stem cells can exhibit several patterns of cell division. Some types of stem cells always divide asymmetrically to generate one copy of the parent cell and one daughter cell with more restricted capabilities, such as dividing for a limited time or giving rise to fewer types of progeny than the parent stem cell (Figure 22-12a). This type of stem-cell division is commonly found in invertebrates such as Drosophila, discussed below.
FIGURE 22-12 Patterns of stem-cell differentiation. Different patterns of stem-cell division produce different proportions of stem cells (red) and differentiating cells (green). (a) Stem cells can undergo asymmetric divisions, producing one stem cell and one differentiating cell. This pattern maintains the number of stem cells in the population. (b) Some stem cells can divide symmetrically to increase their numbers, which is often important in normal development or during recovery from injury. At the same time other stem cells in the same population can be dividing asymmetrically as in (a). (c) Some stem cells may divide as in (b) while at the same time other stem cells produce two differentiating progeny. See S. J. Morrison and J. Kimble, 2006, Nature 441:1068–1074. Description The illustration labeled (a) shows a row of 4 stem cells colored red with blue nuclei. Below each one are their two daughter cells, with one still red and one green cell with a blue nucleus. The green cell is labeled differentiated cell. The illustration labeled (b) shows a row of 4 cells, red with blue nuclei. In this one, the daughter cells of the first two are both red cells, but the last two cells have one red and one green daughter cell. The illustration labeled (c) shows a row of 4 cells, red with blue nuclei. The first cell has two red daughters, the second cell has two green daughters, the third cell has one red and one green daughter, and the last cell has two green daughter cells. Other patterns of stem-cell division, commonly found in vertebrates, allow the number of stem cells or differentiated cells to increase or decrease
Stem Cells for Different Tissues Occupy Sustaining Niches
according to the needs of the animal (Figure 22-12b, c). Hormones secreted by or on the surface of adjacent cells frequently regulate these patterns of stem-cell division. For example, a stem cell may divide symmetrically to yield two daughters that undergo different fates: depending on external signals sent by other cells, one may remain a stem cell and the other may become a transit amplifying cell that will undergo several rounds of cell division and ultimately generate one or more types of differentiated progeny. As we will see in greater detail shortly, this happens in the small intestine: often one of the daughters remains a stem cell identical to its parent while the other daughter divides rapidly and generates multiple types of differentiated intestinal cells. Other stem-cell divisions are symmetric, producing two stem cells and increasing the number of stem cells of a particular type; this pattern of stem-cell division is common during development. Thus mitotic divisions of stem cells can either enlarge the population of stem cells or maintain a stem-cell population while steadily producing a stream of differentiating cells. Stem Cells for Different Tissues Occupy Sustaining Niches Stem cells need the right microenvironment to remain multipotent and to regulate the timing and pattern of their divisions. In addition to intrinsic regulatory signals — such as the presence of certain transcription factors and other regulatory proteins — stem cells rely on extrinsic hormonal and other signals from surrounding cells to maintain their status as stem cells. The location where a stem-cell fate can be maintained is called a stem-cell
Germ-Line Stem Cells in Many Organisms Produce Sperm or Oocytes
niche, by analogy to an ecological niche — a location that supports the existence and competitive advantage of a particular organism. In order to investigate or use stem cells, we must find them and characterize them. It is often difficult to identify stem cells precisely; they are very rare among cells and generally lack distinctive shapes. Some stem cells divide rarely, if at all, until stimulated by signals that convey the need for new cells. For example, inadequate oxygen supplies can stimulate blood stem cells to divide, and injury to the skin or muscle can stimulate regenerative cell division starting with the activation of skin or muscle stem cells. Some stem cells, including those that form the continuously shed epithelium of the intestine, are continuously dividing, usually at a slow rate. In the rest of this section, we focus on several types of stem cells in plants and animals that are well characterized; in the coming years, undoubtedly other types of stem cells will also be understood in great detail. Germ-Line Stem Cells in Many Organisms Produce Sperm or Oocytes The germ line is the cell lineage that produces oocytes and sperm; it is distinct from the somatic cells that make all the other tissues but are not passed on to progeny. The germ line, like somatic-cell lineages, starts with stem cells, but these cells are unipotent in that they make only germ cells. Stem-cell niches have been especially well defined in studies of germ-line stem cells in Drosophila and C. elegans. Germ-line stem cells are present
in adult flies and worms, and the locations of these stem cells are well known. In the fly, the niche where oocyte precursors form and begin to differentiate is located next to the tip of the germarium, the part of the ovary where eggs are formed (Figure 22-13a). There are two or three germ-line stem cells in this location next to a few cap cells, which create the niche by secreting two proteins in the TGF-β family, Dpp and Gbb, as well as Hedgehog (Hh) protein (Figure 22-13b). (These secreted protein signals were introduced in Chapter 16.) The cap cells create the niche because the TGF-β-class signals they send repress transcription of a key differentiation factor, the Bag of marbles (Bam) protein, in the neighboring germ-line stem cells. Repression of the bam gene allows germ-line stem cells to undergo self-renewing divisions, whereas activation of bam promotes differentiation. When a germ-line stem cell divides, one of the resulting daughters remains adjacent to the cap cells and is therefore maintained as a stem cell, like the parent cell. The other daughter is too far from the cap cells to receive the cap-cell-derived signals Dpp and Gbb. As a result, expression of the bam gene is induced, causing that daughter cell to enter the differentiation program. The signals involved were identified in part through the power of Drosophila genetics: mutant germ-line stem cells with defects in their Dpp or Gbb receptors, or their downstream signal transduction proteins, are lost prematurely. Conversely, overexpression of Dpp by cap cells prevents differentiation of germ-line stem cells and causes formation of tumorlike germ cell masses.
FIGURE 22-13 A Drosophila germarium. (a) Cross section of the germarium, showing female germ-line stem cells (yellow) and some somatic stem cells (orange) in their niches and the progeny cells derived from them. The germ-line stem cells produce cystoblasts (dark purple), which undergo four rounds of mitotic division to produce 16 interconnected cystocyte cells (light purple), one of which becomes the oocyte; the somatic stem cells produce follicle cells (brown), which will make the eggshell. The cap cells (dark green) create and maintain the niche for germ-line stem cells, while the inner sheath cells (blue)
produce the niche for somatic stem cells. (b) Signaling pathways that control the properties of germ-line stem cells. The signaling molecules — the TGF-β-family proteins Dpp and Gbb as well as Hedgehog (Hh) — are secreted by the cap cells. Binding of these ligands to receptors on the surface of a germ-line stem cell — the TGF-β receptors I and II and Ptc, respectively — results in repression of the bam gene by two transcription factors, Mad and Med. Repression of bam allows germ-line stem cells to undergo self-renewal divisions, whereas activation of bam promotes differentiation. The transmembrane cell-adhesion protein E-cadherin forms the homotypic adherens junctions (Chapter 20) between germ-line stem cells and cap cells. Arm (Armadillo), the fly β-catenin, connects the cytoplasmic tails of the E-cadherin to the actin cytoskeleton; both E-cadherin and Arm are important in maintaining the stem cells in their niche. (c) Signaling pathways that control the properties of somatic stem cells. The Wnt signal Wingless (Wg) is secreted by the inner sheath cells and binds to the Frizzled receptor (Fz) on a somatic stem cell. Hh is similarly produced and binds to the Ptc receptor. Both of these signals result in self-renewal of somatic stem cells. See R. Lehmann, 2012, Cell Stem Cell 10:729, https://doi.org/10.1016/j.stem.2012.05.016; and E. W. Kahney, J. C. Snedeker, and X. Chen, 2019, Curr. Opin. Cell Biol. 60:27. Description In the illustration labeled (a) the germarium consists of many cells. An outer coat is composed of cap cells at the front of the germarium, inner sheath cells around the sides, and follicle cells surrounding the remainder of the germarium. Underneath the cap cells, the germ-line stem cells lie. Between the germ-line stem cells, the inner sheath cells, and the follicle cells, the cystoblast is located. Between the inner sheath cells and the follicle cells, somatic cells are found. Embedded within the follicle cells, differentiating cysts are found. In the illustration, labeled (b), the schematic starts with a green rectangle labeled cap cell. Within this are the labels H h, D p p, G b b, and A r m. The H h, D p p, and G b b have arrows going to the next structure, a square labeled germ-line stem cell. The H h points to a structure labeled P t c at the top of the cell. The D p p and G b b both point to two small circles labeled 1 and 2. The A r m from the rectangle has an E-cadherin labeled red line moving to an A r m in the square. The nucleus is in the square as a blue oval and has a black line labeled b a m gene off with an arrow that has an X on it. The top of the line has the labels M a d, M e d. The illustration labeled (c) shows a blue rectangle labeled inner sheath cell and an orange rectangle labeled somatic stem cell. In the blue rectangle are structures labeled W g, H
h, A r m. The W g has an arrow pointing to a structure on the stem cell labeled F z. The H h has an arrow pointing to a structure labeled P t c. The A r m from the blue rectangle shows an E-cadherin moving to the E-cadherin from the A r m in the orange rectangle. The stem cells are held in the niche by the transmembrane cell-surface protein E-cadherin (see Chapter 20), which forms adherens junctions via homotypic interactions with similar E-cadherin molecules on the cap cell. These adherens junctions orient the mitotic spindle of the germ-line stem cells such that one daughter remains attached to the cap cell and the other is displaced from the niche; similar asymmetric stem-cell divisions occur during other developmental stages in Drosophila, as we discuss later (see
Figure 22-31b). Armadillo (Arm), the fly β-catenin, connects the cytoplasmic tails of the E-cadherin molecules to the actin cytoskeleton; like E-cadherin, Arm is important in maintaining the stem-cell niche. Separate somatic stem cells in the germarium produce follicle cells that will make the eggshell. The somatic stem cells have a niche too, created by the inner sheath cells, which produce Wingless (Wg) protein — a fly Wnt signal — and Hh protein (Figure 22-13c). Thus two different populations of stem cells can work in close coordination to produce different parts of an egg. The identification and characterization of Drosophila germ-line stem cells, as well as similar cells from C. elegans, were important because they convincingly demonstrated the existence of stem-cell niches and led to experiments to identify the niche-made signals that cause cells to
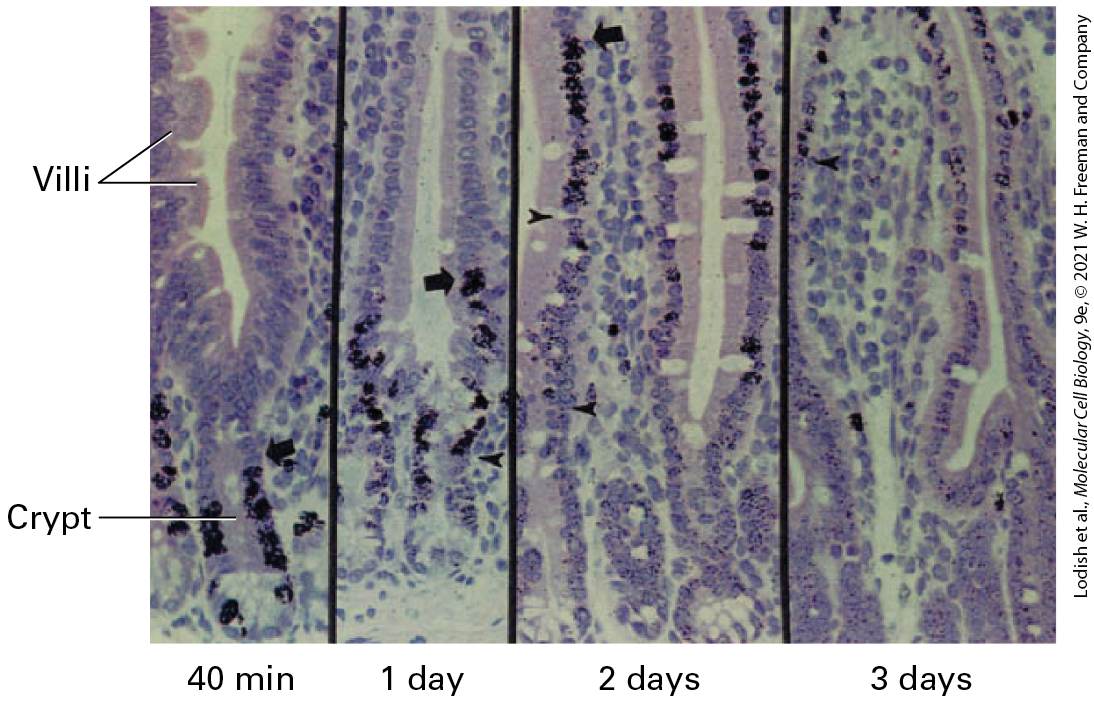
Intestinal Stem Cells Continuously Generate All the Cells of the Intestinal Epithelium
become and remain self-renewing stem cells. Thus a stem-cell niche is a set of cells and the signals they produce, not just a location. Intestinal Stem Cells Continuously Generate All the Cells of the Intestinal Epithelium In humans, the epithelium lining the small intestine has a surface area of over 30 square meters and has two main functions: uptake of metabolites from digested food, and acting as a protective barrier against toxins, bacteria, and other environmental stressors. It is a single cell thick (see
Figure 20-11) and is composed of six types of differentiated cells: absorptive enterocytes, M cells, Tuft cells, Goblet cells, Paneth cells, and Enteroendocrine cells. The most abundant epithelial cells, the absorptive enterocytes, transport nutrients essential for survival, such as glucose and amino acids, from the intestinal lumen into the body (see Figure 11-30). A network of capillaries underneath the epithelium transports these nutrients initially to the liver and ultimately to the rest of the body. The intestinal epithelium is the most rapidly self-renewing tissue in adult mammals, turning over every 5 days; in humans, up to 300 million intestinal epithelial cells, weighing a total of about 1 gram, are lost every day and need to be replenished. The cells of the intestinal epithelium are continuously regenerated from a stem-cell population located deep in the intestinal wall in pits called
crypts (Figure 22-14). Pulse-chase experiments using radiolabeled thymidine have shown that intestinal stem cells produce transit amplifying precursor cells that divide rapidly and then differentiate as they ascend the sides of crypts to form the surface layer of the fingerlike gut projections called villi, across which intestinal absorption occurs. The time from cell birth in the crypts to the loss of dead cells at the tips of the villi is only about 3 to 5 days (Figure 22-15). The production of new cells is precisely controlled: too little division would eliminate villi and lead to breakdown of the intestinal surface; too much division would create an excessively large epithelium and might also be a step toward cancer. Paneth cells — a type of differentiated intestinal epithelial cells — are longer lived than the cells of the villi; they produce several antibacterial proteins, including the enzyme lysozyme, which degrades bacterial cell walls and thus protects the intestine from infections.
FIGURE 22-14 Intestinal stem cells and their niche. (a) Schematic drawing of an intestinal crypt and villus, showing the Lgr5-expressing intestinal stem cells (dark green), their mitotic progeny, the transit amplifying cells (intermediate blue), the terminal differentiating cells (light blue), and the several types of differentiated epithelial cells in the villus. The base of the crypt is the location of Paneth cells (yellow), which secrete antimicrobial defense proteins. The cells (which occupy the fourth position from the crypt base, dark blue) can restore the stem-cell compartment following injury. Telocytes are thin cells with long protrusions that form a three-dimensional network underlying the epithelial cells throughout the intestine, and are the major source of the Wnt and R-spondin hormones necessary for stem-cell self-renewal. (b) Lineages of cells in the small intestine and the extracellular signals that support specification of individual lineages. Epithelial turnover occurs every 3–5 days; new Paneth cells are produced from the transit amplifying cells every 3–6 weeks. stem cells begin to differentiate as they are pushed out of the niche at the bottom of the crypt and the Wnt signal from telocytes is reduced. Depending on the extent of Notch signaling (Chapter 16) by adjacent cells they differentiate toward the absorptive (Notch on) or secretory fate (Notch off). Other hormones determine the subsequent specific fates of the absorptive or secretory transit amplifying progenitor cells into specific types of differentiated cells. The exact differentiation signals for Tuft cells are still not entirely understood; how different enteroendocrine subtypes are specified also is not yet well understood. See M. Shoshkes-Carmel et al., 2018, Nature 557:242–246; and B. Degirmenci et al., 2018, Nature 558:449–453. [Part (a) information from L. C. Samuelson, 2018, Nature 558:380. Part (b) information from H. Gehart and H. Clevers, 2019, Nat. Rev. Gastroenterol. Hepatol. 16:19–34.] Description The illustration labeled (a) shows a villus and a crypt. At the base of the crypt, paneth cells are located. Above the paneth cells are L G R 5 plus cells; above these are transient amplifying cells; differentiating cells; and differentiated cells that consist of goblet cells, enteroendocrine cells, tuft cells, and enterocytes. Arrows indicate that cell movement occurs from the crypt to the tip of the villus. At the villus tip, cell death occurs, and cells are shed into the intestinal lumen. The illustration labeled (b) shows L G R 5 plus cell at the top. A doubled headed arrow on the left of the stem cell labeled W n t low, Notch on points to absorptive progenitor. Another doubled headed arrow on
the right of the stem cell labeled W n t low, Notch off points to secretory progenitor. An arrow from absorptive progenitor labeled B M P high points to enterocyte and another arrow from absorptive progenitor labeled Rank L points to M cell. An arrow from secretory progenitor labeled w n t low, notch off, I L 4, I L 1 3 points to goblet cell. An arrow from secretory progenitor labeled w n t high, notch off, F G F points to paneth cell. An arrow from secretory progenitor labeled w n t low, notch off, E G off points to E E C progenitor, which is, further divided into five enteroendocrine cells. A dotted arrow from secretory progenitor points to tuft cell. EXPERIMENTAL FIGURE 22-15 Regeneration of the intestinal epithelium from stem cells can be demonstrated in pulse-chase experiments. Results from a pulse-chase experiment in which radioactively labeled thymidine (the pulse) was added to a culture of intestinal epithelial tissue. Proliferating cells incorporated the labeled thymidine into their newly synthesized DNA. After a brief period, the labeled thymidine was washed away and replaced with unlabeled thymidine (the chase); cells that underwent DNA replication after the chase did not become labeled. These micrographs show that 40 minutes after labeling, all of the label is in cells near the base of the crypt. At later times, the labeled cells are seen
Wnt and R-Spondins Are Essential for Function of the Lgr5+ Intestinal Stem Cells
progressively farther away from their point of birth in the crypt. Cells at the top are shed. This process ensures constant replenishment of the gut epithelium with new cells. [Republished with permission from John Wiley & Sons, Inc., from P. Kaur and C. S. Potten, 1986, “Cell Migration Velocities in the Crypts of the Small Intestine After Cytotoxic Insult Are Not Dependent on Mitotic Activity,” Cell Tissue Kinet. 6:601–610; permission conveyed through Copyright Clearance Center, Inc.] Experiments such as the one depicted in Figure 22-15 suggested that the intestinal stem cells were located somewhere near the bottom of the crypts, near Paneth cells, but these putative stem cells had no particular morphological characteristics that revealed their remarkable abilities. Which cells were the actual intestinal stem cells and which were the supportive cells that form the niche? Wnt and R-Spondins Are Essential for Function of the Intestinal Stem Cells Prior genetic experiments had shown that Wnt signals are essential for intestinal stem cell maintenance. As evidence for the importance of these signals, overproduction of active β-catenin (normally activated by the Wnt signaling pathway; see Figure 16-26) in intestinal cells leads to excess proliferation of the intestinal epithelium. Conversely, blocking the function of β-catenin by mutating or inhibiting the Wnt-activated TCF transcription factor abolishes the stem cells in the intestine, leading to intestinal degeneration and eventual death. Thus Wnt signaling plays a
critical role in the intestinal stem-cell niche, as it does in the skin, blood, and other organs. Indeed, mutations that inappropriately activate the Wnt signaling pathway are a major contributor to the progression of colon cancer, as we will see in Chapter 25. By analyzing a panel of genes whose expression in the intestine was induced by Wnt signaling, investigators zeroed in on Lgr5, a gene encoding a G protein–coupled receptor, because it was expressed only in a small set of cells at the very base of the crypts. Lgr5 binds a class of secreted hormones termed R-spondins and activates intracellular signaling pathways that potentiate Wnt signaling. Lineage-tracing studies showed that the descendants of these Lgr5-expressing cells indeed gave rise to all of the differentiated intestinal epithelial cells (Figure 22-16). These studies made use of genetically altered mice in which a version of the Cre recombination protein (see Figure 6-40), an estrogen receptor (ER)–Cre recombinase chimera, was placed under the control of the Lgr5 promoter; the ER-Cre recombinase chimera was produced only in the few putative Lgr5-expressing stem cells at the bottom of the crypts. The version of Cre recombinase used in the study had been altered so that it resides inactive in the cytosol and is transferred into the nucleus only after addition of an estrogen analog (Figure 22-16a). There the Cre excises a blocking segment of DNA, activating expression of a β-galactosidase reporter gene. Importantly, all of the descendants of these cells will also express β-galactosidase. Immediately after addition of the estrogen analog, the only cells expressing β-galactosidase are the stem cells in the crypts. After a few days, all of the descendant epithelial cells also expressed β-
galactosidase (Figure 22-16b), showing that Lgr5 expression is indeed a marker of the intestinal stem cells. EXPERIMENTAL FIGURE 22-16 Lineage-tracing studies show that the Lgr5expressing cells at the bases of crypts are the intestinal stem cells. (a) Using genetically altered ES cells, investigators generated one strain of mice in which a version of the gene encoding Cre recombinase (see Figure 6-40) was placed under the control of the Lgr5 promoter, and thus Cre recombinase was produced only in cells, such as intestinal stem cells, that express the Lgr5 gene. This version of Cre recombinase contained an additional domain from the estrogen receptor (ER) that binds the estrogen analog tamoxifen; like the ER and other nuclear receptors (see Figure 8-44), the ER-Cre chimera is retained in the
cytosol unless the estrogen analog tamoxifen is added. In the presence of tamoxifen, ERCre moves into the nucleus, where it can interact with loxP sites in the chromosomal DNA. A second reporter strain of mice contained a bacterial β-galactosidase reporter gene that was preceded by two loxP sites. The blocking segment of DNA in between these loxP sites prevented expression of the β-galactosidase gene, and the β-galactosidase gene could be expressed only in cells where an active Cre recombinase had removed the sequence in between the two loxP sites. The two strains of mice were mated, and offspring containing both marker transgenes were identified. In these mice, β-galactosidase was expressed only in cells in which the Lgr5-controlled ER-Cre gene was expressed and only after tamoxifen was given to the mice. Thus only Lgr5-expressing cells — and all of their descendants — would express the β-galactosidase gene. (b) One day after tamoxifen was given to these mice, the only cells expressing β-galactosidase (indicated by the blue histochemical stain) were the few Lgr5-expressing intestinal stem cells at the bases of the crypts (left). Five days after tamoxifen administration, additional blue cells — the epithelial descendants of the intestinal stem cells — were seen migrating up the sides of the villi. Some blue stem cells remained at the bottom of the crypt. [Part (b) reprinted with permission from Nature Publishing Group, from N. Barker et al., 2007, “Identification of Stem Cells in Small Intestine and Colon by Marker Gene,” Lgr5 Nature 449:1003–1007; permission conveyed through Copyright Clearance Center, Inc.] Description In the illustration labeled (a) the schematic begins on the left with a line drawing of a gene. A yellow rectangle on the line is labeled L g r 5 promoter. Further on the right is an orange rectangle labeled c r e attached to a blue rectangle labeled estrogen-binding domain of the estrogen receptor (E R). A downward arrow from the c r e has the label: m R N A encoding the C r e-E R protein made only in cells expressing the intestinal stem cell L g r 5 gene. This arrow goes from the nucleus to the cytosol and points to a pair of circles labeled C r e protein and E R. The E R circle is also labeled E R-C r e chimera. A sideward arrow from this shows three ovals labeled Tamoxifen being added. An upward arrow is labeled Tamoxifen binding moves E R-C r e chimera into nucleus. An upward arrow moves into the nucleus and points to a D N A line with a purple rectangle labeled promoter, splice donor, splice acceptor, I o x P, red rectangle labeled blocking segment, I o x P, green rectangle labeled beta-galactosidase. This line of D N A is labeled reporter gene. Another upward arrow points to the D N A line twisting
around the E r-C r e chimera so that the red rectangle is above the chimera. The last upward arrow is labeled E r-C r e chimera removes the blocking segment, and shows a ring shape with the red rectangle and one I o x P coming off the D N A. The top line of D N A now shows a purple rectangle, I o x P, and the beta-galactosidase in a straight line. The label reads, beta-galactosidase expressed in all descendants of this cell. Two micrographs labeled (b) show tamoxifen-treated mice cells. The left micrograph shows four main vertical light areas surrounded by red spots, with blue areas at the bottom of the second and fourth areas. The right micrograph shows 3 much larger areas of blue at the bottom. In subsequent studies, single Lgr5-expressing stem cells were isolated from intestinal crypts and cultured on an extracellular matrix (see Figure 20-24) containing type IV collagen and laminin, similar to the matrix that normally underlies and supports the intestinal epithelia. These cells generated small villus-like structures that contained the four principal differentiated cell types found in the mature intestinal epithelium (Figure 22-17). Such miniature three-dimensional versions of an organ, produced in culture from some type of stem cell, are termed organoids. Organoids are used by researchers to study the formation of many organs, including the human brain, and to develop treatments for many diseases.
EXPERIMENTAL FIGURE 22-17 Single Lgr5-expressing intestinal stem cells build crypt-villus organoid structures in culture without niche cells. Single Lgr5-expressing cells isolated from intestinal crypts were placed in culture on a type IV extracellular matrix (see Figure 20-24). After 2 weeks, these cultures had formed epithelial sheets that resembled villi in structure. Staining of these organoids for specific marker proteins showed that they contained all four differentiated epithelial cell types: (a) villin (green) is a marker protein for the absorptive enterocytes that are localized near the apical (luminal, Lu) surface of these organoids; (b) Muc2 (red) for goblet cells; (c) lysozyme (green) for Paneth cells; and (d) chromogranin A (green) for enteroendocrine cells. The organoids were also stained with DAPI (blue) to reveal nuclei. [Reprinted with permission from Nature Publishing Group, from T. Sato et al., 2009, “Single Lgr5 Stem Cells Build Crypt-Villus Structures In Vitro Without a Mesenchymal Niche,” Nature 459(7244):262–265; permission conveyed through Copyright Clearance Center, Inc.] Taken together, these experiments established that expression of the Lgr5 gene defines the intestinal stem cells and showed that these cells are localized at the bases of the intestinal crypts interspersed between the terminally differentiated Paneth cells (see Figure 22-14a). Lgr5expressing cells are also found in the stomach, colon, and pancreas — which, like the small intestine, are formed from the embryonic endoderm — and are thought to be the stem cells for these tissues. Indeed, culturing Lgr5-expressing cells from these tissues in the presence of Wnt, Rspondin, and other hormones generates organoids that contain differentiated cells characteristic of these tissues. Telocytes — thin fibroblast-like cells with long protrusions that surround the sheet of epithelial cells throughout the intestine (see Figure 22-14a) — are the major source of both Wnt and R-spondins, hormones essential for
normal function of the Lgr5-expressing stem cells. Paneth cells also secrete Wnt and were once thought to be the major Wnt-producing intestinal cells, but knocking out Wnt expression in all intestinal epithelial cells, including Paneth cells, had no effect on intestinal stem cells or renewal of intestinal epithelial cells. In contrast, conditional ablation in mouse telocytes of the porcupine gene, which is required for functional maturation of all Wnt proteins, caused a rapid cessation of Wnt signaling to intestinal crypts, followed by loss of proliferation of stem and transit amplifying cells and impaired epithelial renewal. Thus telocytes surrounding the base of the crypts are the principal source of the Wnt and R-spondin self-renewal signals to intestinal stem cells. These cells also produce EGF and TGFα, two hormones in the epidermal growth factor family that are also required for stem cell function. Lgr5-expressing cells are not the only type of intestinal stem cells. Evidence indicates that so-called cells located in the crypts (see Figure 22-14a) are reserve stem cells that can generate Lgr5-expressing stem cells following intestinal injury, such as by irradiation. Recall that transit amplifying cells have limited self-renewal potential (see Figure 22-11). During periods of intestinal injury, when many Lgr5-expressing stem cells are lost, some of the transit amplifying cells, under the influence of Wnt signals, can dedifferentiate — reverting to Lgr5-expressing stem cells and relocalizing to the stem cell niche at the base of the crypts! Thus the conversion of differentiated cells into stem cells, as seen experimentally during formation of iPS cells, may occur normally in the body during periods of stress or injury. As such, rather than relying on a single stem cell-to-differentiated cell lineage (see Figure 22-14b), the intestine seems
Hematopoietic Stem Cells Form All Blood Cells and All Cells of the Immune System
capable of drawing on a pool of reserve stem-cell populations. Future work will undoubtedly clarify the role of these cells in generating intestinal epithelial cells. Hematopoietic Stem Cells Form All Blood Cells and All Cells of the Immune System All red and white blood cells and virtually all cells that form the immune system need to be continuously replenished. Human red blood cells survive 90–120 days before they are degraded by macrophages, mainly in the spleen. Macrophages can survive for several months while neutrophils survive only a few days. All of these cells derive from a single type of multipotent, self-renewing hematopoietic stem cell (HSC) through multiple transit amplifying cell divisions leading to multipotent and then unipotent progenitors (Figure 22-18).
FIGURE 22-18 Formation of blood cells from hematopoietic stem cells in the bone marrow. Early in mammalian development, multipotent hematopoietic stem cells often divide symmetrically to increase the numbers of stem cells. In adults, they generally divide asymmetrically to form one daughter cell that is multipotent, like the parent stem cell, and another daughter cell with a more restricted fate. Recent single-cell sequencing of purified progenitor populations revealed an unanticipated heterogeneity; there are at least 18 distinct subtypes of transit-amplifying hematopoietic progenitors. These multipotent transit amplifying cells are likely capable of limited numbers of self-renewal divisions but, depending on the types and amounts of cytokines present, they undergo rapid rounds of cell division and generate different types of progenitor cells (light green). These progenitors are either multipotent (e.g., bipotential granulocyte — monocyte and erythroid — megakaryocyte progenitors) or unipotent in that they can give rise to more than one type or only a single type of differentiated blood cells, respectively; they respond to one or a few
specific cytokines. The lymphoid branch has not yet been studied in such great detail with single cell transcriptomics; future work should reveal more about how the B, NK, and T cells of the immune system (Chapter 24) are specified. Some of the cytokines that support this process are indicated (pink labels). CSF = colony-stimulating factor; IL = interleukin; SCF = stem-cell factor; Epo = erythropoietin; Tpo = thrombopoietin. See S. Watcham, I. Kucinski, and B. Gottgens, 2019, Blood 133:1415. Description The illustration begins at left with a cell labeled multipotent hematopoietic stem cell (H S C). Four arrows come from it. One goes back to itself and is labeled self-renewal. The other three lead to a cell with the label: many types of multipotent transit-amplifying hematopoietic progenitor cells. 8 paths come from this cell. The top path starts with a cell labeled Megakaryocyte erythroid progenitor, which leads to the top path. This top path has a cell labeled megakaryocyte progenitor and has an arrow labeled S C F, T p o, I L-3, G M-C S F. The arrow ends at a cell with yellow platelets in it and the label Megakaryocytes (platelet-forming cells). The next path also comes from the megakaryocyte erythroid progenitor and starts with a cell labeled B F U-E. A sideward arrow is labeled E p o, S C F, G M-C Z S f, I L-3, and leads to a cell labeled C F U-E. These two cells are also labeled as erythroid progenitors. Another arrow comes to the right with the label E p o and shows Erythrocytes (red blood cells). The next main path starts with a cell labeled Basophil precursor. An arrow to the right is labeled I L-3, others and points to a cell with yellow dots in it and labeled basophil (inflammation). The next main path starts with a cell labeled mast cell precursor. An arrow is labeled S C F, I L-3, others and points to a cell with yellow dots in it labeled mast cell (immunity, allergy). The fifth path down starts with a cell labeled eosinophils progenitor. The arrow from this one is labeled I L-3, G M-C S F, and points to two cells with rough edges and a c-shaped nucleus, which are labeled eosinophils (immune cells active in allergic reactions, fighting parasites). The sixth path starts with a cell labeled granulocyte-macrophage progenitor. The arrow is labeled G-C S F and points to three cells with multi-shaped nuclei and labeled Granulocytes (produce antibacterial proteins and chemicals). The seventh path also comes from the granulocyte progenitor and the arrow is labeled M-C S F. This arrow points to two cells labeled monocytes (macrophage precursors). The eighth path starts with a cell labeled dendritic cell progenitor. An unlabeled arrow points to a star-shaped cell labeled dendritic cell (immunity). The last path shows an arrow labeled many intermediate progenitors and
Characterizing Hematopoietic Stem Cells by Transplantation
two unlabeled cells. Another arrow from these is labeled: I L-2, I L-7, I L-12, S D F-1, F L T-3 ligand, T N F alpha, T G F-beta 1, others and points to two cells with the label: N, K, T, B, and other cells of the immune system. Characterizing Hematopoietic Stem Cells by Transplantation Characterization of HSCs and the more restricted progenitors they generate was much more difficult than defining the germ or intestinal stem cells discussed earlier, as these stem cells are localized to niches that have a specific location in tissues (see Figures 22-13 and 22-14). Like all stem cells, hematopoietic stem cells are found in niches, but in embryos HSCs are dispersed among fetal liver cells and in adults HSCs and their niche cells are scattered among many other types of cells within the bone marrow. Identifying HSCs and the cells that make up the HSC niche was also difficult because HSCs comprise only about 0.01 percent of bone marrow or fetal liver cells. Hematopoietic stem cells and the progenitors they generate were originally detected and quantified by bone marrow transplantation experiments in mice whose hematopoietic stem and progenitor cells had been eradicated by irradiation (Figure 22-19). Purification of HSCs was difficult since no cell-surface protein is expressed only by HSCs, and thus no exclusive surface marker was available for these cells. However, much work showed that HSCs could be prospectively identified and partially purified because they do express cell-surface proteins called CD150 and
Sca-1 (of unknown functions) and do not express any of the dozen or so Lin (Lineage-restricted) marker proteins found on the surface of specific types of differentiated hematopoietic cells. Further efforts took advantage of the fact that HSCs require a growth factor termed stem-cell factor (SCF) for their survival; this protein, which is produced as the extracellular domain of a membrane-spanning protein and is localized to the surface of an adjacent signaling cell, activates the c-Kit protein tyrosine kinase receptor on HSCs. HSCs also require CXCL12, a chemoattractant for HSCs that binds to a G protein–coupled receptor on HSCs and is required to keep HSCs in the niche. CXCR4, the receptor for CXCL12, is also found on HSCs.
EXPERIMENTAL FIGURE 22-19 Functional analysis of mouse hematopoietic stem cells by bone marrow transplantation. The two strains of mice used in this analysis are genetically identical except for the gene encoding a protein, termed Ly5, found on the surfaces of all nucleated blood cells, including all T and B lymphocytes, granulocytes, and monocytes. The proteins encoded by the two alleles of the gene, Ly5.1 and Ly5.2, can be detected by specific monoclonal antibodies. A recipient Ly5.2 mouse is lethally irradiated to kill all HSCs, clearing out the stem-cell niches in the bone marrow so they can receive stem cells from a donor mouse; the mice are then injected with stem cells purified from a Ly5.1 strain. Because the stem cells take weeks or months to produce differentiated blood cells, the recipient mouse will die unless it receives bone marrow progenitor cells from a genetically identical Ly5.2 mouse (termed “supportive” cells) that will produce mature blood and immune system cells for the first few weeks after the transplant. At intervals after the transplant, blood or bone marrow is recovered and reacted with a blue-fluorescing monoclonal antibody to Ly5.1 and a red-fluorescing monoclonal antibody to Ly5.2. Mature blood cells that are descended from the donor stem cell are detected by FACS analysis, seen here as cells that fluoresce blue and not red. These cells can be sorted and stained with fluorescent antibodies specific for marker proteins found on different types of mature blood cells to show that a stem cell is indeed pluripotent, in that it can generate all types of lymphoid and myeloid cells. Description The illustration at the top shows two drawings of mice. The left mouse is labeled congenic donor and has L y 5.1 written on it. This mouse has a downward arrow labeled bone marrow cells (with a small picture of cells), and an arrow labeled F A C S and purified hematopoietic stem cells (H S C's). The mouse on the right is labeled supportive donor and has L y 5.2 written on it. The downward arrow from this mouse is labeled supportive bone marrow cells. These arrows join together and point down to a mouse picture with stripes and L y 5.2 written on it. This one is labeled lethally irradiated recipient. A downward arrow leads to another mouse with L y 5.2/5.1 written on it and labeled reconstituted recipient. The diagram ends with a small chart with the label L y 5.2-F I T C across the bottom and L y 5.1-P E along the left side. Blue dots are congregated in the top left corner of the chart and red dots are congregated at the bottom right. A label next to the chart reads: F A C D analysis at 1,3,4, and 6 months post-transplantation.
Thus HSCs could be purified first by treating bone marrow cells with magnetic beads coated with a series of monoclonal antibodies each specific for a Lin protein on the surface of differentiated hematopoietic cells, and then removing all of the lineage-positive differentiated cells attached to the beads with a magnet. Next the remaining lineage-negative cells were treated with fluorescent antibodies for c-Kit, CD150, and Sca-1, and the few cells that expressed all of these marker proteins were separated in a fluorescence-activated cell sorter (FACS; see Figures 4-1 and 4-2) and used in transplantation experiments. Remarkably, such transplantation studies revealed that a single HSC is sufficient to restore the entire blood system when transferred into a lethally irradiated mouse in which all of its HSCs had been killed. After transplantation, the HSC takes up residence in a niche in the bone marrow and divides to make more HSCs as well as progenitors of the different blood-cell lineages. The first successful human bone marrow transplant was done in 1959, when a patient with end-stage (fatal) leukemia was irradiated to destroy her cancer cells as well as her own normal HSCs. She was transfused with bone marrow cells from her identical twin sister, thus avoiding an immune response, and was in remission for 3 months. This pioneering effort, which was awarded a Nobel Prize in Medicine in 1990, led to the present-day treatments that can often lead to a complete cure of many diseases. Because stem cells in the transplanted marrow can
Niches for Hematopoietic Stem Cells and Many Hematopoietic Progenitor Cells
generate all types of functional blood cells as well as all cells of the immune system, transplants using bone marrow HSCs from normal donors are useful in patients with several hereditary anemias, including β-thalassemia (caused by mutations that lead to production of reduced amounts of the hemoglobin β chain) and sickle-cell disease (caused by a point mutation in the β chain of hemoglobin), as well as patients with diseases such as X-linked Severe Combined Immune Deficiency (SCID), in which the gene for the IL-2 receptor common gamma chain (see Figure 16-19b) is inactivated and no immune cells are produced. Transplants are also used to treat many cancer patients who have received irradiation or chemotherapy, both of which destroy bone marrow cells as well as cancer cells. Patients with β-thalassemia, SCID, and sickle-cell disease can now be treated by a combination of gene therapy and an autologous bone marrow transplant. Cell populations containing HSCs are removed from the patient, treated in culture with a lentiviral vector (a type of retrovirus derived from HIV; see Figure 6-35) into which a normal copy of the mutant gene had been inserted, and the corrected HSCs transfused back into the patient. Niches for Hematopoietic Stem Cells and Many Hematopoietic Progenitor Cells
During embryonic life, mammalian HSCs reside in the liver and often divide symmetrically, producing two daughter stem cells (see Figure 2212b); this process allows the number of stem cells to increase over time and produce the large number of progenitor cells required to make all of the necessary blood cells before birth. Hepatocyte progenitors are the major cell that forms the HSC niche in the fetal liver. These cells express SCF and other proteins required for HSC survival. Co-culture of these hepatic progenitor cells with HSCs led to expansion of HSC numbers as well as formation of their differentiated progeny, solidifying their role as HSC niche cells. In adult mammals, HSCs reside in the bone marrow and are largely quiescent, resting in the state in the bone marrow stem-cell niche. When more blood cells are needed, cytokines are generated locally, which signals some HSCs to divide, producing stem cells like the parent cells and rapidly proliferating transit amplifying cells that generate the progenitors depicted in Figure 22-18. Whether individual HSCs undergo symmetric or asymmetric divisions is not known. A small number of mesenchymal cells surround the small blood vessels, termed sinusoids, that permeate the bone marrow. Some of these cells are termed leptin receptor positive as they express the receptor for the cytokine leptin on their surface. They also express large amounts of SCF, synthesize abundant CXCL12, and are thought to be the major HSC niche cells in the bone marrow (Figure 22-20a). Immunofluorescence analysis showed that about 85 percent of HSCs physically contact these cells
(Figure 22-20b). Other cells in the bone marrow probably influence stemcell maintenance or niche function by releasing other types of hormones. EXPERIMENTAL FIGURE 22-20 The hematopoietic stem-cell niche in the bone marrow. (a) The bone marrow contains dozens of different types of cells, including osteoblasts and osteoclasts that build and degrade bone, respectively, as well as multiple types of hematopoietic stem and progenitor cells, and other cell types. The bone marrow is permeated by small blood vessels termed sinusoids. The predominant cells that form the HSC niche are the very rare mesenchymal stromal cells that adhere to these vessels and that express a combination of cell-surface proteins including the leptin receptor and SCF, the hormone that binds to and activates the c-Kit protein tyrosine kinase receptor on HSCs and many types of hematopoietic progenitor cells. The stromal cells also secrete CXCL12, a chemoattractant for HSCs, and the also act as supportive niche cells for a number of hematopoietic progenitor cells depicted in
Figure 22-18. MEP = megakaryocyte erythroid progenitor; GMP = granulocyte macrophage progenitor; CFU-E = colony forming unit erythroid–erythrocyte progenitor. See S. J. Morrison and D. T. Scadden, 2014, Nature 505:327; and S. Comazzetto et al., 2019, Cell Stem Cell 24:477. (b–d) Immunofluorescence detection of HSCs and niche cells in bone marrow, showing that HSCs are localized next to SCF-expressing cells. Antibodies to SCF
were not available, so in order to detect SCF expression, a mouse was generated in which GFP cDNA was placed in the SCF gene locus and expressed only in cells that normally produce SCF. (b) Bone marrow sections were then examined in a fluorescence microscope to detect the SCF-expressing cells. (c) To detect HSCs, the sections were stained with an antibody to the CD150 protein, expressed on the surface of HSCs. (d) The sections were also stained with a collection of antibodies specific for proteins expressed on the surface of specific types of differentiated blood cells, but not by HSCs. (e) When the three images are merged, an HSC (white arrows) can be seen adjacent to the SCF-expressing stromal cell. [Parts (b–e) reprinted with permission from Nature Publishing Group, from L. Ding et al., 2012, “Endothelial and Perivascular Cells Maintain Haematopoietic Stem Cells,” Nature 481(7382):457–462; permission conveyed through Copyright Clearance Center, Inc.] Description The illustration labeled (a) on the left, shows vertical columns of cells labeled bone. Inside this column, a blue blob structure is labeled osteoclast. The outer layer of bone cells is labeled osteoblast. Next to this is a close up of a tiny y-shaped blood vessel labeled as a sinusoid. Three star-shaped cells, labeled stromal cell (expresses S C F, C X C L 12, leptin receptor) are attached to the outside of the vessel. Around the points of the stars are blue cells labeled hematopoietic stem cell (expresses c-Kit, C D 150). Also around the points of the stars are orange cells with blue nuclei, labeled M E P and C F U-E. At the bottom of the blood vessel, one cell is labeled endothelial cell lining the sinusoid. The micrograph labeled (b) shows green fluorescent spots labeled H S C. The smaller spot is labeled S C F-expressing stromal cell. The micrograph labeled (c) shows C D 150-staining H S C. The micrograph labeled (d) has purple fluorescent areas and is labeled H S C: Negative for staining with a combination of antibodies specific for surface proteins of differentiated blood cells. The micrograph labeled (e) shows multiple colors and labeled H S C. A light blue area is labeled S C F-expressing stromal cell. Like HSCs, a number of hematopoietic precursors also require SCF for their proliferation and differentiation and express c-Kit, the SCF receptor, on their surface. These cells — including many of the multipotent
Regulating the Production of Differentiated Hematopoietic Cells
progenitors formed from HSCs, as well as megakaryocyte-erythrocyte progenitors, and granulocyte-macrophage progenitors — are also found in the bone marrow adjacent to the leptin receptor positive cells that express SCF. Indeed, conditional deletion of SCF from these leptin receptor positive cells depleted all of these progenitors and their descendants from the bone marrow. Thus many hematopoietic progenitors as well as HSCs require specific types of bone marrow niche cells for their survival and function. Regulating the Production of Differentiated Hematopoietic Cells In adults, HSCs rarely divide, but when they do, on average one of the daughters remains a stem cell like the parent (self-renewal) while the other divides rapidly and eventually gives rise to one of several multipotent progenitors. These are more restricted in their fates and like transit amplifying cells in other lineages (see Figure 22-11) are capable of a limited number of self-renewal divisions before giving rise to lineagespecific progenitor cells, each of which in turn can divide and generate multiple numbers of a specific type of differentiated cell (see Figure 2218). Numerous extracellular growth factors termed cytokines regulate HSC self-renewal divisions as well as proliferation and differentiation of the precursor cells for various blood-cell lineages (see Chapter 16). Each branch of the blood-cell lineage tree is affected by different cytokines,
allowing exquisite control of the production of specific cell types. If all blood-cell types are needed — for example, after a bleeding injury — multiple cytokines can be produced. If only one cell type is needed, specific signals control its production. For example, when a person is traveling at high altitude, erythropoietin is made by the kidneys and stimulates the proliferation and differentiation of CFU-E (erythroid progenitor) cells, but not other types of blood-cell precursors. The erythropoietin receptor is expressed only in erythroid precursors and activates intracellular signal transduction pathways that lead to induction of ~400 genes essential for formation of a mature red blood cell (see
Figure 16-18). Similarly, G-CSF, a different cytokine, stimulates proliferation of bipotential granulocyte-macrophage progenitors and their differentiation into granulocytes, while M-CSF stimulates production of macrophages from the same progenitor cell type (see Figure 22-18). By transplanting specific types of hematopoietic precursors into mice and observing which blood cells were produced, researchers could infer which precursors or terminally differentiated cells (e.g., erythrocytes, monocytes) arise from a particular type of precursor. Colony-forming assays can also determine the potential fates of progenitor cells; individual progenitor cells are cultured in a semisolid matrix such as methyl cellulose, together with a group of cytokines. All of the daughter cells produced remain localized together, forming a colony of cells. From the types of differentiated cells in the colony one can infer the identity of its progenitor.
Meristems Are Niches for Stem Cells in Plants
These experiments gave rise to the notion that there are discrete states of hematopoietic stem and progenitor cells, and as these cells underwent differentiation their transcriptomes would change from one defined discrete state to another. Single-cell sequencing, with its ability to analyze the transcriptomes of multiple individual cells, has modified this understanding of hematopoiesis. Because some HSCs express transcription factors required for lymphoid (immune system) differentiation and others essential for myeloid (red and white blood cell) differentiation, some HSCs are thought to be programmed to differentiate toward the lymphoid or myeloid pathways. Rather than cellular transitions between discrete progenitor states, such as between a granulocyte/monocyte progenitor and differentiated granulocytes or monocytes, multiple studies have supported the idea of continuous differentiation pathways, with gradual changes in the transcriptomes from one differentiating cell state to another (see
Figure 22-18). Meristems Are Niches for Stem Cells in Plants In plants, as in their multicellular animal counterparts, the production of all tissues and organs relies on small populations of stem cells. Like animal stem cells, these stem cells are defined by their ability to undergo self-renewal and to generate daughter cells that produce differentiated tissues. Also like animal stem cells, plant stem cells reside in stem-cell niches — specialized microenvironments where extracellular signals are produced that maintain the stem cells in a multipotent state. Because the
last common ancestor of plants and animals was a unicellular eukaryote, it would appear that, despite common organizing principles, stem cells and their niches evolved independently and by different pathways in plants and animals — an example of convergent evolution. The niches in which plant stem cells are located, called meristems, can persist for thousands of years in long-lived species such as bristlecone pines. The body axis of the plant is defined by two primary meristems that are established during embryogenesis, the shoot apical meristem and the root apical meristem. In contrast to animal development, very few tissues or organs are specified during plant embryogenesis. Instead, organs such as leaves, flowers, and even germ cells are continuously generated as the plant grows and develops. The aboveground part of the plant is derived from the shoot apical meristem and the belowground part from the root apical meristem. Classic clonal analysis experiments have demonstrated that plant-cell fate depends on the cell’s position, not its lineage. A cell’s identity is reinforced by intercellular signals such as hormones, mobile signaling peptides, and miRNAs. Unlike somatic stem cells in metazoan animals, somatic plant stem cells give rise to entire organs, not just specific tissues or lineages. Slowly dividing pluripotent stem cells are located at the apex of the shoot apical meristem, with more rapidly dividing multipotent transit amplifying daughter cells on the periphery. Descendants of the shoot stem cells are displaced to the periphery of the meristem and are recruited to form primordia of new organs, including leaves and stems. Division ceases as these cells acquire the characteristics of specific cell types, and most
organ growth occurs by cell expansion and elongation (Figure 22-21a). New shoot stem-cell niches can form in the axils of leaf primordia, which then grow to form lateral branches. Floral meristems give rise to the four floral organs — sepals, stamens, carpels, and petals — that form flowers. Unlike shoot apical meristems, floral meristems gradually become depleted as they give rise to the floral organs.
FIGURE 22-21 Structures of the Arabidopsis thaliana shoot and root meristems. (a) Transverse section through the apex of the shoot apical meristem. The organizing center cells signal to maintain the overlying stem cells. The stem cells produce daughters by division in the direction of the black arrows, generating rapidly dividing transit amplifying cells that will eventually differentiate and give rise to entire organs, such as a leaf. (b) Transverse section through the root meristem. Stem cells surround the mitotically less active quiescent center, four cells that send signals to prevent stem-cell differentiation. Each stem cell divides asymmetrically: one daughter remains adjacent to the quiescent center and becomes a stem cell (self-renewal); the other daughter becomes a transit amplifying cell that
A Negative Feedback Loop Maintains the Size of the Shoot Apical Stem-Cell Population
divides a number of times before exiting the cell cycle, elongating, and assuming a specific differentiated state. [Information from R. Heidstra and S. Sabatini, 2014, Nat. Rev. Mol. Cell Biol. 15:301.] Description The illustration labeled (a) shows a schematic from a plant leaf. The left part is full of light green cells and is labeled differentiating cells. The next area is a small area colored light orange and labeled proliferation zone transit-amplifying cells. In the center of the orange cells is a small area colored light blue, which is labeled stem cells. Below the stem cells, a light pink area is labeled organizing cells. The illustration labeled (b) shows a tail shaped area (all light green) at the right that is labeled leaf primordium. The root tip with cells is outlined and colored in the same code as illustration (a). The stem cells are located near the bottom of the root, with a very small area under them labeled quiescent center. A Negative Feedback Loop Maintains the Size of the Shoot Apical Stem-Cell Population Genes required for stem-cell identity, maintenance, and cell differentiation have been defined by genetic screens in the mustard-family weed Arabidopsis thaliana (see Figure 1-23h) for mutants exhibiting larger, smaller, or non-replenishing meristems, as well as by more recent gene-expression profiling studies of isolated meristem-cell populations. One shoot apical meristem determinant is the gene called WUSCHEL (WUS), which encodes a homeodomain transcription factor (see Chapter
8). WUS is required for maintenance of the stem-cell population but is expressed in the supportive cells underlying the stem cells. These cells, collectively termed the organizing center, are analogous to the niche cells in metazoans (see Figure 22-21a). While WUS mRNA and protein are synthesized in the cells of the organizing center, WUS moves from the organizing-center cells into the stem cells, presumably through the interconnecting plasmodesmata (see Figure 20-43). In one study, a WUSGFP fusion protein, when expressed in WUS-negative Arabidopsis plants, was able to rescue the mutant phenotype. Subsequent microscopic analysis showed that this WUS-GFP chimera accumulated in the stem cells, indicating it had moved there from the organizing-center cells. Once in the stem cells, WUS binds to many sites in the genome; it represses a large number of genes that are expressed in differentiating cells, including a group of differentiation-promoting transcription factors required for leaf development. WUS also directly activates the expression of CLAVATA3 (CLV3) in stem cells. CLV3 encodes a small, secreted peptide that binds to the CLV1 receptor on the surface of organizing-center cells and generates an intracellular signal that negatively regulates WUS expression. Overexpression of WUS causes a large expansion of the meristem stem-cell population at the expense of production of differentiated cells. Thus the negative feedback loop between a transcription factor, WUS, and a signaling peptide, CLV3, maintains the size of the stem-cell population and the number of their dividing daughter cells over the lifetime of the plant (Figure 22-22).
FIGURE 22-22 Regulatory network in the Arabidopsis shoot meristem stem-cell niche. The transcription factor WUS (orange circles) is synthesized in the organizing-center cells and moves via plasmodesmata into stem cells, where one of its functions is to induce expression of the CLV3 hormone (green circles). Secreted CLV3 protein binds to CLV1, the CLV3 receptor protein kinase on the surface of organizing-center cells; there it activates a signal that represses WUS transcription. See E. Aichinger et al., 2012, Annu. Rev. Plant Biol; 63:615.
The Root Meristem Resembles the Shoot Meristem in Structure and Function
[Data from R. Heidstra and S. Sabatini, 2014, Nat. Rev. Mol. Cell Biol. 15:301.] Description In the illustration, an organizing center cell represented in a pink rectangle is connected to a stem cell below by plasmodesmata. Expression of the W U S gene in the organizing stem cell center yields the W U S protein, which travels via the plasmodesmata into the stem cell where it blocks differentiation-specific genes. W U S induces transcription of the C L V 3 gene, and the C L V 3 protein is secreted via vesicles into the intercellular space, docking with receptors on the organizing center cell, and blocking the expression of the W U S gene. Several other transcriptional regulatory proteins are essential for the normal function of both shoot and root meristem cells, including the plant homolog of the human retinoblastoma (Rb) tumor suppressor protein (see
Chapter 25), called RBR. As in animal cells, RBR binds to and inhibits the function of an E2F transcription factor; release of RBR from E2F or genetic loss of RBR allows the E2F factor to promote transcription of multiple genes that promote entry into the cell cycle and cell division (see
Figure 19-16). Reduced levels of RBR result in an increase in stem-cell numbers, and increased RBR levels lead to stem-cell differentiation; both of these observations indicate a prominent role for RBR in stem-cell maintenance. The Root Meristem Resembles the Shoot Meristem in Structure and Function
Unlike the shoot meristem, the root meristem consists of lineagerestricted stem cells. These cells are organized around the quiescent center, four very slowly dividing cells that serve as the stem-cell niche (Figure 22-21b). Stem-cell division is asymmetric (also unlike that in the shoot), and the daughter cell that loses contact with the quiescent center divides several more times and then differentiates. A WUS homolog, WOX5, is expressed in the quiescent center and is required for stem-cell maintenance, although other transcription factors are also important. The plant hormone auxin (indole-3-acetic acid) coordinates many processes involved in plant growth and differentiation; in particular, it is essential for formation of the root meristem niche. If the quiescent center is ablated, a new niche is formed in an area of high auxin concentration. However, the effect of auxin on stem cells depends on the specific cell type. For example, in the stem cells that give rise to the root cap, auxin promotes cell differentiation by repressing WOX5 via auxin-responsive transcription factors. Plants have an amazing capacity for regeneration. The home gardener will be familiar with the ability of some leaf or stem cuttings to form roots with little inducement beyond a glass of water and a sunny windowsill. Experiments performed in the mid-twentieth century demonstrated that single cells isolated from carrot roots could regenerate entire plants when placed on media containing the appropriate mix of nutrients and hormones. Recent studies have utilized detailed molecular analyses, including sequencing the transcriptomes of single cells and lineage tracing, to the process of regeneration. In some instances, regeneration
appears to follow a program similar to the embryonic processes that initially establish meristems. For example, excision of the root tip removes the quiescent center and disrupts the auxin gradient. An auxin maximum is then established at the new distal tip via polar auxin transport. WOX5 initially exhibits a broad expression domain but gradually becomes restricted to a newly formed quiescent center as hormone gradients are reestablished and the meristem is reconstructed. KEY CONCEPTS OF SECTION 22.2 Stem Cells and Niches in Multicellular Organisms Planaria contain pluripotent stem cells termed cNeoblasts that are important for regeneration of body parts removed by amputation. Most stem cells in animals are multipotent, except for germ-line stem cells that are unipotent. Stem cells are undifferentiated; they can undergo symmetric or asymmetric selfrenewal divisions such that their number remains constant or increases over the organism’s lifetime (see Figure 22-12). Stem cells are formed in niches that provide signals to maintain a population of undifferentiated stem cells. The niche must maintain stem cells without allowing their excess proliferation and must block differentiation. Stem cells are prevented from differentiating by specific controls that operate in the niche. A high level of β-catenin, a component of the Wnt signaling pathway, has been implicated in preserving stem cells in the germ line and intestine by directing cells toward self-renewal division rather than differentiation states. In the Drosophila germarium, a few cells form the germ stem-cell niche, sending signals directly to the adjacent stem cells. Daughter cells that are displaced from the niche cells undergo proliferation and differentiation into germ cells (see Figure 2213). Populations of stem cells associated with the intestinal epithelium and many other tissues regenerate differentiated tissue cells that are damaged, sloughed, or aged (see
Figure 22-14). Intestinal stem cells reside in the bases of intestinal crypts, adjacent to Paneth cells, and are marked by expression of the Lgr5 receptor (see Figure 22-14).
In the blood-cell lineage, different precursor types form and proliferate under the control of distinct cytokines (see Figure 22-18). This system allows the body to specifically induce the replenishment of some or all of the necessary blood-cell types. Hematopoietic stem cells can be detected and quantified by bone marrow transplant experiments (see Figure 22-19) and their niche cells detected using a combination of marker surface proteins (see Figure 22-20). Plant stem cells persist for the life of the plant in the meristem. Meristem cells can give rise to a broad spectrum of cell types and structures (see Figure 22-21). A negative feedback loop involving the WUS transcription factor maintains the size of the shoot apical stem-cell population.
22.3 Mechanisms of Cell Polarity and Asymmetric Cell Division
22.3 Mechanisms of Cell Polarity and Asymmetric Cell Division We have discussed the importance of asymmetric division in generating cell diversity during development and in maintaining the number of stem cells in a population. What mechanisms underlie the ability of cells to become asymmetric before cell division to give rise to cells with different fates? Cell asymmetry is a concept we have encountered before, under the name of cell polarity, so let us first review what it means for a cell to be polarized. Cell polarity — the ability of cells to organize their internal structure, resulting in changes in cell shape and the generation of regions of the plasma membrane with different morphologies and protein and lipid compositions — has been introduced in several chapters. For example, we have seen that polarized intestinal epithelial cells have an apical domain with abundant microvilli separated from the basolateral domain by tight junctions (see Figures 17-1 and 20-11). Epithelial transport requires these cells to have different transport proteins in the apical and basolateral membranes (see Figure 11-30). As we discuss later in this section, these epithelial cells are responding to extracellular signals that instruct them how to polarize. These cells represent just one example of cell polarity — essentially all cells in animals are polarized, and we discuss several examples in which the underlying mechanisms have been defined. What
The Intrinsic Polarity Program Depends on a Positive Feedback Loop Involving Cdc42
emerges are three core principles of cell polarity. First, cells have an intrinsic polarity program, as revealed by their remarkable ability to polarize in the absence of external cues. As we will see in our examples, a master and common regulator of this program is the small GTPase Cdc42. Second, this intrinsic polarity program can be directed by external or internal cues. Third, the polarity of individual cells is often maintained by intracellular mutually antagonistic complexes. We first discuss the intrinsic polarity program in budding yeast because, given that all the components of the mechanism are shared with animals, the principles uncovered in yeast are likely to be conserved. We then turn our discussion to examples in which cells respond to external cues to establish cell polarity depending on antagonistic interactions. Finally, we discuss an example of asymmetric cell division that gives rise to a daughter stem cell and a differentiated cell. The Intrinsic Polarity Program Depends on a Positive Feedback Loop Involving Cdc42 Budding yeast grows by selecting a single site on its surface at which to assemble a new bud (see Figure 19-4). Importantly, it must reliably select just one site. If a cell grew two buds simultaneously, during mitosis the duplicated chromosomes might be segregated between the parent cell and one bud, leaving the other bud without chromosomes and therefore inviable. In haploid yeast, this so-called singularity of budding is guided
by a signal, or cue, left at the cell surface, which directs the next budding event to a site adjacent to the former budding site. Remarkably, if the genes that specify the nonessential components of this cue are deleted, yeast cells grow just as well, but each assembles a single bud at a random site. Thus yeast has an intrinsic polarity program that, even in the absence of cues from the previous budding cycle, can guide selection of a single site for bud growth. This program requires the concentration of Cdc42 at the site from which a bud will emerge. Surprisingly, Cdc42 concentration at the site for a new bud does not depend on either actin filaments or microtubules, as this small GTPase localizes to a single spot even when both filament systems are disrupted (Figure 22-23a). Long before biologists had thought about how this might occur, the brilliant mathematician and computer pioneer Alan Turing considered what mechanism might shift a uniform distribution of a factor to a concentration at a single site. In 1952, Turing suggested that such a shift could be achieved if a positive feedback reaction amplified a random increase in the concentration of the polarity factor — and he was right!
FIGURE 22-23 The intrinsic polarity program of budding yeast involves a positive feedback loop for activation of the GTPase Cdc42. (a) Diploid yeast lacking polarity cues show polarized Cdc42, visualized here by immunofluorescence microscopy, when they are about to assemble a bud. The cells were treated with drugs to disassemble both actin filaments and microtubules to show that polarization of Cdc42 is not dependent on these cytoskeletal filaments. (b) Positive feedback loop for activation of Cdc42. Inactive Cdc42·GDP is in equilibrium between a cytosolic pool of complexes with the guanine nucleotide dissociation inhibitor (GDI) and a membrane-bound pool. Step 1 : One of the membrane-associated Cdc42⋅GDP proteins may spontaneously become an activated Cdc42⋅GTP. Step 2 : Active Cdc42⋅GTP recruits a complex containing the guanine nucleotide exchange factor (GEF). Step 3 : The recruited GEF now locally converts more Cdc42⋅GDP to Cdc42⋅GTP. Step 4 : This active Cdc42⋅GTP recruits more GEF, driving a
positive feedback loop that results in the local accumulation of Cdc42⋅GTP (visualized as bright red puncta). See J. G. Chiou, M. K. Balasubramanian, and D. J. Lew, 2017, Annu. Rev. Cell Dev. Bi. 33:77. [Part (a) reprinted with permission from Nature Publishing Group, from J. E. Irazoqui, A. S. Gladfelter, and D. J. Lew, 2003, “Scaffold-Mediated Symmetry Breaking by Cdc42p,” Nat. Cell Biol. 5(12):1062–1070; permission conveyed through Copyright Clearance Center, Inc.] Description The micrograph labeled (a) shows 10 yeast cells, some are making buds. The illustration labeled (b) shows the plasma membrane with the exterior and cytosol labeled. In the cytosol, a diagram goes from left to right, beginning with a red rectangle labeled C d c 42, giving off G D P to the right, with a model of the exchange from G D P to G D I below. An arrow to the right shows G T P going in and G D P coming out. The next rectangle of C d c 42 shows a tab forming at the bottom. An arrow to the right shows a blue structure labeled effector and yellow structure labeled G E F being added. The rectangle now has the effector attached to the tab at the bottom. An arrow to the right shows G T P going to the rectangle which now has another rectangle next to it with an arrow showing G T P in and G D P out. The last diagram shows multiple red rectangles. At the bottom of this diagram is a set of 5 circles with a view from the membrane surface. In circle 1, from the left, there are many blue dots. In circle 2, one red dot shows at the center, In circle 3, one red dot and one orange dot show at the center. In circle 4, 12 red dots and one orange dot shows in the center. Circle 5 shows several red dots, 8 orange dots and a few light blue dots now in the center. This circle has the label: Site of enriched C d c 42-G T P at which bud will form. Recall that Cdc42 is a member of the Rho family of small GTP-binding proteins (see Figure 17-40). It acts as a molecular switch, existing in an inactive (Cdc42⋅GDP) and an active membrane-bound (Cdc42⋅GTP) state. Binding to its specific guanine nucleotide exchange factor (Cdc42-GEF) causes Cdc42 to release GDP and bind GTP. The active Cdc42⋅GTP binds
many effectors and thereby activates downstream signaling events. In its inactive state, Cdc42⋅GDP exists in equilibrium between a cytosolic pool, which is bound to a guanine nucleotide dissociation inhibitor (GDI), and a membrane-bound Cdc42⋅GDP pool (Figure 22-23b). Occasionally and randomly, the membrane-bound Cdc42⋅GDP will release its GDP and bind GTP, which converts it to the active Cdc42⋅GTP state (Figure 22-23b, step 1 ). One of the effectors that is recruited to Cdc42⋅GTP is a protein complex that contains the Cdc42-GEF (Figure 22-23b, step 2 ). Thus when an active Cdc42 arises in the plasma membrane, it recruits Cdc42GEF, which locally activates more Cdc42, which recruits more Cdc42GEF, and this simple positive feedback loop generates a site on the cell surface that is highly and locally enriched for Cdc42⋅GTP (steps 3 and 4 ). Computational modeling — also pioneered by Turing — shows that this system can result in a winner-takes-all scenario to yield just one site of polarization. This positive feedback loop is the core mechanism by which one budding site is generated in yeast. As we discussed in Chapter 18, Cdc42 is the master regulator that guides the polarization of migrating cells (see Figure 18-54) and is also involved in regulating many additional examples of cell polarity. It is important to note that in cases in which polarization needs to be flexible, negative feedback loops ensure that the single site of polarization is not too strong, so that it can be redirected to another site on the cell surface upon receiving appropriate signals. For example, in addition to its fast-acting GEF, Cdc42⋅GTP might also recruit a slow-acting negative regulator that modulates the degree of positive feedback. In fact, yeast Cdc42 recruits a kinase that phosphorylates and inhibits the recruited Cdc42-GEF, thereby
Cell Polarization Before Cell Division Follows a Common Hierarchy of Steps
introducing a negative feedback loop. Thus the local concentration of Cdc42⋅GTP builds up fast, then levels off or disappears as the slower negative regulator comes into play. As we will see, specific cues normally guide these intrinsic polarity programs, which in turn lead to the physical polarization of the cell. Cell Polarization Before Cell Division Follows a Common Hierarchy of Steps The polarization of a cell, with or without cell division, follows the general pattern diagrammed in Figure 22-24a. In order to know in which direction to polarize, or become asymmetric, a cell generally senses specific cues that provide it with spatial information (step 1 ). Such cues can be soluble signals from other cells or from the extracellular matrix. To be receptive to these cues, a cell must have appropriate receptors or other machinery on its surface (step 2 ). Once the cues have been detected, the cell responds by feeding the incoming signal into its polarity program to define the orientation of polarity (step 3 ). Generally the next step involves the local reorganization of cytoskeletal elements, notably microfilaments and microtubules (step 4 ). Once the cell has structural asymmetry, molecular motors direct the trafficking of polarity factors — which, depending on the system, may be cytoplasmic proteins or membrane proteins synthesized by the secretory pathway, or both — to their appropriate locations (step 5 ). The polarity can be reinforced or maintained by moving the polarity determinants from sites of lower
concentration back to the polarization site to maintain the highest concentration there (step 6 ).
FIGURE 22-24 General features of cell polarity and asymmetric cell division. (a) General hierarchy of the steps in generating a polarized cell. See text for details. (b) To generate cells with different fates, specific determinants, including mRNAs, proteins, and lipids, must be asymmetrically distributed in a cell. If the mitotic spindle is positioned so that these determinants are segregated during cell division, the two daughter cells will have different fates. However, if the mitotic spindle is not oriented appropriately, the determinants will not be segregated properly, and the daughter cells could have the same fate (not shown).
Description In the illustration labeled (a) the following steps show the direction of cell polarity. 1. A cell contains cue receptors on its surface. 2. The cue is sensed by binding of the cue to receptors, asymmetric binding leads to steps 3 and 4. Signal transduction leading to cytoskeletal reorganization. The cytoskeleton moves toward one pole of the cell. 5. The polarity determinants are moved to the surface of the cell. 6. Reinforcement of the polarity determinants. The illustration labeled (b) shows a polarized parent cell with the nucleus over to the right of the cell. In the cell division step, red dots are at the left only and labeled localized determinants (protein or m R N A). At the right, no red dots are seen. A label on the right reads, asymmetric localization of cell fate determinants. The mitotic spindle is labeled. At the bottom of the diagram, is the two daughter cells. The left cell has a horizontal rectangle shape and has the red dots at the left end. The right cell is a vertically oriented oval with no dots and the nucleus over to the right. If a cell becomes polarized and cell division then occurs in a plane perpendicular to the direction of polarization, the cell has undergone asymmetric cell division. In this way, fate determinants, such as specific proteins or mRNAs, can be differentially segregated between the cells (Figure 22-24b). Cell polarization can be a very dynamic process. Consider a macrophage chasing a bacterium in order to catch and destroy it by phagocytosis: the macrophage must continually sense the bacterium, which it does by following a gradient of a peptide left by the bacterium (see Figure 17-45). This signal orients — or polarizes — the macrophage to move in the correct direction. This example highlights an important and common aspect of cell polarity: in many cases, it must be dynamic so that it can quickly change direction. Although we have illustrated the dynamics of
Polarized Membrane Traffic Allows Yeast to Grow Asymmetrically During Mating
cell polarity in terms of a macrophage, the polarity of epithelial and other cells that appear very static is probably quite dynamic when those cells are moved to different environments. In the next section, we discuss a simple cell that shows asymmetry: a yeast cell responding to a soluble cue during mating. In later sections, we turn to animal cells, in which conserved polarity proteins are instrumental in interpreting polarity cues and generating cell asymmetry prior to cell division. We then consider how these same polarity proteins are used to polarize epithelial cells. Finally, we discuss aspects of asymmetric division in stem cells. Polarized Membrane Traffic Allows Yeast to Grow Asymmetrically During Mating One of the simplest and best studied forms of cell asymmetry occurs when budding yeast cells mate. As we have seen, yeast can exist in a haploid state (with a single copy of each chromosome) or a diploid state (with two copies of each chromosome). The haploid state can exist in either of two mating types (“sexes”), a or α. The preferred state of yeast in nature is the diploid state, so a cells are always looking to mate with α cells to restore the diploid state (see Figure 1-24b). Each mating type secretes a specific mating pheromone — a cells secrete a factor and α cells secrete α factor — and each cell expresses on its surface a receptor that senses the pheromone of the opposite mating type. Thus a cells have a receptor for α
factor and α cells have a receptor for a factor (see Figure 16-15). When cells of opposite mating types are placed near each other, the receptors on each cell bind and detect the pheromone cue of the other cell and determine its spatially highest concentration in order to know in which direction to mate. When the cells detect the opposite mating factor, two important processes occur. First, they synchronize their cell cycles by arresting at so that when they mate, the two haploid genomes will be at the same stage of the cell cycle. Second, they target cell growth in the direction of the pheromone to assemble a mating projection called a shmoo. If shmooing cells of opposite mating types touch, they fuse at the shmoo tips, and the haploid nuclei come together to restore the diploid state. By looking for mutants in yeast haploids that cannot shmoo in response to the opposite mating pheromone, researchers have discovered how the asymmetric growth necessary for shmoo formation occurs (Figure 22-25). This mechanism initially involves a signal transduction pathway that establishes a polarized cytoskeleton, which in turn guides membrane traffic to the appropriate location for asymmetric growth. Activation of the mating-factor receptor — a typical G protein–coupled receptor (see Figures 15-12 and 16-15) — results in activation of the intrinsic polarity program, which in turn results in the localized accumulation and activation of Cdc42 in the region of the cell cortex closest to the pheromone source (Figure 22-25, step 1 ). This active Cdc42⋅GTP leads to the local activation of a formin protein (step 2 ). As we saw in Chapter 17, formin proteins nucleate the assembly of polarized actin filaments, whose ends remain bound to the formin (see Figure 17-13). This
process provides the tracks for the transport of secretory vesicles by a myosin V motor to the ends of the filaments for localized growth and hence shmoo formation (step 3 ). Notice that this mechanism requires polarity proteins, which include Cdc42⋅GTP, to remain concentrated at the growing shmoo tip. To ensure that polarity is maintained during shmoo growth, a directed endocytic cycle is believed to exist. In this cycle, polarity factors that have diffused away from the site of concentration may be internalized by endocytosis and transported back to the shmoo tip, thereby reinforcing polarity (step 4 ).
FIGURE 22-25 Mechanism of shmoo formation in yeast. (a) The haploid yeast cell must grow toward the highest concentration of mating factor of the opposite mating type: a receptor on its surface signals the location of the highest concentration. This signal induces the localization and activation of Cdc42 to generate a higher concentration of Cdc42⋅GTP at this site (step 1 ). The Cdc42⋅GTP locally activates a formin, which nucleates and elongates actin filaments from this site (step 2 ). Because formins bind to the ends of actin filaments, the ends are oriented toward Cdc42⋅GTP and thus the highest concentration of the mating factor. A myosin V motor transports secretory vesicles along the actin filaments, resulting in the growth of the shmoo (step 3 ). The polarity of the shmoo can be reinforced by an endocytic cycle that returns diffusing polarity factors back
The Par Proteins Direct Cell Asymmetry in the Nematode Embryo
along the actin filaments to the signal site (step 4 ). (b) Differential interference contrast (DIC) light-microscope image of a shmooing yeast cell. Description In the illustration labeled (a), the following steps show the formation of shmoo in yeast. 1. Pheromones concentrated at one part of the cell-induced localized signal transduction, resulting in the localization of c d c 42-G T P. 2. Formin is activated, causing nucleation of the actin assembly. Actin cables form with their plus ends at the cell cortex. 3. Directed secretion by myosin five occurs. 4. Polarity is reinforced by endocytic recycling. The Par Proteins Direct Cell Asymmetry in the Nematode Embryo The nematode roundworm Caenorhabditis elegans has provided a powerful model system for understanding cell fate decisions (see Figure 123c). It was selected for study because the animal is transparent and has a rapid life cycle; it is easy to generate and characterize mutants; and the lineage of cells from the one-cell embryo to the adult is invariant (Figure 22-26a, c, d). A critical aspect of this lineage is the first cell division, in which the P0 cell — the fertilized egg, or zygote — gives rise to the AB and P1 cells by an asymmetric cell division; each of these two cells then gives rise to different lineages. Much is known about this first asymmetric division, which is where we focus our attention.
FIGURE 22-26 Cell lineage in the nematode worm C. elegans. (a) Pattern of the first few divisions, starting with P0 (the zygote) and leading to formation of the six founder cells (yellow highlights). The first division is asymmetric, giving rise to the AB and P1 cells. The EMS cell is so named because it gives rise to most of the endoderm and mesoderm. The P4 lineage gives rise to the cells of the germ line. (b) Micrographs of two-, four-, and eight-cell embryos. DNA is stained blue, the nuclear envelope red, and P granules green. The P1, P2, and P3 cells, which give rise to the germ line, are indicated. (c) The full lineage of the entire body of the worm, showing some of the tissues formed. Cell division is indicated by the
splitting of a line, and the time of cell division is indicated in the vertical direction. (d) Newly hatched larva. Some of the 959 somatic-cell nuclei found in the adult hermaphrodite form can be seen in this micrograph obtained by DIC microscopy. [Part (d) republished with permission from Elsevier, from J. E. Sulston and H. R. Horvitz, 1977, “Post-Embryonic Cell Lineages of the Nematode, Caenorhabditis elegans,” Devel. Biol. 56(1):110–156; permission conveyed through Copyright Clearance Center, Inc.] Description In the illustration labeled (a) P 0 cells branch into two types of cells A B, and P 1. Text below the A B reads neurons, hypodermis, pharyngeal muscle, body muscle, and others. P 1 cells branch into E M S and P 2. E M S branches into M S and E. The text below the M S reads, body muscle, pharyngeal muscle, neurons, glands, somatic gonads, and others. The text below the E reads, gut. The P 2 cells further branch into C cells and P 3. The text below the P 3 reads, hypodermis, body muscle, and neurons. The P 3 cells branch into P 4 and D. The text below the P 4 and D reads, germ cells, and body muscle, respectively. The illustration labeled (c) shows many tree branches below the zygote. One section at the left is labeled pharynx. Next to this is a longer section labeled epidermis. A crisscrossing section is labeled neurons, and below the neurons is a section labeled vulva. Toward the right is a section labeled intestine, below which is a section labeled somatic gonad. The last label at the right is germline. The micrograph labeled (d) shows the nematode C. elegans larva. From left to right, the body parts are labeled: mouth, pharynx, excretory cell, dorsal nerve cord, intestine, ventral nerve cord, intestinal lumen, gonad, intestinal nuclei, ventral nerve cord nuclei, rectum, anus. The scale bar reads 20 micrometers. Before the first cell division, the zygote is visibly asymmetric: cytoplasmic complexes called P granules are concentrated in the region of the cell that will give rise to the posterior end of the embryo (Figure 2226b). It turns out that during further cell divisions, these P granules always segregate to cells that will give rise to the germ line, where they ultimately play an important role in germ-line development. The first
asymmetric division of the P0 cell gives rise to the P1 cell, containing the P granules, and the larger AB cell. Following that, at the two-cell stage, the mitotic spindles are arranged at right angles to one another so that the ensuing cell divisions are also at right angles to one another (Figure 2227a). To begin to understand how this first essential asymmetric division occurs, mutations in six different genes were identified that resulted in a symmetric first division. Since the P granules were not partitioned correctly in these mutants, the genes identified in this study were called partition defective, or par, genes. In these mutants, P granules did not properly localize to the posterior end of the zygote, and the mitotic spindles were not oriented correctly in preparation for the second division (see Figure 22-27a). A key insight came when the products of the par genes were localized. In wild-type zygotes, many of the Par proteins localize either at the cortex of the anterior half of the cell or at the cortex of the posterior half. For example, Par3 localizes anteriorly and recruits the other components of the anterior complex comprising Par6 and aPKC (atypical protein kinase C), while Par1 and Par2 localize posteriorly (Figure 22-27b). Subsequent work has shown that mutually antagonistic interactions exist between these protein complexes; that is, if the Par3Par6-aPKC complex is localized to one region, it excludes Par2, and vice versa. This is shown by the finding that the Par3-Par6-aPKC complex spreads over the whole cortex in par2 mutants and Par2 spreads over the whole cortex in par3 or par6 mutants. The molecular nature of this antagonism to generate mutual exclusion is partly mediated by the protein kinase aPKC, which phosphorylates any local Par1, inhibiting its ability to bind to the anterior cortex. In a reciprocal manner, the Par1 kinase phosphorylates any local Par3 to inhibit its association with the cortex
(Figure 22-26c). Additionally, the anteriorly localized Par6 now recruits Cdc42⋅GTP to maintain the functional polarity of the zygote, and a GTPase activating protein Cdc42-GAP that deactivates Cdc42. GTP is recruited to the posterior end to ensure that any active Cdc42⋅GTP is confined to the anterior end. EXPERIMENTAL FIGURE 22-27 Par proteins are asymmetrically localized by antagonistic interactions in the one-cell worm embryo. (a) DIC images of wild-type and par3 mutant embryos. In wild-type cells, the AB cell is larger than the P1 cell, whereas they are the same size in the par3 mutant. The par3 mutant also has a defect in spindle orientation (as seen by microtubule staining in green) and P-granule (red) segregation. DNA is stained blue. (b) Complementary localization of the anterior Par complex (Par3-Par6aPKC) (red) and posterior determinants (green) in the one-cell embryo. (c) Antagonistic interactions between the anterior and posterior Par complexes. When Par3 becomes localized to the anterior it recruits the other members of the complex, Par6 and aPKC. The kinase activity of aPKC can phosphorylate local Par1, which inhibits its association with the anterior cortex. Par1 and Par2 associate with the posterior complex, and Par1 kinase can phosphorylate any Par3 to locally inhibit its association with the posterior cortex.
Description The D I C labeled (a) shows two-cell embryos, one a wild type worm embryo and the other a p a r 3 mutant. In the mutant, the cell sizes are equal, whereas in the wildtype, the A B cell is larger than the P 1 cell. In the mutant, the spindles are arranged parallel, whereas in the wildtype, the spindles are oriented perpendicular to each other. In addition, in the wild type cells, p granules are localized in the P cell, whereas in the mutant, they are distributed between the two cells. The fluorescence micrograph labeled (b) shows one cell embryo photo that has a label on the left that reads: Anterior complex (C d c 42, P a r 3, P a r 6, a P K C). A label on the right side of the photo reads: posterior factors (e.g., P a r 1, P a r 2). The illustration labeled (c) shows a schematic of (b). It has the labels anterior and posterior at the top. In the anterior side, pink circles are labeled P a r 3, P a r 6, C d c 42, a P K C. From the a P K C a line goes toward an arrow that points a blue circle labeled P a r 1 from the green circle labeled P a r 1. On the posterior side, P a r 3 is in a red circle that leads to a pink circle labeled P a r 3 and one arrow coming to it from a green circle labeled P a r 1 which is attached to a green circle labeled P a r 2. The unfertilized egg is symmetric, so what breaks this symmetry to generate a polarized zygote? It turns out that the position of the sperm that fertilizes the egg determines the posterior end. Prior to sperm entry, the entire egg cortex is under tension provided by an actin meshwork containing active myosin II. As we saw in Chapter 17, myosin II can form bipolar filaments that pull on actin filaments to generate tension, as is also seen in muscle and the contractile ring. Myosin II activity is regulated by a signal transduction pathway involving the small GTPase Rho (see Figure 17-42). In the unfertilized egg, Rho is maintained in its active Rho⋅GTP state by the uniform distribution of its activator, the guanine nucleotide exchange factor Rho-GEF. Rho⋅GTP activates Rho kinase, which phosphorylates the myosin light chain of myosin II to activate it (Figure 22-28a). Shortly after fertilization, the Aurora-A kinase activity associated
with the sperm centrosome results in the local depletion of Rho-GEF activity. Thus the asymmetric position of the sperm centrosome defines the posterior region by local depletion of Rho⋅GTP, thereby lowering the activity of myosin II. With this local reduction in contractile activity, the actin-myosin network contracts toward the anterior (Figure 22-28b), and as it does so, it transports Par3 to the anterior region, where Par3 then recruits the additional components of the anterior complex (Par6 and aPKC) (Figure 22-28c). With the removal of the anterior complex, Par2 can now occupy the posterior cortex, the antagonistic interactions described above come into play, and cell asymmetry is established.
FIGURE 22-28 Mechanism of segregation of the anterior Par complex in the one-cell worm embryo. (a) Before fertilization, the cell cortex is under tension due to the activity of Rho-GEF, the guanine nucleotide exchange factor for the small GTPase Rho. Rho⋅GTP activates Rho kinase, which phosphorylates the regulatory light chain of myosin II to activate it. Together with actin filaments, the active myosin II maintains tension in the cell cortex. (b) Localization of myosin II before (top) and after (bottom) fertilization. The asterisk marks the region of sperm entry. (c) Before fertilization, Rho-GEF is uniformly active, the cortex is under tension from active myosin II, and the anterior Par complex is uniformly distributed around the cortex. Upon fertilization, Rho-GEF becomes locally reduced, resulting in local deactivation of myosin II. This deactivation generates unequal tension, so the actin-myosin network contracts toward the future anterior end, moving Par3 with it, which then associates with Par6 and aPKC. Once the anterior complex is localized, factors such as Par2 associate with the posterior cell cortex. [Part (b) republished with permission from Elsevier, from E. Munro, J. Nance, and J. R. Priess, 2004, “Cortical Flows Powered by Asymmetrical Contraction Transport PAR Proteins to Establish and Maintain Anterior-Posterior Polarity in the Early C. elegans Embryo,” Dev. Cell, 2004, 7(3):413–424; permission conveyed through Copyright Clearance Center, Inc. Part (c) Data from D. St. Johnston and J. Ahringer, 2010, Cell 141:757.] Description The illustration labeled (a) is a flow chart that shows the following steps: R h o-G E F leads to R h o-G T P leads to Rho-kinase leads to active myosin 2 leading to and ending in cortical tension. The micrograph labeled (b) shows the myosin filaments that have been moved to one side of the cell after fertilization. Two arrows indicate the division between the cell with and without myosin 2. Within the portion containing no myosin 2, a star indicated the location of sperm entry. The illustration labeled (c) shows a cell diagram at the top. The maternal pronucleus is labeled and is a blue circle at the left of the cell. Crosshatches evenly spaced across the cell are labeled actin-myosin network. The spaces made by the network are labeled uniform R h o-G E F activity. At the top left, a label reads anterior P a r complex (C d c 42, P a r 3, P a r 6, a P K C). A downward arrow is labeled fertilization. The fertilized cell at the bottom shows the label anterior P a r complex at the top left of the cell. The actin-myosin network is dissolving away, with more R h o-G E F activity at the left of the cell near the maternal pronucleus. A paternal pronucleus is a blue circle at the right of the cell. An arrow at
The Par Proteins and Other Polarity Complexes Are Involved in Epithelial-Cell Polarity
the left side indicates site of sperm entry. A green line along the inside of the right side of the cell is labeled P a r 2. It turns out that the master regulator Cdc42 is not needed for the initial asymmetry induced by actin-myosin network contraction. However, active Cdc42⋅GTP binds Par6 and is necessary for maintaining the anterior complex at the anterior end. Recent work has also implicated an endocytic reinforcement cycle, as we discussed for yeast shmoo formation, to maintain polarity. Thus the steps of responding to a spatial cue, establishing asymmetry, and maintaining asymmetry are conserved features of both systems. The Par Proteins and Other Polarity Complexes Are Involved in EpithelialCell Polarity In vertebrates, polarized epithelial cells use cues from adjacent cells and the extracellular matrix to orient their axis of polarization. The process of polarization in epithelial cells of vertebrates is quite similar to that in Drosophila. Much of our knowledge has come from the fly system because of the ease with which mutants can be isolated and analyzed. Genetic screens in the fly have uncovered multiple genes necessary for the generation of epithelial-cell polarity. Analyses of the proteins encoded by these genes and of the phenotypes of mutants have identified three major groups of proteins: the complex made up of Cdc42, Par3, Par6, and aPKC
(in this system known as the apical Par complex, or simply as the Par complex), the Crumbs complex, and the Scribble complex. By extensive analyses of the effects of these complexes on one another when individual components are missing, a general understanding of their contributions to epithelial-cell polarization has been achieved, although a detailed molecular understanding is still emerging (Figure 22-29a).
FIGURE 22-29 Establishment of polarity in epithelial cells. (a) Polarity determination in epithelial cells is driven by an apical Par complex. The formation of a cell-cell adhesion complex induces the recruitment of the Par complex. Then, intricate and antagonistic interactions of the Par complex with both the basolateral Scribble complex and the apical Crumbs complex lead to the establishment and maintenance of epithelial-cell polarity. The localization of the different complexes to membrane domains is indicated by colored bars: the Scribble complex associates with the lateral membrane, the Par complex associates with the region at the cell junctions, and the Crumbs complex is immediately apical to the Par complex. Functional epithelial polarity is maintained by both (b) a polarized cytoskeleton and (c) membrane trafficking pathways. In the biosynthetic pathway, proteins and lipids destined for the apical and basolateral domains are sorted in the Golgi complex and transported to their respective surfaces (red arrows). Endocytic pathways (blue arrows) regulate the abundances of proteins and lipids on each surface and sort them between surfaces by transcytosis. Description
The illustration labeled (a) shows a flowchart that begins with a white rectangle labeled adhesion complex. An arrow to the right points to a blue rectangle labeled apical P a r complex. The blue rectangle has an arrow pointing upward to a red rectangle labeled crumbs complex. A downward line without an arrow moves from there to a green rectangle labeled scribble complex. The crumbs complex has an arrow that points to the top of the schematic (b) and (c). The scribble complex points to the lower layers of these schematics. The illustration labeled (b) shows a castle top-shaped area at the top, labeled microvilli at the top and apical domain at the left. Below this is an area labeled basolateral domain that shows various unlabeled shapes such as a blue oval in the center, green, red, and blue lines around the edges. The illustration labeled (c) shows the same shape, but without the microvilli inside the castle-shaped top. The Golgi body is labeled with arrows pointing to the top, left, and right of the cell. At the right, a yellow squiggle and a yellow rectangle are labeled cell junctions (tight and adherens.) The second label points to a white rectangular shape and is labeled apical endosome. The third label points to two blue lines and is labeled transcytosis pathways. The bottom label points to another white rectangle and reads, basal endosome. At the bottom of both (b) and (c) is a blue layer labeled extracellular matrix. The first known steps in epithelial-cell polarization are interactions with the extracellular matrix and adjacent cells. The transmembrane protein b1integrin binds to collagen in the extracellular matrix, signaling that this is the basal end of the cell. Interaction with adjacent cells in vertebrates occurs through nectin, a cell-adhesion molecule in the Ig superfamily, and a junctional protein called JAM-A. This induces the formation of adherens and tight junctions (see Figure 20-1) and then the apical recruitment of Par3. By Par3 interacting with other members of the apical complex — Par6 and aPKC — the Crumbs complex is recruited more apically than the Par complex, and the Scribble complex defines the basolateral surface. In the absence of the Par complex, cells cannot polarize, and, as in the nematode embryo, the Par complex is the master regulator of cell polarity.
In the absence of the Scribble complex, the apical domain is greatly expanded, whereas in the absence of Crumbs, the apical domain is greatly reduced. These observations have led to the realization that there are mutually antagonistic relationships between these complexes, in which, for example, the apical Par complex kinase aPKC antagonizes the basolateral Scribble complex by phosphorylation, and the basolaterally localized Par1 kinase antagonizes the apical Crumbs complex (see Figure 22-29a). Thus, as is the case in the nematode embryo, asymmetry is mediated by polarity complexes working antagonistically against each other. In a manner that is only partially understood, this arrangement of polarity proteins reorganizes the cytoskeleton so that distinct arrangements of microfilaments become associated with the apical and basolateral membranes. The distribution of microtubules in epithelial cells is rather unusual, as they do not all associate with a centrosome; instead, lateral microtubules orient their ends toward the apical domain and other microtubules run perpendicular to the lateral microtubules below the microvilli and also along the base of the cell (Figure 22-29b); how these arrangements are established is not known. Membrane traffic is also polarized (Figure 22-29c). Newly made membrane proteins destined for the apical and basolateral membranes are sorted and packaged into distinct transport vesicles at the trans-Golgi network and then transported to the appropriate surface. In addition, endocytic pathways from both the apical and basolateral surfaces regulate the abundance of membrane proteins and transport missorted proteins using a complex set of sorting endosomes in a process known as transcytosis.
The Planar Cell Polarity Pathway Orients Cells Within an Epithelium
In genetic screens for additional components important for epithelial-cell polarity in the fly, components of endocytic trafficking were found. For example, one such mutant affects the trafficking of the apical transmembrane protein Crumbs, so that when endocytosis is compromised, the level of Crumbs on the surface goes up and the apical domain expands. Thus epithelial-cell polarity involves responses to spatial cues and reorganization of the cytoskeleton that provides a framework for both secretory and endocytic membrane traffic pathways for establishment and maintenance of the polarized state. The Planar Cell Polarity Pathway Orients Cells Within an Epithelium We have so far discussed asymmetry in only one dimension, but in many cases cells in multicellular organisms are polarized in at least two dimensions — top to bottom, and along a body axis. Just looking at the scales of fish, the feathers of birds, or the hairs on your arm makes it clear that the groups of cells that give rise to these structures must be organized not only in a top-to-bottom (apical/basal) manner but also in a head-totail, or proximal/distal, manner. This type of polarity is called planar cell polarity (PCP). A well-studied example from the fly is the single hair that points backward on each cell of the wing (Figure 22-30a). As we have seen, the fly is a model system that is particularly amenable to genetic dissection. Genetic analysis has shown that each wing cell responds to the planar direction of its neighbor, and components that specifically affect PCP have been identified (Figure 22-30b). The overall planar polarity of
an epithelium is probably determined by a gradient of some ligand, such as a form of Wnt, or of mechanical tension across the tissue. This gradient polarizes all the cells in the epithelium in the same manner, causing proteins encoded by the Frizzled and Dishevelled genes to localize on one side of each cell and the proteins encoded by Vang and Prickle on the other (Figure 22-30c). Both Frizzled and Vang are transmembrane proteins, and they both associate — on opposite sides of the cell — with another membrane protein called CELSR (see Figure 22-30c). This asymmetric distribution of PCP proteins leads to the growth of the hair with the appropriate orientation. We have met Frizzled as a transmembrane receptor and Dishevelled as an adapter protein in the context of the Wnt pathway (see Figure 16-26), and their role in PCP may involve a form of Wnt and some other ligand. When components of the PCP pathway are disrupted — for example, in a Dishevelled mutant — the epithelium is intact, but the hairs are misoriented (see Figure 22-30b).
EXPERIMENTAL FIGURE 22-30 Planar cell polarity (PCP) determines the orientation of cells. (a) The hairs on each cell of the fly wing all point in the same direction in a wildtype fly. (b) In a fly defective in PCP, as in this Dishevelled mutant, the orientation of the
hairs becomes disorganized, although the cells in the epithelium are still well organized. (c) The directionality of the hair is determined by the asymmetric localization of components of the PCP pathway, as indicated for Frizzled and Dishevelled, and Vang and Prickle, all of which are needed for orienting the hair appropriately. Planar cell polarity is propagated across a tissue due to two mechanisms. First, Frizzled associated with CELSR on one cell binds to CELSR associated with Vang on the adjacent cell. Second, within each cell, the distribution of Frizzled and Vang is mutually exclusive due to antagonism between their protein complexes. (d) The sensory hair cells of the vertebrate inner ear have V-shaped arrangements of stereocilia on their surface. In the adult and 18.5-day embryo (top and center images), all the cells are oriented in precisely the same way. In a mouse Celsr1 mutant defective in PCP, the cells in the 18.5-day embryo appear normal, but their relative orientations are disrupted (arrows in bottom panel). Scale bars = 2.5 μm. [Parts (a) and (b) reprinted with permission from John Wiley & Sons, Inc., from J. D. Axelrod and C. J. Tomlin, 2011, “Modeling the Control of Planar Cell Polarity,” Wiley Interdiscip. Rev.: Syst. Biol. Med. 3(5):588–605; permission conveyed through Copyright Clearance Center, Inc. Part (d) republished with permission from The Company from Biologists Ltd., from M. Fanto and H. McNeill, 2004, “Planar Polarity from Flies to Vertebrates,” J. Cell Sci. 117(Pt4):527–533; permission conveyed through Copyright Clearance Center, Inc.] Description The illustration labeled (c) shows a schematic of fly hairs. It shows hexagon-shaped cells, each with a hair coming out of it. There are green dots around the left sides of the rectangles which are labeled Vang and Prickle. There are red dots along the right sides of the hexagons which are labeled frizzled and disheveled. A closeup of one hexagon shows one area of green and red dots. An arrow from the closeup leads to a threedimensional ribbon model that shows how the Vang, Prickle, Frizzled, and Disheveled parts are arranged. A section on the Vang and Frizzled is labeled C E L S R. A very dim pink and blue background is behind these items and is labeled plasma membranes of adjacent cells. The micrograph labeled (d) shows three images, the first image is labeled wild-type adult and shows even rows of rectangles and scale shapes stacked up. The middle image is labeled wild-type 18.5 d embryo and shows no rectangle shapes, but all rounded scale shapes. The bottom image is labeled C e l s r 1 mutant 18.5 d embryo and shows the scales which are not in neat rows.
The Par Proteins Are Involved in Asymmetric Division of Stem Cells
The complementary arrangement of PCP components means that the membrane protein Vang on the side of one cell will be adjacent to the Frizzled protein on the adjacent cell. As indicated above, each protein associates with CELSR and it is believed that CELSR can adopt two distinct states, one with Frizzled and one with Vang. Like the polarity complexes in nematodes and flies, these protein complexes show intracellular mutual antagonism (see Figure 22-30c). Thus when Frizzled on one cell is next to Vang on the adjacent cell, that adjacent cell will enrich Frizzled on its opposite side, where it will associate with Vang on the next cell, and this pattern will repeat across the tissue. In this way, complementary interactions between complexes containing Frizzled and Vang between cells and their mutual antagonism within a cell propagate PCP across a whole tissue. Another clear example of PCP is the sensory hair cells of the inner ear that allow vertebrates to perceive sounds. Each of these cells has an ordered array of stereocilia (actin-based structures on sensory cells in the ear, which are required for hearing — see Figure 17-20b) arranged in a Vshaped pattern, and each cell is oriented precisely like its neighbor. In a mouse with a defect in the PCP gene Celsr1, the orderly arrangement of stereocilia within any given cell is preserved, but the relative orientations of cells to one another are disrupted (Figure 22-30d). These types of defects can result in deafness.
The Par Proteins Are Involved in Asymmetric Division of Stem Cells We have seen that stem cells often give rise to a daughter stem cell and a differentiated daughter cell (see Figure 22-12). What are the cues that set up these asymmetric cell divisions? Two types of mechanisms have been found (Figure 22-31). In one mechanism, cell fate determinants are segregated to one end of the cell before cell division in response to external cues. This mechanism involves the Par proteins, which, as we have already seen, are instrumental in the first asymmetric division of the nematode embryo and in establishing epithelial-cell polarity. In the second mechanism, the stem cell divides with a reproducible orientation so that it remains associated with the stem-cell niche, whereas the daughter cell is displaced away from the niche and can then differentiate. This is the situation we have already encountered in the Drosophila ovary, where the cap cells form a niche for the germ-line stem cells (see Figure 22-13).
FIGURE 22-31 Two ways that stem cells can be induced to divide asymmetrically. (a) In response to an external cue, the cell polarizes and fate determinants become segregated before cell division. Division then produces one stem cell and one differentiating cell. (b) Stem cells interacting with a stem-cell niche orient their mitotic spindle to give rise to a stem cell associated with the niche and a differentiating cell displaced from it. See S. J. Morrison and J. Kimble, 2006, Nature 441:1068. Description The illustration labeled (a) shows a schematic of cell division. It shows the cell dividing at the top, with red dots at the left and no red dots at the right. Below this is the daughter cells, one of which is in a horizontal orientation with red dots, and the other in a vertical orientation with no dots. The illustration labeled (b) shows cell division with a pink stem-cell niche behind the left side of the dividing cell and only found on one daughter cell. A particularly well-understood example of the asymmetric division of stem cells is the formation of neurons and glial cells in the central nervous
system of the fly (Figure 22-32). In this system, a neuroblast stem cell arises from the neurogenic ectoderm, which is a typical epithelial layer with apical and basal surfaces. The neuroblast enlarges (step 1 ) and moves basally into the interior of the embryo but remains in contact with the neurogenic ectoderm epithelium (step 2 ). It then divides asymmetrically (step 3 ) to give rise to a new neuroblast and a ganglion mother cell (GMC) (step 4 ). The GMC can divide only once, giving rise to two cells, either neurons or glial cells. The neuroblast, which remains a stem cell by maintaining an association with the neurogenic ectoderm niche, can divide repeatedly, giving rise to many ganglion mother cells and hence neurons and glial cells (step 5 ) and thus populates the central nervous system. Thus the key event is the ability of the neuroblast to divide asymmetrically (Figure 22-32b). Once again, this process involves the asymmetric accumulation of the apical Par complex — Par3-Par6aPKC — and its positioning at the side of the cell closest to the epithelium in an antagonistic relationship with Scribble. Par3 recruits factors that interact with the astral microtubules emanating from the spindle pole to orient the spindle — and hence cell division (Figure 22-32b). Other polarity-determining factors are then positioned at the basal side of the cell by an adaptor protein called Miranda, so that cell division segregates these factors (Figure 22-32c). Miranda associates with factors that control proliferation and differentiation so they are segregated away from the neuroblast and into the GMC following cell division.
FIGURE 22-32 Neuroblasts divide asymmetrically to generate neurons and glial cells in the central nervous system. (a) Neuroblasts, which are stem cells, originate from the neurogenic ectoderm by means of signals that induce them to enlarge (step 1 ). They then move basally out of the ectoderm but remain in contact with it (step 2 ). Neuroblasts then undergo an asymmetric division (step 3 ) that produces a neuroblast and a ganglion mother cell (GMC) (step 4 ). The GMC then divides once to give two neurons or glial cells (step 5 ). Meanwhile, the neuroblast can divide many times to produce more GMCs, populating the neural tissue. (b) The asymmetric division of the neuroblast requires the correct orientation of the mitotic spindle, mediated by the apical Par complex and distal Miranda complex, to give rise to a larger neuroblast and a smaller GMC. (c) A neuroblast at anaphase, showing the segregation of the apical Par proteins (blue) and the basal Miranda protein (red). Description The flowchart labeled (a) shows the following steps: 1. A line of cells comprising the neurogenic ectoderm with an enlarged cell in the middle. The apical and basal surfaces are labeled. 2. The enlarged cell moves out of the ectoderm onto the basal surfaces, remaining in contact with the neurogenic ectoderm; this is the neuroblast. 3. Asymmetric cell division occurs. 4. A ganglion mother cell is thus formed below the neuroblast. 5. Neurons and glial cells form from the ganglion mother cell. The illustration labeled (b) shows two neuroblast schematics. The left one is a round structure labeled interphase neuroblast. The interphase neuroblast has the top labeled apical and the bottom labeled basal. At the top of the structure, a thin blue area is
labeled apical par complex and the centrosome is large and labeled near the top of the diagram. The one on the right is labeled anaphase neuroblast. This one has astral microtubules labeled and attached to the centrosome. At the bottom of the structure is a thin red area labeled Miranda. Astral microtubules are attached to the Miranda. Chromosomes move toward the spindles. The top part of this structure turns into a neuroblast and the bottom part turns into a ganglion mother cell. The micrograph labeled (c) shows a cell with 3 labels, from top to bottom: apical par complex, mitotic spindle stained for tubulin (shows yellow in centrosome area), and Miranda. The first three sections of this chapter illustrated that all metazoan organisms have evolved complex genetic proteins to ensure that, during development, the correct number of each type of differentiated cells is formed and that these cells are positioned and polarized appropriately with respect to their neighbors. Perhaps surprisingly, many types of cells are born only to quickly die. During nematode development (see Figure 2226a), about 15 percent of the cells that are formed are programmed to die quickly. Formation of different types of antibodies against pathogens is an essential function of the B cells of the immune system (Chapter 24), and B cells that fail to produce an antibody that targets a foreign protein also are programmed to die. In the last section of this chapter, we discuss evolutionarily conserved genetic programs that regulate cell death, and learn how these are also absolutely crucial for the formation and maintenance of many body tissues (see Figure 22-1c). KEY CONCEPTS OF SECTION 22.3 Mechanisms of Cell Polarity and Asymmetric Cell Division Cell polarity involves the asymmetric distribution of proteins, lipids, and other macromolecules in the cell.
Cells have an intrinsic program that can generate polarity using feedback loops. A key regulator of the polarity program in many systems is the small GTP-binding protein Cdc42. When a yeast cell buds, the intrinsic polarity program exploits feedback loops to concentrate Cdc42⋅GTP at a single site. Asymmetry requires cells to sense a cue, respond to it by assembling a polarized cytoskeleton, and then use this polarity to distribute polarity factors appropriately. Mating in haploid yeast involves assembly of a mating projection (shmoo) by polarization of the cytoskeleton in the direction of highest concentration of mating pheromone and targeting of secretion of cellular components for cell expansion there. Anterior/posterior asymmetry in the first division of the C. elegans embryo involves asymmetric contraction of the actin-myosin network to localize the anterior Par3Par6-aPKC complex to the anterior cortex, followed by the association of posterior factors such as Par2 with the posterior cortex. The asymmetry of the anterior and posterior complexes is maintained by mutually antagonistic pathways. Apical/basal epithelial-cell polarity is also driven by an apical Par3-Par6-aPKC complex, which functions in antagonistic relationships with the apical Crumbs complex and the basal Scribble complex. Planar cell polarity (PCP) regulates the orientation of epithelial cells across a sheet using a different set of antagonistic relationships. Asymmetric cell division requires that cells first become polarized, then divide to segregate fate determinants asymmetrically. Asymmetric division of stem cells often involves association of the stem cell with a niche, in which case the stem cell gives rise to another stem cell and a differentiating cell. Asymmetric stem-cell division also involves the asymmetric distribution of the Par complex, which is retained in the stem cell during division, whereas fate determinants are localized away from the Par complex to end up in the differentiating cell.
22.4 Cell Death and Its Regulation
22.4 Cell Death and Its Regulation Regulated cell death is an essential process in metazoan organisms for the removal of cells that are harmful or no longer needed. Our focus in this section will be on one principal type of programmed cell death, termed apoptosis — a common molecular pathway that largely is conserved in invertebrates and vertebrates. During embryogenesis, programmed apoptotic death of specific cells keeps chicken feet as well as our hands from being webbed (Figure 22-33); it also prevents our embryonic tails from persisting and our brains from being filled with unneeded nerve connections. In fact, up to 50 percent of the nerve cells generated during brain development subsequently die of apoptosis because they do not develop appropriate connections with other cells. Many kinds of muscle, epithelial, and white blood cells constantly wear out and need to be removed by apoptosis and replaced. We also discuss necroptosis, one of several types of programmed cell death that vertebrate cells employ as a response to infection or other stresses. We will see that necroptosis can lead to an immune response, which in turn can either lead to amelioration of the infection or cause inflammation and extensive tissue damage.
EXPERIMENTAL FIGURE 22-33 A web-footed chicken. During the development of many vertebrate limbs, cells in the soft tissue between the embryonic digits undergo programmed cell death. In the chicken foot, this process leads to the formation of four separate toes (left). During chicken foot development, bone morphogenetic proteins (BMPs) (members of the TGF-β superfamily of hormones; see Figure 16-22a) are expressed by interdigital cells and induce apoptosis. In this experiment, a dominant-negative type I BMP receptor was expressed in a developing chicken foot, blocking BMP signaling and preventing the programmed cell death that normally occurs. This manipulation allowed the survival of cells that then divided and differentiated into a web (right). The similarity of this webbing to webbed duck feet led to studies showing that BMPs are not expressed in duck interdigital cells. These results indicate that BMP signaling actively mediates cell death in the embryonic limb. [Republished with permission from the AAAS, from H. Zou and L. Niswander, 1996, “Requirement for BMP Signaling in Interdigital Apoptosis and Scale Formation,” Science 272(5262):738–741; permission conveyed through Copyright Clearance Center, Inc.]
Cell-cell interactions regulate cell death in two fundamentally different ways. First, most, if not all, cells in multicellular organisms require specific protein hormone signals to stay alive. In the absence of such survival signals, frequently referred to as trophic factors, cells activate a suicide program. Second, in some developmental contexts including the immune system, and in adult life, other specific hormone signals (often on the surface of a cell) can induce the activation of a suicide program in another cell and thus murder the target cell. Whether cells commit suicide for lack of survival signals or are murdered by killing signals from other cells, cell death is most often mediated by apoptosis. The cell corpses are ingested by neighboring cells, and their contents are broken down into small molecules and reused to build other cells. Because there is no rupture of the plasma membrane, contents of the cell do not leak into the surrounding medium, which otherwise would lead to an inflammatory immune response. A different form of cell death, necrosis, occurs when cells are subjected to injury or excessive stresses, such as heat, absence of oxygen, or infection by pathogens. Necrosis involves swelling of the cell followed by formation of holes in the plasma membrane, causing leakage of intracellular contents, which in turn attracts white blood cells, including macrophages and other phagocytic cells. In turn this leads to an inflammatory response — heat, pain, swelling — whose function is to clear out the necrotic cells and initiate repair of the tissue. Perhaps surprisingly, necrosis can be the consequence of activating another mechanism of cellular suicide, termed necroptosis, which is only found in higher vertebrates. Necroptosis is often triggered by extracellular
Most Programmed Cell Death Occurs Through Apoptosis
cytokines such as tumor necrosis factor alpha (TNFα). Activation of this cell-death pathway frequently causes inflammation and contributes to the development of many human diseases, including nerve degeneration and atherosclerosis. Excess cells may also be extruded from epithelial layers, such as in gut and skin, by a mechanically regulated process that can cause detachment and the loss of trophic survival signals; extruded cells then die by yet another pathway termed anoikis. This maintains the epithelial barrier function as cells die and matches the rates of cell proliferation and death. In this section, we first distinguish programmed cell death from passive cell death and then describe how genetic studies in the nematode worm C. elegans led to the elucidation of an evolutionarily conserved effector pathway that leads to apoptosis. We then turn to vertebrates, in which cell death is actively suppressed by trophic factors, as exemplified by their importance in programmed cell death in neuronal development, and which may be activated by pro-inflammatory cytokines and cell stresses such as DNA damage in disease conditions. We illustrate the key roles of mitochondria in initiating vertebrate cell-death pathways and describe how apoptotic cells generate an “eat me” signal on their surface membranes. Finally, we discuss necrosis and necroptosis and how our understanding of these processes has paved the way for treating certain human diseases. Most Programmed Cell Death Occurs Through Apoptosis
The demise of cells by programmed cell death is marked by a well-defined sequence of morphological changes, collectively referred to as apoptosis, a Greek word that means “dropping off” or “falling off,” like leaves from a tree. Dying cells shrink, condense, and then fragment, releasing small membrane-bound apoptotic bodies, which are then engulfed by other cells (Figure 22-34). Within these apoptotic cells, mitochondria undergo fission and lose their membrane potential, nuclei condense, and the DNA is fragmented by nuclease cleavage. Importantly, the intracellular constituents are not released into the extracellular milieu, where they could have deleterious effects by eliciting immune responses, but instead are phagocytosed by neighboring cells. The stereotypical changes that occur during apoptosis, such as condensation of the nucleus and phagocytosis by surrounding cells, suggested to early scientists that this type of cell death was under the control of a strict gene expression program. This program is critical during both embryonic and adult life to maintain normal cell number and composition.
FIGURE 22-34 Ultrastructural features of cell death by apoptosis. (a) Schematic drawings illustrating the progression of morphological changes observed in apoptotic cells. Early in apoptosis, dense chromosome condensation occurs along the nuclear periphery. The cell body also shrinks, although most organelles remain intact. Later, both the nucleus and the cytoplasm fragment, forming membrane-enveloped apoptotic bodies, which are phagocytosed by surrounding cells without leakage of the cellular contents into the
surrounding medium. (b) Photomicrographs comparing a normal HeLa cell and an apoptotic cell. Clearly visible in the latter are dense spheres of compacted chromatin as the nucleus begins to fragment. [Part (b) T. J. Piva et al., 2012, “Increased Activity of Cell Surface Peptidases in HeLa Cells Undergoing UV-Induced Apoptosis Is Not Mediated by Caspase 3,” Int. J. Mol. Sci. 13(3):2650–2675; photo courtesy of Terrence Piva.] Description In the illustration labeled (a) the following steps show cell death by apoptosis. A cell is at the top of the illustration. A downward arrow is labeled chromatin compaction, condensation of cytoplasm. The cell now has an irregular shape and its nucleus is also irregular. Another downward arrow is labeled breakup of nuclear envelope, nuclear fragmentation, blebbing, cell fragmentation. The cell breaks apart into several pieces. The last downward arrow is labeled phagocytosis. The illustration shows a phagocytic cell as an irregular edged cell, opening up to take the apoptotic pieces inside. The genes involved in controlling cell death encode proteins with three distinct functions: Killer or initiation proteins are required for a cell to begin the apoptotic process. Destruction proteins perform functions such as digesting proteins and DNA in a dying cell. Engulfment proteins are required for phagocytosis of the dying cell by another cell. At first glance, engulfment seems to be simply an after-death cleanup process, but evidence indicates that it is part of the final death process. For example, mutations in killer genes always prevent cells from initiating apoptosis, whereas mutations that block engulfment genes sometimes
Evolutionarily Conserved Proteins Participate in the Apoptotic Pathway
allow cells to persist for a while before dying. Engulfment involves the assembly of a halo of actin in the engulfing cell around the dying cell or cell fragment, triggered by activation of Rac, a monomeric G protein that helps regulate actin polymerization (see Figure 17-44). In contrast to apoptosis, cells that die by necrosis or necroptosis exhibit very different morphological changes. Cells that undergo this process swell and burst, releasing their intracellular contents, which can damage surrounding cells and frequently cause inflammation — triggering the clearance of necrotic cells and tissues damaged from the original insult and the initiation of tissue repair. Evolutionarily Conserved Proteins Participate in the Apoptotic Pathway The confluence of genetic studies in C. elegans and studies on human cancer cells suggested that an evolutionarily conserved pathway mediates apoptosis. In C. elegans, cell lineages are under tight genetic control and are identical in all individuals of the species. About 10 rounds of cell division or fewer create the adult worm, which is about 1 mm long and 70 μm in diameter (see Figure 22-26c). The adult worm may be a hermaphrodite (having both male and female organs) or a male. The hermaphrodite form has 959 somatic-cell nuclei, whereas the male has 1031. Scientists have traced the lineage of each somatic cell in C. elegans from the fertilized egg to the mature worm by following the development of live worms using DIC microscopy (see Figure 22-26d).
Of the 947 nongonadal cells generated during development of the adult hermaphrodite, 131 undergo programmed cell death. Specific mutations revealed four genes whose encoded proteins play an essential role in controlling programmed cell death during C. elegans development: ced-3, ced-4, ced-9, and egl-1. In ced-3 or ced-4 mutants, for example, the 131 doomed cells survive (Figure 22-35). These mutants provided the first pieces of evidence that apoptosis was under a genetic program and led to the 2002 Nobel Prize for H. Robert Horvitz. The mammalian proteins that correspond most closely to the worm CED-3, CED-4, CED-9, and EGL-1 proteins are indicated in Figure 22-36. In discussing the worm proteins, we will occasionally include the mammalian names in parentheses to make it easier to keep the relationships clear.
EXPERIMENTAL FIGURE 22-35 Mutations in the ced-3 gene block programmed cell death in C. elegans. (a) Newly hatched mutant larva carrying a mutation in the ced-1 gene. Because mutations in this gene prevent engulfment of dead cells, highly refractile (and thus easily visualized) dead cells accumulate (arrows). (b) Newly hatched larva with mutations in both the ced-1 and ced-3 genes. The absence of refractile dead cells in these double mutants indicates that no cell deaths occurred. Thus the CED-3 protein is required for programmed cell death.
[Republished with permission from Elsevier, from H. M. Ellis and H. R. Horvitz, 1986, “Genetic Control of Programmed Cell Death in the Nematode C. elegans,” Cell 44(6):817– 829; permission conveyed through Copyright Clearance Center, Inc.] Description The micrograph labeled (a) shows a nematode worm with a mutation in the c e d-1 gene. Arrows indicate clumps of dead cells. The micrograph labeled (b) shows a nematode worm with a double mutation in c e d-1 and c e d-3 proteins. No clumps of dead cells are observed.
FIGURE 22-36 Evolutionary conservation of apoptosis pathways. Similar proteins, shown in identical colors, play corresponding roles in nematodes and in vertebrates. (a) In nematodes, the BH3-only protein called EGL-1 binds to CED-9 on the outer mitochondrial membrane; this interaction releases CED-4 from the CED-4/CED-9 complex. Free CED-4 then binds to and activates by autoproteolytic cleavage, the caspase CED-3, which cleaves cell proteins to drive apoptosis. These relationships are shown as a genetic pathway, with EGL-1 inhibiting CED-9, which in turn inhibits CED-4. Active CED-4 activates CED-3. (b) In vertebrates, homologs of the nematode proteins, as well as many other proteins not found in the nematode, regulate apoptosis. The Bcl-2 protein is similar to CED-9 in promoting cell survival in part by preventing activation of Apaf-1, which is similar to CED-4. Bcl-2 also prevents apoptosis by other mechanisms depicted in Figures 22-42 and 22-44. Several types
of BH3-only proteins, detailed in Figures 22-41 and 22-42, inhibit Bcl-2 and thus allow apoptosis to proceed. Many apoptotic stimuli lead to damage of the outer mitochondrial membrane, causing release into the cytosol of several proteins that stimulate apoptosis. In particular, cytochrome c released from mitochondria activates Apaf-1, which in turn activates caspase-9, the homolog of the nematode CED-3. This initiator caspase then cleaves and thus activates effector caspase-3 and caspase-7, eventually leading to apoptosis. See text for discussion of other mammalian proteins (SMAC/DIABLO and XIAP) that have no nematode homologs. [Information from S. J. Riedl and Y. Shi, 2004, Nat. Rev. Mol. Cell Biol. 5:897.] Description The illustration labeled (a) shows a vertical diagram beginning at the top with a yellow square labeled E G L-1 (B H 3 only). Next to this box is the label: B H 3-only proteins initiate apoptosis by binding to and inactivating C E D 9 (nematodes) or B c l-2 (vertebrates). The next step down is a blue rectangle labeled C E D-9. The description next to this box reads: C E D-9 (nematode) and B c l-2 (vertebrate) proteins on the outer mitochondrial membrane prevent apoptosis. The next step down has an orange rectangle labeled C E D-4. The description here reads: C E D-4 (nematode) and A p a f1 (vertebrate) activate caspases. The last rectangle down is labeled C E D-3. The description at this box reads C E D-3 (nematode) and vertebrate caspases cleave cell proteins to induce apoptosis. The bottom of the diagram is the skull and crossbones indicating cell death. The illustration labeled (b) is the vertebrate path. It starts with the label: Apoptotic stimuli, downward arrow to a yellow square labeled B i d, B i m, others (B H 3 only). the mitochondrion is drawn next to this square. The next step down is a blue rectangle labeled B c l-2, next to which is another blue rectangle labeled B a x B a k. A downward arrow from the mitochondrion and an arrow from B a x B a k point to the next rectangle labeled S M A C/D I A B L O. An oval labeled C y t c/d A T P is next to this rectangle. Below the oval is a structure labeled A p a f-1 with a downward arrow to a blue rectangle labeled Caspase-9 initiator. The caspase-9 has a downward arrow to a purple rectangle labeled caspase-3, -7 effectors. A rectangle labeled X I A P is next to these. A downward arrow points to cellular targets, which then points down to apoptosis and the skull and crossbones indicating cell death.
The first mammalian apoptotic gene to be cloned, bcl-2, was isolated as an oncogene from human follicular lymphomas, tumors of the antibodyproducing B cells of the immune system. A mutant form of this gene was formed in a patient’s lymphoma cells; a chromosomal rearrangement joined the protein-coding region of the bcl-2 gene to an immunoglobulingene enhancer. The combination results in overproduction of the Bcl-2 protein, which keeps these cancer cells alive when they would otherwise become programmed to die by apoptosis. The human Bcl-2 protein and worm CED-9 protein are 23 percent identical in amino acid sequence, and the expression of a bcl-2 transgene can block the extensive cell death observed in ced-9 mutant worms. Thus both proteins act as regulators that suppress the apoptotic pathway (see Figure 22-36). In addition, both proteins contain a single transmembrane domain and are localized mainly to the outer mitochondrial membrane, where they serve as sensors that control the apoptotic pathway in response to external stimuli. As we discuss next, other regulators promote apoptosis. In the worm apoptotic pathway, CED-3 (caspase-9 in mammals) is a protease required to cleave key cell proteins during apoptosis. CED-4 (Apaf-1) is a protease-activating factor that causes autoproteolytic cleavage of the CED-3 protease to promote its activation and to initiate cell death, as CED-3 is synthesized by and present in all cells as an inactive precursor (a zymogen) (see Figures 22-36 and 22-37). Cell death does not occur in ced-3 and ced-4 single loss-of-function mutants or in ced-9/ced-3 double mutants. In contrast, in ced-9 loss-of-function mutants, all cells die by apoptosis during embryonic life, so the adult form never develops. These genetic studies indicate that CED-3 and CED-4 are killer
proteins required for cell death, and that CED-9 (Bcl-2) suppresses apoptosis. The observation that all cells die in ced-9 loss-of-function mutants shows that the apoptotic pathway is present in and can be activated in all cells. Moreover, the absence of cell death in ced-9/ced-3 double mutants suggests that CED-9 acts upstream of CED-3 to suppress the apoptotic pathway.
FIGURE 22-37 Activation of CED-3 protease in C. elegans. EGL-1, a BH3-only protein that is produced in response to developmental signals that trigger cell death, displaces a CED-4 dimer from its association with CED-9 (step 1 ). Four freed CED-4 dimers combine to form a CED-4 octamer (step 2 ), which binds two molecules of the CED-3 zymogen (an enzymatically inactive precursor of a caspase protease). Bringing the two CED-3 zymogens together triggers the self-cleavage of the CED-3 zymogens into active CED-3 proteases (step 3 ). This effector caspase then begins to cleave multiple cell proteins, leading to cell death (step 4 ). See N. Yan et al., 2005, Nature 437:831; and S. Qi et al., 2010, Cell 141:446. Description In the illustration C E D-9 (blue circle) is associated with a mitochondrion, and via C E D-9, the C E D-4 (a group of reddish-brown structures) dimer is bound. 1. On binding of E G L-1, the C E D-4 dimer is released. 2. The C E D-4 dimer associates with three other dimers, forming a C E D-4 octamer. 3. C E D-3 (inactive caspase) binds to the C E D-4 octamer, and the C E D-3 caspase is activated. 4. Cell death occurs.
The mechanism by which CED-9 (Bcl-2) controls CED-3 (caspase-9) in the nematode is known and is somewhat different from the mechanism, discussed later (see Figure 22-43), in mammalian cells. In all nematode cells the CED-9 protein, localized to the outer mitochondrial membrane, forms a complex with a dimer of the CED-4 (Apaf-1) protein, thereby preventing the CED-4 protein from activating the CED-3 protease (Figure 22-37). As a result, the cell survives. This mechanism fits with the genetics, which shows that the absence of CED-9 causes all cells in the embryo to die, but that the absence of CED-9 has no effect if CED-3 is also missing (ced-3/ced-9 double mutants have no cell death). The threedimensional structure of the trimeric CED-4/CED-9 complex reveals a huge contact surface between each of the two CED-4 molecules and the single CED-9 molecule; the large contact surface makes the association highly specific, but in such a way that the dissociation can be regulated. Transcription of egl-1, the fourth genetically defined apoptosis regulator gene, occurs only in C. elegans cells that are programmed to die. Newly produced EGL-1 protein binds to CED-9, alters its conformation, and catalyzes the release of CED-4 from CED-9 (see Figure 22-37). Both EGL1 and CED-9 contain a 12-amino-acid sequence termed the BH3 domain. Because EGL-1 lacks most of the other domains of CED-9, it is called a BH3-only protein. The mammalian BH3-only proteins closest in sequence and function to EGL-1 are the pro-apoptotic proteins Bid and Bim, discussed later. Once EGL-1 causes dissociation of the CED-4/CED9 complex, four released CED-4 dimers join to make an octamer, which then binds to and activates the CED-3 protease by a mechanism we will discuss shortly. Cell death soon follows (see Figure 22-37).
Caspases Amplify the Initial Apoptotic Signal and Destroy Key Cellular Proteins
Evidence that the steps described here are sufficient to induce apoptosis comes from experiments in which these steps were reconstituted in vitro with purified proteins. CED-3, CED-4, a segment of the CED-9 protein that lacked its mitochondrial membrane anchor, and EGL-1 were purified, as was a CED-4/CED-9 complex. Purified CED-4 (Apaf-1) was able to bind to and accelerate the autoproteolytic cleavage and activation of purified CED-3 (caspase-9) protease, but addition of CED-9 (Bcl-2) to the reaction mixture inhibited the autocleavage. When the CED-4/CED-9 complex was mixed with CED-3, autocleavage did not occur, but addition of EGL-1 to the reaction mixture restored CED-3 autocleavage by releasing CED-4 from its complex with CED-9. To see the importance of regulated EGL-1 expression in apoptosis, consider a class of neurons in C. elegans found in hermaphrodites, but not in males. These hermaphrodite-specific neurons are generated embryonically in both hermaphrodites and males but undergo programmed cell death in males. In hermaphrodites, expression of the egl-1 gene in these neurons is repressed by the transcription factor TRA-1A, and deletion of TRA-1A in hermaphrodites causes these neurons to undergo apoptosis. This finding reinforces a point made earlier: all metazoan cells can potentially undergo apoptosis, so this process needs to be carefully regulated! Caspases Amplify the Initial Apoptotic Signal and Destroy Key Cellular Proteins
The key enzymes that mediate apoptosis, the caspases, are so named because they contain a key cysteine residue in the catalytic site and selectively cleave proteins at sites just C-terminal to aspartate residues. Caspases function as homodimers, with one domain of each stabilizing the active site of the other; they mediate apoptosis by proteolytic cleavage of selected substrates that contain their preferred cleavage sites. Their specific intracellular targets include proteins that form the nuclear lamina and cytoskeleton, whose cleavage leads to the demise of a cell. In vertebrates, targets include other pro-apoptotic proteins such as Bid, which in turn promote mitochondrial damage. While apoptosis in C. elegans is executed by a single caspase CED-3, humans have 14 different caspases. In mammalian cells, apoptosis is mediated by a cascade of caspases which sequentially amplifies the initial death signal. All caspases are initially made as procaspases that require either binding to specific protein complexes or a proteolytic cleavage to become active. Apoptosis of mammalian cells is activated by either intrinsic or extrinsic signaling pathways. The intrinsic apoptosis pathway is mediated by an activated initiator caspase, such as caspase-9, which in turn mediates the activation of the effector proteases, such as caspase-3 and caspase-7; in this way, the proteolytic activity of a few activated initiator caspases becomes rapidly and hugely amplified, leading to a massive increase in the total caspase activity level in the cell (see Figure 22-36) and consequently cell death. The extrinsic apoptosis pathway, discussed later, is initiated by ligands of death receptor family, such as TNFα (see Figure 22-44) and FasL by binding to their cognate receptors. This leads to the
Phosphatidylserine: an “Eat Me” Signal on the Surface of Apoptotic Cells
activation of caspase-8, an initiator caspase, which in turn activates the effector caspases, such as caspase-3 and caspase-7, to execute cell death. Phosphatidylserine: an “Eat Me” Signal on the Surface of Apoptotic Cells As we learned in Section 1 of Chapter 10, the phospholipid phosphatidylserine is normally found in the inner, cytosolic leaflet of the plasma membrane. During apoptosis, increasing amounts of phosphatidylserine are found in the exoplasmic leaflet, where it acts as an “eat me” signal: it binds to several types of phosphatidylserine receptors on the surface of neighboring phagocytic cells that initiate engulfment of the cell or cell fragment. Experimentally, the presence of phosphatidylserine on the surface of a cell is indicative that it is undergoing apoptosis and can be detected by the binding of the protein annexin V (which is visualized by conjugation with a fluorescent molecule). While the normal cellular function of annexin V is obscure, it does bind tightly and specifically to phosphatidylserine. In normal vertebrate cells, ATP-powered pumps called ATP11A and ATP11C, members of the ABC class of transmembrane proteins (see
Figure 11-16), continuously transport phosphatidylserine from the outer to the inner leaflet of the plasma membrane. The phospholipid scramblases XKR8 and TMEM16F, which otherwise would translocate some of the phosphatidylserine back to the outer membrane leaflet, are inactive
(Figure 22-38). During apoptosis, caspase-3 cleaves both ATP11A and ATP11C, inactivating them. Additionally, caspase-3 cleaves XKR8, and in so doing activates its function: the truncated XKR8 binds to two other proteins, dimerizes, and becomes an active translocase, shuttling all phospholipids, including phosphatidylserine, from one leaflet of the plasma membrane to the other. The end result is appearance of the macrophage, “eat me” signal phosphatidylserine on the outer surface of the plasma membrane, where it binds to a set of receptors on the surface of macrophages and other immune system cells, triggering phagocytosis of the cell or apoptotic body (see Figure 22-34).
Neurotrophins Promote Survival of Neurons
FIGURE 22-38 Movement of phosphatidylserine to the outer plasma membrane leaflet during apoptosis. (a) In normal vertebrate cells, ATP-powered phospholipid flippases ATP11A and ATP11C continuously translocate phosphatidylserine from the outer to the inner leaflet of the plasma membrane (unidirectional gray arrow), and the phospholipid scramblase XKR8 which otherwise would equilibrate phosphatidylserine in both plasma membrane leaflets, is inactive. (b) In cells undergoing apoptosis, caspase-3 cleavage irreversibly inactivates ATP11A and ATP11C. In addition, caspase-3 cleaves the inactive phospholipid scramblase XKR8. The truncated XKR8, together with either basigin (BSG) or neuroplastin (NPTN), undergoes dimerization and activation, and translocates phospholipids in both directions. The end result is appearance of the “macrophage, eat me” signal phosphatidylserine on the outer surface of the plasma membrane. [Information from S. Cory, 2018, Proc. Nat’l. Acad. Sci. USA 115:12092–12094.] Description The illustration labeled (a) shows the cell membrane of the resting cells with labels exterior at the top and cytosol at the bottom. From the left, the cell membrane has a yellow area labeled A T P 11 A/11 C, followed by a light blue section labeled C D C 50 A. These two are also labeled Flippases. A gray arrow points from exterior to interior here. After a space on the membrane, a pink area is labeled X K R 8 with a light blue area labeled B S G or N P T N. Along the bottom of this diagram are labels in the cytosol. From left: active A P Caspase recognition site are all labeled below the yellow section. Under the pink section is the word inactive. At the right end of the pink section is a structure labeled caspase recognition site. A legend box explains that the cell membrane figures with gray lines and a red circle are phosphatidylserine, and the ones with blue circles are phosphatidylcholine. The illustration labeled (b) shows the cell membrane of the apoptotic cells. The same cell membrane is drawn. Under the yellow section is a pair of scissors cutting apart the caspase, with the label irreversible inactivation. The active caspase-3 moves to the pink section where irreversible activation happens. Another pair of scissors is represented with the label dimerization.
Neurotrophins Promote Survival of Neurons We noted that, in the nematode C. elegans, all cell lineages are under tight genetic control and are identical in all individuals of the species; during development of the adult hermaphrodite form, precisely 131 cells undergo programmed cell death. During development of vertebrates, too, many cells are born only to die, but apoptosis of most vertebrate cells is not under programmed genetic control. Rather, apoptosis is regulated by intracellular signals generated from many secreted and cell-surface protein hormones, as well as by many environmental stresses, such as ultraviolet irradiation and DNA damage. While the core apoptosis machinery in C. elegans is conserved in vertebrates, many other intracellular proteins also regulate apoptosis (see Figure 22-36, right). Before plunging into these molecular details, we’ll illustrate the importance of trophic factors in apoptosis with a brief analysis of the developing nervous system. When neurons grow to make connections to other neurons or to muscles, sometimes over considerable distances, more neurons grow than will eventually survive. As an example, the cell bodies of many sensory and motor neurons are located in the spinal cord and adjacent ganglia, while their axons grow outward from the cell body toward their target cells — often muscle cells that they will innervate (see
Figure 18-55). Those neurons that make signaling connections, termed synapses (see Figure 23-3), with their intended target cells prevail and survive; those that fail to connect will die.
In the early 1900s, the number of neurons innervating peripheral cells was shown to depend on the size of the tissue to which they connect, the socalled target field. For instance, removal of limb buds from a developing chick embryo leads to a reduction in the number of both sensory and motor neurons innervating muscles in the bud (Figure 22-39). Conversely, grafting additional limb tissue to a limb bud leads to an increased number of neurons in the corresponding regions of the spinal cord and sensory ganglia. Indeed, incremental increases in target-field size are accompanied by commensurate incremental increases in the number of neurons innervating the target field. This relationship was found to result from the selective survival of neurons, rather than changes in their differentiation or proliferation. The observation that many sensory and motor neurons die after reaching their peripheral target field suggested that these neurons compete for survival factors produced by the target tissue.
EXPERIMENTAL FIGURE 22-39 In vertebrates, the survival of motor neurons depends on the size of the muscle target field they innervate. (a) Removal of a limb bud from one side of a chick embryo at about 2.5 days of development results in a marked
decrease in the number of motor neurons on the affected side. In an amputated embryo (top), normal numbers of motor neurons are generated on both sides of the spinal cord (middle) and grow outward to innervate limb muscles. Later in development, however, many fewer motor neurons remain on the side of the spinal cord with the missing limb than on the normal side (bottom). Note that normally only about 50 percent of the motor neurons that are generated survive. (b) Transplantation of an extra limb bud into an early chick embryo produces the opposite effect, more motor neurons on the side with additional target tissue than on the normal side. See D. Purves, 1988, Body and Brain: A Trophic Theory of Neural Connections, Harvard University Press. [Data from E. R. Kandel, J. H. Schwartz, and T. M. Jessell, 2000, Principles of Neural Science, 4th ed., McGraw-Hill, p. 1054, Fig. 53-11.] Description The illustration labeled (a) shows a sketch of a chick embryo. The optic cup and lens are labeled at the top, the heart looks like it is under the chin, and the spinal cord is labeled. A dark blue area on the back of the spinal cord is labeled limb bud. Another limb bud is separated from the embryo at the bottom. Below is a cross-section of a spinal cord. The normal side is marked on the left with 100 percent motor neuron generation with many green dots; at the right is the missing limb, which also shows 100 percent motor neuron generation. Below this is a downward arrow with the label motor neuron apoptosis. The bottom schematic shows 50 percent motor neuron survival on the left and 10 percent motor neuron survival on the right. The illustration labeled (b) shows the same diagrams. The top sketch shows a transplant of a new limb bud onto the embryo. The bottom schematic shows 50 percent motor neuron survival on the left and 75 percent motor neuron survival on the right. Subsequent to these early observations, scientists discovered that transplantation of a mouse sarcoma (muscle tumor) into a chick led to a marked increase in the local numbers of certain types of neurons. This finding implicated the tumor as a rich source of a presumed trophic factor. To isolate and purify this factor, known simply as nerve growth factor
(NGF), scientists used cell culture assays in which outgrowth of neurites from sensory ganglia was measured. Neurites are extensions of the neuronal cytoplasm that can grow to become the long processes of the nervous system, the axons and dendrites (see Figure 23-1). The later discovery that the submaxillary gland of the mouse also produces large quantities of NGF enabled Rita Levi-Montalcini to purify and sequence it; she was rewarded with a Nobel Prize. A homodimer of two 118-residue polypeptides, NGF belongs to a family of structurally and functionally related trophic factors collectively referred to as neurotrophins. Brainderived neurotrophic factor (BDNF) and Neurotrophin-3 (NT-3) are also members of this protein family. Neurotrophins bind to and activate a family of receptor tyrosine kinases called Trks (pronounced “tracks”). (The general structure of receptor tyrosine kinases and the intracellular signaling pathways they activate are covered in Chapter 16.) Each neurotrophin binds with high affinity to one type of Trk receptor: NGF binds to TrkA; BDNF to TrkB; and NT-3 to TrkC. NT-3 can also bind with lower affinity to both TrkA and TrkB. All neurotrophins also bind to a distinct type of receptor called (also called NTR 5 neurotrophin receptor), but with lower affinity. forms heteromeric complexes with the different Trk receptors and enhances Trk receptor signaling, much like the way the Type III TGF-β receptor enhances the binding of TGF-β to the two signaling TGF-β receptors (see Figure 16-23). These binding relationships between trophic factors and their receptors provide survival signals for different classes of neurons. As nerve axons extend outward from the spinal cord to the periphery, neurotrophins produced by their target tissues bind to Trk
receptors on the growth cones (see Figure 18-55) at the tips of the extending axons, promoting survival of those neurons that successfully reach their targets. To investigate the role of neurotrophins in development, scientists produced mice with knockout mutations in each of the neurotrophins or their receptors. These studies revealed that different neurotrophins and their corresponding receptors are required for the survival of different classes of sensory neurons (Figure 22-40). For instance, pain-sensing (nociceptive) neurons, which express TrkA, are selectively lost from the dorsal root ganglion of knockout mice lacking NGF or TrkA, whereas TrkB- and TrkC-expressing neurons are unaffected in such knockouts. In contrast, TrkC-expressing proprioceptive sensory neurons, which detect the position of the limbs, are missing from the dorsal root ganglion in TrkC and NT-3 mutants.
Mitochondria Play a Central Role in Regulation of Apoptosis in Vertebrate Cells
EXPERIMENTAL FIGURE 22-40 Different classes of sensory neurons are lost in knockout mice lacking different trophic factors or their receptors. In animals lacking nerve growth factor (NGF) or its receptor TrkA, small nociceptive (pain-sensing) neurons (light blue) that innervate the skin are missing. These neurons express the TrkA receptor and innervate NGF-producing target tissues. In animals lacking either neurotrophin-3 (NT3) or its receptor TrkC, large proprioceptive neurons (red) innervating muscle spindles are missing. Muscle tissue produces NT-3, and the proprioceptive neurons express TrkC. Mechanoreceptors (orange; see Figure 23-33), another class of sensory neurons in the dorsal root ganglion, are unaffected in these mutants. [Data from W. D. Snider, 1994, Cell 77:627.] Description The first diagram, at left, is labeled wild type. The diagram shows a pink structure labeled spinal cord with nerve cells moving to a muscle. Labeled from top to bottom in this diagram are mechanoreceptors, dorsal root ganglion, proprioceptive neurons, nociceptive neurons, skin, and motor neurons. The second diagram, labeled mutant, shows the same spinal cord to muscle structures, unlabeled. At the top of the diagram is a label that reads: N G F minus/minus or T r k A minus/minus. This diagram shows no nociceptive neurons. The third diagram, also labeled mutant, carries the label N T-3 minus/minus or T r k C minus/minus and the diagram shows no proprioceptive neurons, but the nociceptive neurons are there. Mitochondria Play a Central Role in Regulation of Apoptosis in Vertebrate Cells As discussed previously, C. elegans CED-9 and its mammalian homolog Bcl-2 play central roles in regulating apoptosis. In nematodes, CED-9 does
so by binding to and blocking the activation of CED-4. In vertebrates, Bcl2 family members have been expanded to include Bcl-2 and that function to block apoptosis, as well as Bax and Bak that function to promote apoptosis (Figure 22-41). Bcl-2 family members either constitutively reside in the outer mitochondrial membrane or translocate to the mitochondria when induced. Bcl-2 family members primarily function to maintain (anti-apoptotic) or disrupt (pro-apoptotic) the structural integrity and low permeability of the outer mitochondrial membrane, and to prevent or induce the release of mitochondrial proteins such as cytochrome c (see Figure 12-22) from the intermembrane space into the cytosol that in turn activate apoptotic caspases.
FIGURE 22-41 Structures of members of the Bcl-2 family of proteins. (a) The Bcl-2 family, which comprises proteins that contain functional Bcl-2 homology domains (BH1– 4), can be divided into three classes. All of the pro-apoptotic and anti-apoptotic proteins, but only some of the BH3-only proteins, contain a hydrophobic and presumably transmembrane (TM) domain that may function to anchor the protein in the outer mitochondrial membrane. (b) Corresponding three-dimensional structures of representative members of each of these three classes of Bcl-2 homology domains: myeloid cell leukemia (MCL)-1; BCL-2-associated X (BAX); and p53 up-regulated modulator of apoptosis (PUMA) BH3 domain. [Part (a) Data from Giam et al., 2009, Oncogene 27:S128. Part (b) Data from M. P. A. LunaVargas and J. E. Chipuk, 2016, Trends Cell Biol. 26(12):906.] Description In the illustration labeled (a) the top D N A line diagram is labeled Pro-survival members. The bar reads, from left to right: B H 4, space, B H 3, space, B H 1, space, B H 2, space T M. At the right is the label: B c l-2, B c l-x subscript L, B c l-w, M c l-1, A 1. The middle D N A line diagram is labeled pro-apoptotic members. A label above this diagram reads: form channels in the mitochondrial outer membrane. The line diagram reads, from left to right: long space, B H 3, small space, B H 1, small space B H 2, small space T M. The label at the right reads: B a x, B a k, B o k. The last D N A line diagram has the label: B H 3-only proteins: regulate activity of B c l-2 and B a x/B a k proteins, B i m, P u m a, N o x a, B i k, B m f, B a d, H r k, B i d. The D N A line diagram reads, from right to left: long space, B H 3, long space, Hydrophilic domain. In the illustration labeled (b), the top ribbon model is labeled M c l-1 (P B D : 2 M H S) and is a gold colored ribbon in a gray space. The middle model is labeled B A X (P D B : 1 F 16) and is a green colored ribbon in a light green space. The last model is labeled P U M A (P B D : 2 M 0 4) and is a blue colored single ribbon in a light blue space. Before we can explain how the activity of Bcl-2 family members is regulated by trophic factors as well as by many environmental stimuli, we need to introduce several other important members of this family of
The Pro-Apoptotic Proteins Bax and Bak Form Pores and Holes in the Outer Mitochondrial Membrane
proteins. All members of the Bcl-2 family share a close homology in up to four characteristic regions, termed the Bcl-2 homology domains (BH1–4; see Figure 22-41). Each of these proteins has either an anti-apoptotic or a pro-apoptotic function. All members of this family participate in oligomeric interactions; many have hydrophobic sequences at their C-termini that can anchor the proteins in the outer mitochondrial membrane. The Pro-Apoptotic Proteins Bax and Bak Form Pores and Holes in the Outer Mitochondrial Membrane In vertebrate cells, Bax or Bak is required for mitochondrial damage and induction of intrinsic apoptosis pathways. These two similar pro-apoptotic proteins contain three of the BH1–4 domains (see Figure 22-41) and have three-dimensional structures very similar to that of the anti-apoptotic members of the family. As evidence for the role of these proteins in promoting apoptosis, most mice lacking both Bax and Bak die in utero, and those that survive show significant developmental defects, including the persistence of interdigital webs and accumulation of extra cells in the central nervous and hematopoietic systems. Cells isolated from these mice are resistant to virtually all apoptotic stimuli. Conversely, overproduction of Bax in cultured cells induces apoptotic death. Bak resides in the outer mitochondrial membrane, normally tightly bound to the anti-apoptotic protein Bcl-2 or the related protein (Figure 2242). When released from Bcl-2 — either by being present in excess, or by
being displaced by the binding to Bcl-2 of certain BH3-only proteins — Bak forms large oligomers that generate pores and holes in the outer mitochondrial membrane. In healthy cells Bax is mainly cytosolic, with a small fraction shuttling to and transiently attached to the mitochondrial surface. Binding of certain pro-apoptotic proteins, discussed later, causes Bax, like Bak, to oligomerize and insert into the outer mitochondrial membrane, forming pores and holes that can be several hundreds of nanometers in diameter. Both pores and holes in the outer mitochondrial membrane allow release into the cytosol of mitochondrial proteins such as cytochrome c that, in normal healthy cells, are localized to the intermembrane space.
FIGURE 22-42 Integration of multiple signaling pathways in vertebrate cells that regulate outer mitochondrial membrane permeability and apoptosis. In healthy cells, the anti-apoptotic protein Bcl-2, or its homolog , binds to Bak and Bax pro-apoptotic proteins, blocking the ability of Bak or Bax to oligomerize and form pores in the outer mitochondrial membrane. Binding of any of several BH3-only proteins, including Bad, Bim, and Puma, directly to Bcl-2 causes Bak or Bax to dissociate from Bcl-2 and form oligomeric pores and holes in the outer mitochondrial membrane. These holes allow cytochrome c to enter the cytosol, where it binds to the adapter protein Apaf-1, promoting activation of caspase-9 that then initiates the apoptotic cascade and leads to cell death. Several stimuli trigger or repress this apoptotic pathway. Step 1 : The presence of specific
trophic factors (e.g., NGF) leads to activation of their cognate receptor tyrosine kinases (e.g., TrkA) and activation of the PI-3 kinase–PKB (protein kinase B) pathway (see Figure 16-17). PKB phosphorylates Bad, and phosphorylated Bad then forms a complex with a cytosolic 14-3-3 protein. This Bad is sequestered in the cytosol and is unable to bind to Bcl2. In the absence of trophic factors, nonphosphorylated Bad binds to Bcl-2, releasing Bax and Bak and allowing them to form oligomeric membrane pores and holes, activating the apoptosis pathway. Step 2 ; DNA damage or ultraviolet irradiation leads to induction of synthesis of the BH3-only Puma protein. Puma binds to Bcl-2, allowing Bak and Bax to form oligomeric pores; Puma may also bind to Bak and Bax, directly activating their ability to form oligomers and permeabilize the outer mitochondrial membrane. Step 3 : Removal of a cell from its substratum disrupts integrin signaling, leading to release of the BH3-only Bim protein from the cytoskeleton. Bim also binds to Bcl-2 to promote pore formation. [Data from D. Ren et al., 2010, Science 330:1390; P. E. Czabootar et al., 2014, Nat. Rev. Mol. Cell Biol. 15:49; and M. P. A. Luna-Vargas and J. E. Chipuk, 2016, Trends Cell Biol. 26(12):906.] Description The illustration begins with a plasma membrane at the top. Cytosol is labeled below the membrane. Above the membrane, is a structure with five petal-like structures on it. The blue ones at the top and bottom are labeled trophic factor receptor, the red ones on each side are labeled trophic factor. This structure extends into the cell where 6 phosphate yellow circles are attached. A downward arrow points to a light green oval labeled P I-3 kinase. An arrow below points to a green oval labeled P K B. The next downward arrow shows that A T P is added and A D P is released and a red circle labeled B a d is added. The B a d attaches to two purple petal shapes with phosphates. At the right of the illustration is a nucleus with D N A. D N A damage is represented with a D N A ribbon. An arrow to the left goes to an oval labeled P U M A, which moves down to two cylinders. At the right of the green oval, another line begins with the label Disruption of integrin signaling. Two dark sticks are labeled microtubule cytoskeleton and are attached to an oval labeled B i m. A downward arrow moves the B i m down to two cylinders. The cylinders are labeled B a k or B a x on the left and B c l-2 or B c l-x subscript L on the right. The B a d circle is sent up from these cylinders to the first pathway. An arrow to the left of the cylinders moves to a group of 6 of these cylinders attached to the mitochondrial membrane. Adding to it is an oval labeled C y t
c. An upward arrow shows the C y t c being released and moved upward to a rectangle labeled A p a f-1. Inactive caspase-9 moves through the rectangle to a blue rectangle labeled Active caspase-9. An upward arrow moves to the addition of a purple rectangle labeled Procaspase-3, which becomes Caspase-3. One more upward arrow leads to cleavage of substrates and death, marked by a skull and crossbones. As depicted in Figure 22-43, released cytochrome c activates caspase-9, predominantly by binding to and activating Apaf-1, the mammalian homolog of CED-4 (see Figures 22-36, right and 22-42). Binding triggers formation of an apoptosome containing seven molecules each of Apaf and cytochrome c — a disk-shaped 1.4-MDa heptameric wheel of death. Two of the Apaf proteins bind to domains in two procaspase-9 molecules, stimulating procaspase-9 binding to adjacent sites in the apoptosome. The conformation changes that occur upon binding trigger activation of this initiator protease; caspase-9 does not require cleavage to become activated. Caspase-9 then cleaves multiple molecules of effector caspases, such as caspase-3 (see Figures 22-36 and 22-42), leading to their activation and subsequent destruction of cell proteins and cell death. As evidence for this pathway, overproduction of Bcl-2 in cultured cells blocks release of cytochrome c and apoptosis; conversely, overproduction of Bax promotes release of cytochrome c into the cytosol and promotes apoptosis.
Release of SMAC/DIABLO Proteins from Mitochondria Also Promotes Caspase Activation
FIGURE 22-43 Structure of the mammalian Apaf-1 apoptosome. Binding of cytochrome c to the cytosolic protein Apaf triggers formation of an apoptosome containing seven molecules each of Apaf and cytochrome c and having a sevenfold symmetry. The top face refers to the cytochrome c–exposed side of the apoptosome disk. Cytochrome c is colored yellow, and the several domains within each of the seven Apaf-1 protomers are colorcoded. Each Apaf-1 monomer contains a caspase recruitment domain. In the heptameric apoptosome, two of these domains bind to domains in two procaspase-9 molecules, stimulating procaspase-9 binding and dimerization, and thus triggering activation of this initiator protease. [© 2015 Zhou et al.; Published by Cold Spring Harbor Laboratory Press] Description The illustration shows two views of mammalian A p a f-1 apoptosome. The side view at left looks like a seven petal flower with a detailed blue center. The figure is turned 45 degrees to show the bottom face and top face. Procaspase-9 binding sites are labeled at the bottom face. Release of SMAC/DIABLO Proteins from Mitochondria Also Promotes
Caspase Activation In vertebrates and flies, but not in nematodes, apoptosis is regulated by several other proteins (see Figure 22-36, right). XIAP, one member of a family of inhibitor of apoptosis proteins (IAPs), provides another way to restrain both initiator and effector caspases. XIAP has three N-terminal BIR domains; the one termed BIR2 binds to and inhibits two effector caspases, caspase-3 and caspase-7, while BIR3 binds to and inhibits initiator caspase-9. (Other members of the IAP family inhibit apoptosis induced by TNFα; see Figure 22-44.) The inhibition of caspases by IAPs, however, creates a problem when a cell needs to undergo apoptosis. Mitochondria enter the picture once again, since they are the source of a family of proteins, called SMAC/DIABLOs, that inhibit IAPs. Assembly of Bax or Bak oligomers (see Figure 22-42) leads to the release of SMAC/DIABLOs, as well as cytochrome c, from the mitochondrial intermembrane space. SMAC/DIABLOs then bind to XIAP in the cytosol, thereby blocking XIAP from binding to caspases. By relieving XIAPmediated inhibition, SMAC/DIABLOs promote caspase activity and cell death.
FIGURE 22-44 Cell murder: the extrinsic apoptosis and necroptosis pathways. (a) Extrinsic (or death receptor–regulated) apoptosis pathways are found in many types of cells, which may be activated by Fas, TNFα, and other members of the TNFα family of proteins. For example, binding of TNFα on the surface of one cell to the TNFα death receptor on an adjacent cell leads to the binding of two cytosolic death domain (DD)-containing proteins, the adapter protein TRADD (TNF receptor-associated DD protein) and receptor-interactingprotein 1 (RIPK1), to the DD on the intracellular segment of TNFα receptor 1, leading to the formation of a large intracellular signaling complex. FADD (Fas-associated DD protein) can then bind, leading to the binding, dimerization, and proteolytic activation of the initiator caspase-8. Active caspase-8 then cleaves and activates effector caspases 3, 6, and 7, which cleave vital cellular proteins and induce cell death. Cleavage of the BH3-only protein Bid (BH3-interacting-domain death agonist) by caspase-8 generates the tBid fragment that binds to Bcl-2 on the outer mitochondrial membrane, leading to release of Bad or Bax followed by their oligomerization and pore formation in the outer mitochondrial membrane, release of cytochrome c into the cytosol, and activation of the intrinsic apoptosis pathway (see
Figure 22-41) as well. RIPK1 is an essential kinase and adaptor in the apoptosis and necroptosis pathway; it contains an N-terminal kinase domain and a RHIM domain. When the decision is to die by apoptosis, RIPK1 binds to FADDs, as above leading to the binding,
dimerization, and proteolytic activation of the initiator caspase-8. (b) When apoptosis fails to be activated, for example in the absence of caspase-8 or FADD, the necroptosis pathway can be activated, triggered by activation of RIPK1 kinase. Step 1 : Activated RIPK1 forms multiprotein complexes via its RHIM domain with the kinase RIPK3, and RIPK3 becomes activated by phosphorylation of a residue in its activation loop. Step 2 : Active RIPK3 then binds to the kinase-like domain of the MLKL protein and phosphorylates it. Step 3 : This induces a conformational change in MLKL that (step 4 ) enables it to form oligomers that insert into the plasma membrane. Either directly by forming ion channels or indirectly by interacting with other plasma membrane proteins this destabilizes the integrity of the plasma membrane, inducing cell swelling and rupture. See P. Bouillet and L. A. O’Reilly, 2009, Nat. Rev. Immunol. 9:514; A. Ashkenazi and G. Salvesen, 2014, Annu. Rev. Cell Dev. Bi. 30:337; Y. Dondelinger et al., 2016, Trends Cell Biol. 26:721, https://doi.org/10.1016/j.tcb.2016.06.004; and B. Shan et al., 2018, Genes Dev. 32:327, https://doi.org/10.1101/gad.312561.118. Description Illustration (a) is labeled signaling cell and it shows a vertical diagram that starts at the top with the cytosol and a plasma membrane. Three blue ovals are attached to the outside of the cell membrane and are labeled Death signal (for example, T N F alpha.) Below this are three yellow ovals labeled Death receptor (for example, T N F alpha receptor). Another plasma membrane is with the death receptors moving through the membrane into the cytosol of another cell. Attached to the bottom of this are three blue circles labeled T R A D D. Below these are three light green circles labeled F A D D. On the right is a structure labeled R I P K 1. A downward arrow moves to a blue rectangle labeled Procaspase-8. Another arrow leads down to a darker blue rectangle labeled Caspase-8. To the right an arrow from the darker blue rectangle leads to a multicolor rectangle labeled B i d. Below this is an arrow leading to a small rectangle labeled t B i d (B H 3 only). Also at the darker blue rectangle a downward arrow leads to a dark purple rectangle labeled Caspase -3, Caspase-6, and Caspase-7 attaching to another rectangle labeled procaspase -3, Procaspase-6, and procaspase-7. Meanwhile, the t B i d has a downward arrow to two cylinders labeled B c l-2 or B c l-x subscript L and B a d or B a x. An arrow to the left moves to a group of six cylinders and this takes place in the outer membrane of the mitochondria. The C y t c oval is brought up from the bottom through the cylinders to the blue rectangle labeled Caspase-9. Below the
Trophic Factors Induce Inactivation of Bad, a Pro-apoptotic BH3-Only Protein
purple rectangle is death represented with the skull and crossbones. The illustration labeled (b) has a schematic that starts at the left with the same structure as the death signal and domain in illustration (a). Below the R I P K 1 is a downward arrow pointing to a group of structures labeled R I P K 1, R I P K 3, R I P K 1, R I P K 3, R I P K 1, with phosphates below them. A downward arrow points to a R I P K 3 that has separated from the group and is attaching to a structure labeled M L K L and closed inactive conformation. An upward arrow moves to the R I P K 3 attaching to the M L K L structure. Another upward arrow leads to a label: open active conformation and shows just the M L K L structure. An upward arrow from this shows 4 M L K L structures vertical and grouped together. Two arrows come up from this through the membrane. At the left, the arrow goes to a label: activation of Na 2 plus and Ca 2 plus channels? The right arrow points to the label: Direct pore formation? Each of these labels has arrows pointing up to the same label: call swelling resulting in plasma membrane rupture. Trophic Factors Induce Inactivation of Bad, a Pro-apoptotic BH3-Only Protein We saw earlier that neurotrophins such as NGF protect neurons from cell death; this effect is mediated by inactivation of a pro-apoptotic BH3-only protein called Bad. In the absence of trophic factors, Bad is nonphosphorylated and binds to Bcl-2, or to the closely related antiapoptotic protein , at the outer mitochondrial membrane (see Figure 22-42). This binding inhibits the ability of Bcl-2 and to bind Bax and Bak, thereby allowing Bak and Bax to oligomerize in the plane of the outer mitochondrial membrane and form pores and holes in it, triggering release of cytochrome c and induction of apoptosis.
Apoptosis in Vertebrates Is Induced by BH3-Only Pro-apoptotic Proteins That Are Activated by Environmental Stresses
A number of trophic factors, including NGF, induce the PI-3 kinase signaling pathway, leading to the activation of protein kinase B (see Figure 16-17). Activated protein kinase B phosphorylates Bad; phosphorylated Bad cannot bind to Bcl-2 or and is found in the cytosol complexed to the phosphoserine-binding protein 14-3-3 (see Figure 16-13). As evidence for this pathway, a constitutively active form of protein kinase B can rescue cultured neurotrophin-deprived neurons, which would otherwise undergo apoptosis and die. These findings support the mechanism for the survival action of trophic factors depicted in Figure 2242. In other cell types, different trophic factors promote cell survival through post-translational modification of other components of the celldeath machinery. Apoptosis in Vertebrates Is Induced by BH3-Only Pro-apoptotic Proteins That Are Activated by Environmental Stresses Whereas nematodes contain a single BH3-only protein, EGL-1, mammals express at least eight, including Bad, in a cell type- and stress-specific manner. The pro-apoptotic activities of these proteins are tightly regulated by diverse transcriptional and post-transcriptional mechanisms. Two BH3only proteins, Puma and the related protein Noxa (see Figure 22-42), are transcriptionally induced by the p53 protein (see Figures 19-32 and 1934); they induce apoptosis primarily by binding to and inactivating the
Apoptosis and Necroptosis Can Be Triggered by Tumor Necrosis Factor, Fas Ligand, and Related Death Proteins
anti-apoptotic Bcl-2 and proteins, thus promoting the polymerization and pore formation of pro-apoptotic Bcl-2 family members Bax and Bak. This interaction is part of the checkpoint pathway by which unrepaired damage to DNA can induce apoptosis; thus the loss of p53 seen in many cancers allows cells to live with severe DNA damage (see Figure 25-23). Another BH3-only protein, Bim, is normally sequestered by the microtubule cytoskeleton by binding to a dynein light chain (see Chapter 18). Detachment of cells from their substratum disrupts integrin signaling, rearranges the cytoskeleton, and leads to release of Bim. Like Puma, Bim binds directly to Bcl-2, releasing Bak and Bax from Bcl-2 and allowing formation of pores and holes in the outer mitochondrial membrane (see Figure 22-42). Thus apoptosis of mammalian cells is regulated by a careful balance of activities of antiapoptotic proteins such as Bcl-2 and and multiple pro-apoptotic BH3-only proteins. Apoptosis and Necroptosis Can Be Triggered by Tumor Necrosis Factor, Fas Ligand, and Related Death Proteins Although cell death can arise as a default in the absence of survival factors, apoptosis can also be stimulated by positively acting death signals that activate the extrinsic apoptosis pathway; the extrinsic pathway activated by death ligands can also activate the alternative programmed
cell death pathway termed necroptosis. Murder of infected cells is an effective means of stemming the spread of a pathogen throughout an organism. To that end macrophages and other immune system cells are recruited to sites of infection, where they become activated and produce cytokines such as tumor necrosis factor alpha (TNFα) that can remain attached to the cell surface or be cleaved off and function as a secreted hormone. TNFα, in turn, triggers the death of adjacent cells that might have been infected. However, overproduction of TNFα can lead to the tissue destruction seen in certain chronic inflammatory diseases (see
Chapter 24). Another important death-inducing signal, the Fas ligand, is a cell-surface protein produced by activated natural killer cells and cytotoxic T lymphocytes. By binding to the Fas protein on target cells, this signal can trigger death of virus-infected cells, some tumor cells, and foreign graft cells. Depending on the type of cell and infection, death can be by apoptosis or by necroptosis (discussed later in this section). Both TNFα, depicted in Figure 22-44, and the Fas ligand (also called CD95 ligand) are trimeric proteins present on the surface of one cell that bind to death receptors on an adjacent cell. Each of these death receptors has an extracellular domain that binds to its cognate ligand, a single transmembrane domain, and an intracellular protein-protein interaction domain known as a death domain (DD), which is why they are called death receptors. These receptors are activated when binding of a trimeric ligand brings the receptor molecules into close proximity to allow the formation of an intracellular complex that recruits downstream signaling molecules, similar to the formation of the interleukin 1 signalsome (see Figure 16-
31). We will use TNFα, a highly pro-inflammatory cytokine involved in mediating a myriad of human diseases, as an example. Binding of TNFα to the TNF receptor 1 (TNFR1), a DD-containing death receptor, leads to the formation of an intracellular signaling complex which is initiated by the recruitment of another two DD-containing signaling molecules, TNF receptor-associated death domain protein (TRADD) and receptor-interacting protein kinase 1 (RIPK1) (Figure 2244a). TRADD and RIPK1 in turn recruit a large signaling complex, not depicted in the figure, including E3 ubiquitin ligases, deubiquitinating enzymes, and kinases, which collectively decides, within a few minutes, whether the cell should activate NF-κB to survive, or die by apoptosis or necroptosis. The activation of RIPK1 kinase is a key decisive event that can initiate cell death by either apoptosis or necroptosis. Activated RIPK1 can bind to FADD, which then serves as an adapter to recruit and activate caspase-8, an initiator caspase (Figure 22-44a). FADD can also be directly activated by binding to TRADD in RIPK1-independent apoptosis activation. Like the other initiator caspase, caspase-9, caspase-8 is activated by dimerization following binding of two molecules to the FADD proteins recruited to an active death receptor trimer. Once activated, caspase-8 cleaves and thus activates several effector caspases which then cleave many cellular proteins to complete apoptotic cell death. Caspase-8 also cleaves the BH3-only protein BH3-interacting-domain death agonist (Bid). The resulting tBid fragment (but not the full-length
Bid) then binds to Bcl-2 on the outer mitochondrial membrane, leading to the dissociation of Bik and Bax and formation of Bak/Bax pores and holes, release of cytochrome c into the cytosol, and activation of the intrinsic apoptosis pathway (see Figure 22-42) as well. Necroptosis, a genetically programmed type of necrosis, is a well-defined defense mechanism against certain viruses. As part of their replication cycle, many viruses produce an inhibitor of caspase-8, a key component of the TNFα cell murder pathway depicted in Figure 22-44a, thus preventing apoptosis and allowing continued replication of the virus and spread of the infection to neighboring cells. In cells lacking functional caspase-8, TNFα triggers an alternative pathway, necroptosis. In this pathway, activated RIPK1 binds to RIPK3, a family member of RIPK1, promoting activation of RIPK3 and triggering necroptosis. In this process, activated RIPK3 in turn phosphorylates another essential protein termed MLKL. Phosphorylation causes MLKL to alter its conformation and form oligomers that insert into the plasma membrane and form holes, allowing entry. The influx of causes the cell and its organelles to swell and burst, releasing its contents into the extracellular space. Some of the released intracellular proteins trigger activation of immune-system cells and cause tissue inflammation and damage. Inflammation due to necroptosis has been implicated in mediating major human inflammatory diseases, including rheumatoid arthritis, inflammatory bowel disease, neurodegenerative diseases such as amyotrophic lateral sclerosis and Alzheimer’s disease and progressive atherosclerotic lesions.
As we discussed in Chapter 16, protein inhibitors of TNFα are among the most widely used therapeutics for many inflammatory diseases; inhibiting RIPK1 kinase is another promising approach to treating human diseases characterized by necrosis and inflammation. Recall that TNFα activates multiple signal transduction pathways: one leads to activation of the transcription factor NF-κB (see Figure 16-30), a second to apoptosis, and the third to necroptosis (see Figure 22-44). Much work needs to be done to understand the regulation of each of these pathways and their interactions, as this cytokine is involved in many inflammatory diseases. KEY CONCEPTS OF SECTION 22.4 Cell Death and Its Regulation All vertebrate cells require trophic factors to survive. In the absence of these factors, cells commit suicide. Genetic studies in C. elegans have defined an evolutionarily conserved apoptotic pathway with three major components: membrane-bound regulatory proteins, cytosolic regulatory proteins, and apoptotic proteases (called caspases in vertebrates) (see Figure 22-36). Once activated, caspases cleave specific intracellular substrates, leading to the demise of a cell. Other proteins (e.g., CED-4, Apaf-1) that bind regulatory proteins and caspases are required for caspase activation (see Figures 22-36, 22-37, and 22-43). Survival of motor and sensory neurons during development is mediated by neurotrophins released from target tissues that bind to Trk receptor tyrosine kinases on the neuronal growth cones (see Figure 22-40), activating an anti-apoptotic response via the PI-3 kinase pathway (see Figure 22-42). The Bcl-2 family contains both pro-apoptotic and anti-apoptotic proteins; most are transmembrane proteins and engage in protein-protein interactions. In mammals, apoptosis can be triggered by oligomerization of Bax or Bak proteins in the outer mitochondrial membrane, leading to efflux of cytochrome c and SMAC/DIABLO proteins into the cytosol; these proteins then promote caspase activation and cell death. Bcl-2 proteins can restrain the oligomerization of Bax and Bak, inhibiting cell death.
Pro-apoptotic BH3-only proteins (e.g., Puma, Bad) are activated by environmental stresses and stimulate the oligomerization of Bax and Bak, allowing cytochrome c to escape into the cytosol, bind to Apaf-1, and thus activate caspases. Direct interactions between pro-apoptotic and anti-apoptotic proteins lead to cell death in the absence of trophic factors. Binding of extracellular trophic factors can trigger changes in these interactions, resulting in cell survival (see Figure 22-42). Binding of extracellular death signals, such as tumor necrosis factor and Fas ligand, to their receptors oligomerizes an associated protein (FADD), which in turn triggers the caspase cascade, leading to cell murder by apoptosis (see Figure 22-44a). In the presence of inhibitors of caspase-8, tumor necrosis factor induces necroptosis (Figure 22-44b). Intracellular proteins released into the surroundings as a result can cause inflammation and tissue damage.
Key Terms
End of Chapter Visit Achieve to access study tools and to learn more about the content in this chapter: Perspectives for the Future Chapter References Additional study tools, including videos, animations, and quizzes Key Terms apoptosis asymmetric cell division Bcl-2 family BH3-only protein blastocyst caspases cell lineage cytokine embryonic stem (ES) cell germ line induced pluripotent stem (iPS) cell inner cell mass (ICM) meristem multipotent
Review the Concepts
necroptosis necrosis neoblast neurotrophins planar cell polarity (PCP) pluripotent polarity progenitor (precursor) cell programmed cell death somatic cell stem cell stem-cell niche symmetric cell division totipotent trophectoderm (TE) trophic factor Review the Concepts 1. What two properties define a stem cell? Distinguish between a totipotent stem cell, a pluripotent stem cell, and a precursor (progenitor) cell. 2. Where are stem cells located in plants? Where are stem cells located in adult animals? How does the concept of a stem cell differ between animal and plant systems? 3. In 1997, Dolly the sheep was cloned by a technique called somatic-cell nuclear transfer (or nuclear-transfer cloning). A
nucleus from an adult mammary cell was transferred into an egg from which the nucleus had been removed. The egg was allowed to divide several times in culture, then the embryo was transferred to a surrogate mother who gave birth to Dolly. Dolly died in 2003 after mating and giving birth herself to viable offspring. What does the creation of Dolly tell us about the potential of nuclear material derived from a fully differentiated adult cell? Does the creation of Dolly tell us anything about the potential of an intact, fully differentiated adult cell? 4. Identify whether the following contain totipotent, pluripotent, or multipotent cells: (a) inner cell mass, (b) morula, (c) eight-cell embryo, (d) trophectoderm. 5. True or false: Differentiated somatic cells have the capacity to become reprogrammed to become other cell types. Provide one line of evidence discussed in the chapter that corroborates your response. 6. Explain how intestinal stem cells were first identified and then experimentally shown to be multipotent stem cells. 7. Explain how hematopoietic stem cells were experimentally shown to be both multipotent and capable of self-renewal. 8. The nematode C. elegans has proved to be a valuable model organism for studies of cell birth, cell asymmetry, and cell death. What properties of C. elegans render it so well suited for these studies? Why is so much information from C. elegans experiments of use to investigators interested in mammalian development? 9. Asymmetric cell division often relies on cytoskeletal elements to generate or maintain the asymmetric distribution of cellular
factors. In Saccharomyces cerevisiae, what factor is localized to the bud by myosin motors? In Drosophila neuroblasts, what factors are localized apically by microtubules? 10. Discuss the role of par genes in generating anterior/posterior polarity in the C. elegans embryo. 11. How do studies of nerve and muscle development in knockout mice support the statement that apoptosis is a default pathway in neuronal cells? 12. Compare and contrast cell death by apoptosis and by necrosis. 13. Identify and list the functions of the three general classes of proteins that control cell death. 14. Based on your understanding of the events surrounding cell death, predict the effect(s) of the following on the ability of a cell to undergo apoptosis: a. Functional CED-9; nonfunctional CED-3 b. Active Bax and cytochrome c; nonfunctional caspase-9 c. Inactive PI-3 kinase; active Bad 15. TNF and Fas ligand bind cell-surface receptors to trigger cell death. Although the death signal is generated external to the cell, why do we consider the death induced by these molecules to be apoptotic rather than necrotic? 16. Predict the effects of the following mutations on the ability of a cell to undergo apoptosis: a. Mutation in Bad such that it cannot be phosphorylated by protein kinase B (PKB) b. Overexpression of Bcl-2 c. Mutation in Bax such that it cannot form homodimers
One common characteristic of cancer cells is a loss of function in the apoptotic pathway. Which of the mutations listed above might you expect to find in some cancer cells? 17. How do IAPs (inhibitors of apoptosis proteins) interact with caspases to prevent apoptosis? How do mitochondrial proteins interact with IAPs to prevent inhibition of apoptosis?