Introduction
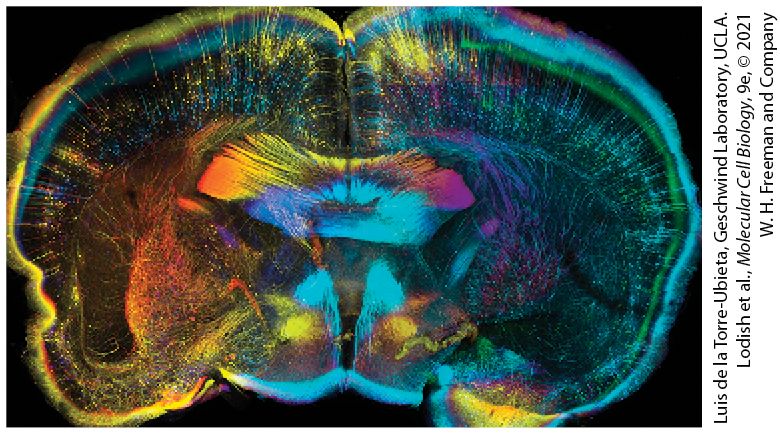
Chapter 23 Cells of the Nervous System Coronal slice of CLARITY-treated adult mouse brain expressing green fluorescent protein (GFP) in a subset of neurons (Thy1-GFP). CLARITY renders tissue optically transparent, permitting deep and complete imaging of tissues. Each section was stained with antibodies to GFP and color coded by depth to facilitate individual neuron visualization. This approach provides unprecedented opportunity to image intact brains at cellular resolution, paving the way to a comprehensive understanding of how the brain is wired.
23.1 Neurons and Glia: Building Blocks of the Nervous System
23.2 Voltage-Gated Ion Channels and the Propagation of Action Potentials
23.4 Sensing the Environment: Touch, Pain, Taste, and Smell
23.5 Forming and Storing Memories The nervous system, which consists of the central (brain and spinal cord) and peripheral (nerves outside of the brain and spinal cord) nervous systems, regulates all aspects of bodily function and is staggering in its complexity. The 1.3 kg adult human brain — the control center that stores, computes, integrates, and transmits information — contains nearly 100 billion nerve cells, called neurons. These neurons are interconnected by some 100 trillion synapses, the junction points where two or more neurons communicate. An individual neuron can form synapses with up to 10,000 other neurons. Neurons are organized into interconnected units or circuits that have discrete functions. Some circuits sense features of both the external and internal environments of organisms and transmit this information to the brain for processing and storage. Others regulate the contraction of muscles and the secretion of hormones. Yet other circuits regulate cognition, emotion, and innate as well as learned behaviors. In addition to neurons, the nervous system contains glial cells. Historically considered to
function simply as support cells for neurons, it is now recognized that glia play active roles in brain function. The biology of the cells of the nervous system is remarkable on two levels. First, neurons are the most morphologically polarized and compartmentalized cells in the body; their unique morphology is supported by remarkable cell biological processes, from cytoskeletal dynamics and membrane trafficking to signal transduction and activitydependent gene regulation. Second, individual neurons and glia combine to form exquisitely complex and precise networks or circuits. Neural circuits are not completely hardwired; instead, the connectivity of neurons changes with experience through a process known as synaptic plasticity, in which experience modifies the strength and number of synaptic connections between neurons. A central focus of modern brain biology is to understand the logic underlying both the formation and the plasticity of neural circuits. While the structure and function of nerve cells is understood in great detail, the mechanisms by which neural circuits form, change with experience, and process and compute information remain a mystery. These issues represent some of the most exciting areas of twentyfirst-century biology and inspired President Obama to launch the Brain Research through Advancing Innovative Neurotechnologies (BRAIN) Initiative in 2013. One major aim of this ongoing, large-scale national effort is to catalogue and characterize the extraordinary diversity of cell types in the brain and to understand the logic by which these cells form circuits that underlie brain functions.
The vertebrate nervous system is anatomically divided into the central nervous system, which contains the nerves and glia located inside the brain and spinal cord, and the peripheral nervous system, which contains the nerves and glia located outside the brain and spinal cord. Despite being anatomically separate, the central and peripheral nervous systems are functionally interconnected, with peripheral nerves serving as communication conduits between the brain and the body. The central nervous system itself can be divided into four primary components: the spinal cord, brain stem, cerebellum, and cerebrum (Figure 23-1a). Each region has discrete functions. The spinal cord conducts sensory and motor information from the body to the brain, the brain stem regulates basic functions such as breathing and blood pressure, the cerebellum controls motor function, and the cerebrum processes motor and sensory information, language, learning and memory, and other higher level functions. These primary components are further divided into distinct functional areas; for example, the cerebrum is organized into distinct frontal, temporal, parietal, and occipital lobes, each of which is involved in specific, though partially overlapping, functions (Figure 23-1b). Although there are neurons and glia that have distinct properties and characteristics specific to these various regions, the functional specialization of each brain region emerges primarily from differences in circuit connectivity rather than from differences in constituent cell types.
FIGURE 23-1 Major areas of the mammalian central nervous system and typical morphology of two types of mammalian neurons. (a) The mammalian central nervous system is composed of four major areas: the spinal cord, which relays sensory and motor information from the body to the brain; the brain stem, which controls many basic functions such as breathing and heart rate; the cerebellum, which coordinates movements; and the cerebrum, which controls higher functions such as language, learning, memory and emotion. (b) The mammalian cerebrum consists of four lobes, each of which mediates specific, partially overlapping functions. The lobes are: the frontal lobe, involved in executive functions such as problem solving, language, and impulse-control; the temporal lobe, involved in auditory processing, memory, and emotion; the parietal lobe, involved in touch, taste, temperature, and movement sensations; and the occipital lobe, involved primarily in vision. (c) A multipolar interneuron has profusely branched dendrites, which receive signals at synapses from several hundred other neurons. Small voltage changes imparted by inputs in the dendrites can sum to give rise to the more massive action potential, which starts in the hillock. A single, long axon that branches laterally at its terminus transmits signals to other neurons. (d) A motor neuron innervating a muscle cell typically has a single, long axon extending from the cell body to the effector cell. In mammalian motor neurons, an insulating sheath of myelin usually covers all parts of the
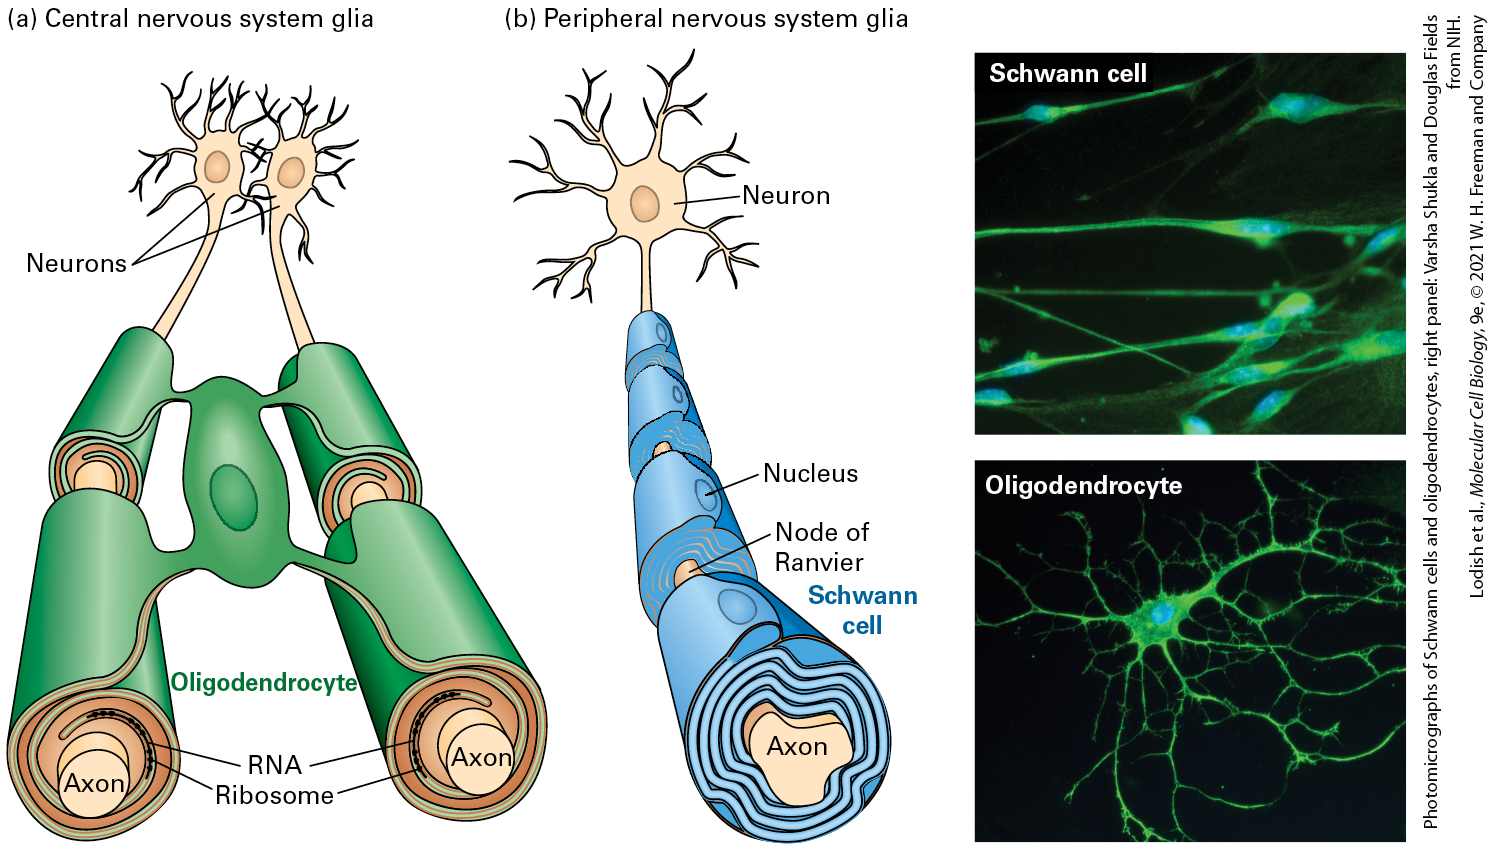
axon except at the nodes of Ranvier and the axon termini. The myelin sheath is composed of cells called oligodendrocytes in the central nervous system and Schwann cells in the peripheral nervous systems, both of which are glial cells (see Figure 23-18). Description The illustration labeled (a) shows the lateral view of the human brain and spinal cord. The cerebrum of the brain is labeled and a darker area in the posterior region of the brain is labeled cerebellum. To the left of the cerebellum, is the brain stem and it continues with the spinal cord. The illustration labeled (b) shows the lateral view of the human brain. The top left of the brain is labeled frontal lobe. Behind this to the right is labeled parietal lobe. Below both upper lobes is an area labeled temporal lobe, and behind this at the back of the brain is a part labeled occipital lobe. The illustration labeled (c) shows a multipolar interneuron. At the left is a web of lines labeled dendrites. The web is attached to the right to a cell with a blue nucleus labeled cell body. Just to the right of this, an axon line is drawn, and the thicker end at the left is labeled axon hillock. The axon line from left to right is labeled direction of action potential. At the right end is a smaller web of lines with rounded ends. The rounded ends are labeled axon terminus. The illustration labeled (d) shows a motor neuron. A very short set of web-like lines is labeled dendrite and it attaches to a cell body that looks larger than the multipolar interneuron cell body. An area labeled axon hillock is very close to the cell body at the right. The axon line looks like a red line surrounded by a row of two ovals on each side. The oval shapes are labeled myelin sheath. Between each oval is a point labeled nodes of Ranvier. At the end of the neuron at the right is a sheathed set of web-like lines. The ends of these lines have a narrow tip labeled axon terminus and three of these are attached to a cylinder labeled muscle. A label along the axon from left to right reads, direction of action potential. Indeed, despite the multiple types and shapes of neurons that are found in metazoan organisms, all nerve cells share common properties that make them specialized for communicating information using a combination of electrical and chemical signaling, as we will see in more detail in the next section. Electrical signals conduct information within neurons, which are
usually highly polarized cells with extensions whose lengths are orders of magnitude greater than the cell soma (Figure 23-1c and d). The electrical pulses that travel along neurons are called action potentials, and information is encoded as the frequency at which action potentials are fired. Owing to the speed of electrical transmission, neurons are champion signal transducers, much faster than cells that secrete hormones. In contrast to the electrical signals that conduct information within a neuron, chemical signals transmit information between cells, utilizing processes similar to those employed by other types of signaling cells (see Chapters 15 and 16). Taken together, the electrical and chemical signaling of the nervous system allows it to detect external stimuli, integrate and process the information received, relay it to higher brain centers, and generate an appropriate response to the stimulus. For example, sensory neurons have specialized receptors that convert diverse types of stimuli from the environment (e.g., light, touch, sound, odorants) into electrical signals. These electrical signals are then converted into chemical signals that are passed on to other cells called interneurons, which convert the information back into electrical signals. In some circuits, this information is then transmitted to muscle-stimulating motor neurons or to other neurons that stimulate other types of cells, such as glands (an example of this type of simple neural circuit is shown in Figure 23-4). In this chapter, we will focus on neurobiology at the cellular and molecular level. We will start by looking at the general architecture of neurons, at how they carry signals, and at how neurons and glia arise from
stem cells. Next we will focus on ion flow, channel proteins, and membrane properties: how electrical pulses move rapidly along neurons. Third, we will examine communication between neurons where electrical signals traveling along a cell are translated into a chemical pulse between cells and then back into an electrical signal in the receiving cells. We will then examine neurons in several sensory tissues, including those that mediate our senses of touch, taste, and olfaction. The speed, precision, and integrative power of neural signaling enable the accurate and timely sensory perception of a swiftly changing environment. In the last section, we will turn to the circuits, neurons, and cell biological mechanisms underlying the storage of memories. A great deal of information about nerve cells has been gleaned from analyses of humans, mice, nematodes, and flies bearing mutations that affect specific functions of the nervous system. In addition, molecular cloning and structural analysis of key neuronal proteins, such as voltagegated ion channels and receptors, have helped elucidate the cellular machinery underlying complex brain functions such as instinct, learning, memory, and emotion. We will be referring to these model organisms and methodologies throughout this chapter.
23.1 Neurons and Glia: Building Blocks of the Nervous System
23.1 Neurons and Glia: Building Blocks of the Nervous System In this section, we examine the structure of neurons and connect this structure to the function of these cells. Neurons are distinguished by their elongated, asymmetric shape, by their highly localized proteins and organelles, and most of all by channel proteins that controls the flow of ions across the plasma membrane. Specific properties of neurons also give the nervous system considerable powers of signal analysis. One neuron can respond to the inputs from multiple neurons, generate electrical signals, and transmit the signals to multiple neurons. For example, a neuron might transmit a signal only if it receives five simultaneous activating signals from input neurons. The receiving neuron measures both the amount of incoming signal and whether the five signals are roughly synchronous. Fast synaptic input from one neuron to another can be either excitatory — combining with other signals to trigger electrical transduction in the receiving cell — or inhibitory, discouraging such transmission. In addition to excitatory and inhibitory synapses, neurons receive slower neuromodulatory inputs such as norepinephrine, dopamine, serotonin, and acetylcholine, which activate G protein–coupled receptors (see Chapter 15) to change the threshold for excitation or inhibition. Thus the properties and connections of individual neurons set the stage for integration and refinement of information. The output of a nervous system is the result of its circuit properties, that is, the wiring or interconnections
Information Flows Through Neurons from Dendrites to Axons
between neurons and the strength of these interconnections. We will begin by looking at how signals are received and sent, and in subsequent parts of the chapter we will look at the molecular details of the machinery involved. Information Flows Through Neurons from Dendrites to Axons Neurons arise from roughly spherical neuroblast precursors. Newly born neurons can migrate long distances before growing into dramatically elongated cells. Fully differentiated neurons take many forms, but generally share certain key features (see Figure 23-1c and d). The nucleus is found in a rounded part of the cell called the cell body. Branching cell processes called dendrites (from the Greek for “treelike”) are found at one end and are the main structures where signals are received from other neurons via synapses. Incoming signals are also received at synapses that form on neuronal cell bodies. Neurons often have extremely long dendrites with complex branches, particularly in the central nervous system (i.e., the brain and spinal cord). This allows them to form synapses with, and receive signals from, a large number of other neurons — up to tens of thousands. Thus the converging dendritic branches allow signals from many cells to be received and integrated by a single neuron. When a neuron is first differentiating, the end of the cell opposite the dendrites undergoes dramatic outgrowth to form a long, extended arm called the axon, a structure that essentially acts as a transmission wire.
Information Moves Along Axons as Pulses of Ion Flow Called Action Potentials
The growth of axons must be controlled so that proper connections are formed; this is accomplished through a complex process called axon guidance that involves dynamic changes to the cytoskeleton (see Section 18.8). The diameters of axons vary from just a micrometer in certain neurons of the human brain to a millimeter in the giant axon of the squid. Axons can be meters in length (e.g., in giraffe necks) and are often partly covered with electrical insulation called the myelin sheath (see Figure 231d), which is made by specific classes of glial cells: oligodendrocytes (in the central nervous system) and Schwann cells (in the peripheral nervous system). The insulation speeds electrical transmission. The short, branched ends of the axon at the opposite end of the neuron from the dendrites are called the axon termini. This is where signals are passed along to the next neuron or to another type of cell, such as a muscle or hormone-secreting cell. The asymmetry of the neuron, with dendrites at one end and axon termini at the other, is indicative of the primarily unidirectional flow of information from dendrites to axons. Information Moves Along Axons as Pulses of Ion Flow Called Action Potentials Nerve cells are members of a class of excitable cells, which also includes muscle cells, cells in the pancreas, and some others. Like all metazoan cells, excitable cells have an inside-negative voltage or electric potential gradient across their plasma membranes, the membrane potential (see
Chapter 11). Unlike other cells, neurons can use their unique electrical properties to send signals. The signals take the form of brief local voltage changes, from inside-negative to inside-positive, an event designated depolarization. A powerful surge of depolarizing voltage change, moving from one end of the neuron to the other, is called an action potential. A recording of several depolarization events, with the neuron going from inside-negative to neutral to inside-positive, is shown in Figure 23-2. At the peak of an action potential, the membrane potential can be as much as +50 mV (inside-positive), a net change of ~120 mV. As we will see in greater detail in Section 23.2, an action potential moves along the axon to the axon terminus at speeds of up to 100 meters per second. In humans, for instance, axons may be more than a meter long, yet it takes only a few milliseconds for an action potential to move along their length. Neurons can fire repeatedly after a brief recovery period, for example, every 4 milliseconds (ms), as in Figure 23-2. After the action potential passes through a section of a neuron, channel proteins and pumps restore the inside-negative resting potential (repolarization). The restoration process chases the action potential down the axon to the terminus, leaving the neuron ready to signal again.
EXPERIMENTAL FIGURE 23-2 Recording of an axonal membrane potential over time reveals the amplitude and frequency of action potentials. An action potential is a sudden, transient depolarization of the membrane, followed by repolarization to the resting potential of about −70 mV. The axonal membrane potential can be measured with a small electrode placed into it (see Figure 11-19). This recording shows the neuron generating one action potential about every 4 milliseconds. Description In the graph, the horizontal axis represents and the vertical axis represents membrane potential in millivolts ranging from minus 70 to plus 50 millivolts. The plotted data show a flat line at minus 70 millivolts that rapidly rises to 50 millivolts and then drops to minus 70 again in a period of approximately two milliseconds. Several of these peaks are separated by periods of 4 milliseconds. The upward part of the peak is labeled depolarization, and the downward part, repolarization. The flat part at the end of the graph, at minus 70 millivolts, is labeled the resting membrane potential.
Information Flows Between Neurons via Synapses
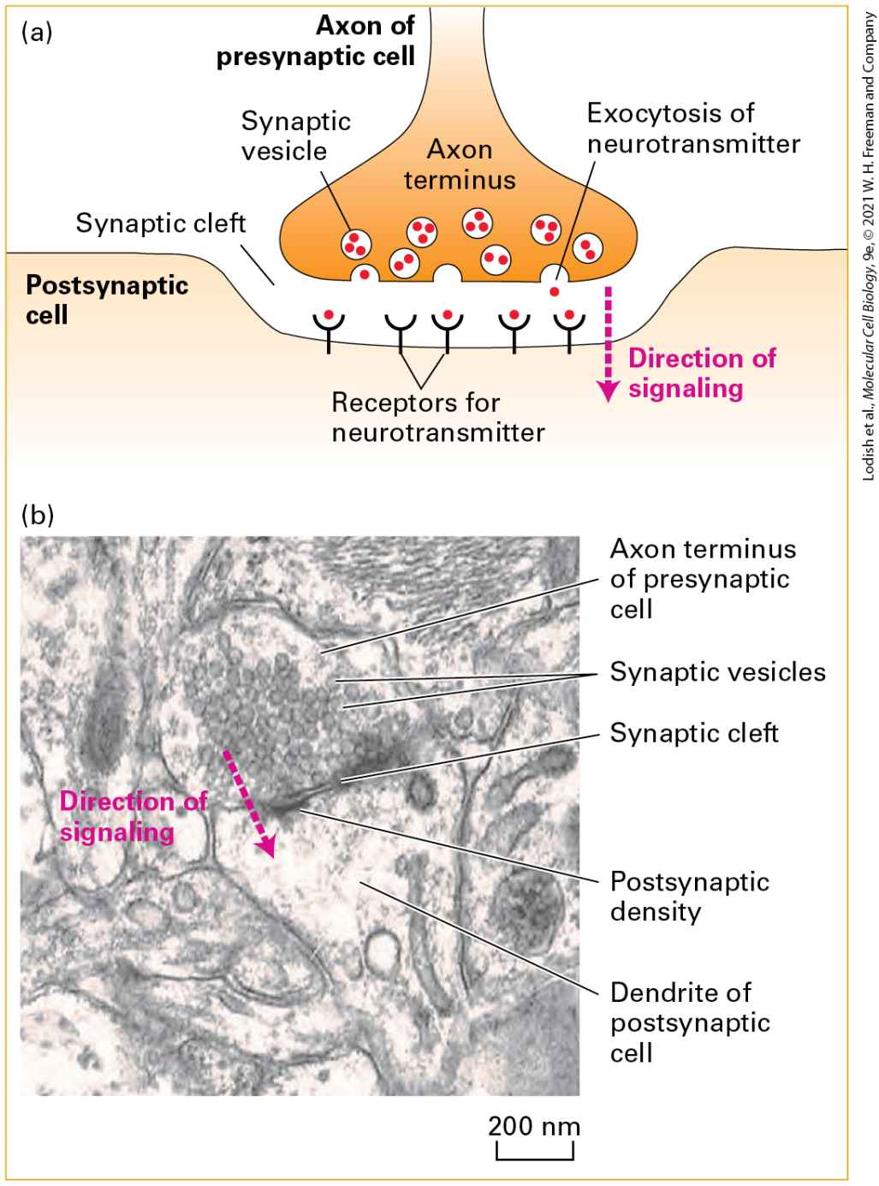
Action potentials are all or none. Once the threshold to start one is reached, a full firing occurs. The signal information is therefore carried primarily not by the intensity of the action potentials but by their timing and frequency. The stronger the stimulus, the higher the frequency of action potential firing. As previously mentioned, neurons are not the only excitable cells in the body. Muscle contraction is triggered by motor neurons that synapse directly on excitable muscle cells (see Figure 23-1d). Insulin secretion from the β islet cells of the pancreas is triggered by neurons. In both cases, the activating event involves an opening of plasma membrane channels that causes changes in the transmembrane flow of ions and in the electrical properties of the regulated, non-neuronal cells. Information Flows Between Neurons via Synapses How is information communicated between neurons? Axon termini from one neuron are closely apposed to dendrites of another, at junctions called chemical synapses or simply synapses (Figure 23-3). The axon terminus of the presynaptic cell contains many small vesicles, termed synaptic vesicles, each of which is filled with a single kind of small molecule known as a neurotransmitter. Arrival of an action potential at a presynaptic terminus causes an influx of calcium that triggers exocytosis of a small number of synaptic vesicles, releasing their content of neurotransmitter molecules.
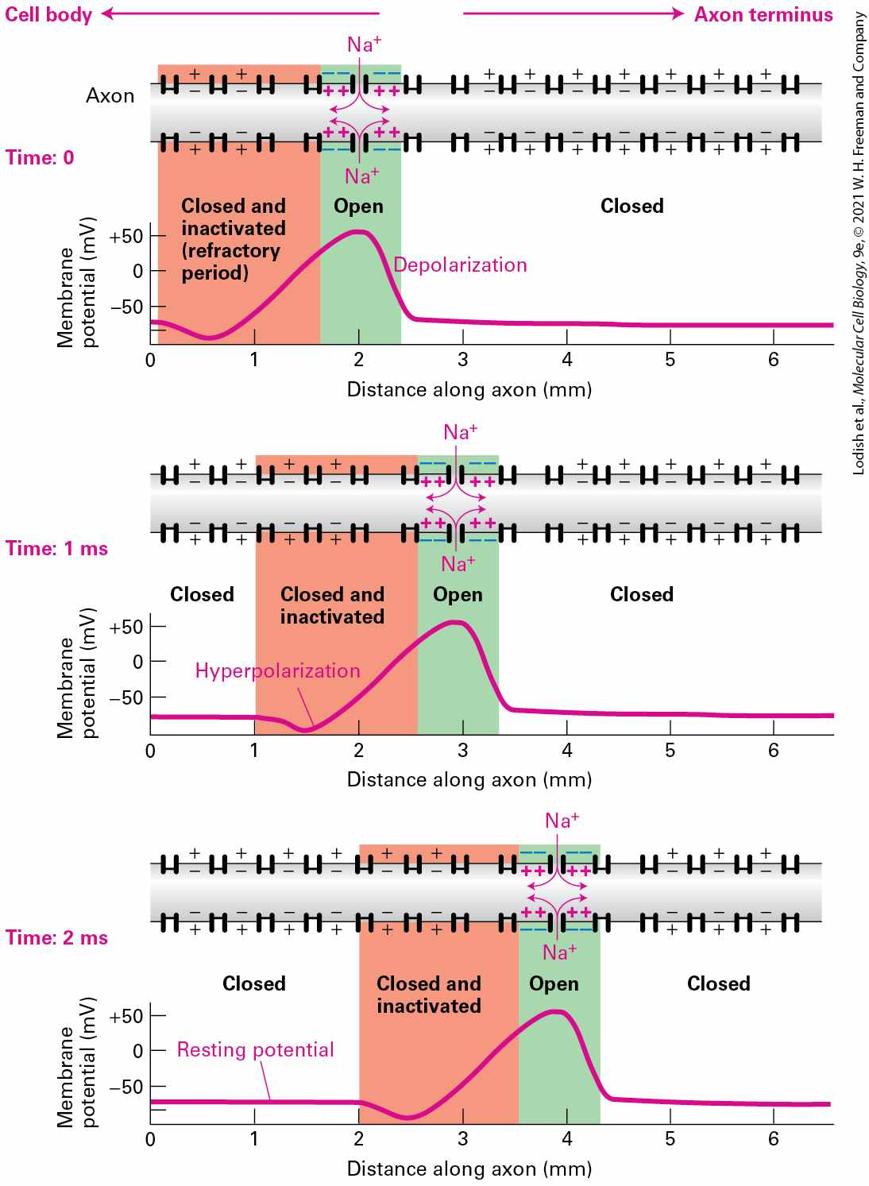
FIGURE 23-3 A chemical synapse. (a) A narrow region, the synaptic cleft, separates the plasma membranes of the presynaptic and postsynaptic cells. Arrival of action potentials in a presynaptic cell causes exocytosis at a synapse of a small number of synaptic vesicles, releasing their content of neurotransmitters (red circles). Following their diffusion across the synaptic cleft, the neurotransmitters bind to specific receptors on the plasma membrane of the postsynaptic cell. These signals either depolarize the postsynaptic membrane (making the potential inside less negative), tending to induce an action potential in the cell, or hyperpolarize the postsynaptic membrane (making the potential inside more negative), inhibiting action potential induction. (b) Electron micrograph showing an axon terminus filled with synaptic vesicles forming a synapse with a postsynaptic dendrite, with its characteristic postsynaptic density. In the synaptic region, the plasma membrane of the presynaptic cell is specialized for vesicle exocytosis; synaptic vesicles containing a neurotransmitter are clustered in these regions. The opposing membrane of the postsynaptic cell (in this case, a neuron) contains receptors for the neurotransmitter. The postsynaptic density is a protein-dense specialization that contains receptors, adhesion molecules, scaffolding molecules, signaling molecules, and cytoskeletal elements. [Part (b) republished with permission from Oxford University Press, from S. Okabe, 2013, “Fluorescence Imaging of Synapse Formation and Remodeling,” Microscopy 62(1):51–62; permission conveyed through Copyright Clearance Center, Inc.] Description The illustration labeled (a) shows the axon terminus of a presynaptic cell in proximity to the surface of a postsynaptic cell. The direction of signaling is from the presynaptic cell to the postsynaptic cell. The axon terminus has 7 white circles with red dots in them labeled synaptic vesicles containing neurotransmitters. There are three vesicles open at the bottom of the axon with the red dots exiting the cell. A line going left to right is labeled postsynaptic cell and dips down in the center in the shape of the presynaptic cell. Along this line are y-shaped lines labeled receptors for neurotransmitter and red dots are entering the top of the Y shapes. A dotted line arrow points downward and is labeled direction of signaling. The micrograph labeled (b) shows shades of gray that has the same dotted line arrow labeled direction of signaling located in the center area of the picture. The axon terminus of the presynaptic cell is labeled at the top of the arrow. Small circles in this cell are labeled synaptic vesicles. A
The Nervous System Uses Signaling Circuits Composed of Multiple Types of Neurons
dark horizontal line is shown labeled synaptic cleft and postsynaptic density. A light area below the dark line is labeled dendrite of postsynaptic cell. Neurotransmitters diffuse across the synapse in about 0.5 ms and bind to receptors on the dendrite of the adjacent neuron. Binding of neurotransmitter triggers the opening or closing of specific ion channels in the plasma membrane of postsynaptic cell dendrites, leading to changes in the membrane potential in this localized area of the postsynaptic cell. Generally these changes depolarize the postsynaptic membrane. The local depolarization, if large enough, triggers an action potential in the axon. This type of chemical neurotransmission is unidirectional, from the axon termini of the presynaptic cell to dendrites of the postsynaptic cell. In some synapses, the effect of the neurotransmitters is to hyperpolarize and therefore lower the likelihood of an action potential in the postsynaptic cell. A single axon in the central nervous system can synapse with many neurons and induce responses in all of them simultaneously. Conversely, sometimes multiple neurons must act on the postsynaptic cell roughly synchronously to have a strong enough impact to trigger an action potential. Neuronal integration of depolarizing and hyperpolarizing signals determines the likelihood of an action potential. Thus neurons employ a combination of extremely fast electrical transmission along the axon with rapid chemical communication between cells. This is known as electrochemical signaling.
The Nervous System Uses Signaling Circuits Composed of Multiple Types of Neurons In complex multicellular animals, neurons form signaling circuits composed of multiple, distinct types of neurons. In the spinal cord, signaling circuits that relay information between peripheral and central nervous systems consist of three basic types of nerve cells: afferent neurons, interneurons, and efferent neurons. Afferent neurons, also known as sensory neurons, carry nerve impulses from receptors or sense organs toward the central nervous system (i.e., the brain and spinal cord). These neurons report an event that has happened, like the arrival of a flash of light or the movement of a muscle. A touch or a painful stimulus creates a sensation in the brain only after information about the stimulus travels there via afferent nerve pathways. Efferent neurons, also known as effector neurons, carry nerve impulses away from the central nervous system to generate a response. A motor neuron, for example, carries a signal to a muscle to stimulate its contraction (see Figure 23-1d); other effector neurons stimulate hormone secretion by endocrine cells. Interneurons, the largest group, relay signals from afferent to efferent neurons and to other interneurons as part of a neural pathway. An interneuron can bridge multiple neurons, allowing integration or divergence of signals and sometimes extending the reach of a signal. In a simple type of circuit called a reflex arc, interneurons connect multiple sensory and motor neurons, allowing one sensory neuron to affect multiple
motor neurons and one motor neuron to be affected by multiple sensory neurons; in this way, interneurons integrate and enhance reflexes. For example, the knee-jerk reflex in humans, illustrated in Figure 23-4, involves a complex reflex arc in which one muscle is stimulated to contract while another is inhibited from contracting. The reflex also sends information to the brain to announce what happened. Such circuits allow an organism to respond to a sensory input by the coordinated action of sets of muscles that together achieve a single purpose.
FIGURE 23-4 The knee-jerk reflex. A tap of the hammer stretches the quadriceps muscle, thus triggering electrical activity in the stretch receptor sensory neuron. The action potential, traveling in the direction of the top blue arrow, sends signals to the brain, so we are aware of what is happening, and also to two kinds of cells in the dorsal-root ganglion that is located in the spinal cord. One cell, a motor neuron that connects back to the quadriceps (red), stimulates muscle contraction so that you kick the person who hammered your knee. The second connection activates (or “excites”) an inhibitory interneuron (black). The interneuron has a damping effect, blocking activity by a flexor motor neuron (green) that would in other circumstances activate the hamstring muscle that opposes the quadriceps. In this way, relaxation of the hamstring is coupled to contraction of the quadriceps. This is a reflex because movement requires no conscious decision.
Description The illustration shows the drawing of the leg. At the front of the leg, on the right, the quadriceps muscle, an extensor, is attached to the knee cap from above. At the rear of the leg, the hamstring, a flexor, is attached to a lower leg bone. To the right is a drawing of the spine with a horizontal cutout with a butterfly-shaped area inside of the vertebral bone. In the knee, at the lower quadriceps is a blue structure labeled stretch receptor of sensory neuron. A blue line from this structure connects to the spine. An area of the line expands into dendrites and is labeled dorsal-root ganglion. The blue line continues into the spine and branches into three. The top one points upward and is labeled axon carries information to brain. The center one leads to a black dendrite pattern and is labeled inhibitory interneuron. This black dendrite is very short and while still in the spine attaches to a green dendrite. This dendrite is labeled motor neuron cell body, and the green line goes into the hamstring muscle with the motor neuron axon terminus. The bottom blue line connects to a pink dendrite, which connects to a pink line that moves to the quadriceps and is labeled motor neuron. The simple signaling circuits described above, however, do not directly explain higher order brain functions such as reasoning, computation, and memory development. Neurons in these circuits include an array of excitatory neurons, which promote action potential firing in a target neuron; inhibitory neurons, which inhibit action potential firing in a target neuron; and neuromodulatory neurons, which modulate the threshold for action potential firing in a target neuron. Typical neurons in the brain receive signals from up to a thousand other neurons and, in turn, can direct chemical signals to many other neurons. The output of the nervous system depends on its circuit properties — the amount of wiring, or interconnections, between neurons and the strength of these interconnections. As complex and diverse as neural circuits are, they are comprised of a few basic patterns. These include divergence, in which one
presynaptic neuron makes connections with many postsynaptic neurons; convergence, in which one postsynaptic neuron receives inputs from many presynaptic neurons; and feedback, in which the output of a postsynaptic neuron feeds back onto a presynaptic neuron or even onto itself (Figure 23-5). Feedback circuits form what are known as closed loops, in which the output of a system is used as the input. In a positive feedback circuit, the output sustains or increases the activity of the initial input. In a negative feedback circuit, the output inhibits the activity of the initial input.
FIGURE 23-5 Common patterns in neural circuits. Neurons connect to one another to form functional circuits. Shown are three common patterns of connectivity that are found in
Glial Cells Form Myelin Sheaths and Support Neurons
many neural circuits. (a) In divergent neural circuits, a single neuron sends axonal branches to contact many different target neurons. (b) In convergent neural circuits, many different neurons send axonal branches that converge to contact a single target neuron. (c) In feedback circuits, a neuron sends an axon to communicate with a neuron that is presynaptic to it. Combinations of these and other patterns of interconnectivity function to communicate information within neural circuits. Description In the illustration labeled (a) the axon leaves the cell body and splits into three axonal branches going to the right. The axon for the first cell is labeled. There are arrows pointing to the right where the branches each meet another cell body and labeled synapses. Each of the axonal branches makes a synapse with a postsynaptic cell. The direction of the action potential is indicated with an arrow moving from the cell body to the axon terminus. Each cell has an axon going off to the right and labeled direction of action potential signaling. The illustration labeled (b) shows three cell bodies, each with an axon moving to the right and all joining one cell body. Arrows show the direction from left to right. The illustration labeled (c) shows one cell body with an axon coming out to the right. It is connecting to a second cell body, which has two axons one straight to the right, the other curving to the left, and attaching to the beginning cell. Glial Cells Form Myelin Sheaths and Support Neurons Neurons are not the only essential cells in the human brain. Glial cells (also known as neuroglia or simply glia), which play many roles in the brain but do not themselves conduct electrical impulses, are present in the brain in large numbers. While many textbooks claim that glia outnumber neurons by 10 to 1, recent experiments have suggested that the ratio of glia to neurons in the human brain is closer to 1:1, although there is significant
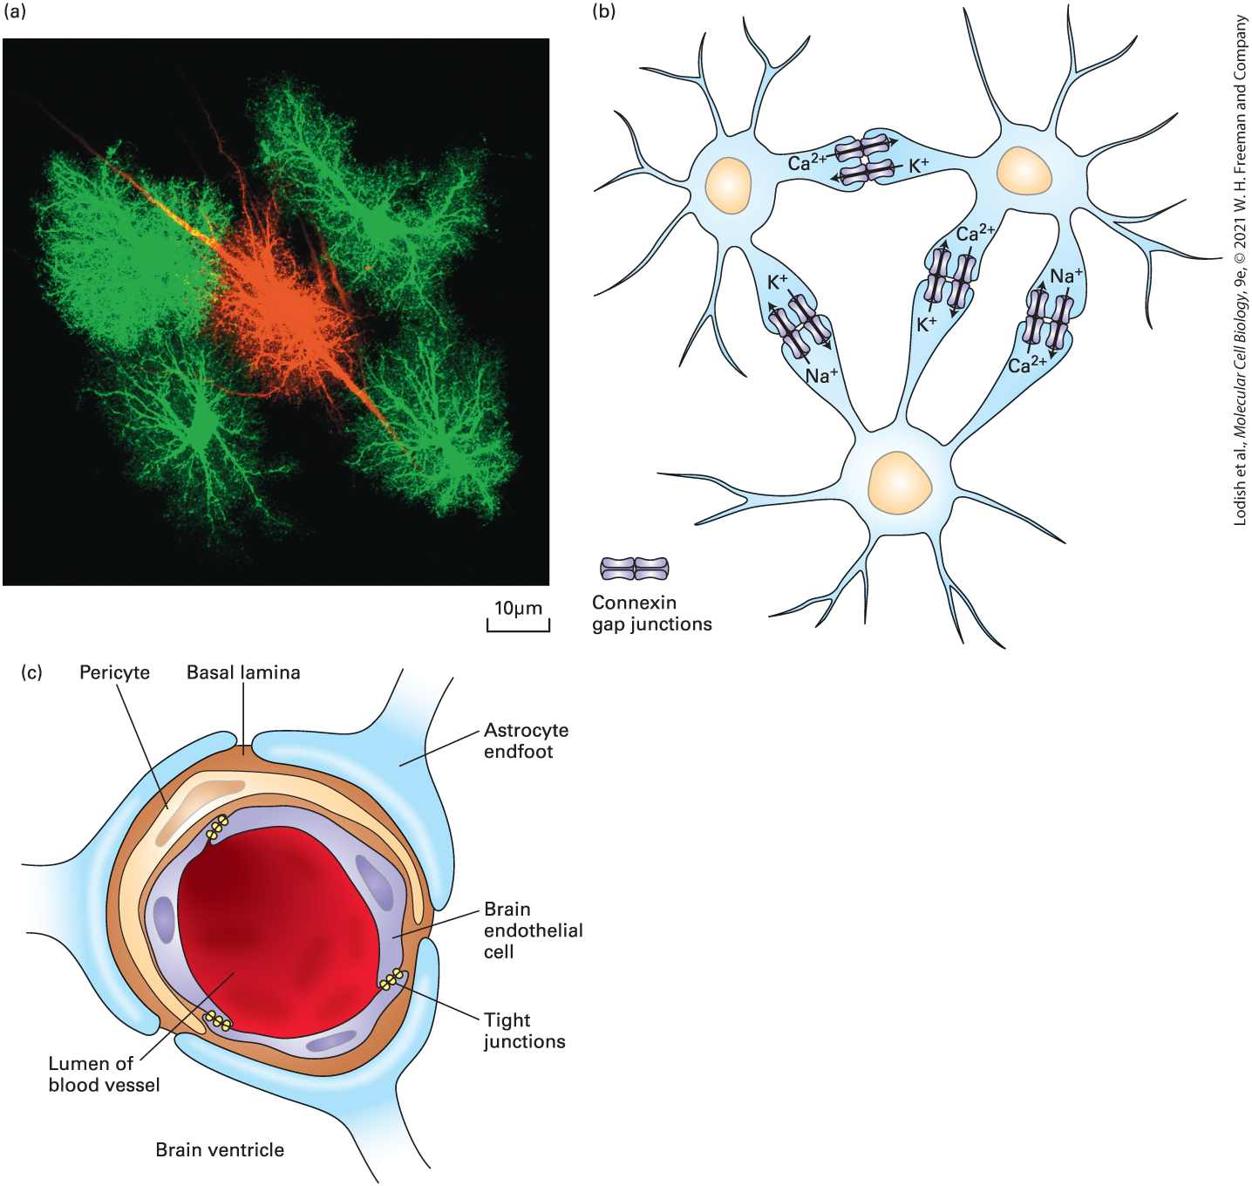
variability between species and brain areas. As described above, of the four principal types of glia, two produce myelin sheaths — the insulation that surrounds neuronal axons (see Figure 23-1d): oligodendrocytes make sheaths for the central nervous system (CNS), and Schwann cells make them for the peripheral nervous system (PNS). (Both types of glia are discussed in more detail in Section 23.2.) Astrocytes, a third type of glia, provide growth factors and other signals to neurons and also receive signals from neurons. A fourth type of glia, microglia, constitutes a part of the CNS immune system. While microglia are not related by lineage to neurons or to other glia, they do play important roles in brain development and health. We describe the function of astrocytes below; oligodendrocytes and Schwann cells will be discussed in Section 23.2, and microglia in Section 23.3. Astrocytes, named for their starlike shape (Figure 23-6), constitute about a third of the brain’s mass and ~20 percent to 40 percent of the brain’s cells. Recent studies have revealed a remarkable molecular, physiological, and functional diversity of astrocytes. Understanding the function of astrocytes in brain function is an area of active investigation. Astrocytes surround many synapses and dendrites; the , and channels found in astrocyte plasma membranes influence the concentration of free ions in the extracellular space, thus affecting the membrane potentials of neurons and of the astrocytes themselves. Astrocytes produce abundant extracellular matrix proteins, some of which are used as guidance cues by migrating neurons. They also produce a host of growth factors that carry a variety of types of information to neurons. In addition, astrocytes release several factors that are necessary for proper
synapse formation between neurons, as discussed in Section 23.3. Astrocytes are joined to each other by gap junctions (see Figure 20-21 for structure of gap junctions), so changes in ionic composition in a given astrocyte are communicated to adjacent astrocytes. In this way, like neurons, astrocytes can also form networks, called astrocyte syncytia, within the nervous system.
FIGURE 23-6 Astrocytes: morphology, gap-junction-mediated networks of astrocytes, and interaction with endothelial cells at the blood-brain barrier. (a) Astrocytes are so
named for their starlike shape. In this photomicrograph, astrocytes are labeled in magenta with an antibody that recognizes glial fibrillary acidic protein (GFAP), an intermediate filament protein that reveals the major branches of the astrocytes. One astrocyte in the middle of the field was also microinjected with a soluble green fluorescent dye, which shows that, in addition to the major branches (seen as white from the merged magenta and green labels), astrocytes contain many fine branches called branchlets. (b) Astrocytes are connected to one another through gap junctions (see Figure 20-21), through which ions such as , and can rapidly flow from one astrocyte to another to form networks or syncytia of astrocytes. Not shown here, astrocytes also form gap junctions with neurons and oligodendrocytes. (c) Astrocytes contribute to the blood-brain barrier. Capillaries in the brain are formed by endothelial cells that are interconnected by tight junctions that are impermeable to most molecules. Transport between cells is blocked, so only small molecules that can diffuse across plasma membranes or substances specifically transported through cells can cross the barrier. Certain astrocytes surround the blood vessels, in contact with the endothelial cells, and send secreted protein signals to induce the endothelial cells to produce a selective barrier. The endothelial cells (purple) are ensheathed by a layer of basal lamina (brown), which contains contractile cells called pericytes (yellow) and are contacted on the outside by astrocyte processes (blue). See N. J. Abbott, L. Rönnbäck, and E. Hansson, 2006, Nat. Rev. Neurosci. 7:41−53. [Part (a) UC San Diego, Eric Bushong, Maryann Martone, Mark Ellisman (2002) CCDB:1053, rattus norvegicus, protoplasmic astrocyte. CIL. Dataset. https://doi:org/10.7295/W9CCDB1053.] Description The micrograph labeled (a) shows one red area in the center surrounded by four green areas. The illustration labeled (b) shows three nerve cell bodies in blue, each with a nucleus. Each cell body has dendrites surrounding it. One dendrite from the top-left cell is connected to the dendrite on the top right cell. The top-right cell has two dendrites attached to the bottom cell, and the top-left cell has one dendrite also connected to the bottom cell. At each connection, there are two sets of rectangular light blue figures. In the connection between the two top cells, the top set is labeled Ca 2 plus, and the bottom is labeled K plus. In the left side connection of the top-right cell to the bottom cell, the left set of rectangles is labeled K plus, and the right is labeled Ca 2 plus. The right side connection has Ca 2 plus and Na plus. The connection from the top-left cell
Neural Stem Cells Form Nerve and Glial Cells in the Central Nervous System
to the bottom one is labeled Na plus and K plus. The illustration labeled (c) shows a large red area in the center, labeled lumen of blood vessel. Surrounding the red center is a blue area of cells, labeled brain endothelial cells. Between each of the brain cells is a tight junction. Surrounding the left, top, and part of the right side of the brain cells is an area labeled pericyte. Surrounding all of this is a brown area labeled basal lamina. Attached to this basal lumina are three blue foot like structures labeled astrocyte end foot. Text at the bottom of the illustration reads, brain ventricle. Some astrocytes are also critical regulators of the formation of the bloodbrain barrier, which controls what types of molecules can travel out of the bloodstream into the brain and vice versa (see Figure 23-6c). Blood vessels in the brain supply oxygen and remove and deliver glucose and amino acids, with capillaries found within a few micrometers of every cell. The blood-brain barrier is formed by tight junctions (Chapter 20) between endothelial cells in brain blood vessels. Endfeet projections from astrocytes interact closely with the brain endothelial cells and with the basal lamina (see Figures 20-23 and 20-24), which contains contractile cells called pericytes, to regulate blood-brain barrier integrity and function. Many scientists are interested in understanding the blood-brain barrier both because it appears to break down in certain neurological diseases and because it represents a major barrier to the development of effective neurotherapeutics. Neural Stem Cells Form Nerve and Glial Cells in the Central Nervous System
The great interest in the formation of the nervous system and in finding better ways to prevent or treat neurodegenerative diseases through cell replacement therapies has made the characterization of neural stem cells and understanding what triggers their differentiation into mature neurons and glia an important goal. Much of what we understand about neural and glial stem cells comes from studies of embryonic brain development. The earliest stages of vertebrate neural development involve the rolling up of a tube of ectoderm, the cell layer that lines the outside of the embryo and extends the length of the embryo from head to tail (Figure 23-7a). This neural tube will form the brain and spinal cord. Initially, the thickness of the tube is a single layer of cells, and these cells, referred to as neuroepithelial cells, serve as the embryonic neural stem cells (NSCs) that will give rise to the entire central nervous system. The inside of the neural tube will expand in the forebrain to form the fluid-filled compartments called ventricles, and the cellular layer lining the neural tube, called the ventricular zone (VZ), is where most cell division will take place.
FIGURE 23-7 Formation of the neural tube and division of neural stem cells. (a) Early in vertebrate development a part of the ectoderm rolls up and separates from the rest of the cells. This forms the epidermis (gray) and the neural tube (blue). Near the interface between the two, neural crest cells form and then migrate to contribute to skin pigmentation, nerve formation, craniofacial skeleton, heart valves, peripheral neurons, and other structures. The
notochord, a rod of mesoderm for which chordates are named, provides signals that affect cell fates in the neural tube. The interior of the neural tube will become a fluid-filled series of chambers called ventricles. Neural stem cells located adjacent to the ventricles, described as being in the ventricular zone (VZ), will divide to form neurons that migrate radially outward to form the layers of the nervous system. (b) Early in development, in the neuroepithelium, neuroepithelial cells (NECs, yellow) divide to generate more NECs. Some are also thought to generate early neurons also called neuroblasts (purple). As development progresses, NECs convert into radial glial cells (RGCs). RGCs divide symmetrically or asymmetrically to generate neurons (purple) or intermediate progenitor cells (IPCs, green), which in turn generate neurons. The RGCs elongate and send a process down to the VZ and a process up to the meninges. Newly born neurons migrate along the elongated RGC to reach their final position, such that the oldest neurons are closest to the VZ and the youngest neurons are closest to the meninges. In the cortex, this means that the youngest neurons are in the most superficial cortical layers (I and II) and the oldest born neurons are in the deeper cortical layers (V and VI). (c) Near the end of embryonic development, RGCs convert into astrocyte intermediate precursor cells (aIPCs) and oligodendrocyte intermediate precursor cells (oIPCs), which in turn generate astrocytes and oligodendrocytes, respectively. See A. Kriegstein and A. Alvarez-Buylla, 2009, Annu. Rev. Neurosci. 32:149– 184. Description The illustration on the left, labeled (a) shows the epidermis and neural tube in the early vertebrate development. At the top is a flat bar with curved edges and a white cylinder under it. This is labeled neural plate. A downward arrow shows the plate curving upward into a letter V shape with the white cylinder at the outside bottom of the V. This cylinder is labeled notochord. Another downward arrow shows a gray bar layered over the neural plate, which itself is now an oval shape. This gray layer is labeled epidermis and the area is labeled dorsal. Below the epidermis is red dots labeled neural crest cells that move away from the neural tube (oval). There is a small area on the left lower inside of the oval that is labeled ventricular zone. The illustration labeled (b) is just above the early embryonic, embryonic, and after birth labels. A yellow cell has two elongated ends at top and bottom is labeled N E C. A sideward arrow shows the same cell with a small purple cell with two dendrites coming away from it. This purple cell is labeled neuroblast. A second sideward arrow points to the cell, now blue and with a much longer axon like line coming from the top is labeled R G C. Coming from this is
a green oval cell labeled I P C. A last sideward arrow points to the blue cell with the I P C cell attached to its axon and labeled migrating neuron. A dotted sideward arrow points to a group of 10 rows of 3 cells each, every 2 rows have a different color. The bottom of this group is labeled cortex. At the left, the rows are labeled, from the top, 1, 2, 3, 4, 5, 6 and these numbers are labeled cortical layers. On the right, a downward arrow is with the label birthday of neurons and youngest at the top, oldest at the bottom of the group. The illustration labeled (c) shows a blue neuron cell labeled R G C with a yellow oval cell labeled a l P C coming away from it to a cell with 8 dendrites and labeled astrocyte. Another R G C neuron is to the right of this but has a purple oval cell coming away from it labeled a O P C. The a O P C is moving to a cell with five cell foot-like appendages and is labeled oligodendrocyte. Labeling and tracing experiments have been done in mouse models to determine how cells are born and where they go after birth. The embryonic neuroepithelial cells (NECs), the neural stem and progenitor cells that line the ventricle, can divide symmetrically, producing two daughter stem or progenitor cells side by side (Figure 23-7b), thereby expanding the progenitor population. Around the same time that neuron production begins, the NECs transform into radial glial cells (RGCs), which are the primary precursor cells during embryonic neurogenesis. Through a series of symmetric and asymmetric cell divisions, radial glial cells give rise to neurons and intermediate precursor cells (see Figure 23-7b). During later stages of brain development, RGCs also give rise to glia, including both astrocytes and oligodendrocytes (Figure 23-7c). For many years it was believed that no new nerve cells are formed in the adult brain. Most mammalian brain cells indeed stop dividing by adulthood, but some cells in the lateral ventricle, in a region called the adult subventricular zone (SVZ), and in a region of the hippocampus (a
region of the temporal lobe involved in memory formation) called the subgranular zone (SGZ) continue to act as stem cells to generate new neurons (Figure 23-8a). Similar to other types of stem cells, these neural stem cells are functionally defined by their ability to self-renew and differentiate into neural lineages, including neurons, astrocytes, and oligodendrocytes (Figure 23-8b). To identify and characterize neural stem cells, cells isolated from the SVZ were cultured with growth factors such as FGF2 or EGF. Some of the cells survived and proliferated in an undifferentiated state; that is, they could self-renew. In the presence of other growth factors, these undifferentiated cells gave rise to neurons, astrocytes, or oligodendrocytes. The successful establishment of selfrenewing and multipotent cells from the adult brain provides strong evidence for the presence of nerve stem-cell populations. While the function of these new neurons in the adult brain is not yet understood, studies in rodents have shown that their survival is increased by enriched environments and by exercise (Figure 23-8b, bottom panel). Such studies may eventually provide the basis for therapeutic applications in neural repair in humans.
FIGURE 23-8 Neurogenesis in the adult brain. (a) New neurons are born in two regions of the adult brain, the subgranular zone (SGZ) within the dentate gyrus (DG) in the hippocampus and the subventricular zone (SVZ). Neurons derived from neural stem cells in the SVZ migrate to the olfactory bulb (OB) via the rostral medial stream (RMS) in mice. (b) Newly born neurons in the SGZ were labeled with a retrovirus that expresses GFP. Shown are sections of the DG from control mice and from mice that were allowed to exercise on a running wheel in their cages for a week. The newly born neurons are green, and the extensive dendritic branches they have developed indicate that they have survived and have become incorporated into the hippocampus. All the other cells in the hippocampus are labeled with a red nuclear marker. The dense red labeling in the DG (the sideways V-shaped structure) are the cell bodies of the granule cells. The other red cell bodies represent glial cells and inhibitory neurons. As this image illustrates, the percentage of granule cells in the DG that are newly born is very small and is significantly increased by running. Description The illustration labeled (a) shows the outline of the side view of a brain. At the center, is a shark fin-shaped structure labeled subgranular zone (S G Z). Another label from the fin-shaped structure is the dentate gyrus (D G) of the hippocampus. To the right of the S G C is a black triangular figure labeled ventricle at the top, and subventricular zone (S V Z) at the right. A red line comes from the right-hand corner of this triangle and is labeled rostral medial stream (R M S). The line ends at an orange oval labeled olfactory bulb (O B). In the micrographs labeled (b) one image shows neurons in newly born inactive mice. The neurons are green, fibrous structures emerging from a red layer, which corresponds to the dentate gyrus. There are few visible neurons. In contrast, in the image of the dentate gyrus of mice that have been allowed to run, many neurons are visible projecting from the dentate gyrus. KEY CONCEPTS OF SECTION 23.1 Neurons and Glia: Building Blocks of the Nervous System Neurons are highly asymmetric cells composed of multiple dendrites at one end, a cell body containing the nucleus, a long axon, and axon termini.
Neurons carry information from one end to the other using pulses of ion flow across the plasma membrane; signals are received by the dendrites and transmitted by the axons (see Figure 23-1). The resting potential in unstimulated neurons is −70 mV; a stimulus causes opening of channels that leads to depolarization to +50 mV (see Figure 23-2). The strong pulse of voltage change, called an action potential, travels down the axon by the opening of channels at speeds of up to 100 meters per second. Neurons connect to other cells via synapses. At the axon termini of the presynaptic cell the signal is converted from electrical to chemical to stimulate the postsynaptic cell. Upon stimulation by an action potential, axon termini release, by exocytosis, small packets of chemicals called neurotransmitters. Neurotransmitters diffuse across the synapse and bind to receptors in the postsynaptic cells (see Figure 23-3). Neurons form circuits that usually consist of afferent (sensory) neurons, interneurons, and efferent (motor) neurons. Neurons connect with one another to form circuits. Three fundamental patterns of neuronal connectivity include divergent, convergent, and feedback circuits (see
Figure 23-5). Glial cells are abundant in the nervous system and serve many purposes. Two types of glial cells, oligodendrocytes and Schwann cells, build the myelin insulation that coats many neurons. Astrocytes, another type of glial cell, wrap their processes around synapses and blood vessels and promote formation of the blood-brain barrier (see
Figure 23-6). Astrocytes also secrete proteins that stimulate synapse formation and participate in the formation and function of neural circuits. Embryonic neural stem cells in the ventricular zone give rise to all cells in the central nervous system. These stem and progenitor cells undergo a series of symmetric and asymmetric cells to produce more progenitor cells, glia, and neurons (see Figure 237). In the adult brain, new neurons are born in the subventricular zone (SVZ) and in the subgranular zone (SGZ) in the dentate gyrus region of the hippocampus (see Figure 23-8).
23.2 Voltage-Gated Ion Channels and the Propagation of Action Potentials
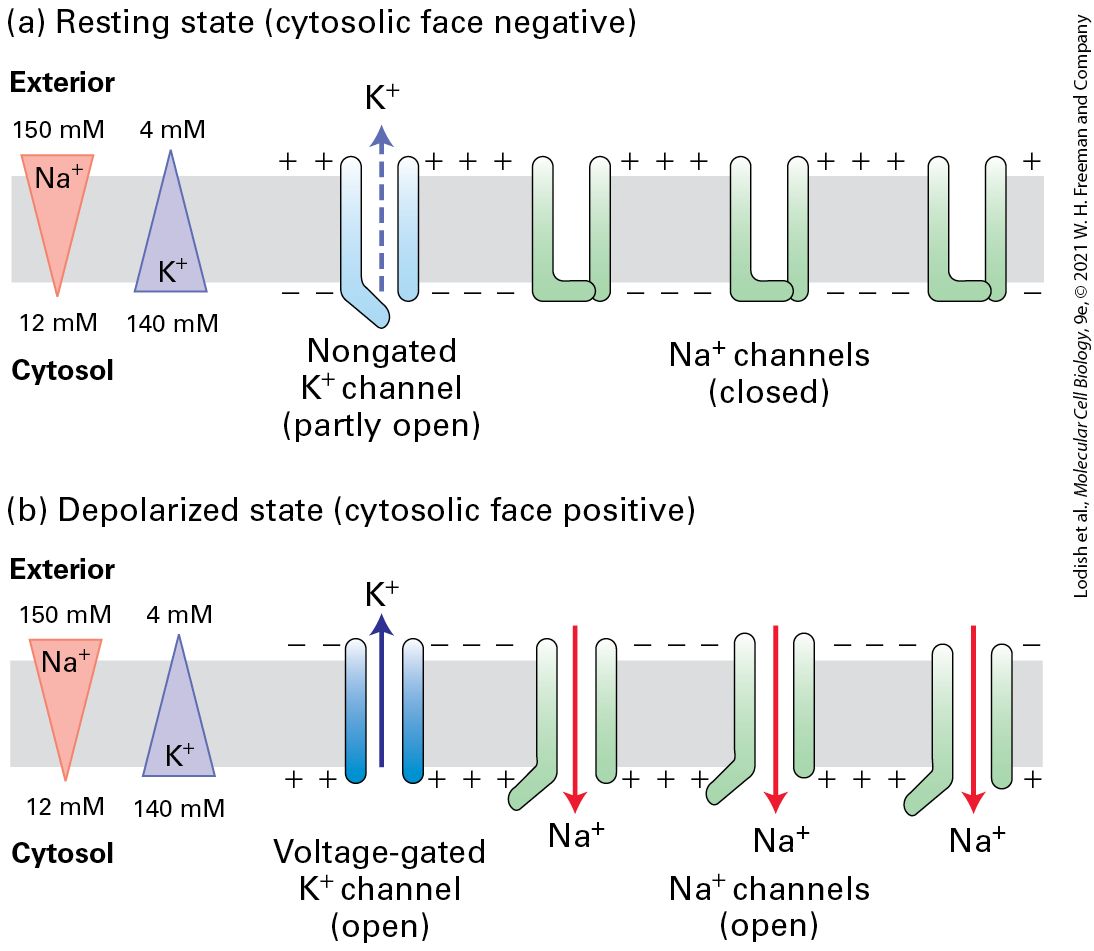
23.2 Voltage-Gated Ion Channels and the Propagation of Action Potentials Information processing in the nervous system depends on signaling in neurons, which in turn depends on the function of a set of membrane channels. In Chapter 11, we learned that an electric potential of ~70 mV (cytosolic face negative) exists across the plasma membrane of all cells, including resting nerve cells. This resting membrane potential is generated by outward movement of ions through open nongated channels in the plasma membrane and is driven by the concentration gradient (greater in the cytosol than in the extracellular medium). The high cytosolic and low cytosolic concentrations, relative to their concentrations in the extracellular medium, are generated by the plasma membrane pump (see Figure 11-12), which uses the energy released by hydrolysis of phosphoanhydride bonds in ATP to pump outward and inward. The entry of ions into the cytosol from the medium is thermodynamically favored, driven both by the concentration gradient (greater in the extracellular medium than in the cytosol) and the inside-negative membrane potential (see Figure 11-24). However, most channels in the plasma membrane are closed in resting cells (including neurons), so little inward movement of ions can occur (Figure 23-9a).
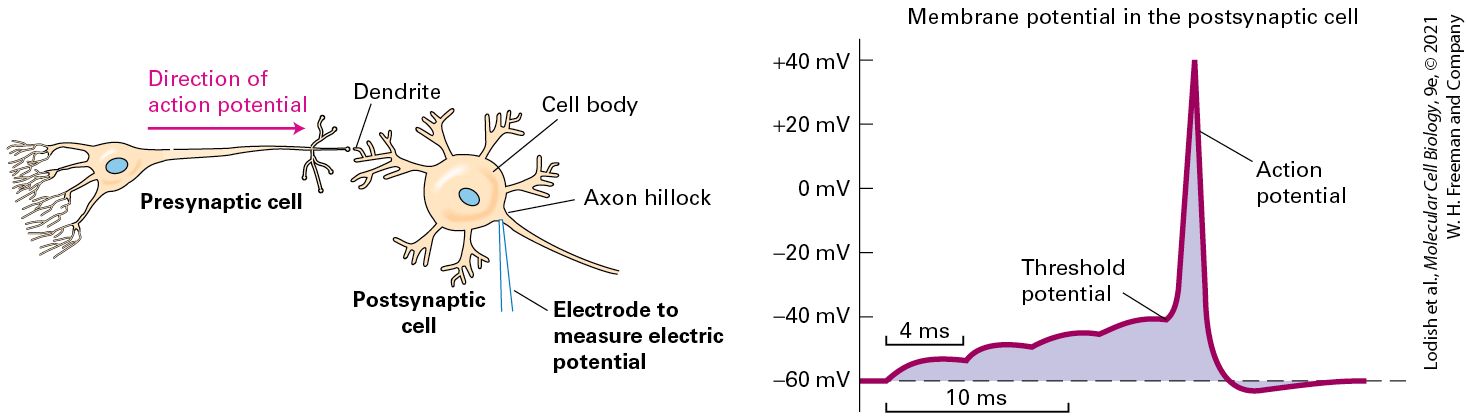
FIGURE 23-9 Depolarization of the plasma membrane is due to opening of gated channels. (a) In resting neurons, a type of nongated channel (blue) is open part of the time, but the more numerous gated channels (green) are closed. The movement of ions outward establishes the inside-negative membrane potential characteristic of most cells. (b) Opening of gated channels permits an influx of sufficient ions to cause a reversal of the membrane potential. In the depolarized state, voltage-gated channels open and subsequently repolarize the membrane. Note that the flows of ions are too small to have much effect on the overall concentration of either or in the cytosol or exterior fluid. Description
The Magnitude of the Action Potential Is Close to ENa and Is Caused by Na+ Influx Through Open Na+ Channels
The illustration labeled (a) shows a cell membrane with three closed sodium channels and one partly open, non-gated potassium channel. The sodium concentration gradient is 150 millimolar to the exterior of the cell and 12 millimolar in the cytosol. The potassium concentration gradient is four millimolar outside of the cell and 140 millimolar in the cytosol. A negative charge is on the cytosolic face of the membrane. Some potassium ions pass through the partly open potassium channel. The illustration labeled (b) shows a cell membrane with three open sodium channels embedded in the membrane. A voltage-gated potassium channel is open. The sodium concentration gradient is 150 millimolar to the exterior of the cell and 12 millimolar in the cytosol. The potassium concentration gradient is four millimolar outside of the cell and 140 millimolar in the cytosol. Potassium ions pass through the potassium channel from the cytosol to the cell exterior, and sodium ions enter the cytosol through the open sodium channels. The charge on the cytosolic face is positive. During an action potential, some of these channels open, allowing inward movement of ions, which depolarizes the membrane. Action potentials are propagated down the axon because a change in voltage in one part of the axon triggers the opening of channels in the next section of the axon. Such voltage-gated channels therefore lie at the heart of neural transmission. In this section, we first introduce some of the key properties of action potentials, which move rapidly along the axon from the cell body to the axon termini. We then describe how the voltage-gated channels responsible for propagating action potentials in neurons operate. In the last part of the section, we will see how the myelin sheath, produced by glial cells, increases the speed and efficiency of electrical transmission in nerve cells. The Magnitude of the Action Potential Is Close to and Is Caused by
Sequential Opening and Closing of Voltage-Gated Na+ and K+ Channels Generate Action Potentials
Influx Through Open Channels The depolarization of the plasma membrane is driven by the opening of channels. Figure 23-9b illustrates how the membrane potential will change if enough channels in the plasma membrane open. The resulting influx of positively charged ions into the cytosol will more than compensate for the efflux of ions through open resting channels. The result will be a net inward movement of cations, generating an excess of positive charges on the cytosolic face of the plasma membrane and a corresponding excess of negative charges on the extracellular face (owing to the ions “left behind” in the extracellular medium after influx of ions). In other words, the plasma membrane becomes depolarized to such an extent that the inside face becomes positive with respect to the external face. Recall from Chapter 11 that the equilibrium potential of an ion is the membrane potential at which there is no net flow of that ion from one side of the membrane to the other due to the balancing of two opposing forces, the ion concentration gradient and the membrane potential. At the peak of depolarization in an action potential, the magnitude of the membrane potential is very close to the equilibrium potential given by the Nernst equation (Equation 11-2), as would be expected if opening of voltage-gated channels is responsible for generating action potentials. Sequential Opening and Closing of Voltage-Gated and Channels
Generate Action Potentials The cycle of changes in membrane potential and return to the resting value that constitutes an action potential lasts 1−2 milliseconds and can occur hundreds of times a second in a typical neuron (see Figure 23-2). The rapidity of these changes in membrane potential is critical to the ability of neurons to encode the intensity of stimuli by modulating the frequency of action potential firing, with low-intensity stimuli driving lower frequency of action potential firing, and stronger stimuli driving higher frequency of action potential firing. The cyclical changes in the membrane potential result first from the opening and closing of a number of voltage-gated channels (i.e., channels opened by a change in membrane potential) in a segment of the axonal plasma membrane and then from the opening and closing of voltage-gated channels. The role of these channels in the generation of action potentials was elucidated in classic studies done on the giant axon of the squid, in which multiple microelectrodes can be inserted without causing damage to the integrity of the plasma membrane. However, the same basic mechanism, involving voltage-gated and channels, is used by all neurons. Voltage-Gated Channels As just discussed, voltage-gated channels are closed in resting neurons. Depolarization of the membrane (as occurs when neurotransmitter stimulates a postsynaptic cell) causes a conformational change in these channel proteins that opens a gate on the cytosolic surface
of the pore, permitting ions to pass through the pore into the cell. The greater the initial membrane depolarization, the more voltage-gated channels that open and the more ions that enter. As ions flow inward through opened channels, the excess positive charges on the cytosolic face and negative charges on the exoplasmic face diffuse a short distance away from the initial site of depolarization. This passive spread of positive charges on the cytosolic face and negative charges on the external face depolarizes adjacent segments of the plasma membrane, causing opening of additional voltage-gated channels in these segments and an increase in influx. As more ions enter the cell, the inside of the cell membrane becomes more depolarized, causing the opening of yet more voltage-gated channels and even more membrane depolarization, setting into motion an explosive entry of ions. For a fraction of a millisecond, the permeability of this small segment of the membrane to becomes vastly greater than that for , and the membrane potential approaches , the equilibrium potential for a membrane permeable only to ions. At this point, however, further net inward movement of ions ceases, since the concentration gradient of ions (greater outside than inside) is now offset by the insidepositive membrane potential. The action potential is, at its peak, close to the value of .
Figure 23-10 schematically depicts the critical structural features of voltage-gated channels and the conformational changes that cause their opening and closing. In the resting state, a segment of the protein on the cytosolic face — the gate — obstructs the central pore, preventing
passage of ions. The channel contains four positively charged voltagesensing α helices; in the resting state these helices are attracted to the inside-negative surface of the plasma membrane. A small depolarization of the membrane triggers movement of these voltage-sensing helices toward the negative charges that are building up on the exoplasmic surface, causing a conformational change in the gate that opens the channel and allows ion flow. After about 1 ms, further influx is prevented by movement of the cytosol-facing channel-inactivating segment into the open channel, blocking any further movement of ions. As long as the membrane remains depolarized, the channelinactivating segment remains in the channel opening; during this refractory period, the channel is inactivated and cannot be reopened. A few milliseconds after the inside-negative resting potential is reestablished, the channel-inactivating segment swings away from the pore and the voltage-sensing α helices return to their resting position near the cytosolic surface of the membrane. Thus the channel returns to the closed resting state, once again able to be opened by depolarization. Note the important distinction between “closed” channels and those that are “inactive” as depicted in Figure 23-10.
FIGURE 23-10 Operational model of the voltage-gated channel. As in the channel depicted in Figure 11-20, four transmembrane domains in the protein contribute to the central pore through which ions move. The critical components that control movement of ions are shown here in the cutaway views depicting three of the four transmembrane domains. In the closed, resting state, the voltage-sensing α helices, which have positively charged side chains every third residue, are attracted to the negative charges on the cytosolic side of the resting membrane. This keeps the gate segment near the cytosolic face in a “closed” position that blocks the channel, preventing entry of ions (step 1 ). In response to a small depolarization, the voltage-sensing helices move through the phospholipid bilayer toward the outer membrane surface, causing an immediate conformational change in the gate at the cytosolic face of the protein that opens the channel (step 2 ). Within a fraction of a millisecond the channel-inactivating segment moves into the open channel, preventing passage of further ions (step 3 ). Once the membrane is repolarized, the voltage-sensing helices return to the resting position, the channelinactivating segment is displaced from the channel opening, and the gate closes; the protein reverts to the closed, resting state and can be opened again by depolarization (step 4 ). See W. A. Catterall, 2001, Nature 409:988; and S. B. Long et al., 2007, Nature 450:376. Description At step 1, to the left of the illustration, is a gray cell membrane with positive charges on the exterior and negative charges on the cytosol side. A light green three-dimensional
semicircular figure is labeled closed Na plus channel. In the center of this figure is an ion-selective pore. The bottom of the ion-selective pore is closed and labeled gate. A yellow sphere attaching to the channel is labeled channel-inactivating segment. On the sides of the channel are two red cylinders labeled voltage-sensing alpha helix. A sideward arrow to the right is labeled Initial depolarization, movement of voltagesensing alpha-helices, opening of channel (less than 0.1 milliseconds). Step 2 shows the same figure, but now the gate is open, the alpha helices are high up on the channel, and Na plus moves from the exterior into the cytosol, the exterior is now negative, and the cytosol is positive. A sideward arrow to the right is labeled: movement of channelinactivating segment, inactivation of channel (0.5 - 1.0 milliseconds). At step 3, the yellow sphere from the first figure moves into the gate. An arrow moves from the top of this last figure back to the first figure and is labeled: repolarization of membrane, return of voltage-sensing alpha-helices to resting position, displacement of channelinactivating segment, and closure of age (slow, several milliseconds). Voltage-Gated Channels The repolarization of the membrane that occurs during the refractory period is due largely to opening of voltage-gated channels. The subsequent increased efflux of from the cytosol removes the excess positive charges from the cytosolic face of the plasma membrane, thereby restoring the inside-negative resting potential. For a brief instant, the membrane actually becomes hyperpolarized; at the peak of this hyperpolarization, the potential approaches , which is more negative than the resting potential (see Figure 23-2). Opening of the voltage-gated channels is induced by the large depolarization resulting from the action potential. Unlike voltage-gated channels, most types of voltage-gated channels remain open as
long as the membrane is depolarized and close only when the membrane potential has returned to an inside-negative value. Because the voltagegated channels open slightly after the initial depolarization, at the height of the action potential, they sometimes are called delayed rectifier channels. Eventually all the voltage-gated and channels return to their closed resting states. The only open channels in this baseline condition are the nongated or background channels, which lack voltage-sensitive transmembrane segments, and which contribute to the resting membrane potential of −60 to −70 mV (see Figure 23-9a). The patch-clamp tracings in Figure 23-11 reveal the essential properties of voltage-gated channels (see Figure 11-22 for a description of patch clamping). In this experiment, small segments of a neuronal plasma membrane were held (clamped) at different voltages and the flux of electric charges through the patch due to flow of ions through open channels was measured. At the modest depolarizing voltage of −10 mV, the channels in the membrane patch open infrequently and remain open for only a few milliseconds, as shown, respectively, by the number and width of the upward steps on the tracings. Further, the ion flux through them is rather small, as measured by the electric current passing through each open channel (the height of the steps). Depolarizing the membrane further to +20 mV causes these channels to open about twice as frequently; also, more ions move through each open channel (the height of the steps is greater) because the force driving cytosolic ions outward is greater at a membrane potential of +20 mV than at −10 mV. Depolarizing the membrane further to +50 mV, the value at the peak of an action potential, causes opening of more channels and also increases the flux of
ions through them. Thus by opening during the peak of the action potential, these channels permit the outward movement of ions and repolarization of the membrane potential while the voltage-gated channels are being closed and inactivated. EXPERIMENTAL FIGURE 23-11 Probability of channel opening and current flux through individual voltage-gated channels increases with the extent of membrane depolarization. These patch-clamp tracings were obtained from patches of neuronal plasma membrane clamped at three different potentials, +50, +20, and −10 mV. The upward deviations in the current indicate the opening of channels and movement of ions outward (cytosolic to exoplasmic face) across the membrane. Increasing the membrane depolarization (i.e., the clamping voltage) from −10 mV to +50 mV increases the probability a channel will open, the time it stays open, and the amount of electric current (numbers of ions) that passes through it. pA = picoamperes. [Data from B. S. Pallotta, K. L. Magleby, and J. N. Barrett, 1981, Nature 293:471; as modified by B. Hille, 1992, Ion Channels of Excitable Membranes, 2d ed., Sinauer, p. 122.] Description Three experimental traces are at three different potentials, minus 10, plus 20, and plus 50 millivolts. Each trace starts flat, corresponding to a polarized membrane with closed channels. On each graph, at first, depolarization occurs first followed by closed channels. At these points, the trace increases suddenly in the vertical direction as the channels open and ions pass through the membrane channels. Each trace remains in the
depolarized state for some time, afterward returning to the value of the original polarized state on repolarization. At minus 10 millivolts, the height change of each trace is slight, and there are few peaks. At plus 20 millivolts, the number of ions passing through the channels is greater, as indicated by the significant increase and frequency of the depolarization peaks. At plus 50 millivolts, depolarization is frequent and large numbers of ions pass through the channel. At some points, a double-height increase in the trace occurs, indicating that two channels are open simultaneously. More than 100 voltage-gated channel proteins have been identified in humans and other vertebrates. As we discuss later, all these channel proteins have a similar overall structure, but they exhibit different voltage dependencies, conductivities, channel kinetics, and other functional properties. Given the fundamental role that voltage-gated and channels play in determining action potential firing, it is not surprising that mutations in these channels have been identified in inherited, monogenic human epilepsies. Epilepsies are seizure disorders that affect about 1 percent of the population and that result from excessive synchronized neuronal activity in the brain. While epilepsy can arise from a variety of causes, including abnormal brain development, brain injury, and drug and alcohol abuse, some forms of epilepsy are caused by mutations in genes that encode ion channels. These diseases are called channelopathies. Human genetic studies have identified specific missense mutations in the Nav1.1 voltage-gated channel that cause generalized epilepsy with febrile seizures, while loss-of-function mutations in the same channel cause Dravet’s syndrome, also known as severe myoclonic epilepsy of
Action Potentials Are Propagated Unidirectionally Without Diminution
infancy. A variety of mutations in the Kv7.2 and Kv7.3 voltage-gated channels cause another form of epilepsy called benign familial neonatal convulsions. Mutations in other voltage-gated and channels have been identified in other forms of epilepsy and cause neuronal hyperexcitability in a variety of ways. For example, altering channel inactivation or blocking channel–dependent repolarization of neurons both prolong the duration of action potentials, whereas decreasing the ratio of inhibitory to excitatory inputs onto neurons can lower the threshold for triggering action potentials. Action Potentials Are Propagated Unidirectionally Without Diminution An action potential begins with changes that occur in a small patch of the axonal plasma membrane near the cell body. At the peak of the action potential, passive spread of the membrane depolarization is sufficient to depolarize a neighboring segment of membrane. This causes a few voltage-gated channels in this region to open, thereby increasing the extent of depolarization in the region and causing an explosive opening of more channels and generation of an action potential. This depolarization soon triggers opening of voltage-gated channels and restoration of the resting potential. The action potential thus spreads as a traveling wave away from its initial site without diminution. As noted earlier, during the refractory period voltage-gated channels are inactivated for several milliseconds. Such refractory channels cannot
conduct ion movements and cannot open during this period even if the membrane is depolarized owing to passive spread. As illustrated in Figure 23-12, the inability of channels to reopen during the refractory period ensures that action potentials are propagated only in one direction, from the initial axon segment where they originate to the axon termini. Because the channels upstream of the location of the action potential are still inactivated, they cannot be reopened by the small depolarization caused by passive spread. In contrast, the channels downstream of the action potential begin to open. The refractory period of the channels also limits the number of action potentials that a neuron can conduct per second. This is important, since it is the frequency of action potentials that carries the information.
FIGURE 23-12 Unidirectional conduction of an action potential is due to the transient inactivation of voltage-gated channels. At time 0, an action potential (pink line) is at the 2 mm position on the axon; the channels at this position are open (green shading), and ions are flowing inward. The excess ions diffuse in both directions along the inside of the membrane, passively spreading the depolarization in both directions (curved pink arrows). Because the channels at the 1 mm position are still inactivated (red shading), they cannot yet be reopened by the small depolarization caused by passive spread; the channels at the downstream 3 mm position, in contrast, begin to open. Each region of the membrane is refractory (inactive) for a few milliseconds after an action potential has passed. Thus the depolarization at the 2 mm site at time 0 triggers action potentials only downstream; at 1 ms an action potential is passing the 3 mm position, and at 2 ms an action potential is passing the 4 mm position. Description In the graph, the horizontal axis represents distance along the axon in millimeters ranging from 0 to 6 in increments of one millimeter. The vertical axis represents membrane potential in millivolts ranging from minus 100 to plus 50 millivolts in increments of 50 millivolts. A schematic immediately above the graph shows the state of the membrane channels in the axon, the potential across the membrane, and the diffusion of sodium ions as they enter the axon. Three graphs and illustrations show the movement of the action potential. In the first graph the channels move two millimeters along the axon are open, the membrane in this region is in a depolarized state, the membrane potential being plus 50 millivolts, and sodium ions flow into the cell and diffuse in both directions. The part of the axon immediately behind the action potential from 0 to 1 millimeter contains inactive channels in the refractory period. The membrane ahead of the depolarized portion is in the polarized state at a potential of minus 50 millivolts and the channels are closed. In the second graph, the action potential has moved one millimeter along the axon and the channels in this region are open, and sodium ions enter the axons. The 1.5-millimeter region immediately behind the open channel contains closed and inactivated channels. The membrane potential is this region is minus 100 millivolts, a hyperpolarized state. In the third graph, the action potential has moved a further millimeter along the axon. The 1.5-millimeter region behind the open region contains closed and inactive channels, and the membrane
All Voltage-Gated Ion Channels Have Similar Structures
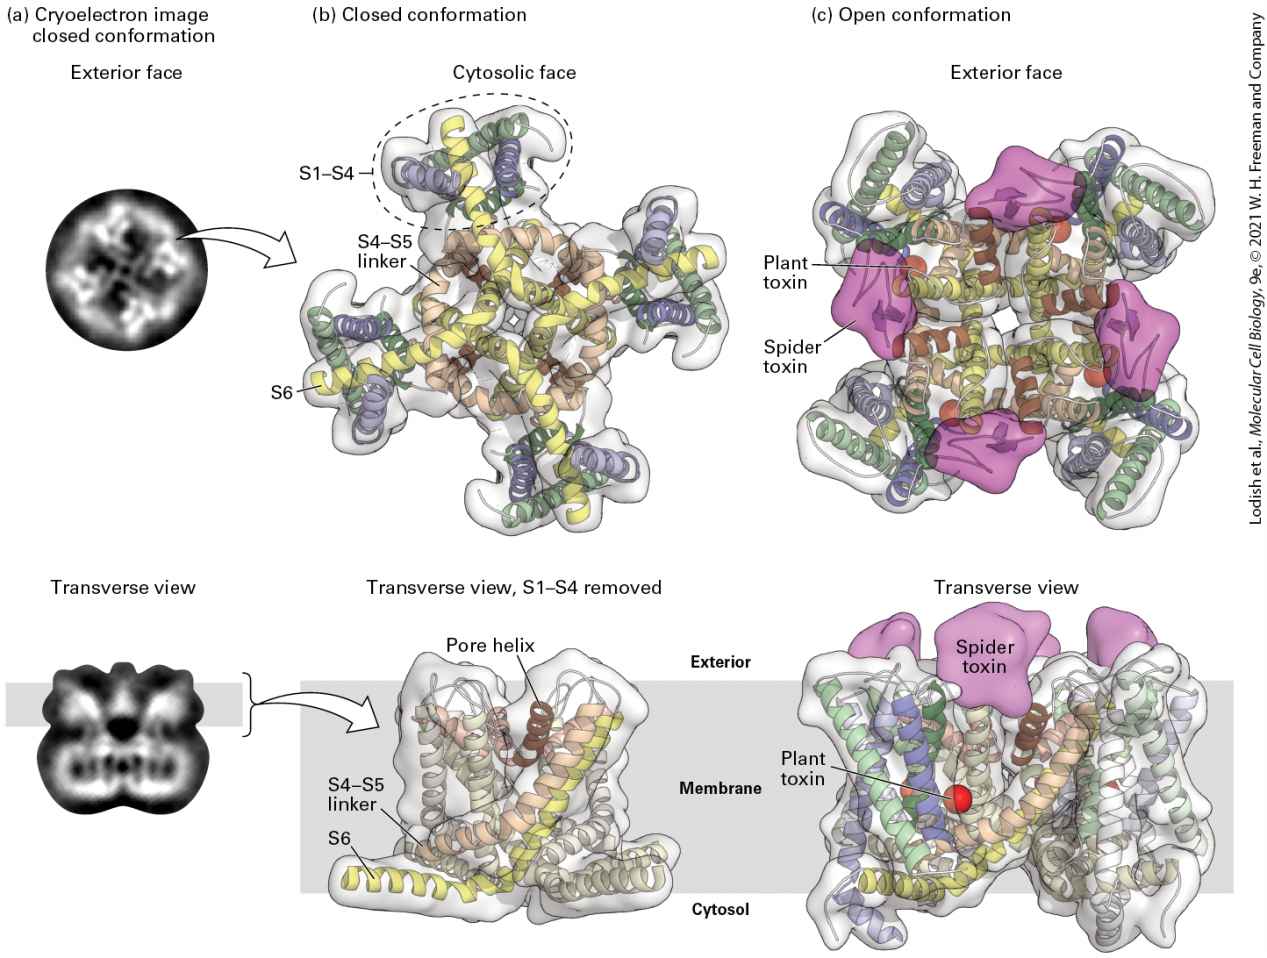
hyperpolarized. The axon in the first two millimeters has returned to the normal resting potential of just less than minus 50 millivolts, and the channels are closed. The depolarization of the membrane during an action potential results from movement of just a small number of ions into a neuron and does not significantly affect the intracellular concentration. While the flow of and ions alters membrane potential dramatically as it is depolarized, hyperpolarized, and repolarized during an action potential cycle, it is important to note that the exchange of these ions across the membrane is small compared to the overall numbers of and ions in the cytosol and extracellular space. All Voltage-Gated Ion Channels Have Similar Structures Having explained how the action potential is dependent on regulated opening and closing of voltage-gated channels, we turn to a molecular dissection of these remarkable proteins. After describing the basic structure of these channels, we will focus on three questions: How do these proteins sense changes in membrane potential? How is this change transduced into opening of the channel? What causes these channels to become inactivated shortly after opening? The initial breakthrough in understanding voltage-gated ion channels came from the analysis of fruit flies (Drosophila melanogaster) carrying the
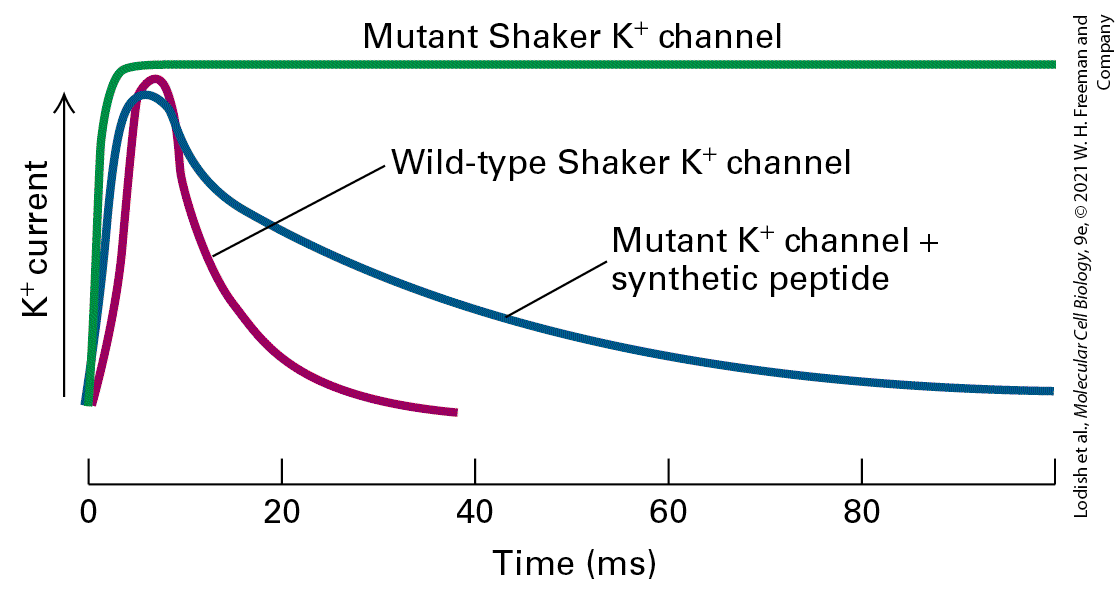
shaker mutation. These flies shake vigorously under ether anesthesia, reflecting a loss of motor control and a defect in certain motor neurons that have an abnormally prolonged action potential. Researchers suspected that the shaker mutation caused a defect in channel function. The cloning of the gene involved confirmed that the defective protein was a voltagegated channel. The shaker mutation prevents the mutant channel from opening normally immediately upon depolarization. To establish that the wild-type shaker gene encoded a channel, cloned wild-type shaker cDNA was used as a template to produce shaker mRNA in a cell-free system. Expression of this mRNA in frog oocytes and patch-clamp measurements on the newly synthesized channel protein showed that its functional properties were identical with those of the voltage-gated channel in the neuronal membrane, demonstrating conclusively that the shaker gene encodes this -channel protein. The Shaker channel and most other voltage-gated channels that have been identified are tetrameric proteins composed of four identical subunits arranged in the membrane around a central pore. Each subunit is constructed of six membrane-spanning α helices, designated S1−S6, and a P segment (Figure 23-13a). The S5 and S6 helices and the P segment are structurally and functionally homologous to those in the voltageindependent background channel discussed earlier (see Figure 11-20); the S5 and S6 helices form the lining of the selectivity filter through which the ion travels. The S1−S4 helices form a rigid complex that functions as a voltage sensor (with positively charged side chains in S4 acting as the primary sensor). The N-terminal ball extending into the cytosol from S1 is the channel-inactivating segment.
FIGURE 23-13 Schematic depictions of the secondary structures of voltage-gated and channels. (a) Voltage-gated channels are tetramers composed of four identical subunits, each containing 600−700 amino acids, and six membrane-spanning α helices, S1−S6. The N-terminus of each subunit, located in the cytosol and labeled N, forms a globular domain (orange ball) essential for inactivation of the open channel. The S5 and S6 helices (green) and the P segment (blue) are homologous to those in voltageindependent background channels, but each subunit contains four additional transmembrane α helices. One of these, S4 (red), is the primary voltage-sensing α helix and is assisted in this role by forming a stable complex with helices S1−S3. See C. Miller and H. Hughes, 1992, Curr. Biol. 2:573; and H. P. Larsson et al., 1996, Neuron 16:387. (b) Voltage-gated channels are monomers containing 1800−2000 amino acids organized into four transmembrane domains (I−IV) that are similar to the subunits in voltage-gated
channels. The single hydrophobic channel-inactivating segment (orange ball) is located in the cytosol between domains III and IV. Voltage-gated channels have a similar overall structure. Most voltage-gated ion channels also contain regulatory (β) subunits, which are not depicted here. See W. A. Catterall, 2001, Nature 409:988. Description The illustration labeled (a) shows four identical units with six alpha-helical regions embedded in the plasma membrane, threading back and forth through the membrane. Both the N and C-termini are present in the cytosol. The inactivation segment is present at the N-terminus, represented as an orange sphere with a tangle of black lines in it. The first three alpha-helices are colored gray and numbered one through three. Helix four is the voltage sensing helix, colored red in the diagram. Helices five and six are colored green, and a pore is present between these helices. The illustration labeled (b) shows four transmembrane domains, each comprising six transmembrane alpha-helices. The four transmembrane domains are joined as a single protein. The N and C-termini are both in the cytosol. Helices one through three are colored gray in the diagram, helix four is the voltage sensing helix and is colored red, and helices five and six are colored green. Each transmembrane domain is numbered one through four in Roman numerals. Domain two contains a pore, and the protein segment in the cytosol connecting domains three and four contains the hydrophobic inactivation segment. Voltage-gated channels are monomeric proteins organized into four homologous domains, I−IV (Figure 23-13b). Each of these domains is similar to a subunit of a voltage-gated channel. However, in contrast to voltage-gated channels, which have four channel-inactivating segments, the monomeric voltage-gated channels have a single channelinactivating segment. Except for this minor structural difference and their varying ion permeabilities, all voltage-gated ion channels are thought to function in a similar manner and to have evolved from a monomeric ancestral channel protein that contained six transmembrane α helices. In
Voltage-Sensing S4 α Helices Move in Response to Membrane Depolarization
the next section, we will focus on the structures of the voltage-gated channels and briefly discuss the more recently solved channel structure. Voltage-Sensing S4 α Helices Move in Response to Membrane Depolarization Over the past 20 years, determination of the crystal structures for bacterial and Shaker potassium channels and other channels has greatly advanced our understanding of channel-protein biochemistry and function. More recently, powerful developments in cryoelectron microscopy (see Chapter 11) have enabled the determination of the structures of many additional integral membrane proteins, including voltage-gated and channels, in their native lipid environment. The structures of the channels reveal remarkable arrangements of the voltage-sensing domains and suggest how parts of the protein move in order to open the channel. As already noted, the -channel tetramer, like the -channel monomer, has a pore whose walls are formed by helices S5 and S6 (Figure 23-14). Outside that core structure, four arms (or “paddles”), each containing helices S1−S4, protrude into the surrounding membrane and also interact with the outer sides of the S5 and S6 helices; these are the voltage sensors, and they are in minimal contact with the pore. Sensitive electrical measurements suggested that the opening of a voltage-gated or channel is accompanied by the movement of
positive charges from the cytosolic to the exoplasmic surface of the membrane. The moving parts of the protein are the rigid complexes composed of helices S1−S4; S4 accounts for much of the positive charge and is the primary voltage sensor, with a positively charged lysine or arginine every third or fourth residue (Figure 23-14d). Arginines in S4 have been measured moving as much as 1.5 nm as the channel opens, which can be compared with the ~5 nm thickness of the membrane or the 1.2 nm diameter of the α helix itself; these significant conformational changes underlie the opening of the channel pore.
FIGURE 23-14 Molecular structure of a voltage-sensitive channel. Models of the potassium channel single subunit (a) and tetramer (b) as viewed from the side, in open and closed states. The four green (S5) and four blue (S6) α helices span the membrane, with the interior of the cell at the bottom and exterior at the top. Note how the helices are tightly packed at the bottom in the closed conformation, so that the ion cannot pass through.
[Compare the distances between S5 helices as shown by the curly brackets below (a) and (b).] The S4−S5 linker (orange), located in the cytoplasm, connects the S4 helix (not shown) to the S5 helix. For clarity, helices S1 through S4 have been omitted from the model; they would normally be attached to the end of the S4−S5 linker and protrude from the molecule. (c) Ribbon diagrams of the open and closed states of the channel as viewed from the cytoplasmic face of the membrane. In the open state, but not in the closed, potassium ions (dark purple) can pass through the pore. (d) Three-dimensional structure of the voltagesensing “paddles” comprising helixes S1−S4, with the four voltage-sensing arginine (R) residues in S4. These paddles move from near the interior to the exterior of the membrane in response to depolarization. Since each one is attached to an S4−S5 linker, each linker and its attached S5 helix is moved, in turn moving S6 helices, which opens the pore. Note that as shown in (b), the linker between S4 and S5 is pointed upward toward the exoplasmic (exterior) surface in the open channel, pulled upward by the outward movement of the S1−S4 paddles; in contrast the S4−S5 linker is pointing downward in the closed channel when the S1−S4 paddles are nearer the cytosolic surface. [Data from X. Chen et al., 2010, Proc. Nat’l Acad. Sci. USA 107:11352, PDB ID 3lut; and Y. Zhou et al., 2001, Nature 414:43–48, PDB ID based on 1k4c.] Description The illustration shows several views of the tetrameric voltage-gated potassium channel. The illustration labeled (a) shows a single subunit, with different alpha-helices, the N and C-termini, and the selectivity filter, which is located close to the pore in the complete channel protein. The illustration labeled (b) shows the surface view of the fully assembled tetrameric protein in the open state. The transmembrane alpha-helices represented as ribbons are visible beneath the transparent surface, although some have been omitted for clarity. Potassium ions are visible in the channel pore. The S 6 helices, which are close to the cytosolic face, are loosely packed in the open state. Another channel protein is in the closed state and the S 6 helices are tightly packed. The illustration labeled (c) shows the top view of the channel protein viewed from the cytosolic face, demonstrates the four-fold symmetry of the tetrameric protein, and with a potassium ion in the channel. Another closed channel protein is viewed from the cytosolic face. This channel is smaller than the diameter of a potassium ion. The illustration labeled (d) shows an inset image of the voltage-sensing S 4 helix, which is attached to the S 5 helix whose movement opens or closes the channel pore, and the S
1 and S 2 helices embedded in the membrane on the outside of the channel protein. Several arginine residues (294, 297, 300, and 303) are labeled, and these residues are sensitive to the membrane voltage. In the resting state, the positive charges on the S1−S4 complexes (the paddles) are attracted to the negative charges on the cytosolic face of the membrane. In the depolarized membrane, these same positive charges become attracted to the negative charges on the exoplasmic (outer) surface of the membrane, causing the S1−S4 paddles to move partly across the membrane from the cytosolic to the exoplasmic surface. This movement is depicted schematically for the voltage-gated channel in Figure 23-10 and triggers a conformational change in the protein that opens the channel. The most unusual aspect of the voltage-sensitive channel structures is the presence of charged groups, such as arginines, in contact with lipid. The location of the voltage sensor helps to explain earlier experiments in which a non-voltage-sensitive channel was converted into a voltagesensing channel by adding voltage-sensing domains. Such a result would seem unlikely if the voltage sensors had to be deeply embedded in the core structure. Studies with mutant Shaker channels support the importance of the S4 helix in voltage sensing. When one or more arginine or lysine residues in the S4 helix of the Shaker channel were replaced with neutral or acidic residues, fewer positive charges than normal moved across the membrane in response to a membrane depolarization, indicating that arginine and lysine residues in the S4 helix do indeed move across the membrane and
are necessary for channel function. The structure of the open form of a mammalian voltage-gated channel has been contrasted with the closed structure of another channel family member. The results suggest a model for the opening and closing of the channel in response to movements of the voltage sensors across the membrane (see Figure 2314a, b). In the model, the voltage sensors, composed of helices S1−S4, move in response to voltage and exert a torque on a linker helix that connects S4 to S5: In the open-channel conformation, the position of the S4−S5 linker forces the S6 helix to form a kink near the cytosolic surface (blue in
Figure 23-14a), and the pore inside, near the cytosolic surface, is open. The pore’s 1.2 nm diameter is sufficient to accommodate hydrated ions (see Figure 23-14c). When the cell membrane is repolarized and the voltage sensor moves toward the cytosolic membrane surface, the S4−S5 linkers (orange in
Figure 23-14b) are twisted down, toward the inside of the cell. The S6 helices are consequently straightened, squeezing the bottom of the channel closed. Thus the gate is composed of the cytosol-facing ends of the S5 and S6 helices, where the pore is narrowest. Although voltage-gated and voltage-gated channels share similar voltage sensor and pore structures, the structure of their ion selectivity filters and the way that they conduct ions differ significantly (as also discussed in Chapter 11). The selectivity filter of the channel is much larger than that of the channel, even though the diameter of a ion (0.102 nm) is smaller than that of a ion (0.138 nm). The pore of channels contains conserved amino acids that form a lining of carbonyl
Movement of the Channel-Inactivating Segment into the Open Pore Blocks Ion Flow
oxygen atoms (see Figure 11-21). As ions enter the pore, these oxygen atoms replace its waters of hydration; the smaller ions would be too small to interact with the backbone carbonyls of the channel pore. In contrast, ions pass through the channel pore as water-hydrated ions. The pore of the channel is lined by conserved, negatively charged amino acids and is large enough to fit a single, water-hydrated ion, with the positively charged ion interacting with the negatively charged pore residues through its inner shell of bound water molecules. The hydrated ion is too large to fit through this pore. The topical anesthetic lidocaine, which is commonly used to reduce pain during dental procedures or during minor surgeries (e.g., to suture cuts), works by blocking the flow of ions through the voltage-gated channel. Lidocaine binds to amino acid residues that line the channel pore and prevents the influx of and thus the generation of an action potential. The binding sites for lidocaine are only available in the open state of the channel, and binding of lidocaine appears to lock the channel in the open but occluded state. Movement of the ChannelInactivating Segment into the Open Pore Blocks Ion Flow An important characteristic of most voltage-gated channels is inactivation; that is, soon after opening they close spontaneously, forming an inactive
channel that will not reopen until the membrane is repolarized. In the resting state, the globular balls at the N-termini of the four subunits in a voltage-gated channel are free in the cytosol (see Figure 23-13). Several milliseconds after the channel is opened by depolarization, one ball moves through an opening between two of the subunits and binds in a hydrophobic pocket in the pore’s central cavity, blocking the flow of ions (see Figure 23-10). After a few milliseconds, the ball is displaced from the pore, and the protein reverts to the closed, resting state. The balland-chain domains in channels are functionally equivalent to the channel-inactivating segment in channels. The experimental results shown in Figure 23-15 demonstrate that inactivation of channels depends on the ball domains, occurs after channel opening, and does not require the ball domains to be covalently linked to the channel protein. EXPERIMENTAL FIGURE 23-15 Experiments with a mutant channel lacking the N-terminal globular domains support the ball-and-chain inactivation model. The wildtype Shaker channel and a mutant form lacking the amino acids composing the N-
terminal ball were expressed in Xenopus oocytes. The activity of the channels was monitored by the patch-clamp technique. When patches were depolarized from 0 to +30 mV, the wild-type channel opened for ~5 ms and then closed (red curve). The mutant channel opened normally but could not close (green curve). When a chemically synthesized ball peptide was added to the cytosolic face of the patch, the mutant channel opened normally and then closed (blue curve). This demonstrated that the added peptide inactivated the channel after it opened and that the ball does not have to be tethered to the protein in order to function. [Data from W. N. Zagotta, T. Hoshi, and R. W. Aldrich, 1990, Science 250:568.] Description In the graph, the horizontal axis represents time in milliseconds ranging from zero to 100 in increments of 20 milliseconds. The vertical axis represents potassium current. Three curves represent mutant Shaker potassium channel, wild-type Shaker potassium channel, and mutant potassium channel with a synthetic peptide. A green curve shows the behaviors of the mutant Shaker potassium channel. The potassium current increases rapidly in a few milliseconds and then plateaus at this high current. A purple curve shows the behavior or the wild-type Shaker potassium channel. The potassium current increases almost as sharply as the mutant Shaker protein, but after about five milliseconds, the curve peaks and falls away sharply, decaying, after 40 milliseconds, to a value about one-fifth of the value of the potassium current of the mutant Shaker protein. A blue curve shows the behavior of the mutant potassium channel with a synthetic peptide. The potassium current increases almost as sharply as the mutant and wild-type Shaker proteins, but after about four milliseconds, the curve peaks and begins to fall away, slowly decaying to a non-zero value about one-quarter of the value of the potassium current of the mutant Shaker protein. The single channel-inactivating segment in voltage-gated channels contains a conserved hydrophobic motif composed of isoleucine, phenylalanine, methionine, and threonine (see Figure 23-13b). Like the longer ball-and-chain domain in channels, this segment folds into and blocks the -conducting pore until the membrane is repolarized.
Myelination Increases the Velocity of Impulse Conduction
Myelination Increases the Velocity of Impulse Conduction As we have seen, action potentials are triggered by the passage of ions through and channels in the axon membrane. Action potentials can move down an unmyelinated axon without diminution at speeds up to 1 meter per second. Even such fast speeds are insufficient to permit the complex movements typical of animals. In adult humans, for instance, the cell bodies of motor neurons innervating leg muscles are located in the spinal cord, and the axons are about a meter in length. The coordinated muscle contractions required for walking, running, and similar movements would be impossible if it took 1 second for an action potential to move from the spinal cord down the axon of a motor neuron to a leg muscle. The solution is to wrap cells in insulation that increases the rate of movement of an action potential. The insulation is called a myelin sheath (see Figure 23-1d). The presence of a myelin sheath around an axon increases the velocity of impulse conduction to 10−100 meters per second. As a result, in a typical human motor neuron, an action potential can travel the length of a 1-meter-long axon and stimulate a muscle to contract within 0.01 seconds. In nonmyelinated neurons, the conduction velocity of an action potential is roughly proportional to the diameter of the axon, because a thicker axon will have a greater number of ions that can diffuse. The human brain is packed with relatively small, myelinated neurons. If the neurons in the human brain were not myelinated, their axonal diameters would have to
increase about 10,000-fold to achieve the same conduction velocities as myelinated neurons. Thus vertebrate brains, with their densely packed neurons, never could have evolved without myelin. The vertebrate brain and spinal cord can be divided into gray and white matter (Figure 23-16), with the gray matter consisting of neuronal and glial cell bodies and unmyelinated processes, and the white matter consisting of myelin-ensheathed axon tracts, with the lipid-rich myelin imparting the white color. The difference in tissue density can also be detected using brain imaging techniques such as computerized tomography (CT) scanning and magnetic resonance imaging (MRI; Figure 23-16b). These methods can be used to differentiate disease processes that affect myelin from those that affect neurons.
FIGURE 23-16 Gray and white matter in the central nervous system. The vertebrate brain and spinal cord can be divided into “gray matter,” consisting of neuronal and glial cell
Action Potentials “Jump” from Node to Node in Myelinated Axons
bodies and unmyelinated processes, and “white matter” consisting of myelin-ensheathed axon tracts. The differences in density and lipid composition results in visible differences at the level of tissue histology, shown for the spinal cord and the cerebrum in (a). The differences in tissue density are also detected using imaging techniques such as magnetic resonance imaging (MRI) of the cerebrum (b). Description The illustration labeled (a) shows a sketch of the cerebrum, cerebellum, and spinal cord of a human. A gray plane, labeled frontal plane, cuts through the brain just behind the frontal lobe. A white arrow from this plane points to the close up of this slice. The spinal cord also has a plane through it horizontally and labeled transverse plane. A white arrow points to an enlargement of this plane. In both the brain slice and cord slice, a light pink area in the center is labeled white matter, and a darker area around the edges of the brain slice is labeled gray matter. The dark area in the spinal cord slice is on the inside with the light pink area around the outside. The micrograph labeled (b) shows the slice of the brain. The white lines around the outside are labeled skull. The darker gray area around the outside of the multilobed brain is labeled gray matter, the lighter portion in the middle labeled white matter. At the center are two triangular black areas labeled ventricle. Action Potentials “Jump” from Node to Node in Myelinated Axons The myelin sheath surrounding an axon is formed from many glial cells. Each region of myelin formed by an individual glial cell is separated from the next region by an unmyelinated area of axonal membrane about 1 μm in length called the node of Ranvier (or simply, “node”; see Figure 231d). The axonal membrane is in direct contact with the extracellular fluid only at the nodes, and the myelin covering prevents any ion movement
into or out of the axon except at the nodes. Moreover, voltage-gated and pumps, which maintain the ionic gradients in the axon, are present in high concentrations in the nodes, while channels are in high concentrations adjacent to the nodes. As a consequence of this localization, the inward movement of ions that generates the action potential can occur only at the myelin-free nodes (Figure 23-17). The excess cytosolic positive ions generated at a node during the membrane depolarization associated with movement into the cytosol as part of an action potential spread passively through the axonal cytosol to the next node with very little loss or attenuation, since they cannot cross the myelinated axonal membrane. In this way, a depolarization at one node spreads rapidly to the next node and induces an action potential there, effectively permitting the action potential to jump from node to node, in a kind of transmission called saltatory conduction. This mode of transmission allows for both faster signaling and narrower axons seen in vertebrate animals.
FIGURE 23-17 Conduction of action potentials in myelinated axons. Because the myelin layer renders the axon impermeable to ion movement across its membrane and because voltage-gated channels are found only on axonal membrane at the nodes of Ranvier, the influx of ions associated with an action potential can occur only at nodes. When an action potential is generated at one node (step 1 ), the excess positive ions in the cytosol, which cannot move outward across the sheath, diffuse rapidly down the axon, causing sufficient depolarization at the next node (step 2 ) to induce an action potential at that node (step 3 ). By this mechanism the action potential jumps from node to node along the axon. Description
Two Types of Glia Produce Myelin Sheaths
The illustration shows three stages of action potential conduction. Four bundles of myelin sheath cover the axons. The regions where these myelin bundles meet and the axon is not covered with myelin are labeled the nodes of Ranvier. Step 1. An action potential is generated at a node of Ranvier, sodium ions enter the axon, and the membrane is depolarized. Step 2. The excess positive charge moves along the axon, from left to right. Step 3. At the next node of Ranvier, the excess positive charge leads to an action potential and membrane depolarization. Two Types of Glia Produce Myelin Sheaths Myelin sheaths are produced by two types of glial cells present in the nervous system: oligodendrocytes make sheaths for the central nervous system (CNS), and Schwann cells make them for the peripheral nervous system (PNS) (Figure 23-18). For reasons that are not understood, not all axons are myelinated.
FIGURE 23-18 Two types of glial cells make myelin sheaths. (a) A single oligodendrocyte in the central nervous system can myelinate segments of multiple axons. (b) Each Schwann cell insulates a section of a single peripheral nervous system axon. See B. Stevens, 2003, Curr. Biol. 13:R469, and D. L. Sherman and P. J. Brophy, 2005, Nat. Rev. Neurosci. 6:683−690. Description The illustration labeled (a) shows two nerve cells with dendrites at the top. Down toward the bottom, a green cell has two structures wrapped around the left nerve cell and two structures wrapped around the right nerve cell. This is labeled oligodendrocyte. Inside the end of the axon of each neuron are labeled R N A and ribosome around the edge. The illustration labeled (b) shows one neuron with dendrites at the top. Its axon has four blue coils wrapped along with it toward the bottom. The axon is labeled in the middle. Each blue wrap has a nucleus labeled, and between each bundle is a section of the axon labeled node of Ranvier. These blue cells are labeled as Schwann cells. To the right of the diagrams are two micrographs. The top is labeled Schwann cell and shows greenish cells with long axons moving horizontally across the image. The bottom micrograph is labeled oligodendrocyte and shows one cell with a central nucleus area and a web of dendrites around it.
Oligodendrocytes Oligodendrocytes form the spiral myelin sheath around axons of the central nervous system (Figure 23-18a). Each oligodendrocyte provides myelin sheaths to segments of multiple neurons. The major protein constituents are myelin basic protein (MBP) and proteolipid protein (PLP). MBP, a peripheral membrane protein found in both the central and peripheral nervous systems, has seven RNA-splicing variants that encode different forms of the protein. It is synthesized by ribosomes located in the growing myelin sheath, an example of specific transport of mRNAs to a distal cell region (Chapter 10). MBP mRNA undergoes microtubuledependent transport to distal oligodendrocyte processes, where its local translation contributes to the formation of the myelin sheath. Damage to proteins produced by oligodendrocytes underlies a prevalent human neurological disease, multiple sclerosis (MS). MS is usually characterized by spasms and weakness in one or more limbs, bladder dysfunction, local sensory losses, and visual disturbances. This disorder, the prototype demyelinating disease, is caused by patchy loss of myelin in areas of the brain and spinal cord. In MS patients, conduction of action potentials by the demyelinated neurons is slowed, and the channels spread outward from the nodes, lowering their nodal concentration. The cause of the disease is not known but is believed to involve the body’s production of auto-antibodies (antibodies that bind to normal body proteins) that react with and attack myelin. A mouse mutant, shiverer, has a deletion of much of the MBP gene, leading to tremors,
convulsions, and early death. Similarly, a human mutation (Pelizaeus−Merzbacher disease) and a mouse mutation (jimpy) in the gene coding for the other major protein of CNS myelin, PLP, cause loss of oligodendrocytes and inadequate myelination. A number of new drugs to treat MS, many targeting the immune system, have recently been approved by the FDA, and many more MS drugs are currently in clinical trials. Schwann Cells Schwann cells form myelin sheaths around the axons of neurons in the PNS. A Schwann cell myelin sheath is a remarkable spiral wrap (Figure 23-18b). A long axon can have as many as several hundred Schwann cells along its length, each contributing myelin insulation to an internode stretch of about 1–1.5 μm of axon. Mutations in mice that eliminate Schwann cells cause the death of most neurons. In contrast to oligodendrocytes, each Schwann cell myelinates only one axon. The sheaths are composed of about 70 percent lipid (rich in cholesterol) and 30 percent protein. In the PNS, the principal protein constituent (~80 percent) of myelin is called protein 0 , an integral membrane protein that has immunoglobulin (Ig) domains. MBP is also an abundant component. The extracellular Ig domains of bind together the surfaces of sequential wraps around the axon to compact the spiral of myelin sheath (Figure 23-19). Other proteins play this kind of role in the CNS.
FIGURE 23-19 Formation and structure of a myelin sheath in the peripheral nervous system (PNS). (a) At high magnification the specialized spiral myelin membrane appears as a series of layers, or lamellae, of phospholipid bilayers wrapped around the axon. (b) Closeup cartoon of three layers of the myelin membrane spiral. The two most abundant integral myelin membrane proteins, and PMP22, are produced only by Schwann cells. The exoplasmic domains of proteins, on opposite membrane surfaces associate with one another, thereby zipping together the exoplasmic membrane surfaces in close apposition. Close apposition of the cytosolic faces of the membrane may result from binding of the cytosolic tail of each protein to phospholipids in the opposite membrane. PMP22 may also contribute to membrane compaction. Myelin basic protein (MBP), a cytosolic protein, remains between the closely apposed membranes as the cytosol is squeezed out. See L. Shapiro et al., 1996, Neuron 17:435; and E. J. Arroyo and S. S. Scherer, 2000, Histochem. Cell Biol. 113:1. Description The micrograph labeled (a) shows an axon, which looks like a whitish oval in the center. Surrounding this is a layer labeled myelin, about as thick as the axon is wide, and colored green. A white arrow starts at the outside edge of the green myelin and points to the illustration labeled (b) which shows three layers of the myelin sheath. Each layer consists of two plasma membranes containing cytosol. A cytosolic protein, M B P, acts as a spacer protein between the two plasma membranes. A transmembrane protein, P M P 22, is embedded in the membrane. The P 0 protein complex is embedded in the cytosol via its cytosolic domain and connects to an exoplasmic domain via a transmembrane domain. The P 0 exoplasmic domains are associated with
exoplasmic domains from neighboring plasma membranes, anchoring the layers together. In humans, peripheral myelin, like CNS myelin, is a target of autoimmune disease, mainly involving the formation of antibodies against . The Guillain-Barre syndrome (GBS), also known as acute inflammatory demyelinating polyneuropathy, is one such disease. GBS is the most common cause of rapid-onset paralysis, occurring at a frequency of one person out of 100,000. The cause is unknown, although it usually follows an acute infectious illness and is thought to involve an immune attack on the PNS. The common inherited neurological disorder called Charcot-Marie-Tooth disease type 1A, which damages peripheral motor and sensory nerve function, is due to overexpression of the gene that encodes PMP22 protein, another constituent of peripheral nerve myelin. Interactions between glia and neurons control the placement and spacing of myelin sheaths and the assembly of nerve-transmission machinery at the nodes of Ranvier. For example, a high concentration of voltage-gated channels and pumps, which is critical to the rise in membrane voltage during action potential generation, congregates at the nodes of Ranvier through interactions with cytoskeletal proteins. The activity of these cytoskeletal proteins is modulated by interactions between cell-adhesion molecules on glia and neurons. The regions adjacent to the myelin-free nodes are called paranodes and consist of specialized junctions between the myelin and the axonal membrane formed by interactions between cell-adhesion molecules described in the
Light-Activated Ion Channels and Optogenetics
next paragraph. These junctions serve to restrict the movement of ion channels within the axonal membrane; they separate the nodes from a region called the juxtaparanode, which is enriched in voltage-gated channels. These channels mediate the return of the membrane voltage to baseline after an action potential, and the physical separation of the and channels contributes to the efficient propagation of action potentials. Light-Activated Ion Channels and Optogenetics Unicellular flagellates such as Chlamydomonas (Figure 1-23b) respond rapidly to light through phototaxis, which guides them toward the light, or photophobia, which prevents them from moving toward the light. These rapid photomotility responses are mediated by light-activated cation channels that reside in a specialized photoreceptive organelle called the eyespot. The first light-activated channel to be cloned was from the green algae Chlamydomonas reinhardtii. This channel, called channelrhodopsin, consists of a seven-transmembrane protein covalently linked to a photoisomerizable chromophore, all-trans-retinal (Figure 23-20a, b). This is the same chromophore that is used to detect photons in the eye, as discussed in Chapter 15 (see Figure 15-34). When all-trans-retinal absorbs a photon, it converts to 13-cis-retinal, which induces a conformational change in the channel protein, leading to the opening of a pore with a diameter of approximately 0.6 nm and the rapid influx of cations. Channelrhodopsins are nonselective cation channels that conduct , and ions.
Many other light-activated cation channels have now been identified, and genetic engineering approaches have generated a series of designer channelrhodopsins that are activated or inactivated by specific wavelengths and intensities of light and selective for distinct cations. These advances have given rise to the exciting new field of optogenetics, in which channelrhodopsins are expressed in electrically excitable cells, permitting the use of light to rapidly and selectively manipulate the membrane potential of the cell (Figure 23-20c).
FIGURE 23-20 Channelrhodopsins and optogenetics: activating neurons with light. (a) Light-activated ion channels. Channelrhodopsins are light-activated cation channels. The channel has seven transmembrane domains and is covalently linked to the photoisomerizable chromophore all-trans-retinal. (b) All-trans-retinal absorbs blue light (~470 nm) and changes to the 13-cis-retinal conformation. This leads to a conformational change in the channel, opening a pore through which cations can flow. Opening of channelrhodopsin, shown in (a), leads to influx of from the extracellular solution into the cell, resulting in rapid depolarization of excitable cells. When the light is removed, retinal returns to the all-trans conformation and the channel closes. This is shown in (c) where illumination of a neuron expressing channelrhodopsin with blue light triggers action
potentials as long as the light is on. See J. Wong, O. J. Abilez, and E. Kuhl, 2012, J. Mech. Phys. Solids 60:1158−1178. Description The illustration labeled (a) shows the plasma membrane with exterior and cytosol labeled, above and below respectively. The channelrhodopsin structure is a two-part structure with an opening between them. Red dots labeled Na plus enters the opening, and the exterior shows a higher concentration of these dots. A section of black lines bisects the channel and this is labeled All-trans-retinal. The illustration labeled (b) shows the chemical diagram of the same schematic. Blue light shines onto the chemical structure labeled all-trans-retinal and an arrow to the right shows the changed chemical structure labeled 13-Cis-retinal. An arrow below the other one moves in the opposite direction labeled darkness. The graph labeled (c) shows three sections, from left to right, labeled: light off, blue light on, light off. During the two light off areas, the graph shows very little movement from the lower area of the graph (axes are unlabeled), and when the blue light is one, there are 13 tall spikes in action potentials. Optogenetic approaches have revolutionized the study of neuronal circuits in the brain because they allow neuroscientists to directly test the effect of neural circuit activity on behavior, rather than to simply record neural activity and correlate it with behavior. A common experimental approach is to make transgenic mice in which channelrhodopsin is expressed under the control of a cell-type-specific promoter (described in Chapter 6) so that only a subset of neurons in the brain express the protein. A window is then made in the skull, and lasers are used to illuminate channelrhodopsinexpressing cells near the surface of the brain, or alternatively a fiber-optic cable is used to deliver light to channelrhodopsin-expressing cells in deeper brain regions. The light triggers action potentials in the neurons,
activating their circuits. By examining the behavior of the mouse, one can link the circuit with a specific behavior. As one example of this type of experiment, the identity of the neurons in the brain that mediate thirst was discovered using optogenetics. To do this, channelrhodopsin was expressed in a region of the hypothalamus called the subfornical organ (SFO) in mice (Figure 23-21). In one mouse line, channelrhodopsin was expressed exclusively in excitatory neurons, and in the other mouse line, it was expressed in inhibitory neurons. Light was delivered to the SFO using a fiber-optic cable; when the excitatory neurons were depolarized with light, the mice exhibited thirst (seeking water and drinking intensely), but when the inhibitory neurons were activated, thirst was suppressed. Together, these experiments demonstrate that neurons in the SFO of the hypothalamus regulate thirst, with activation of excitatory neurons promoting thirst and activation of inhibitory neurons repressing thirst. Similar approaches have been used to uncover circuits underlying many other behaviors, including locomotion, feeding and overeating, anxiety, aggression, and other social behaviors. In addition, optogenetic approaches can be used with other methods, such as calcium imaging (see Chapter 4 and Section 23.3) to map out the anatomy of specific circuits in the brain. This is done by activating a specific neuron with light and then using imaging approaches to visualize activity (e.g., by monitoring calcium dynamics) in downstream neurons.
FIGURE 23-21 Using optogenetics to dissect neural circuits mediating thirst. (a) Channelrhodopsin tagged with a fluorescent protein (YFP) was expressed in excitatory neurons in the subfornical organ (SFO) of the hypothalamus using an excitatory neuron– specific promoter. Neurons expressing channelrhodopsin-YFP were confirmed to be excitable by illumination with blue light in acute hypothalamic slices. (b) When excitatory neurons in the SFO of living mice are activated by blue light, the mice seek water and drink large volumes even if they are well hydrated. [Data from Y. Oka, M. Ye, and C. S. Zuker, 2015, Nature 520:349–352.]
Description The illustration labeled (a) begins with a sketch of a mouse brain slice in pink. Blue laser light is being applied from the left side. A sensor is attached to the slice where the light is shining. This is labeled patch-clamp electrode. At the right of this set-up is a graph that shows a laser pulse at the top with several on and off areas moving from left to right. The graph shows the lines moving from the bottom up to the top of the space allowed every time along the blue area. The illustration labeled (b) shows a sketch of a mouse in gray. The blue laser light shines into the mouse's eye area. A graph next to this sketch is labeled drinking response in percentage on the vertical axis. The horizontal axis has two labels: Expressing C R-Y F P mice, and Wild-type mice. For the expressing mice, there is a bar labeled no light, which is very close to zero, and a bar labeled blue light, which ends at almost 100 percent. On the wild type mice, the nolight bar is similar to the expressing mice side, but the blue light bar is only about 5 percent in height. KEY CONCEPTS OF SECTION 23.2 Voltage-Gated Ion Channels and the Propagation of Action Potentials Action potentials are sudden membrane depolarizations followed by rapid repolarization. An action potential results from the sequential and rapid opening and closing of voltage-gated and channels (see Figure 23-9) in the plasma membrane of neurons and muscle cells. The excess cytosolic cations associated with an action potential generated at one point on an axon spread passively to the adjacent segment, triggering opening of voltagegated channels in the vicinity and thus propagation of the action potential along the axon. As the action potential reaches its peak, opening of voltage-gated channels permits efflux of ions, which repolarizes and then hyperpolarizes the membrane. As these channels close, the membrane returns to its resting potential, followed by a refractory period of several milliseconds (see Figures 23-2, 23-9, and 23-10). The action potential is propagated in only one direction, toward the axon termini, because of the absolute refractory period of the voltage-gated channels and the brief hyperpolarization resulting from efflux (see Figure 23-12).
Voltage-gated channels are monomeric proteins containing four domains that are structurally and functionally similar to each of the subunits in the tetrameric voltage-gated channels. Each domain or subunit in voltage-gated cation channels contains six transmembrane α helices and a nonhelical P segment that forms the ionselectivity pore (see Figure 23-13). Opening of voltage-gated channels results from movement of the positively charged S1−S4 paddles toward the extracellular side of the membrane in response to a depolarization of sufficient magnitude (see Figure 23-14). Closing and inactivation of voltage-gated cation channels result from movement of a cytosolic ball segment into the open pore (see Figure 23-10). While the voltage sensor and inactivation gate of voltage-gated channels and voltage-gated channels are similar, the structure of the selectivity filter is different and provides specificity for the type of ion that is conducted through the channel. Myelination increases the rate of impulse conduction up to a hundredfold and permits the close packing of neurons characteristic of vertebrate brains. The central nervous system (CNS) can be divided into gray matter, composed of neuronal and glial cell bodies, and white matter, enriched in myelin-ensheathed axons (see Figure 23-16). In myelinated neurons, voltage-gated channels are concentrated at the nodes of Ranvier. Depolarization at one node spreads rapidly with little attenuation to the next node, so that the action potential jumps from node to node (see Figure 23-17). Myelin sheaths are produced by glial cells that wrap themselves in spirals around neurons. Oligodendrocytes produce myelin for the CNS; Schwann cells, for the peripheral nervous system (PNS; see Figure 23-18). The field of optogenetics is revolutionizing the study of neural circuits. It involves the genetic expression of light-activated cation channels, called channelrhodopsins, in neurons and the use of light to specifically activate or inhibit that population of neurons (see Figure 23-20). In this way, neuroscientists can directly link specific neural circuits with specific behaviors.
23.3 Communication at Synapses
23.3 Communication at Synapses As we have discussed, electrical pulses transmit signals along neurons, but signals are transmitted between neurons and other excitable cells mainly by chemical signals. Synapses are the junctions where presynaptic neurons release these chemical signals, or neurotransmitters, which then act on postsynaptic target cells (see Figure 23-3). A target cell may be another neuron, a muscle, or a gland cell. Communication at chemical synapses usually goes in only one direction: pre- to postsynaptic cell. Arrival of an action potential at an axon terminus in a presynaptic cell leads to opening of voltage-sensitive plasma-membrane channels and an influx of , causing a localized rise in the cytosolic concentration in the axon terminus. In turn, the rise in triggers fusion of small (40−50 nm) neurotransmitter-containing synaptic vesicles with the plasma membrane, releasing neurotransmitters into the synaptic cleft, the narrow space separating the presynaptic from the postsynaptic cell. The membrane of the postsynaptic cell is located within approximately 20 nm of the presynaptic membrane, reducing the distance the neurotransmitter must diffuse. Neurotransmitters, small, water-soluble molecules such as glutamate (excitatory) or gamma-amino butyric acid (GABA, inhibitory), bind to receptors on the postsynaptic neuron that, in turn, induce localized changes in the potential across its plasma membrane. If the membrane
potential becomes less negative (i.e., becomes depolarized) an action potential will tend to be induced in the postsynaptic cell. Such synapses are called excitatory synapses, and in general involve the opening of channels in the postsynaptic plasma membrane. In contrast, at an inhibitory synapse, binding of the neurotransmitter to a receptor on the postsynaptic cell causes hyperpolarization of the plasma membrane, that is, generation of a more inside-negative potential. Typically, hyperpolarization is the result of opening of or channels in the postsynaptic plasma membrane, which tends to hinder generation of an action potential. Neurotransmitter receptors fall into two broad classes: ligand-gated ion channels, also known as ionotropic receptors, which open immediately upon neurotransmitter binding, and metabotropic G protein–coupled receptors (GPCRs). Neurotransmitter binding to a GPCR induces the opening or closing of a separate ion-channel protein over a period of seconds to minutes. These so-called slow neurotransmitter receptors were discussed in Chapter 15 along with GPCRs that bind different types of ligands and modulate the activity of cytosolic proteins other than ion channels. In the central nervous system, glutamate and GABA bind primarily to ionotropic receptors to mediate excitation and inhibition, respectively, while neuromodulators like serotonin and dopamine usually bind to metabotropic receptors. In the peripheral nervous system, the main neurotransmitters are acetylcholine and norepinephrine (also called noradrenaline), both of which are also expressed in the central nervous system.
Formation of Synapses Requires Assembly of Presynaptic and Postsynaptic Structures
The duration of the neurotransmitter signal depends on the amount of transmitter released by the presynaptic cell, which in turn depends on the amount of transmitter that had been stored as well as the frequency of action potentials arriving at the synapse. The duration of the signal also depends on how rapidly any unbound neurotransmitter is degraded in the synaptic cleft or transported back into the presynaptic cell. Presynaptic cell plasma membranes, as well as glia, contain transporter proteins that pump neurotransmitters across the plasma membrane back into the cell, thus keeping the extracellular concentrations of transmitter low. In this section, we focus first on how synapses form and how they control the regulated secretion of neurotransmitters in the context of the basic principles of vesicular trafficking outlined in Chapter 14. Next we look at the mechanisms that limit the duration of the synaptic signal, and how neurotransmitter signaling is received and interpreted by the postsynaptic cell. Formation of Synapses Requires Assembly of Presynaptic and Postsynaptic Structures Axons extend from the cell body during development, guided by signals from other cells along the way, so that the axon termini will reach the correct location (see Section 18.8). As axons grow, they come into contact with their potential target cells, such as dendrites of other neurons, where synapses then form. In the CNS, presynaptic release sites occur frequently
all along an axon and are called en passant (“in passing”) synapses; in contrast, motor neurons form synapses with muscle cells only at the axon termini. Glial cells play an essential role in synapse formation. Neurons cultured in isolation will not form synapses very efficiently, but when glia are added, the rate of synapse formation increases substantially. Astrocytes and Schwann cells send protein signals to neurons to stimulate the formation of synapses and then help to preserve them. One such signal is thrombospondin (TSP), a component of the extracellular matrix; mice lacking two thrombospondin genes have only 70 percent of the normal number of synapses in their brains. Mutual communication between neurons and the glia that surround them is frequent and complex, making the signals and information they carry an area of active research. New imaging approaches have revealed that astrocytes form a multitude of small branches that intercalate with neurons and ensheath synapses (see
Figure 23-6a). Due to the function of astrocytes in providing glial-derived factors to promote synapse formation, many neuroscientists now propose that the synapse should be considered a tripartite structure, composed not only of presynaptic and postsynaptic partners but also of astrocytes (see
FIGURE 23-22 Astrocytes and the tripartite synapse. (a) Many synapses are ensheathed by astroglial processes, as shown in this electron micrograph of a synapse in the rodent hippocampus. The postsynaptic compartment (dendrite and dendritic spine) is highlighted in green, the presynaptic terminal in orange, and astroglial process in blue. (b) Astrocytes not only ensheath the synapse but also secrete a number of factors that promote correct synapse formation. These include thrombospondin, hevin, glypicans, and cholesterol. Indicative of the importance of astrocytes in neuronal synapse formation, when neurons are grown in cell culture, they require astrocytes for proper synapse formation and development. [Part (a) republished with permission from Elsevier, from J. Bourne and K. M. Harris, 2007, “Do Thin Spines Learn to Be Mushroom Spines That Remember?” Curr. Opin. Neurobiol. 17(3):381–386; permission conveyed through Copyright Clearance Center, Inc.] Description In the micrograph labeled (a), a light green area represents the nerve terminal coming up from the bottom of the image. At the top of this is a light brown highlighted area that is connecting to the green area. To the left of these, an area is highlighted in blue. In the illustration labeled (b), at the top, is a foot shaped structure labeled presynaptic nerve terminal, and has a downward arrow inside, leading to the foot and having the label action potential. On the foot area are several white circles with red dots inside them. Three of these white circles are open into space below. Another foot shaped structure, labeled postsynaptic nerve terminal, faces the top foot structure and has Y shaped receptors on it. Some of the red dots are move into the receptors. Around the lower foot shape is a U shaped figure labeled astrocyte. The astrocyte surrounds the space area on both sides. An arrow pointing to 5 multicolored dots at the right of the space has a label that reads, glial-derived synaptogenic signals: thrombospondin, hevin, glypicans, cholesterol. At the site of a synapse, the presynaptic neuron has hundreds to thousands of synaptic vesicles, some docked at the membrane and others waiting in reserve. The release of neurotransmitter into the synaptic cleft occurs in
the active zone, a specialized region of the plasma membrane containing a remarkable assemblage of proteins whose functions include modifying the properties of the synaptic vesicles and bringing them into position for docking and fusing with the plasma membrane. Viewed by electron microscopy, the active zone has electron-dense material and fine cytoskeletal filaments (Figure 23-23). A similarly dense region of specialized structures is seen across the synapse in the postsynaptic cell, the postsynaptic density (PSD). Cell-adhesion molecules that connect preand postsynaptic cells keep the active zone and PSD aligned. After release of synaptic vesicles in response to an action potential, the presynaptic neuron retrieves synaptic vesicle membrane proteins by endocytosis both within and outside the active zone.
FIGURE 23-23 Synaptic vesicles are localized in the axon terminus near the region where neurotransmitter is released. In this longitudinal section through a neuromuscular junction, the basal lamina lies in the synaptic cleft separating the neuron from the muscle membrane, which is extensively folded. Acetylcholine receptors are concentrated in the postsynaptic muscle membrane at the top and partway down the sides of the folds in the membrane. Description In the micrograph, the membrane of the axon terminals and the muscle plasma membrane is visible. In between these, the gap is labeled synaptic cleft, and the basal lamina is visible between the axon plasma membrane and the muscle plasma membrane. Many synaptic vesicles are visible in the axon, visible as dark circles
clustering near the plasma membrane. Muscle contractile proteins are also visible as fibrous strands. A C H receptors are in between the membrane of the axon terminals and the muscle plasma membrane. Synapse assembly has been extensively studied at the neuromuscular junction (NMJ) (Figure 23-23); we will use this example in the discussion below. At NMJ synapses, acetylcholine is the neurotransmitter produced by motor neurons, and the acetylcholine receptor, AChR, is produced by the postsynaptic muscle cell. Muscle cell precursors, myoblasts, when put into culture, will spontaneously fuse into multinucleate myotubes that look similar to normal muscle cells. As myotubes form, AChR is produced near the center of the cell and inserted into the myotube plasma membrane, forming diffuse membrane patches (Figure 23-24a).
FIGURE 23-24 Formation of the neuromuscular junction. (a) Motor neuron-myotube interactions initiate formation of neuromuscular junctions (NMJs). Following fusion of myoblasts to form multinucleate myotubes, the nuclei synthesize acetylcholine receptor (AChR) mRNA. The nuclei near the center of each muscle fiber synthesize significantly more AChR mRNA than other nuclei. AChRs together with MuSK receptor kinases accumulate in membrane patches near the center of the cell, the prospective synaptic region of the muscle, prior to and independent of innervation; the cell is said to be “prepatterned.” The motor neuron axon termini grow toward these AChR clusters and secrete the glycoprotein Agrin. Agrin, in turn, induces clustering of the AChRs (dark red) and MuSKs around the axon termini (green), forming the NMJ. (b and c) Signaling downstream of Agrin receptors is mediated by seven proteins: Agrin, LRP4, MuSK, Dok-7, Crk, rapsyn, and acetylcholine (ACh) receptors. (b) In the absence of motor neuron innervation, LRP4, MuSK, and ACh receptors diffuse within the plasma membrane and Dok-7, Crk, and rapsyn diffuse within the cytosol of the muscle cells. (c) Upon motor neuron innervation, motor axons secrete Agrin, which stabilizes postsynaptic differentiation by binding LRP4 and activating MuSK kinase activity. Phosphorylation of tyrosines in the MuSK juxtamembrane region stimulates recruitment and tyrosine phosphorylation of Dok-7, an adapter protein that is expressed selectively in muscle, which forms a dimer, stimulates MuSK kinase activity, and recruits the adapter protein Crk. Crk is essential to activate a rapsyn-dependent pathway for clustering AChRs opposite the presynaptic axon termini. Recent work has shown that rapsyn is an E3 ligase (see Figure 3-32) that adds a ubiquitin-like modification to the ACh receptors, which is necessary for receptor clustering. The pathway for synapsespecific transcription is less well understood but likely involves kinase-dependent activation of transcription factors that stimulate expression of multiple genes encoding proteins required for the formation of cholinergic NMJ synapses. Description The illustration labeled (a) shows two rows of cylinders parallel to each other. Along the top of the left side cylinder, is a green line starting at the top and labeled motor neuron axons. Red circles along the top of the cylinders are labeled A C h R patches in myotube membranes. On the front of the last cylinder are blue ovals labeled A C h R transcriptions in myotube nuclei. On the row of cylinders to the right, the green axon line has extended to connect with all the red circles along the top and near the nuclei at the front of the row. The illustration labeled (b) shows a close-up view of the action in
illustration (a). The plasma membrane is with skeletal muscle labeled above it and cytosol below. A green and orange protein structure is at the left labeled L r p 4, and goes through the membrane. Next to this is a purple structure labeled M u S K. To the right is the first of three redpointed oval shapes labeled A C h R. The pattern continues with a purple protein, then the green and orange one and two more A C h R. Below these is a pipe-shaped structure labeled D o k-7, and a blue and orange horizontal diagram labeled C r k. The nucleus is located at the bottom left with a helix of D N A inside. The illustration labeled (c) shows a foot-shaped structure labeled motor neuron axon terminus. Near the bottom of this foot shape are several white circles, each with two light blue ovals inside. Three of these circles opens at the bottom of the foot shape and the ovals come out. The agrin attaches to the orange part of the L r p 4 attached to the plasma membrane. The A C h receptors are now lined up together to the right in the membrane and red ovals labeled Rapsyn are attached at the cytosol side of these. The two purple M u S K proteins now have phosphorus yellow circles attached to the D o k7 between them in the cytosol. Two downward arrows come from the D o k-7, one arrow moves to the nucleus, and the other moves to the red ovals on the right. Inside the nucleus, the D N A helix has an arrow labeled gene transcription. The formation of the neuromuscular synapse is a multistep process requiring signaling interactions between motor neurons and muscle fibers. A key player is MuSK, a receptor tyrosine kinase that is localized in the diffuse AChR-rich patches of the myotube plasma membrane. In ways that are not known, MuSK both induces clustering of AChRs and serves to attract the termini of growing motor neuron axons. For example, knockdown of MuSK inhibits both processes, while overexpression of MuSK in cultured muscle cells induces motor neuron growth throughout the muscle and formation of excess synapses. Another key player is Agrin, a glycoprotein synthesized by developing motor neurons, transported in vesicles along axon microtubules, and
secreted near the developing myotubes. Agrin binds to LRP4, a single-pass membrane-spanning protein; this stimulates an association between LRP4 and MuSK and increases MuSK kinase activity (Figure 23-24b). This leads to activation of several downstream signal transduction pathways, one of which leads to the formation of clusters of AChRs with the cytoskeletal protein rapsyn; this interaction, together with binding of other cytoskeletal proteins including actin, leads to localization of AChRs opposite the nerve termini at the neuromuscular junction. The density of acetylcholine receptors in a mature synapse reaches is 1000-fold greater than in the plasma membrane. While the molecular mechanisms underlying the formation of synapses in the central nervous system are less well understood, the process appears to follow a similar logic as that at NMJs, in which interactions between the pre- and postsynaptic compartments trigger a reorganization of already synthesized synaptic components. Analogous to the function of rapsyn in clustering AChRs at the neuromuscular synapse, distinct scaffolding proteins cluster neurotransmitter receptors at excitatory and inhibitory synapses in the central nervous system. A large PDZ-containing protein (see Chapter 20 for definition of PDZ domains) called PSD95 clusters glutamate receptors at excitatory synapses, while another scaffolding protein called gephryin clusters GABA and glycine receptors at inhibitory synapses (Figure 23-25).
FIGURE 23-25 PSD95 and gephyrin are scaffolding proteins for excitatory and inhibitory postsynaptic compartments, respectively. (a) The PDZ-containing protein PSD95 is part of the postsynaptic density at excitatory synapses and serves as a scaffolding protein to cluster glutamate receptors at the postsynaptic membrane. The scaffolding protein gephyrin plays an analogous role at inhibitory synapses, where it clusters GABA receptors at the postsynaptic membrane. (b) PSD95 and gephyrin can be used to mark excitatory and inhibitory synapses, respectively. Shown in green are the PSD95-containing excitatory synapses and, in red, the gephyrin-containing inhibitory synapses that form on a single mouse cortical neuron in culture. [Part (b) republished with permission from Elsevier, from G. G. Gross et al., 2013, “Recombinant Probes for Visualizing Endogenous Synaptic Proteins in Living Neurons,” Neuron 78(6):971–985; permission conveyed through Copyright Clearance Center, Inc.] Description The illustration labeled (a) shows an excitatory synapse, looking like a foot like structure, releasing glutamate into the synaptic cleft. Glutamate receptors on the surface of the postsynaptic cell, another foot shaped structure, are coupled with the cytosolic protein P S D 95, which is associated with F-actin. In an inhibitory synapse, G A B A is released from the presynaptic cell and binds to G A B A receptors in the postsynaptic cell. The GABA receptors are associated with a cytosolic protein, gephyrin, which itself is associated with F-actin and microtubules. The micrograph labeled (b) shows multiple axons spreading out from the cell body, and these are dotted with green and red fluorescent spots, indicating the presence of P S D 95 in excitatory synapses and gephyrin in inhibitory synapses, respectively. Pre- and postsynaptic compartments are linked by a network of transsynaptic cell-adhesion molecules, whose adhesive interactions are so strong that it is not possible to biochemically separate the presynaptic compartment from the postsynaptic compartment. Synaptic adhesion molecules bind scaffolding proteins and cytoskeletal elements through their intracellular domains, promoting organization of protein complexes
in both presynaptic and postsynaptic compartments. These adhesion molecules include cadherins, immunoglobulin-containing cell-adhesion molecules (described in Chapter 20), neurexins and neuroligins, ephrins, and Eph receptors. Precise wiring in the nervous system involves not only synapse formation but also synapse elimination. At birth, most animals are born with an excess number of synapses, and neural circuit maturation involves a critical process of synaptic pruning that eliminates a large number of synapses. Synaptic pruning is dependent on neural activity, and studies indicate that the weaker synapses are eliminated while the stronger synapses are maintained. For example, at birth, each muscle cell is innervated by multiple motor neurons, but over time many of the motor neuron contacts are eliminated so that eventually each muscle cell is innervated by a single motor neuron. This process of synapse elimination is dependent on activity in the muscle cell: if the muscle cell is pharmacologically silenced, it never loses its polyneuronal innervation. The cell biological mechanisms underlying synapse elimination, including the mechanisms that specify which synapses should be eliminated and the process of elimination itself, are areas of active research. Many recent studies have uncovered roles for astrocytes and microglia in the phagocytosis of eliminated synapses during synaptic pruning. In addition, human genetic studies have identified specific alleles in immune genes expressed by microglia, including in components of the complement system (see Chapter 24), as major risk alleles for schizophrenia, consistent
Neurotransmitters Are Transported into Synaptic Vesicles by H+-Linked Antiport Proteins
with the hypothesis that aberrant synapse elimination contributes to this psychiatric disease. Neurotransmitters Are Transported into Synaptic Vesicles by -Linked Antiport Proteins Numerous small molecules function as neurotransmitters at various synapses. With the exception of acetylcholine, the most common neurotransmitters, as shown in Figure 23-26, are amino acids or derivatives of amino acids. Nucleotides such as ATP and the corresponding nucleosides, which lack phosphate groups, also function as neurotransmitters. While neurons were previously thought to make only one type of neurotransmitter, more recent studies indicate that some neurons can produce and release two or more. While the types of neurotransmitters are varied and while they operate in different parts of the nervous system, their release results in one of two outcomes: either the induction of an electrical signal or its inhibition.
FIGURE 23-26 Structures of several small molecules that function as neurotransmitters. Except for acetylcholine, all of these molecules are amino acids (glycine and glutamate) or derived from the indicated amino acids. The three transmitters synthesized from tyrosine, which contain the catechol moiety (blue highlight), are referred to as catecholamines. Description The illustration shows the chemical structures of several small molecules. From top to bottom, they are acetylcholine, glycine, glutamate, dopamine, norepinephrine, epinephrine, serotonin (or 5-hydroxytryptamine, histamine, gamma-aminobutyric acid (or G A B A). All of these neurotransmitters are synthesized in the cytosol and imported into membrane-bound synaptic vesicles within axon termini, where they are stored. These vesicles are 40−50 nm in diameter, and their lumen has a low pH, generated by operation of a V-class proton pump in the vesicle membrane. Similar to the accumulation of metabolites in plant vacuoles (see Figure 11-29), this proton concentration gradient (greater in vesicle lumen than in cytosol) drives neurotransmitter import by ligand-specific -linked neurotransmitter antiporters in the vesicle membrane (see
Figure 23-26). For example, acetylcholine is synthesized in the cytosol from a precursor molecule, acetyl coenzyme A (acetyl CoA), and choline in a reaction catalyzed by choline acetyltransferase:
Description The illustration shows acetyl Co A plus choline, catalyzed by choline acetyltransferase and produces acetylcholine. Synaptic vesicles take up and concentrate acetylcholine from the cytosol against a steep concentration gradient, using an antiporter in the vesicle membrane. As with other antiporters, the export of protons from the forming vesicle down its electrochemical gradient powers the uptake of the neurotransmitter. As an example of an evolutionary mechanism to ensure coordinate expression of these two proteins, the gene encoding this antiporter is contained entirely within the first intron of the gene encoding choline acetyltransferase. Different antiport proteins are used for import of other neurotransmitters into synaptic vesicles. For example, glutamate is imported into synaptic vesicles by a family of proteins called vesicular glutamate transporters (VGLUTs). VGLUTs are highly specific for glutamate but have rather low substrate affinity. Another family of
Three Pools of Synaptic Vesicles Loaded with Neurotransmitter Are Present in the Presynaptic Terminal
transporters, the vesicular GABA transporters (VGATs) transport GABA and glycine into synaptic vesicles. Like the acetylcholine transporter, VGLUTs and VGATs are antiporters, moving glutamate and GABA or glycine into synaptic vesicles while protons move in the other direction. VGLUT and VGAT serve as useful markers for excitatory and inhibitory synaptic terminals, respectively. Three Pools of Synaptic Vesicles Loaded with Neurotransmitter Are Present in the Presynaptic Terminal A highly organized arrangement of cytoskeletal fibers in the axon terminus helps localize synaptic vesicles within the presynaptic terminal. The population of synaptic vesicles has been proposed to exist in three states: a small readily releasable pool, which is docked at the active zone near the plasma membrane; a larger recycling pool, which is proximal but not docked at the plasma membrane and is released with moderate stimulation; and a reserve pool, which includes the majority of synaptic vesicles in the terminal. The reserve pool is the most distal from the active zone and is released only in response to particularly strong stimuli. A family of phosphoproteins called synapsins tether synaptic vesicles to the actin cytoskeleton and to one another. Neuronal stimulation activates kinases that phosphorylate synapsins to modulate synaptic vesicle tethering and thereby alter the number of synaptic vesicles available for release. Indeed, synapsin knockout mice, although viable, are prone to seizures; during repetitive stimulation of many neurons in such mice, the
Influx of Ca2+ Triggers Release of Neurotransmitters
number of synaptic vesicles that fuse with the plasma membrane is greatly reduced. Influx of Triggers Release of Neurotransmitters The exocytosis of neurotransmitters from synaptic vesicles involves vesicle-targeting and fusion events similar to those that occur during the intracellular transport of secreted and plasma-membrane proteins (see
Chapter 14). However, two unique features critical to synapse function differ from secretory pathways in non-neuronal cells: (1) secretion is tightly coupled to arrival of an action potential at the axon terminus, and (2) synaptic vesicles are recycled locally within the axon terminus after fusion with the plasma membrane. Figure 23-27 shows the entire cycle whereby synaptic vesicles are filled with neurotransmitter, release their contents, and are recycled.
FIGURE 23-27 Cycling of neurotransmitters and of synaptic vesicles in axon termini. Most synaptic vesicles are formed by endocytic recycling as depicted here (although note that some synaptic vesicles are transported from the cell body by axonal transport along microtubules). The entire cycle typically takes about 60 seconds. Step 1 : The uncoated vesicles express a V-type proton pump (orange) and a single type of -neurotransmitter antiporter (blue) specific for the particular neurotransmitter, to import neurotransmitters (red dots) from the cytosol. Step 2 : Synaptic vesicles loaded with neurotransmitter move to the active zone. Step 3 : Vesicles dock at defined sites on the plasma membrane of the presynaptic cell, and the vesicle v-SNAREs called VAMP bind to the plasma membrane tSNAREs, forming a SNARE complex. Synaptotagmin prevents membrane fusion and release of neurotransmitter. Botulinum toxin prevents exocytosis by proteolytically cleaving VAMP, the v-SNARE on vesicles. Step 4 : In response to a nerve impulse (action potential), voltage-gated channels in the plasma membrane open, allowing an influx of from the extracellular medium. The elevation in cytosolic leads to fusion of docked vesicles with the plasma membrane and release of neurotransmitters into the synaptic cleft (via mechanisms highlighted in Figure 23-29). Step 5 : symporter proteins take up neurotransmitter from the synaptic cleft into the cytosol, which limits the duration of the action potential and partially recharges the cell with transmitter. Step 6 :
Vesicles are recovered by endocytosis, creating uncoated vesicles, ready to be refilled and begin the cycle anew. After clathrin/AP vesicles containing neurotransmitter transporter proteins bud inward and are pinched off in a dynamin-mediated process, they lose their coat proteins. Dynamin mutations such as shibire in Drosophila block the re-formation of synaptic vesicles, leading to paralysis. Unlike most neurotransmitters, acetylcholine is not recycled. See K. Takei et al., 1996, J. Cell Biol. 133:1237; V. N. Murthy and C. F. Stevens, 1998, Nature 392:497; and R. Jahn, T. Lang, and T. C. Südhof, 2003, Cell 112:519. Description Step 1. Vesicles contain vesicle-associated membrane protein (known as V A M P's), proton pump, and antiporters. Protons are pumped into the vesicle by a V-class proton pump, and the transport of the neurotransmitter into the vesicles is powered by a proton-linked antiporter. Step 2. The vesicles containing neurotransmitters move to the active zone. Synaptotagmin is embedded in the vesicle membrane. Step 3. Vesicle docking at the plasma membrane occurs via SNARE complexes. Sodiumneurotransmitter symporter proteins and voltage-gated calcium channels are embedded in the plasma membrane of the synapse. Step 4. On entry of calcium via the voltagegated calcium channels, exocytosis of the neurotransmitter occurs. Synaptotagmin is lost from the vesicle membrane. Step 5. The empty vesicle is coated with clathrin, and the vesicle neck is held with dynamic. Reuptake of neurotransmitter into the presynaptic cell occurs via the sodium-neurotransmitter symport proteins in the plasma membrane. Step 6. The empty vesicles are recovered by endocytosis, resulting in the release of uncoated vesicles into the cell, and the cycle can begin again at step 1. Two labels show that botulinum toxin inhibits the SNARE complex, blocking neurotransmitter release, and Shibire mutations, a dynamin mutation, block vesicle endocytosis. Depolarization of the plasma membrane cannot, by itself, cause synaptic vesicles to fuse with the plasma membrane. In order to trigger vesicle fusion, an action potential must be converted into a chemical signal — namely, a localized rise in the cytosolic concentration. The transducers of the electrical signals are voltage-gated channels
localized to the region of the plasma membrane adjacent to the synaptic vesicles. The membrane depolarization due to the arrival of an action potential opens these channels, permitting an influx of ions from the extracellular medium into the region of the axon terminus near the docked synaptic vesicles. Importantly, the rise in cytosolic is localized; it is also transient, as the excess is rapidly pumped out of the cell by plasma membrane pumps. A single action potential leads to exocytosis of about 10 percent of synaptic vesicles in a presynaptic terminal. Membrane proteins unique to synaptic vesicles then are specifically internalized by endocytosis, usually via the same types of clathrin-coated vesicles used to recover other plasma membrane proteins by other types of cells. After the endocytosed vesicles lose their clathrin coat, they are rapidly refilled with neurotransmitter. The ability of many neurons to fire 50 times a second is clear evidence that the recycling of vesicle membrane proteins occurs quite rapidly (see Figure 23-27). The machinery of endocytosis and exocytosis is highly conserved; it is described in more detail in Chapter 14. The development of fluorescent indicators has provided a powerful means of visualizing synaptic activity in neurons in culture and in intact neural circuits. As discussed in Chapter 4, these indicators are fluorescent molecules that change their fluorescence emission upon binding and include both chemical indicators and genetically encoded indicators. Delivery or expression of indicators to neurons in a circuit allows experimenters to use time-lapse microscopy to monitor transients in hundreds of neurons and glia in real time. For example, expression of the
genetically encoded indicator GCaMP6 in the visual cortex of mice, combined with presentation of visual stimuli and in vivo two-photon microscopy, has been used to identify the population of neurons that respond to specific orientations of visual information (Figure 23-28).
FIGURE 23-28 Calcium indicators allow visualization of activity in neural circuits. A genetically encoded calcium indicator was expressed in neurons in the mouse visual cortex. (a) A window was made in the skull of the mouse, and a microscope (indicated by the
A Calcium-Binding Protein Regulates Fusion of Synaptic Vesicles with the Plasma Membrane
objective lens) was used to visualize calcium transients in populations of neurons in the visual cortex while the mouse was looking at gratings that moved in different directions. Individual neurons within the visual cortex respond to specific orientations of the gratings, as detected by elevations in calcium that are visualized as increases in the fluorescence of the calcium indicator. (b) Neurons were color coded according to the orientation that elicited increases in calcium (as shown below the photo). The neurons shown in yellow respond to horizontally moving gratings, and the neurons shown in cyan respond to vertically moving gratings, while the neurons shown in green and red respond to diagonally oriented gratings. This type of experiment reveals that individual neurons are tuned to specific orientations of visual stimuli. [Part (b) republished with permission from Nature, from T.-W. Chen et al., 2013, “Ultrasensitive Fluorescent Proteins for Imaging Neuronal Activity,” Nature 499(7458):295–300; permission conveyed through Copyright Clearance Center, Inc.] Description The illustration labeled (a) shows an experimental setup where a mouse is immobilized in a tube and the objective lens of a microscope is placed above its head. The mouse is allowed to look at four striped diagrams: a yellow and white vertical stripe, a red and white diagonal stripe moving from bottom left to top right, a green and white diagonal stripe moving from bottom right to top left, and a blue and white horizontal stripe. The micrograph labeled (b) shows the neurons in the brain of the mouse and color-coded to match the colors on the stripe cards. Red is mostly low on the image, blue concentrates in the center areas, a few yellow areas are mostly toward the top and green is also mostly at the top. A Calcium-Binding Protein Regulates Fusion of Synaptic Vesicles with the Plasma Membrane
Fusion of synaptic vesicles with the plasma membrane of axon termini depends on SNAREs, the same types of proteins that mediate membrane fusion of other regulated secretory vesicles, and SM proteins (for Sec1/Munc18-like proteins). The principal v-SNARE in synaptic vesicles (VAMP) tightly binds syntaxin and SNAP-25, the principal t-SNAREs in the plasma membrane of axon termini, to form four-helix SNARE complexes. The assembly of the SNARE complex brings the synaptic vesicle membrane into close proximity to the presynaptic plasma membrane, but the formation of a fusion pore requires an additional step, association of an SM protein with syntaxin. After fusion, proteins within the axon terminus promote disassociation of VAMP from t-SNAREs, as in the fusion of secretory vesicles depicted in Figure 14-11. Strong evidence for the role of VAMP in neurotransmitter exocytosis is provided by the mechanism of action of botulinum toxin, a bacterial protein that can cause the paralysis and death characteristic of botulism, a type of food poisoning. The toxin is composed of two polypeptides, one of which binds to motor neurons that release acetylcholine at synapses with muscle cells, facilitating entry of the other polypeptide, a protease, into the cytosol of the axon terminus. The only protein this protease cleaves is VAMP (see Figure 23-27, step 3 ). After the botulinum protease enters an axon terminus, synaptic vesicles that are not already docked rapidly lose their ability to fuse with the plasma membrane because cleavage of VAMP prevents assembly of SNARE complexes. The resulting block in acetylcholine release at neuromuscular synapses causes paralysis. However, vesicles that are already docked
exhibit remarkable resistance to the toxin, indicating that SNARE complexes may already be in a partially assembled, protease-resistant state when vesicles are docked on the presynaptic membrane. The signal that triggers exocytosis of docked synaptic vesicles is a very localized rise in the concentration in the cytosol near vesicles from 0.1 μM, characteristic of resting cells, to 1–100 μM following arrival of an action potential in stimulated cells. The speed with which synaptic vesicles fuse with the presynaptic membrane after a rise in cytosolic (less than 1 ms) indicates that the fusion machinery is entirely assembled in the resting state and can rapidly undergo a conformational change leading to exocytosis of neurotransmitter (Figure 23-29). A -binding protein called synaptotagmin, located in the membrane of synaptic vesicles, is a key component of the vesicle-fusion machinery that triggers exocytosis in response to . A protein called complexin is thought to bind to the α-helical bundle of an assembled v-SNARE/t-SNARE complex that bridges the synaptic vesicle and plasma membranes, preventing the final fusion step. Binding of to synaptotagmin relieves this inhibition, releasing complexin and allowing the fusion event to occur very rapidly. Mammals express multiple different synaptotagmin isoforms, each of which has a different binding affinity for , and as a result the kinetics of exocytosis depend on the particular synaptotagmin isoform expressed in the neuron.
FIGURE 23-29 Synaptotagmin- and SNARE-mediated fusion of synaptic vesicles with the plasma membrane. Only a few synaptic vesicles are docked at the presynaptic plasma membrane; these are primed for fusion with the plasma membrane. (a) The tight interconnections between the synaptic vesicle and plasma membrane are mediated in part by bundles of four α helices derived from complexes of vesicle v-SNARE (e.g., VAMP) and plasma membrane t-SNARE proteins (e.g., SNAP-25 and syntaxin; see Figure 14-11). The fusion of the two membranes is prevented by binding of complexin protein to the vSNARE/t-SNARE complex. Synaptotagmin is composed of a short intraluminal sequence, a single transmembrane α helix that anchors it in the synaptic vesicle membrane, a linker, and two -binding domains termed C2A and C2B. Synaptotagmin without bound may also bind to the v-SNARE/t-SNARE complex and prevent membrane fusion. (b) A localized rise in allows ions to bind to synaptotagmin, altering its three-
dimensional conformation. This triggers release of the complexin fusion inhibitor, binding (or altered binding) of synaptotagmin to the v-SNARE/t-SNARE complex, instantaneous membrane fusion, and release of neurotransmitters into the extracellular space. The SM protein Munc18, which binds to syntaxin, is required for SNARE-mediated fusion, although its precise mechanisms of action are not known. See T. C. Südhof and J. E. Rothman, 2009, Science 323:474; and T. C. Südhof, 2013, Neuron 80:675–690. Description The illustration labeled (a) shows a vesicle containing neurotransmitters in the plasma membrane. The vesicle is attached to the membrane by v-SNARE and t-SNARE complexes, which contain M u n c 18 and complexin. Synaptotagmin is embedded in the plasma membrane of the vesicle, with two domains, C 2 A and C 2 B, projecting outward from the vesicle surface. The C 2 A and C 2 B complexes have unoccupied calcium ion binding sites. A downward arrow is labeled, rise in Ca 2 plus and binding of Ca 2 plus to synaptotagmin causes release of complexin and membrane fusion. In the illustration labeled (b), on rising calcium ion concentration in the axon terminal, the calcium ions bind the C 2 A and C 2 B sites on synaptotagmin, induces the release of complexin and m u n c 18 and membrane fusion. The separate circle of the vesicle becomes a part of the membrane. Several lines of evidence support a role for synaptotagmin as the sensor for exocytosis of neurotransmitters. Mutant embryos of Drosophila and Caenorhabditis elegans that completely lack synaptotagmin fail to hatch and exhibit very reduced, uncoordinated muscle contractions. Larvae with partial loss-of-function mutations of synaptotagmin survive, but their neurons are defective in -stimulated vesicle exocytosis. Moreover, in mice, mutations in synaptotagmin that decrease its affinity for cause a corresponding increase in the amount of cytosolic needed to trigger rapid exocytosis.
Fly Mutants Lacking Dynamin Cannot Recycle Synaptic Vesicles
An important characteristic of synaptic vesicle exocytosis is its speed. Synaptic vesicle fusion occurs within a few hundred microseconds after the arrival of an action potential, which is not very different from the timescale of influx through the voltage-gated channel. What makes this speed possible is the proximity of the release machinery to the voltage-gated channels. This proximity is mediated by two scaffolding proteins called RIM (for Rab3-interacting molecule protein) and RIM-BP (for RIM binding protein), which form a complex between Rab3-containing synaptic vesicles and voltage-gated channels. In mice lacking RIM, and flies lacking RIM-BP, active zones lack voltagegated channels, which leads to a dramatic decrease and desynchronization of neurotransmitter release. Fly Mutants Lacking Dynamin Cannot Recycle Synaptic Vesicles Synaptic vesicles are formed primarily by endocytic budding from the plasma membrane of axon termini (see Figure 23-27). Endocytosis usually involves clathrin-coated pits and is quite specific, in that several membrane proteins unique to the synaptic vesicles (e.g., neurotransmitter transporters) are specifically incorporated into the endocytosed vesicles and resident plasma membrane proteins (e.g., the voltage-sensitive channel) remain. In this way, synaptic-vesicle membrane proteins can be reused and the recycled vesicles refilled with neurotransmitter (see Figure 23-27, step 6 ).
Signaling at Synapses Is Terminated by Degradation or Reuptake of Neurotransmitters
As in the formation of other clathrin/AP-coated vesicles, pinching off of endocytosed synaptic vesicles requires the GTP-binding protein dynamin (see Figure 14-20). Indeed, analysis of a temperature-sensitive Drosophila mutant called shibire , which encodes the fly dynamin protein, provided early evidence for the role of dynamin in endocytosis. At the permissive temperature of 20 °C, the mutant flies are normal, but at the nonpermissive temperature of 30 °C, they are paralyzed (shibire means “paralyzed” in Japanese) because pinching off of clathrin-coated pits in neurons and other cells is blocked. When viewed in the electron microscope, the neurons at 30 °C show abundant clathrin-coated pits with long necks but few clathrin-coated vesicles. Because of their inability to pinch off new synaptic vesicles, the neurons in mutants eventually become depleted of synaptic vesicles when flies are shifted to the nonpermissive temperature, leading to a cessation of synaptic signaling and to paralysis. Signaling at Synapses Is Terminated by Degradation or Reuptake of Neurotransmitters Following neurotransmitter release from a presynaptic cell, signaling can be terminated by diffusion of a transmitter away from the synaptic cleft, but this is a slow process. Instead, one of two more rapid mechanisms terminates the action of neurotransmitters at most synapses: neurotransmitters are actively removed from the synapse by
neurotransmitter transporters or destroyed by enzymes present in the synaptic cleft to prevent continued stimulation of the postsynaptic cell. Signaling by acetylcholine is terminated when it is hydrolyzed to acetate and choline by acetylcholinesterase, an enzyme localized to the synaptic cleft. Choline released in this reaction is transported back into the presynaptic axon terminus by a symporter and used in synthesis of more acetylcholine. The operation of this transporter is similar to that of the -linked symporters used to transport glucose into cells against a concentration gradient (see Figure 11-26). With the exception of acetylcholine, all the neurotransmitters shown in
Figure 23-26 are removed from the synaptic cleft by transport back into the axon termini that released them. These transmitters are recycled intact, as depicted in Figure 23-27 (step 5 ). Transporters for GABA, norepinephrine, dopamine, and serotonin were the first to be cloned and studied. These four transport proteins are all -linked symporters. They are 60−70 percent identical in their amino acid sequences, and each is thought to contain 12 transmembrane α helices. As with other symporters, the movement of into the cell down its electrochemical gradient provides the energy for uptake of the neurotransmitter. To maintain electroneutrality, often is transported via an ion channel along with the and neurotransmitter. Neurotransmitter transporters are targets of a variety of drugs of abuse as well as many therapeutic drugs commonly used in psychiatry.
Cocaine binds to and inhibits the transporters for norepinephrine, serotonin, and dopamine. In particular, binding of cocaine to the dopamine transporter inhibits reuptake of dopamine, causing a higher than normal concentration of dopamine to remain in the synaptic cleft and prolonging the stimulation of postsynaptic neurons. Long-lasting exposure to cocaine, as occurs with habitual use, leads to down-regulation of dopamine receptors and thus altered regulation of dopaminergic signaling. It is thought that decreased dopaminergic signaling after chronic cocaine use may contribute to depressive mood disorders and sensitize important brain reward circuits to the reinforcing effects of cocaine, leading to addiction. Similarly, therapeutic agents such as the antidepressant drugs fluoxetine (Prozac) and imipramine block serotonin reuptake, and the tricyclic antidepressant desipramine blocks norepinephrine reuptake. [Fluoxetine and similarly acting drugs such as paroxetine (Paxil) and sertraline (Zoloft) are often referred to collectively as selective serotonin reuptake inhibitors (SSRIs).] These drugs also cause a higher than normal concentration of neurotransmitter to remain in the synaptic cleft and prolong the stimulation of postsynaptic neurons. Exciting recent single-molecule cryoelectron microscopy studies have solved the structure of several neurotransmitter transporters, including the dopamine transporter and the serotonin transporter, in the presence and absence of drugs such as the hallucinogen ibogaine. These studies have confirmed the hypothesis that neurotransmitter transporters share structural and functional features with the bacterial symporter (see Figures 11-25 and 11-26). This is important because past research on drugs that target neurotransmitter transporters, including
Opening of Acetylcholine-Gated Cation Channels Leads to Muscle Contraction
antidepressants, were based on the structure of the bacterial symporter. Determination of the ultrastructure of the neurotransmitter transporters themselves not only validates these models but also provides a powerful means of developing more refined and targeted therapeutic drugs. Opening of Acetylcholine-Gated Cation Channels Leads to Muscle Contraction Now we look at how binding of neurotransmitters by receptors on postsynaptic cells leads to changes in the cells’ membrane potential, using the communication between motor neurons and muscles as an example. At neuromuscular junctions, acetylcholine is the neurotransmitter. A single axon terminus of a frog motor neuron may contain a million or more synaptic vesicles, each containing 1000−10,000 molecules of acetylcholine; these vesicles often accumulate in rows in the active zone (see Figures 23-23 and 23-24). Such a neuron can form synapses with a single skeletal muscle cell at several hundred points. The nicotinic acetylcholine receptor, which is expressed in muscle cells, is a ligand-gated channel that admits both and . These receptors are also produced in brain neurons and are important in learning and memory; loss of these receptors is observed in schizophrenia, epilepsy, drug addiction, and Alzheimer’s disease. Antibodies against
acetylcholine receptors constitute a major part of the autoimmune reactivity in the disease myasthenia gravis. The receptor is so named because it is bound by nicotine; it has been implicated in nicotine addiction in tobacco smokers. There are at least 14 different isoforms of the receptor, which assemble into homo- and heteropentamers with varied properties. Given their many physiological functions and their role in disease, these various isoforms are important targets for new drug development. The effect of acetylcholine on this receptor can be determined by patchclamp recording from isolated outside-out patches of muscle plasma membranes. Outside-out patch-clamp recording is a technique that measures the effects of extracellular solutes on channel receptors within the isolated patch (see Figure 11-22c). Such measurements have shown that acetylcholine causes opening of a cation channel in the receptor capable of transmitting 15,000−30,000 and ions per millisecond. However, since the resting potential of the muscle plasma membrane is near , the potassium equilibrium potential, opening of acetylcholine receptor channels causes little increase in the efflux of ions; ions, on the other hand, flow into the muscle cell, driven by the electrochemical gradient. The simultaneous increase in permeability to and ions following binding of acetylcholine produces a net depolarization to about −15 mV from the muscle resting potential of −85 to −90 mV. As shown in Figure 23-30, this localized depolarization of the muscle plasma membrane triggers opening of voltage-gated channels, leading to generation and
conduction of an action potential in the muscle cell-surface membrane by the same mechanisms described previously for neurons. When the membrane depolarization reaches transverse tubules, specialized invaginations of the plasma membrane (see Figure 17-32b), it acts on channels in the plasma membrane apparently without causing them to open. This in turn triggers the opening of adjacent -release channels in the sarcoplasmic reticulum membrane. The subsequent flow of stored ions from the sarcoplasmic reticulum into the cytosol raises the cytosolic concentration sufficiently to induce muscle contraction.
FIGURE 23-30 Sequential activation of gated ion channels at a neuromuscular junction. Arrival of an action potential at the terminus of a presynaptic motor neuron induces (step
1 ) opening of voltage-gated channels in the neuron and subsequent release of acetylcholine, which (step 2 ) triggers opening of the ligand-gated acetylcholine receptors in the muscle plasma membrane. The open receptor channel allows an influx of and an efflux of from the muscle cell. The influx produces a localized depolarization of the membrane, leading to (step 3 ) opening of voltage-gated channels and generation of an action potential. When the spreading depolarization reaches transverse tubules, it is sensed by voltage-gated channels in the plasma membrane. Through an unknown mechanism (indicated as a “?”) these channels remain closed but influence channels in the sarcoplasmic reticulum membrane (a network of membrane-bound compartments in muscle), which release stored into the cytosol (step 4 ). The resulting rise in cytosolic causes muscle contraction by mechanisms discussed in
Chapter 17. Description At step 1, a foot-like structure is labeled motor neuron. On the left, calcium enters the motor neuron through a voltage-gated calcium channel. At step 2, at the bottom is one white circle, open to the space below the foot shape, with red ovals in it labeled acetylcholine. Below the foot structure is an oval labeled muscle cell with a white nucleus. A channel in the muscle cell membrane is labeled nicotinic acetylcholine receptor. Acetylcholine and sodium enter into this channel and potassium exits out. At step 3, the potassium goes back into the cell through a channel labeled voltage-gated sodium channel. Three transverse tubules are represented as tube-shaped bends in the cell membrane. At step 4, there is a dotted line labeled with a question points to a calcium channel in the sarcoplasmic reticulum where the calcium is released into the cytosol. Careful monitoring of the membrane potential of the muscle membrane at a synapse with a cholinergic motor neuron has demonstrated spontaneous, intermittent, and random ~2 ms depolarizations of about 0.5−1.0 mV in the absence of stimulation of the motor neuron. Each of these depolarizations is caused by the spontaneous release of acetylcholine from
All Five Subunits in the Nicotinic Acetylcholine Receptor Contribute to the Ion Channel
a single synaptic vesicle in the neuron. The release of one acetylcholinecontaining synaptic vesicle results in the opening of about 3000 ion channels in the postsynaptic membrane, far short of the number needed to reach the threshold depolarization that induces an action potential. Clearly stimulation of muscle contraction by a motor neuron requires the nearly simultaneous release of acetylcholine from numerous synaptic vesicles. All Five Subunits in the Nicotinic Acetylcholine Receptor Contribute to the Ion Channel The excitatory nicotinic acetylcholine receptor, found at many nervemuscle synapses, was the first ligand-gated ion channel to be purified, cloned, and characterized at the molecular level and provides a paradigm for other neurotransmitter-gated ion channels. The acetylcholine receptor from skeletal muscle is a pentameric protein with a subunit composition of . These four different subunit types have considerable sequence homology with each other; on average, about 35−40 percent of the residues in any two subunits are similar, suggesting that they all derived from a common ancestral gene. The complete receptor has fivefold symmetry, and the actual cation channel is a tapered central pore lined by homologous segments from each of the five subunits (Figure 23-31). The channel opens when the receptor cooperatively binds two acetylcholine molecules to sites located at the interfaces of the αδ and αγ subunits, as shown in Figure 23-31a. Once acetylcholine is bound to a receptor, the channel is opened within a few microseconds. Studies measuring the
receptor’s permeability to different small cations suggest that the open ion channel is about 0.65−0.80 nm in diameter at its narrowest, in agreement with estimates from electron micrographs. This would be sufficient to allow passage of both and ions with their shell of bound water molecules.
FIGURE 23-31 Three-dimensional structure of the nicotinic acetylcholine receptor. Three-dimensional molecular structure of the Torpedo nicotinic acetylcholine receptor as viewed (a) from the synaptic cleft and (b) parallel to the plane of the membrane. For clarity, only the front two subunits, α and γ, are highlighted in (b) (colors: α, red; β, green; γ, blue; δ, light blue). The two acetylcholine-binding sites are located about 3 nm from the membrane surface and are highlighted in yellow; only the one at the α-γ interface is shown in panel (b). (c) Schematic cutaway model of the pentameric receptor in the membrane. Each subunit has four membrane-spanning α helices, M1−M4; the M2 α helix (red) faces the central pore. Aspartate and glutamate side chains form two rings of negative charges, one at each end of the M2 helices, that help exclude anions from and attract cations to the channel. The gate, which is opened by binding of acetylcholine, lies within the pore. [Data from N. Unwin, 2005, J. Mol. Biol. 346:967–989, PDB ID 2bg9.] Description The illustration labeled (a) shows the view of the protein from the synaptic cleft. The protein is composed of five domains, arranged clockwise in this view as delta, alpha, gamma, alpha, and beta. Acetylcholine is docked between the delta and alpha and gamma and alpha domains. The illustration labeled (b) shows the side view of the protein with the alpha helices embedded in the plasma membrane. The illustration labeled (c) shows channel protein that has extended six nanometers into the synaptic space, three nanometers in the plasma membrane, and two nanometers into the cytosol. The pore diameter in the cytosol is two nanometers. The transmembrane part of the pore has two negatively charged rings at either end of the transmembrane pore, and there is a narrower part of the pore, labeled the gate, in the middle of the transmembrane pore. We have described the neuromuscular junction as an excellent example of how neurotransmitters and their receptors work. Like acetylcholine, glutamate, a principal neurotransmitter used for signaling between neurons in the vertebrate brain, uses two main types of receptors. One class, termed ionotropic glutamate receptors, are ligand-gated ion
Nerve Cells Integrate Many Inputs to Make an All-or-None Decision to Generate an Action Potential
channels that allow the flow of , and sometimes in response to glutamate binding and that work along the same principles as AChR. Glutamate also binds to a second class of receptors, coupled to G proteins. Later in this chapter, we will see how such G protein–coupled receptors (GPCRs) and ion channels function as receptors for odorants (molecules that activate odor receptors) and tastants (molecules that activate taste receptors). Nerve Cells Integrate Many Inputs to Make an All-or-None Decision to Generate an Action Potential At the neuromuscular junction, virtually every action potential in the presynaptic motor neuron triggers an action potential in the postsynaptic muscle cell that propagates along the muscle fiber. The situation at synapses between neurons, especially those in the brain, is much more complex because the postsynaptic neuron commonly receives signals from many presynaptic neurons. The neurotransmitters released from presynaptic neurons may bind to an excitatory receptor on the postsynaptic neuron, thereby opening a channel that admits ions or both and ions. The acetylcholine and glutamate receptors just discussed are examples of excitatory receptors, and opening of such ion channels leads to depolarization of the postsynaptic plasma membrane, promoting generation of an action potential. In contrast, binding of a neurotransmitter to an inhibitory receptor (inhibiting action potential firing) on the postsynaptic cell causes opening of or channels,
leading to an efflux of additional ions or an influx of ions. In either case, the ion flow tends to hyperpolarize the plasma membrane, which inhibits generation of an action potential in the postsynaptic cell. A single neuron can be affected simultaneously by signals received at multiple excitatory and inhibitory synapses. The neuron continuously integrates these signals and determines whether or not to generate an action potential. In this process, the various small depolarizations and hyperpolarizations generated at synapses move along the plasma membrane from the dendrites to the cell body and then to the axon hillock, where they are integrated. An action potential is generated whenever the membrane at the axon hillock becomes depolarized to a certain voltage, which can be different for different neurons, called the threshold potential (Figure 23-32). Thus an action potential is generated in an all-or-nothing fashion: depolarization to the threshold always leads to an action potential, whereas any depolarization that does not reach the threshold potential never induces it. EXPERIMENTAL FIGURE 23-32 Incoming signals must reach the threshold potential to trigger an action potential in a postsynaptic neuron. In this example, the presynaptic neuron is generating about one action potential every 4 ms. Arrival of each action potential at the synapse causes a small change in the membrane potential at the axon hillock of the
Gap Junctions Allow Direct Communication Between Neurons and Between Glia
postsynaptic neuron, in this example a depolarization of ~5 mV. When multiple stimuli cause the membrane of this postsynaptic cell to become depolarized to the threshold potential, here approximately 40 mV, an action potential is induced. Description The illustration shows a presynaptic cell with the axon that meets the dendrites of the postsynaptic cell. An arrow, moving from the cell body to the axon terminus of the presynaptic cell, indicates the direction of the action potential. The axon hillock, between the cell body and axon of the postsynaptic cell, has an electrode attached to it. A graph shows the results of the measurement. The horizontal axis represents time in milliseconds and the vertical axis represents membrane potential ranging from minus 60 to plus 40 millivolts in increments of 20 millivolts. The curve shows a step-like profile, increasing by five millivolts every five milliseconds. After about 20 milliseconds, the membrane potential is minus 40 millivolts, the threshold potential. At this potential, the membrane potential suddenly increases to plus 40 and then falls to minus 60 millivolts in a period of a couple of milliseconds and the peak is labeled action potential. Whether a neuron generates an action potential in the axon hillock depends on the balance of the timing, amplitude, and localization of all the various inputs it receives; this signal computation differs for each type of neuron. In a sense, each neuron is a tiny analog-to-digital computer that averages all the receptor activations and electrical disturbances on its membrane (analog) and makes a decision whether or not to trigger an action potential (digital) and conduct it down the axon. An action potential will always have the same magnitude in any particular neuron. As we have noted, the frequency with which action potentials are generated in a particular neuron is the important parameter in its ability to signal other cells.
Gap Junctions Allow Direct Communication Between Neurons and Between Glia Chemical synapses employing neurotransmitters allow one-way communication at reasonably high speed. However, sometimes signals go from cell to cell electrically, without the intervention of chemical synapses. Electrical synapses depend on gap-junction channels that link two cells together (see Chapter 20). The effect of gap-junction connections is to perfectly coordinate the activities of joined cells. An electrical synapse is usually bidirectional; either neuron can excite the other. Electrical synapses are common in the neocortex and thalamus, among others. The key feature of electrical synapses is their speed. While it takes about 0.5−5 ms for a signal to cross a chemical synapse, transmission across an electrical synapse is almost instantaneous, on the order of a fraction of a millisecond, since the cytoplasm is continuous between the cells. In addition, the presynaptic cell (the one sending the signal) does not have to reach a threshold at which it can cause an action potential in the postsynaptic cell. Instead, any electrical current continues into the next cell and causes depolarization in proportion to the current. Gap junctions can also form between glial cells and between neurons and glia. Astrocytes in the brain are connected to one another through gap junctions, which gives rise to the generation of waves of that propagate through networks of astrocytes in the brain at a speed of 1 μm/sec. Gap junctions also form within individual Schwann cells, forming
connections between the layers of myelin formed by a single Schwann cell. These gap junctions are thought to facilitate the passage of metabolites and ions between myelin layers. An electrical synapse may contain thousands of gap-junction channels, each composed of two hemichannels, one in each apposed cell. Gapjunction channels in the neuron have a structure similar to conventional gap junctions (see Figure 20-21). Each hemichannel is an assembly of six copies of the connexin protein. Since there are about 20 mammalian connexin genes, diversity in channel structure and function can arise from the different protein components. The 1.6−2.0 nm channel itself allows the diffusion of molecules up to about 1000 Da in size and has no trouble at all accommodating ions. KEY CONCEPTS OF SECTION 23.3 Communication at Synapses Synapses are the junctions between a presynaptic cell and a postsynaptic cell and are the site of communication between neurons (see Figure 23-3). Synapse formation is mediated by interactions between presynaptic axonal compartments and postsynaptic dendritic compartments. Cell-adhesion molecules keep the cells aligned. At the neuromuscular junction, motor neurons induce the accumulation of acetylcholine receptors in the postsynaptic muscle plasma membrane close to the forming axon terminus (see Figure 23-23). In presynaptic cells, low-molecular-weight neurotransmitters (e.g., acetylcholine, dopamine, epinephrine) are imported from the cytosol into synaptic vesicles by - linked antiporters. V-class proton pumps maintain the low intravesicular pH that drives neurotransmitter import against a concentration gradient. Neurotransmitters are stored in hundreds to thousands of synaptic vesicles in the axon termini of the presynaptic cell. When an action potential arrives there, voltagesensitive channels open and the calcium causes synaptic vesicles to fuse with
the plasma membrane, releasing neurotransmitter molecules into the synapse (see
Figure 23-27, step 4 ). Neurotransmitters diffuse across the synapse and bind to receptors on the postsynaptic cell, which can be a neuron or a muscle cell. Chemical synapses of this sort are unidirectional (see Figure 23-3). Synaptic vesicles fuse with the plasma membrane using cellular machinery that is standard for exocytosis, including SNAREs and SM proteins. Synaptotagmin protein is the calcium sensor that detects the action potential−stimulated rise in calcium that leads to the fusion (see Figure 23-29). RIM and RIM-BP tether voltage-gated channels to the release machinery, ensuring fast coupling between action potentials and neurotransmitter release. Following neurotransmitter release from the presynaptic cell, vesicles are re-formed by endocytosis and recycled (see Figure 23-27, step 6 ). Coordinated operation of four gated ion channels at the synapse of a motor neuron and a striated muscle cell leads to release of acetylcholine from the axon terminus, depolarization of the muscle membrane, generation of an action potential, and subsequent muscle contraction (see Figure 23-30). Neurotransmitter receptors fall into two classes: ligand-gated ion channels, which permit ion passage when open, and G protein–coupled receptors (GPCRs), which are linked to separate ion channels. A postsynaptic neuron generates an action potential only when the plasma membrane at the axon hillock is depolarized to the threshold potential by the summation of small depolarizations and hyperpolarizations caused by activation of multiple neuronal receptors (see Figure 23-32). Electrical synapses are direct gap-junction connections between neurons and between glia. Electrical synapses are extremely fast in signal transmission and are usually bidirectional.
23.4 Sensing the Environment: Touch, Pain, Taste, and Smell
23.4 Sensing the Environment: Touch, Pain, Taste, and Smell Our bodies are constantly receiving signals from our environment: light, sound, smells, tastes, mechanical stimulation, heat, and cold. Our perception of these signals is mediated by the brain. In recent years dramatic progress has been made in understanding how our senses record impressions of the outside world and how the brain processes that information. For example, in Chapter 15 we described the functions of one of the two types of photoreceptors in the human retina, the rods, and learned how they serve as primary recipients of visual stimulation. Rods are stimulated by weak light, like moonlight, over a range of wavelengths, while the other photoreceptors, the cones, mediate color vision in the presence of bright light. Their photoreceptors synapse on layer upon layer of interneurons that are innervated by different combinations of photoreceptor cells. These signals are processed and interpreted by the part of the brain called the visual cortex, where these nerve impulses are translated into an image of the world around us. In this section, we discuss the cellular and molecular mechanisms and specialized nerve cells underlying several of our other senses: touch, pain, taste, and smell. We see how two broad classes of receptors, ion channels and G protein–coupled receptors, function in these sensing processes. As with vision, multiple interneurons connect these sensory cells with the
Mechanoreceptors Are Gated Cation Channels
brain, where relayed signals are converted into perceptions of the environment. New technologies, such as optogenetics, have been especially powerful tools in mapping these circuits. In the case of smell, each sensory neuron expresses a single odorant receptor, and we shall see how multiple sensory neurons that express the same receptor activate the same brain center. The connections between odorant binding and perception by the brain are thus direct and fairly well understood. Mechanoreceptors Are Gated Cation Channels Our skin, especially the skin of our fingers, is highly specialized for collecting sensory information. Our whole body, in fact, has numerous mechanosensors embedded in its various tissues. These sensors frequently make us aware of touch, the positions and movements of our limbs or head (proprioception), pain, and temperature, though we often go through periods when we ignore these inputs. Mammals use different sets of receptor cells to report on touch, temperature, and pain. These mechanosensory receptors are located at the terminals of a class of bipolar sensory neurons called dorsal root ganglion cells. The cell bodies of dorsal root ganglion cells are located in the dorsal root ganglion, adjacent to the spinal cord (see Figure 23-4), and the neurons extend an axon that bifurcates into a peripheral branch that innervates the skin and contains the mechanosensory receptors, and a central branch that projects to the spinal cord or brain stem to relay sensory signals for processing.
Many mechanosensory receptors are or channels that are gated, or opened, in response to specific stimuli; activation of such receptors causes an influx of or both and ions, leading to membrane depolarization. Examples include the stretch and touch receptors that are activated by stretching of the cell membrane; these have been identified in a wide array of cells, ranging from vertebrate muscle and epithelial cells to yeast, plants, and even bacteria. The cloning of genes encoding touch receptors began with the isolation of mutant strains of C. elegans that were insensitive to gentle body touching. Four of the genes in which mutations were isolated, MEC-2, MEC-4, MEC-6, and MEC-10, encode two subunits (MEC-4 and MEC-10) and two accessory proteins (MEC-2 and MEC-6) of a channel in the touchreceptor cells. Studies on worms with mutations in these genes showed that these channels are necessary for transduction of a gentle body touch; biophysical studies indicated that these channels likely open directly in response to mechanical stimulation (Figure 23-33). The touch-sensitive complexes contain several other proteins essential for touch sensitivity, including subunits of novel 15-protofilament microtubules in the cytosol and specific proteins in the extracellular matrix. Similar kinds of channels are found in bacteria and lower eukaryotes; by opening in response to membrane stretching, these channels may play a role in osmoregulation and the control of a constant cell volume.
FIGURE 23-33 The MEC-4 touch-receptor complex in C. elegans consists of a channel and extracellular matrix proteins. The MEC-4 and MEC-10 proteins are the poreforming subunits of the channel; MEC-2 and MEC-6 are accessory subunits that enable channel activity. Mechanotransduction also requires a specialized extracellular matrix, consisting of MEC-5, a collagen isoform, and MEC-1 and MEC-9, both proteins with multiple EGF repeats. MEC-7 and MEC-12 are tubulin monomers that form novel 15protofilament microtubules that are also required for touch sensitivity. See E. A. Lumpkin, K. L. Marshall, and A. M. Nelson, 2010, J. Cell Biol. 191:237. Description The illustration shows a plasma membrane with cholesterol and a sodium-ion channel. M E C proteins m e c-4 and m e c-10 form the channel in the plasma membrane. M e c2 is associated with the sodium ion channel on the cytosolic face of the membrane, and m e c-6 is associated with the channel and located in the plasma membrane. M e c-1, 5, and 9 proteins are associated with extracellular matrix proteins. M e c-7 and 12 are tubulin monomers that form microtubules in the cytosol. Two novel channels were discovered in 2010 that directly convert mechanical stimuli into cation conductance in mammalian cells, called Piezo1 and Piezo2 (from the Greek word piesi, which means “pressure”).
Both form large cation-selective channels composed of three identical subunits, with each subunit containing 38 membrane-spanning domains, creating a channel that has 114 transmembrane segments! Expression of Piezo1 or Piezo2 induces mechanosensitive-cation currents in these cells. This can be assayed by expressing the channels in cell culture, and using calcium imaging to monitor the response of the cells to stretch induced by poking the cells with a small glass pipette (Figure 23-34). Reduction of Piezo2 expression in dorsal root ganglion sensory neurons in mice reduced their mechanosensitivity, and knockout of the single Piezo homolog in Drosophila resulted in flies with severely reduced behavioral responses to noxious mechanical stimuli. Together, these experiments show that Piezo channels mediate mechanical signal transduction.
FIGURE 23-34 Piezo channels are mechanotransducers. (a) To identify channels that transduced mechanical information, cDNAs encoding transmembrane proteins were expressed in heterologous cells, and the response to mechanical perturbation with a glass pipette was determined by patch-clamp recording (shown) or by calcium imaging (not shown). (b) When Piezo1 or Piezo2 cDNAs are expressed in cultured cells, poking the cell with a glass pipette elicits a strong inward current. (c) Piezo1 and 2 form homotrimeric cation channels. Each subunit is extremely large, with over 2000 amino acid residues and 38 transmembrane domains. The assembled channel thus contains 114 membrane spanning
Pain Receptors Are Also Gated Cation Channels
domains and has a mass of over 1.2 million daltons (about the same mass as the small subunit of the ribosome)! Description The illustration labeled (b) shows a cell with an attached patch-clamp electrode. The membrane potential was measured to determine the effect of touching the cell with the micropipette. A graph shows that pushing a micropipette into the cell by 5 micrometers for 100 milliseconds led to an immediate and rapid increase in current, about 50 Pico amperes in a few tens of milliseconds. The total response lasts about 40 milliseconds before the current returns to normal. The illustration 1 labeled (c) the piezo 1 and piezo 2 protein channels, containing many transmembrane domains. The N terminus is in the cytosol at the far left of the diagram, and the C terminus is in the cytosol at the far right. Pain Receptors Are Also Gated Cation Channels Animals as diverse as snails and humans sense noxious events (the process termed nociception); pain receptors, called nociceptors, respond to mechanical change, heat, and certain toxic chemicals. Pain serves to alert us to events such as tissue damage that are capable of producing injury and evokes behaviors that promote tissue healing. Persistent pain in response to tissue injury is common, and many individuals suffer from chronic pain. Thus understanding both acute and chronic pain is a major research goal, as is the development of new types of drugs to treat pain. One of the first mammalian pain receptors to be cloned and identified was TRPV1, a channel that is found in many sensory
pain neurons of the peripheral nervous system and is activated by a wide variety of exogenous and endogenous physical and chemical stimuli. The best known activators of TRPV1 are heat greater than 43 °C, acidic pH, and capsaicin, the molecule that makes chili peppers hot. Activation of TRPV1 receptors leads to painful, burning sensations. Numerous TRPV1 antagonists have been developed by pharmaceutical companies as possible pain medications. However, a major side effect that has limited the utility of these drugs is that they result in an elevation in body temperature; this suggests that one function of TRPV1 is to sense and regulate body temperature and that the drugs inhibit this function. In a landmark study, scientists used single-particle cryoelectron microscopy (cryoEM, see Chapter 3 and 11) to obtain a high-resolution (0.34 nm) model of the rat TRPV1 channel in the closed configuration and in two open configurations, one bound to capsaicin and the other bound to two potent TRPV1 activators, one from plant and the other from spider venom. As shown in Figure 23-35, these studies revealed that the TRPV1 channel structure is similar to that of voltage-gated ion channels (see
Figure 23-13), composed of four symmetrical subunits with six transmembrane helices (S1−S6) each. However, the charged amino acids in S1−S4 that function as voltage sensors in voltage-gated ion channels are replaced by aromatic residues in TRPV1. This stabilizes the channel core so that instead of moving like voltage sensors upon depolarization, the TRPV S1−S4 helices provide an anchor for movements within the pore that are triggered by ligand binding. Two constrictions, or gates, were identified in the pore region. The spider toxin bound to the extracellular surface of the channel, near the pore helix, and locked open the
extracellular end of the channel. Capsaicin and the plant toxin bound to a site deep within the membrane toward the cytoplasmic end of the pore, with binding increasing the diameter of the pore. These findings indicate that the TRPV channel undergoes dual gating and is able to respond to diverse ligands.
FIGURE 23-35 Single-particle cyroelectron microscopy high-resolution structure of the TRPV1 channel demonstrates how this channel is activated by various chemical stimuli. The high-resolution structure of the rat TRPV1 channel was obtained by single-particle cryoelectron microscopy at 0.34 nm resolution. (a) Photomicrographs of the twodimensional structure of the tetrameric TRPV1 channel embedded in a thin layer of vitreous ice, with a face view of the channel in the top panel, and a side view in the bottom panel. (b, top) Ribbon diagram of a bottom view of the channel that focuses on the S1−S4 transmembrane domains, and the pore domain formed by S5 and S6, together with linking
Five Primary Tastes Are Sensed by Subsets of Cells in Each Taste Bud
pore (P) loops. The S1−S4 domain is similar in structure to the voltage-sensing domains in the voltage-gated and channels (see Figure 23-14) but differ in that they do not move. (b, bottom) Ribbon diagram of the side view of the channel in the closed conformation, focusing on the pore domain that is formed by S5-P-S6. (c) The open conformation was stabilized by incubating the channel with two agonists, a spider toxin (in magenta) and a plant toxin (in red). Cryoelectron density maps reveal that the spider toxin (magenta) binds to external domains of the channel, linking two subunits of the channel together via its two globular cysteine-knot domains, while the plant toxin (red) binds to a region deep within the pore. Capsaicin binds to the same sites as the plant toxin (not shown). Binding of agonists to two distinct sites indicates that the TRPV1 channel is dually gated, allowing for significant modulation of channel function. [Part (a) republished with permission from Nature, from M. Liao et al., 2013, “Structure of the TRPV1 Ion Channel Determined by Electron Cryo-Microscopy,” Nature 504:107–112; permission conveyed through Copyright Clearance Center, Inc. Part (b) data from M. Liao et al., 2013, Nature 504:107–112, PDB ID 3j5p. Part (c) data from E. Cao et al., 2013, Nature 504:113–118, PDB ID 3j5q.] Description The micrograph labeled (a) shows the four-fold symmetry of the T R P V 1 protein from the exterior face, and the transverse view. The illustration labeled (b) shows the top three-dimensional ribbon models with closed conformation at the cytosolic face. Labeled at the left are the S 1-S 4 f area, the S 4-S 5 linker, and the S 6. Below this is the transverse view, with S 1-S 4 removed. On this model, an area at the top is labeled Pore helix. The illustration labeled (c) shows three-dimensional ribbon models of the open conformation. At the top is the exterior face. On the left side are two labeled areas (plant toxin and spider toxin). Below this, the three-dimensional model is of the transverse view. In this view, the spider toxin is labeled at the top, and the plant toxin is represented as a red sphere toward the center of the ribbon model. The cell membrane is behind the transverse views in all three models.
Five Primary Tastes Are Sensed by Subsets of Cells in Each Taste Bud We taste many chemicals, all of which are hydrophilic and nonvolatile molecules dissolved in saliva. Like the other senses, that of taste likely evolved to increase an animal’s chance of survival. Many toxic substances taste bitter or acidic, and nourishing foods are broken down into molecules that taste sweet (e.g., sugars), salty, or umami (e.g., the meaty or savory taste of monosodium glutamate and other amino acids). Animals (including humans) can never be certain exactly what enters their mouth; the sense of taste enables an animal to make a quick decision — eat it, or get rid of it. Taste is less demanding of the nervous system than olfaction, because fewer types of molecules are monitored. What is impressive is the sensitivity of taste; bitter molecules can be detected at concentrations as low as . All tastes are sensed on all areas of the tongue, and selective cells respond preferentially to certain tastes. There are receptors for salty, sweet, sour, umami, and bitter tastes in all parts of the tongue. The receptors are of two different types: channel proteins for salty and sour tastes and seventransmembrane-domain proteins (G protein–coupled receptors) for sweetness, umami, and bitterness. Specific membrane receptors that detect fatty acids are present on taste bud cells, and fatty taste is considered by some to be a sixth basic taste quality.
Taste buds are located in bumps in the tongue called papillae; each bud has a pore through which fluid carries solutes inside. Each taste bud has about 50−100 taste cells (Figure 23-36a, b), which are epithelial cells but with some of the functions of neurons. Microvilli on the taste cells’ apical tips bear the taste receptors, directly contacting the external environment in the oral cavity and thus experiencing wide fluctuations in food-derived molecules as well as the presence of potentially harmful compounds. Cells in the tongue and other parts of the mouth are subjected to a lot of wear and tear, and taste bud cells are continuously replaced by cell divisions in the underlying epithelium.
FIGURE 23-36 The sense of taste is mediated by chemical signals. (a) The taste cells (pink) in a mammalian taste bud contact the nerve cells (yellow). The chemical signals arrive at the microvilli seen at the top. (b) Micrograph of a mammalian taste bud, showing the receptor cells. The microvilli are barely visible at the top of the taste bud, indicated by
the label. (c) Sweet, bitter, and umami ligands bind specific taste GPCRs expressed in type II receptor cells, activating a phosphoinositide pathway that elevates cytosolic in turn binds to and opens a -gated channel, TrpM5, leading to an influx of and membrane depolarization. The combined action of elevated and membrane depolarization opens the large pores of a membrane channel termed Panx1, resulting in release of ATP and probably other signaling molecules into the extracellular space. ATP and these other molecules stimulate the nerve cells that will ultimately carry the information to the brain. (d) Salt is detected by direct permeation of ions through membrane ion channels, including the ENaC channel, directly depolarizing the plasma membrane. (e) Organic acids like acetic acid diffuse in their protonated form (H⋅Ac) through the plasma membrane and dissociate into an anion and proton, acidifying the cytosol. Entry of strong acids like HCl is facilitated by a proton channel in the apical membrane of the sour-sensing cells that enables protons to reach the cytosol. Intracellular is believed to block a proton-sensitive channel (as yet unidentified) and thus depolarize the membrane. Voltage-gated channels would open, leading to an elevation in cytosolic that triggers exocytosis of synaptic vesicles that are not depicted. See N. Chaudhari and S. D. Roper, 2010, J. Cell Biol. 190:285; and S. Frings, 2010, Proc. Nat'l Acad. Sci. USA 107:21955. Description The illustration labeled (a) shows a taste pore with a tear-shaped bundle of taste receptor cells, which are embedded in the epithelial cells of the tongue. At the tip of the receptor bundle, microvilli of the receptor cells protrude out of a gap in the epithelial cells. At the base of the receptor cell bundle, nerve cells innervate the receptor cells and allow the conduction of signals to the brain. The micrograph labeled (b) shows a stained sample of the mammalian taste bud. The illustration labeled (c), (d), and (e) shows the receptors and pathways responsible for tasting sweet, bitter, and umami, salt, and sour, respectively. To sense sweet, bitter, or umami tastes, A G-protein coupled receptor embedded in the plasma membrane of a cell receptor binds the tasting. The signal is passed via the associated G-protein, P I P 2, P L C-beta-2, and D A G, which releases inositol triphosphate into the cytosol, resulting in the opening of I P 3 R 3 calcium channels in calcium storage vesicles. The increase in cytosolic calcium causes T r p M 5 and P a n x 1 channel proteins in the receptor cell plasma membrane to open, importing sodium and exporting A T P, respectively. To sense salty flavors, E-N a-C
channels allow transport of sodium into the cytosol, depolarizing the membrane. To sense sour taste, organic acids diffuse through the plasma membrane, acidify the cytosol. Protons enter the cytosol through proton channels and blocks the protonsensitive potassium channels. Reception of a taste signal causes cell depolarization that triggers action potentials; these in turn cause uptake through voltage-dependent channels and release of neurotransmitters (Figure 23-36 c−e). Taste cells do not grow axons; instead, they signal over short distances to adjacent neurons. These neurons convey the information about taste through multiple connections to a region of the cortex that is specialized for taste, called the insula. To determine how the insula knows that a salty taste receptor as opposed to a sweet taste receptor has been activated, scientists performed two-photon imaging (see Chapter 4) of insula in mice after presentation of a specific tastant. They used calcium indicators to detect the neurons that were activated and in this way were able to monitor the activation of large numbers of neurons as calcium-dependent increases in fluorescence. These experiments revealed that four of the tastes — sweet, bitter, umami, and salty — are represented in separate, nonoverlapping regions within the insula, thereby demonstrating the existence of a gustotopic map in the brain that mediates our representation of taste. Bitter Taste Bitter tastants are diverse and are detected by a family of about 25−30 different G protein–coupled receptors (GPCRs) known as T2Rs. As
depicted in Figure 23-36c, all of these GPCRs activate a particular Gα isoform, called gustducin, which is expressed only in taste cells. However, it is the released ubiquitous Gβγ subunit of the heterotrimeric G protein that binds to and activates a specific isoform of phospholipase Cβ, which in turn generates triggers release from the endoplasmic reticulum (see Figure 15-28). in turn binds to and opens a - gated channel, TRPM5, a member of the TRP family of ion channels, leading to an influx of and membrane depolarization. The combined action of elevated and membrane depolarization opens the large pores of a membrane channel termed Panx1, resulting in release of ATP and probably other signaling molecules into the extracellular space. ATP is then thought to act as a neurotransmitter to stimulate the nerve cells that will ultimately carry the taste information to the brain. Different bitter taste molecules are quite distinct in structure, which probably accounts for the need for the diverse family of T2Rs. Some T2Rs bind only 2−4 bitter-tasting compounds, whereas others bind a wider variety of bitter compounds. The first member of the T2R family to be identified came from human genetics studies that showed an important bitterness-detection gene, the TAS2R38 gene, on chromosome 5. Mice that have five amino acid changes in the T2R protein T2R5 are unable to detect the bitter taste of cycloheximide (a protein synthesis inhibitor). Multiple T2R types are often expressed in the same taste cell, and about 15 percent of all taste cells express T2Rs. A clever gene regulation swap experiment was done to demonstrate the role of T2R proteins. Mice were engineered to express a bitter-taste
receptor, a T2R protein, in cells that normally detect sweet tastants that attract mice. The mice developed a strong attraction for bitter tastes, evidently because the cells continued to send a “go and eat this” signal even though they were detecting bitter tastants. This experiment demonstrates that the specificity of taste cells is determined within the cells themselves and that the signals they send are interpreted according to the neural connections made by that class of cells. It implies that the T2Rexpressing sweet taste receptors were wired to the region of the insula that receives bitter signals and that it was thus represented as a sweet taste. Sweet and Umami Tastes Sweet and umami tastants are detected by a GPCR family called the T1Rs, which are related to the T2Rs and that also transduce signals through a phosphoinositide signaling pathway. The three mammalian T1Rs differ from one another in a small number of amino acids. The T1Rs have very large extracellular domains that comprise the taste-binding domain of the protein. In the taste-sensing glutamate receptor, the extracellular domain closes around glutamate in a way that is described as analogous to a Venus flytrap (see Chapter 15). Unlike most GPCRs, which generally function as monomers, T1Rs form homodimers and heterodimers, which is thought to increase the repertoire of molecules that can act as signals. However, the code of responses to different molecules is still under investigation. Mice lacking T1R2 or T1R3 fail to detect sugar; it is thought that the actual receptor is a heterodimer of the two. T1R3 appears to be a receptor for both sweet tastes and umami and that is because it detects sweets when combined with T1R2 and umami when combined with T1R1. Accordingly,
taste cells express T1R1 or T1R2 but not both, as otherwise they would send an ambiguous message to the brain. Interestingly, sweet-taste receptors are also found on the surface of certain endocrine cells in the gut; these cells also express gustducin and several other taste transduction proteins. The presence of glucose in the gut causes these cells to secrete the hormone glucagon-like peptide-1 (GLP-1), which in turn regulates appetite, and enhances insulin secretion and gut motility. Thus certain cells of the gut “taste” glucose through the same mechanisms used by taste cells of the tongue. Salty Taste The taste of salt is elicited by a wide range of concentrations, from 10 mM to 500 mM. Salt is sensed by a member of a family of channels called ENaC channels (Figure 23-36d). Indeed, knocking out a critical ENaC subunit in taste buds impaired salty-taste detection in mice. The influx of through the channel depolarizes the taste cell, leading to neurotransmitter release. The role of ENaC channels as salt sensors is evolutionarily ancient; ENaC proteins also detect salt when expressed in insects. In Drosophila, taste sensors are located in multiple places including the legs, so when the fly steps on something tasty, the proboscis extends to explore it further. Sour Taste
The Largest Group of G Protein–Coupled Receptors Detect Odors
Perception of sourness is due to the detection of ions. One of the sour taste receptors was recently identified as the otopetrin-1 proton channel, a member of a family of proteins originally discovered for their importance in the vestibular system. Acids are detected by the otopetrin-1 proton channel in the apical membrane of the sour-sensing cells, triggering an increase in the intracellular concentration. Protons are believed to block a proton-sensitive channel in mammals and thus depolarize the membrane (Figure 23-36e). In both salt and sour taste detection, voltagegated channels would then open, elevate cytosolic and thus trigger exocytosis of neurotransmitter-filled synaptic vesicles. The Largest Group of G Protein– Coupled Receptors Detect Odors The perception of volatile airborne chemicals imposes different demands than the perception of light, sound, touch, or taste. Light is sensed by only four rhodopsin molecules, tuned to different wavelengths. Sound is detected by mechanical effects through hairs that are tuned to different wavelengths. Touch and pain requires a small number of different gated ion channels. The sense of taste measures a small number of substances dissolved in water. In contrast to all these other senses, olfactory systems can discriminate between many hundreds of volatile molecules moving through air. Discrimination between a large number of chemicals is useful in finding food or a mate, sensing pheromones, and avoiding predators, toxins, and fires. Olfactory receptors work with enormous sensitivity. Male moths, for example, can detect single molecules of the signals sent
drifting through the air by females. In order to cope with so many signals, the olfactory system employs a large family of olfactory receptor proteins. Humans have about 700 olfactory receptor genes, of which about half are functional (the rest are unproductive pseudogenes), a remarkably large fraction of the estimated 20,000 human genes. Mice are more efficient, with more than 1200 olfactory receptor genes, of which about 800 are functional. That means 3 percent of the mouse genome is composed of olfactory receptor genes. Drosophila has about 60 olfactory receptor genes. Odor molecules are called odorants. They have diverse chemical structures, so olfactory receptors face some of the same challenges faced by antibodies and hormone receptors, specifically, the need to bind and distinguish many variants of relatively small molecules. In this section, we will examine how olfactory receptor genes are employed, and how the brain can recognize which odor has been sensed, which are the initial stages of interpretation of our chemical world. Olfactory receptors are seven-transmembrane-domain proteins (Figure 2337). In mammals, olfactory receptors are produced by cells of the nasal epithelium. These cells, called olfactory receptor neurons (ORNs), transduce the chemical signal into action potentials. Each ORN extends a single dendrite to the luminal surface of the epithelium, from which immotile cilia extend to bind inhaled odorants from the air (Figure 2338a). These olfactory sensory cilia are enriched in the odorant receptors and signal transduction proteins that mediate the initial transduction events. In Drosophila, ORNs have similar structures and are located in the antennae (Figure 23-38b).
FIGURE 23-37 Signal transduction from the olfactory GPCRs. Binding of an odorant to its cognate odorant receptor (OR) triggers activation of the trimeric G protein , releasing the active . Activated in turn activates type III adenylyl cyclase (AC3), leading to the production of cyclic AMP (cAMP) from ATP. Molecules of cAMP bind to and open the cyclic nucleotide–gated (CNG) ion channel, leading to the influx of and and depolarizing the cell. cAMP also activates protein kinase A (PKA), which phosphorylates and thus regulates transcription factors and other intracellular proteins.
FIGURE 23-38 The structure of olfactory receptor neurons is evolutionarily conserved. (a) Vertebrate olfactory receptor neurons have one dendrite, which ends in a dendritic knob; from each dendritic knob, approximately 15 cilia extend into the nasal mucus. (b) Insect olfactory receptor neurons are morphologically similar: the bipolar neuron gives rise to a single basal axon that projects to an olfactory glomerulus in the antennal lobe. At its apical side it has a single dendritic process, from which sensory cilia extend. [Data from U. B. Kaupp, 2010, Nat. Rev. Neurosci. 11:188−200.] Description The illustration on the left labeled (a) shows the vertebrate olfactory structure. Air is labeled at the top of the illustration. A pink area at the top is labeled mucus. Cilia are represented as black lines in the mucus, attached to a beige oval labeled dendritic knob. This knob is attached to a dendrite that leads to a cell body. The area around this cell body is brown and labeled as supporting cell. The cell body contains the olfactory receptor neuron. An axon extends from the bottom of the diagram. A second olfactory cell has a light brown cell at the bottom that is labeled basal cell. The illustration
labeled (b) shows the insect olfactory set up. Air is labeled at the top of the illustration. The pinkish area is labeled lymph. Instead of cilia, the black lines are labeled dendrites. The lymph has a dotted line around it with a space between dots labeled sensillum pore. The dendrites attach to an oval shape which is above the brown support cells, which have a line edge labeled cuticle. The cell body, olfactory receptor neuron, and axon are labeled. In both mammals and Drosophila, the ORNs project their axons to the next higher level of the nervous system, which in mammals is located in the olfactory bulb of the brain. The ORN axons synapse with dendrites from mitral neurons in mammals (called projection neurons in insects); these synapses occur in the clusters of synaptic structures called glomeruli. The mitral neurons connect to higher olfactory centers in the brain (Figure 23-39).
FIGURE 23-39 The anatomy of olfaction in the mouse. (a) Schematic representation of a sagittal section through an adult mouse head. Axons of the olfactory receptor neurons (ORNs) in the main olfactory epithelium bundle to form the olfactory nerve and innervate the olfactory bulb. Each ORN of the main olfactory epithelium expresses only one odorant receptor gene. The vomeronasal organ and the accessory olfactory bulb are involved in pheromone sensing. (b) All of the ORNs that express a single type of receptor send their axons to the same glomerulus. In this figure, each color represents the neural connections for each distinct expressed receptor. The glomeruli are located in the olfactory bulb near the brain; in the glomeruli, the ORNs synapse with mitral neurons; each mitral neuron has its dendrites localized to a single glomerulus and its corresponding ORNs, thus carrying information about a particular odorant to higher centers of the brain. Each glomerulus thus receives innervation from sensory neurons expressing a single odorant receptor, providing the anatomical basis of the olfactory sensory map. See T. Komiyama and L. Luo, 2006, Curr. Opin. Neurobiol. 16:67−73; and S. DeMaria and J. Ngai, 2010, J. Cell Biol. 191:443. Description The illustration labeled (a) shows an outline of a mouse head. An area just behind the front teeth is a green oval labeled vomeronasal organ. A black line, labeled vomeronasal nerve, leads back from this organ to the accessory olfactory bulb at the back of the larger olfactory bulb. In the nasal cavity, a pink structure labeled olfactory epithelium contains several black lines attached to the olfactory bulb. The illustration labeled (b) shows a sphere-shaped olfactory bulb covered in gray circles labeled glomeruli. The olfactory bulb is divided into two halves, labeled the dorsal and ventral zones, corresponding to the upper and lower surfaces of the bulb. The olfactory epithelium containing sensory cells are again divided into a dorsal and ventral zone. Nerves from the sensory cells meet mitral nerves, which lead to the brain, in the glomeruli of the olfactory bulb. Humans vary markedly in their ability to detect certain odors. For example, some cannot detect the steroid androstenone, a compound derived from testosterone and found in human sweat. Some describe the odor as pleasant and musky, while others compare it to the smell of dirty
Each Olfactory Receptor Neuron Expresses a Single Type of Odorant Receptor
socks. These differences are all ascribed to inactivating missense mutations in the gene encoding the single androstenone GPCR. Individuals with two copies of the wild-type allele perceive androstenone as unpleasant, whereas those possessing one or no functional alleles perceive androstenone as less unpleasant or undetectable. Despite the vast number of olfactory receptors, all generate the same intracellular signals through activation of the same trimeric G protein: (see Figure 23-37). is expressed mainly in olfactory neurons. Like , the active formed after ligand binding activates an adenylyl cyclase that leads to the production of cyclic AMP (cAMP; see Figure 15-20). Two downstream signaling pathways are activated by cAMP. It binds to a site on the cytosolic face of a cyclic nucleotide–gated (CNG) channel, opening the channel and leading to an influx of and and local depolarization of the cell membrane. This odorant-induced depolarization in the olfactory dendrites spreads throughout the neuronal membrane, resulting in opening of voltage-gated channels in the axon hillock and the generation of action potentials. Molecules of cAMP also activate protein kinase A (PKA), which phosphorylates and thus regulates transcription factors and other intracellular proteins. Each Olfactory Receptor Neuron Expresses a Single Type of Odorant Receptor
The key to understanding the specificity of the olfactory system is that in both mammals and insects each ORN produces only a single type of odorant receptor. Any electrical signal from that cell will convey to the brain a simple message: “an odorant is binding to my receptors.” Receptors are not always completely monospecific for odorants. Some receptors can bind more than one kind of molecule, but the molecules detected are usually closely related in structure. Conversely, some odorants bind to multiple receptors. There are about 5 million ORNs in the mouse, so on average each of the 800 or so olfactory receptor genes is active in approximately 6000 cells. There are about 2000 glomeruli (roughly 2 for each odorant receptor gene), so on average the axons from a few thousand ORNs converge on each glomerulus (see Figure 23-39). From there, about 25 mitral axons per glomerulus, or a total of 50,000 mitral neurons, connect to higher brain centers. Thus the initial odorant-sensing information is carried directly to higher parts of the brain without processing, a simple report of what odorant has been detected. The one neuron–one receptor rule extends to Drosophila. Detailed studies have been done in larvae, where a simple olfactory system with only 21 ORNs uses about 10−20 olfactory receptor genes. It appears that a unique receptor is expressed in each ORN, which sends its projections to one glomerulus. ORNs can send either excitatory or inhibitory signals from their axon termini, probably in order to distinguish attractive versus repulsive odors. Similar to mammals, the axons from the ORNs end in the glomeruli, which in flies are located in the antennal lobe of the larval
brain. The research in Drosophila began with tests of which odorants bind to which receptors (Figure 23-40a). Some odorants are detected by a single receptor, some by several, so the combinatorial pattern allows many more odorants to be distinguished than just the number of different olfactory receptors. The small total number of neurons has allowed a map to be constructed showing which odorants are detected by every glomerulus (Figure 23-40b). One striking finding was that glomeruli located near each other respond to odorants with related chemical structures: for example, linear aliphatic compounds or aromatic compounds. The arrangement may reflect evolution of new receptors concomitant with a process of subdivision of the olfactory part of the brain.
EXPERIMENTAL FIGURE 23-40 Individual olfactory receptor types can be experimentally linked to various odorants and traced to specific glomeruli in the Drosophila larval olfactory system. (a) The different olfactory receptor proteins are listed across the top, and the 27 odorants tested are shown down the left side. Colored dots indicate strong odor responses. Note that some odorants stimulate multiple receptors (e.g., pentyl acetate), while others (e.g., ethyl butyrate) act on only a single receptor. Note that many receptors, such as Or42a or Or67b, respond primarily to aliphatic compounds, whereas others, such as Or30a and Or59a, respond to aromatic compounds. (b) Spatial map of olfactory information in glomeruli of the Drosophila larval brain. The mapping was done by expressing a reporter gene under the control of each of the selected ORNs. The micrograph indicates the glomeruli that receive projections from ORNs producing each of the 10 indicated receptor protein types (Or42a, etc.). Also indicated are the odorants to which each receptor responds strongly. Note that, in this study, with one exception (Or30a and Or45b) each glomerulus has unique sensory capacities. Glomeruli-sensing odorants that are chemically similar tend to be situated next to one another. For example, the three glomeruli indicated by a blue solid line sense linear aliphatic compounds; those with yellow dashed lines, aromatic compounds. [Part (b) republished with permission from Elsevier, from S. A. Kreher, J. Y. Kwon, and J. R. Carlson, 2005, “The Molecular Basis of Odor Coding in the Drosophila Larva,” Neuron 46(3):445–456; permission conveyed through Copyright Clearance Center, Inc.] Description The table labeled (a) lists 27 odorants and the olfactory receptor proteins. The table has 11 columns and 27 rows. The column headers are O r 30 a, O r 42 a, O r 45 a, O r 45 b, O r 49 a, O r 59 a, O r 67 b, O r 74 a, O r 85 c, O r 94 a, O r 94 b. The row entries are as follows. Row 1: Ethyl acetate; O r 42 a, A. Row 2: Pentyl acetate; O r 45 a, P; O r 67 b, P; O r 85 c, P. Row 3: Ethyl butyrate; O r 42 a, B. Row 4: Methyl salicylate; Nil.
Row 5: 1-Hexanol; O r 42 a, X; O r 45 a, X; O r 67 b, X; O r 74 a, X; O r 85 c, X. Row 6: 1-Octen-3-ol; O r 85 c, O. Row 7: E2-hexenol; O r 42 a, E; O r 45 a, E; O r 67 b, E; O r 74 a, E; O r 85 c, E. Row 8: 2,3-Butanedione; O r 42 a, D. Row 9: 2-Heptanone; O r 42 a, H; O r 45 a, H; O r 67 b, H; O r 85 c, H. Row 10: Geranyl acetate; Nil. Row 11: Propyl acetate; O r 42 a, F; O r 85 c, F. Row 12: Isoamyl acetate; O r 42 a, I; O r 85 c, I. Row 13: Octyl acetate; O r 45 a, Yello circle. Row 14: 1-Butanol; O r 42 a, Q; O r 67 b, Q. Row 15: 1-Heptanol; O r 45 a, T; O r 67 b, T; O r 74 a, T; O r 85 c, T. Row 16: 3-Octanol; O r 85 c, F. Row 17: 1-Nonanol; O r 74 a, N. Row 18: Cyclohexanone; Nil. Row 19: (Negative) Fenchone; Nil Row 20: Anisole; O r 30 a, S; O r 45 b, S; O r 59 a, S; O r 94 a, S. Row 21: Methyl eugenol; O r 59 a, L. Row 22: Benzaldehyde; O r 30 a, Z; O r 45 b, Z; O r 67 b, Z. Row 23: Acetophenone; O r 30 a, C; O r 45 b, C; O r 67 b, C. Row 24: 2-Methylphenol; O r 30 a, W; O r 45 b, W; O r 59 a, W. Row 25: 4-Methylphenol; O r 30 a, Y; O r 45 b, Y; O r 94 b, Y. Row 26: Propionic acid; Nil.
Row 27: Carbon dioxide; Nil. The micrograph labeled (b) shows the glomeruli in the Drosophila larval olfactory system. The receptors that respond to the odorants are represented in three colors and they are as follows. Blue: O r 42 a: A, B, X, E, D, H, F, I, Q; O r 74 a: X, E, N, T; O r 85 c, I, E, P, T, H, X, F with green circle, F with orange circle, O. Yellow: O r 30 a: S, Z, C, W, Y; O r 45 b: S, Z, C, W, Y; O r 59 a, S, L, W; O r 94 b, Y. Green: O r 67 b, P, X, E, H, Q, T, Z, C. White: O r 49 a and O r 63 a, Nil. The odorants that are represented with color codes and letters are as follows. A: Ethyl acetate. P: Pentyl acetate. B: Ethyl butyrate. X: 1-Hexanol. O: 1-Octen-3-ol. E: E2-hexenol. D: 2,3-Butanedione. H: 2-Heptanone. F, Orange: Propyl acetate. I: Isoamyl acetate. Q-Butanol. T-Heptanol. F, Green: 3-Octanol.
N: 1-Nonanol. S: Anisole. L: Methyl eugenol. Z: Benzaldehyde. C: Acetophenone. W: 2-Methylphenol. Y: 4-Methylphenol. The simple system of having each cell make only one receptor type also has some impressive difficulties to overcome: (1) Each receptor must be able to distinguish a type of odorant molecule or a set of molecules with specificity adequate to the needs of the organism. A receptor stimulated too frequently would not be useful. (2) Each cell must express one and only one receptor gene product. All the other receptor genes must be turned off. At the same time, the collective efforts of all the cells in the nasal epithelium must allow the production of enough different receptors to give the animal adequate sensory versatility. It does little good to have genes for hundreds of receptors if most of them are never expressed, but it is a regulatory challenge to turn on one and only one gene in each cell and at the same time express all the receptor genes across the complete population of cells. (3) The neuronal wiring of the olfactory system must make discrimination among odorants possible so that the brain can determine which odorants are present. Otherwise the animal might be feeling at ease and relaxed when it should be running away as fast as possible.
The solution to the first problem is the great variability of the olfactory receptor proteins, both within and between species. The solution to the second problem, the expression of a single olfactory receptor gene per cell, has been shown to involve a remarkable form of epigenetic silencing that assures that thousands of olfactory receptor alleles remain inactive in each ORN. These studies have shown that receptor choice relies on the selective activation of a single olfactory receptor gene from a developmental state in which all olfactory receptor genes are silenced. Activation is triggered by a histone demethylase and a specific adenylate cyclase, both of which are required to derepress the single olfactory receptor locus. The active and inactive genes are spatially segregated within the nucleus, with the inactive genes being buried in heterochromatic foci while the active genes are located in euchromatic domains (see Chapter 8). The third problem, how the system is wired so the brain can understand which odor has been detected, has been partly answered. First, ORNs that express the same receptor send their axons to the same glomerulus. Thus all cells that respond to the same odorant send processes to the same destination. In mice, a crucial clue about the patterning of the olfactory system came from the discovery that olfactory receptors play two roles in ORNs: odorant binding and, during development, axon guidance. Multiple ORN axons expressing the same receptor are guided to the same glomerulus destination. Each olfactory receptor has a distinct, odorantindependent level of activation that turns on adenylate cyclase, with the varying levels of cAMP turning on CREB-dependent expression of
standard axon-guidance molecules, whose graded activity is used to specify targeting to a specific glomerulus. KEY CONCEPTS OF SECTION 23.4 Sensing the Environment: Touch, Pain, Taste, and Smell Mechanoreceptors and pain receptors are gated or channels. They are present on specialized terminals at the end of sensory neurons and convey afferent information to the spinal cord and brain stem. Touch sensitivity requires several cytoskeletal and extracellular matrix proteins as well as a gated channel (see Figure 23-33). Piezo 1 and 2 are large-channel proteins that convert mechanical stimulus directly into cation conductance (see Figure 23-34). TRPV channels are nociceptors that are activated by a variety of stimuli, including heat and capsaicin. Their molecular structure is similar to the structure of voltagegated ion channels and was recently solved by single particle cryoEM (see Figure 2335). Five primary tastes are sensed by subsets of cells in each taste bud. Salty and sour tastes are detected by specific ion channel proteins, and G protein–coupled receptors detect sweetness, umami, and bitterness. In all cases, tastants lead to membrane depolarization and secretion of small molecules such as ATP that stimulate the adjacent neurons. Taste is represented in a topographic map in a part of the cortex called the insula. Activation of taste receptors by a specific type of taste (e.g., sweet or salty) activates neurons in specific, nonoverlapping regions of the insula. Odorant receptors, which are seven-transmembrane G protein–coupled receptors, are encoded by a very large set of genes. Any one olfactory receptor neuron expresses one and only one olfactory receptor gene, so a signal from that cell to the brain unambiguously conveys the nature of the chemical sensed. Olfactory receptor neurons (ORNs) that express the same receptor gene send their axons to the same glomerulus, and projection nerves (mitral neurons in mammals) carry odorant-specific information from the glomeruli to the brain (see Figures 23-38, 23-39, and 23-40).
Memories Are Formed by Changing the Number or Strength of Synapses Between Neurons
23.5 Forming and Storing Memories One of the most remarkable features of the brain is its capacity to form and store memories. Decades of research have revealed that memories are stored as changes in the strength and number of connections that form between neurons. While the overall structure of the nervous system is genetically hardwired, neural circuits undergo extensive sculpting and rewiring in response to a variety of stimuli. This process of experiencedependent changes in synaptic connectivity is called synaptic plasticity. By modifying brain wiring in response to experiences, synaptic plasticity provides a biological means of integrating nature and nurture to determine our identities. Memories Are Formed by Changing the Number or Strength of Synapses Between Neurons The concept of synaptic plasticity has a long history, beginning with the neuroanatomical studies of Santiago Ramón y Cajal at the turn of the nineteenth century. He used a method called the Golgi stain to visualize individual neurons in the brains of humans and other animals (Figure 2341a). The Golgi stain was developed by the Italian scientist Camillo Golgi,
with whom Ramón y Cajal shared the 1906 Nobel Prize in Physiology or Medicine for their work on the structure of the nervous system. While Golgi believed that the brain consisted of a “reticular network,” a large syncytium of interconnected nerve cells, Ramón y Cajal recognized that the brain consisted of individual neurons that interacted with one another at sites of contact — what we now know of as synapses. Ramón y Cajal detected synapses as small dendritic protuberances. These protuberances are the postsynaptic compartments of excitatory synapses and can be visualized not only with the Golgi stain but also with more modern methods based on genetic expression of fluorescent proteins (Figure 2341b). Based on his histological data, Ramón y Cajal hypothesized that memories were stored in the brain by changing the structure of the neuronal arbor and by changing the structure and number of synapses that formed between neurons. In poetic terms, Ramón y Cajal speculated that: “the cerebral cortex is like a garden full of innumerable trees, the pyramidal cells, which in response to intelligent cultivation can increase the number of their branches … and produce ever more varied flowers and fruit.”
FIGURE 23-41 Visualizing dendritic spines. (a) Santiago Ramón y Cajal used the Golgi staining method to visualize individual neurons in the cerebellum of a pigeon in 1899. This method permitted Ramón y Cajal to visualize individual neurons in the brain; the tissue is densely packed with neurons but the Golgi stain only labels sparse neurons in the tissue. The postsynaptic compartment of excitatory synapses consists of a spiny protuberance from the dendrite, called a spine. Ramón y Cajal detected these spines in neurons (here in the Purkinje neurons of the cerebellum). In modern-day approaches, fluorescent proteins can be delivered using a microelectrode or expressed genetically to allow visualization of a single neuron in tissue. (b) A fluorescent dye is delivered to the cell body of a single Purkinje neuron in mouse cerebellum by a microelectrode (right) and is visualized by two-photon microscopy. The fluorescence is yellow in the cell body and orange-red in the dendrites. At higher resolution, we can image spine dynamics using time-lapse microscopy and in this way directly demonstrate changes in synaptic connectivity with experience. In this image, a second, larger electrode (left) filled with a red fluorescent dye (with yellow precipitates within the electrode) is used to electrically stimulate synapses forming onto the labeled neurons. Decades of research have largely validated Ramón y Cajal’s predictions, although memories are now thought to be stored primarily as changes in the synapses (“flowers and fruit”) rather than by changes in dendrites and
axons (“branches”). Studies of the gill-withdrawal reflex in the sea slug Aplysia californica provide a classic demonstration of the structural basis of memory storage (Figure 23-42). Aplysia californica is a useful model organism for studying the cell biology of memory because its nervous system is relatively simple and its neurons are very large and identifiable, which means that the same neuron can be identified from one animal to another. These features allowed Nobel laureate Eric Kandel and his colleagues to delineate the neural circuitry underlying specific behaviors in the animal and to then determine how the synaptic connections between neurons in this circuit changed during memory formation. They focused on a simple reflexive behavior, the siphon gill-withdrawal reflex, in which touching the animal’s siphon (a tubelike anatomical structure through which water flows) leads to a defensive withdrawal of its respiratory organ, the gill. Sensory neurons from the siphon that synapse onto motor neurons to the gill mediate the reflex. Touching the siphon triggers firing of the sensory neuron, which triggers an action potential in the motor neuron, which in turn synapses on the gill muscle and causes it to contract. The reflex can be either strengthened or weakened by experience. Repeated touching of the siphon leads to a decrease in the amplitude of the gill-withdrawal reflex, called habituation. In contrast, presentation of a noxious stimulus like delivery of an electric shock to the tail leads to an increase in the amplitude of the gill-withdrawal reflex, called sensitization. Sensitization can be thought of as a form of fear learning. Habituation and sensitization can be transient or long lasting, depending on the strength and duration of the stimulus. Long-lasting forms of habituation and sensitization were found to involve dramatic decreases and increases, respectively, in the number of connections that formed
between sensory and motor neurons. In this way, just as Ramón y Cajal predicted, the animal’s experience changed the wiring of its nervous system, thereby encoding a memory and changing the animal’s behavior.
FIGURE 23-42 Long-term memories are stored as changes in synaptic connectivity. (a) The sea slug Aplysia californica is a model system for studying the cell biology of synaptic
The Hippocampus Is Required for Memory Formation
plasticity and memory. Tactile stimulation of the siphon (a tubelike structure through which water flows) stimulates the gill-withdrawal reflex. In habituation, the siphon is repeatedly touched, which habituates the animal to this stimulation and reduces the amplitude of the gill withdrawal. In sensitization, the animal receives a noxious stimulus like a tail shock, which sensitizes the reflex so that the gill-withdrawal amplitude is enhanced. (b) Threedimensional reconstructions of siphon sensory neurons from control animals and from animals that have undergone long-term sensitization of the gill-withdrawal reflex. Notice the expansion of the sensory neuron branches after sensitization. The growth of neuronal processes is accompanied by a growth of new synaptic connections between the sensory and motor neurons. (c) Illustrations showing the changes in connectivity that occur during plasticity of the gill-withdrawal reflex. Sensitization is accompanied by the growth of new connections between the sensory and motor neuron, while habituation is accompanied by a decrease in the number of connections between the sensory and motor neuron. [Part (b) from C. H. Bailey and M. Chen, 1988, “Long-Term Memory in Aplysia Modulates the Total Number of Varicosities of Single Identified Sensory Neurons,” Proc. Nat’l Acad. Sci. USA 85:2373–2377.] Description The illustration labeled (a) shows the structure of a sea slug with labels mantle shelf, gill, and siphon. A rod, labeled tactile stimulus, stimulates the siphon. The illustration labeled (b) shows two stereological images of control and sensitized neurons. The sensitized neuron has many dendrites compared to the control neuron. The illustration labeled (c) shows a panel that interprets the experimental evidence and shows the interactions of sensory neurons with motor neurons. In the control case, the sensory neuron has two dendrites; in the sensitized case, three; and in the habituated case, one. The Hippocampus Is Required for Memory Formation
Studies in Aplysia and in other model organisms, including Drosophila and mice, have begun to reveal many of the molecular mechanisms underlying experience-dependent synaptic plasticity. Clinical studies in humans as well as experimental studies in animals have shown that the hippocampus is required for the formation of long-term memories. Humans and animals with lesions in their hippocampus can form shortterm memories and maintain their old memories but are no longer able to form new long-term memories. Not only is the hippocampus critical for long-term memory formation, but its anatomy also makes it especially suitable for electrophysiological studies of synaptic connectivity. As shown in Figure 23-43, the hippocampus consists of three sequential pathways (perforant, mossy fiber, and Schaffer collateral pathways), each with discrete cell-body layers and axonal and dendritic projections. Highfrequency stimulation of the axons of presynaptic neurons in each of these pathways produces a long-lasting strengthening of the connections onto the postsynaptic neurons, called long-term potentiation (LTP), while lowfrequency stimulation produces a long-lasting weakening of the connections, called long-term depression (LTD).
FIGURE 23-43 Synaptic plasticity in the mouse hippocampus: long-term potentiation (LTP) and long-term depression (LTD), and roles for regulated trafficking of AMPA glutamate receptors. (a) The mouse hippocampus can be dissected from mouse brain cut into transverse slices, preserving the three sequential synaptic pathways, from the entorhinal cortex (not shown) to the dentate gyrus (DG), the DG to CA3, and CA3 to CA1. Electrodes can be used to stimulate axonal afferents and record from postsynaptic follower cells, as illustrated for the Schaffer collateral (CA3-CA1) pathway. (b) Trains of low-frequency stimulation or high-frequency stimulation to the axonal fibers produce sustained decreases or increases in synaptic strength, which are measured as the postsynaptic response to a test stimulus. These tracings show the strength of the synaptic connection on the y axis, with time on the x axis. The dotted line shows the baseline strength of the connections, which are decreased by low-frequency stimulation and increased by high-frequency stimulation. These forms of plasticity are known as long-term depression (LTD) and long-term potentiation (LTP). (c) In the basal state, AMPA receptors (black) traffic constitutively to and from the plasma membrane of the postsynaptic compartment via recycling endosomes. Receptors are delivered to the plasma membrane lateral to the postsynaptic density via exocytosis and are internalized by clathrin-mediated endocytosis into recycling endosomes. In the postsynaptic density, the AMPA receptors are stabilized by interactions with proteins,
including transmembrane AMPA receptor regulatory proteins (TARPS, not shown). Following induction of LTD of glutamatergic synapses, there is an increase in the diffusion of AMPA receptors out of the postsynaptic density and in their internalization into recycling endosomes. This results in a decrease in the number of AMPA receptors on the postsynaptic membrane and a decrease in the postsynaptic response to a given amount of glutamate release from the presynaptic neuron. Following induction of LTP at glutamatergic synapses, there is an increase in the exocytosis of AMPA receptors and an increase in their diffusion into the postsynaptic density. This results in an increase in the number of AMPA receptors on the postsynaptic membrane and an increase in the postsynaptic response to a given amount of glutamate release from the presynaptic neuron. Regulated trafficking of AMPA receptors provides one molecular mechanism underlying the activity-dependent changes in synaptic strength that accompany synaptic plasticity and memory. See V. M. Ho, J.-A. Lee, and K. C. Martin, 2011, Science 334:623−628; and J. D. Shepherd and R. L. Huganir, 2007, Annu. Rev. Cell Dev. Bi. 23:613−643. Description An illustration labeled (a) shows a mouse hippocampus with three synaptic pathways; perforant pathway, mossy fiber pathway, and Schaffer collateral pathway. A stimulating electrode and a recording electrode interacts with the C A 1 pyramidal neurons in the Schaffer collateral pathway at the top of the structure. In the graphs labeled (b), the horizontal axes represent time ranging from minus 10 to 60 in increments of 10. The vertical axes represent synaptic response ranging from 0 to 2 in increments of 0.5. A dotted line indicates the control response. The line, drawn at one on the vertical axis, is flat and does not vary over the whole period. In long-term depression, on the application of a low-frequency stimulus, the synaptic response falls always to around 0.5 on the vertical axis, remains at this value for the remainder of the period. In contrast, in long-term potentiation, the synaptic response rises on the application of a high-frequency stimulus, reaching about 1.7 on the vertical axis, and gradually increasing to 2 over the remaining period. The illustration labeled (c) shows pre and post-synaptic nerve terminal in the basal state, long-term depression, and long-term potentiation. In the basal state, five A M P A receptors are in Y shapes are along with the postsynaptic nerve terminal. Recycling of endosome by endocytosis and exocytosis process takes place in the post-synaptic nerve
Multiple Molecular Mechanisms Contribute to Synaptic Plasticity
terminal. Three red dots in the white circle of the presynaptic nerve terminal are labeled glutamate. In the long-term depression, there are only 3 A M P A receptors with glutamate. In long-term potentiation, the 7 receptors take up almost all of the glutamate red dots. While a multitude of studies have shown correlations between LTP, LTD, and memory, more recent optogenetic studies succeeded in demonstrating a causal role for synaptic plasticity in producing memories. To do this, the investigators expressed channelrhodopsin in hippocampal neurons in mice and stimulated the neurons with light to induce LTP. Induction of LTP caused the mice to acquire a false memory in which they demonstrated fear to an environment even though they had never encountered a frightening stimulus in that environment! Multiple Molecular Mechanisms Contribute to Synaptic Plasticity In considering how experience can change synaptic strength, it is useful to think about the structure of the chemical synapse and the process of synaptic transmission described in Section 23.3. Long-lasting changes in plasticity have been shown to involve presynaptic changes in neurotransmitter release, trans-synaptic adhesion, and postsynaptic responses to neurotransmitter. We will briefly touch on pre- and transsynaptic mechanisms and then delve into slightly more detail on postsynaptic mechanisms, which have been studied in greater depth.
Experiences that stimulate hippocampal neurons trigger elevations in intracellular calcium, which in turn activates kinases that phosphorylate synapsins, the molecules that organize synaptic vesicles into discrete pools within the presynaptic compartment. This phosphorylation of synapsins increases the number of synaptic vesicles available for release, thereby increasing the amount of neurotransmitter that is released with a given stimulus. Experience also activates kinases that phosphorylate RIM, the molecule that tethers voltage-gated channels to the release machinery, and this phosphorylation is required for LTP of hippocampal synapses. Synaptic plasticity also depends on activation of kinases in the postsynaptic compartment. Influx of through voltage-gated channels and specific glutamate receptors in the postsynaptic membrane activates one particularly important kinase, the calcium-calmodulindependent kinase IIα (CaMKIIα; see Chapter 15 for discussion of calcium calmodulin signaling). This kinase has the special property that once activated, it can remain persistently activated even in the absence of stimulation. This is because once activated, CaMKIIα autophosphorylates itself, which renders it constitutively active for about 30 minutes, during which time the kinase phosphorylates many substrates in the postsynaptic compartment, including glutamate receptors. Mice lacking CaMKIIα have deficits in both LTP in the hippocampus and in memory formation. As discussed in Chapter 15, the sensitivity of a cell to external signals is determined by the number of surface receptors. In line with this concept, one of the best characterized mechanisms underlying synaptic plasticity
involves activity-dependent changes in the number of glutamate receptors that are present in the postsynaptic membrane. This process has been especially well studied in the context of hippocampal LTP and LTD (Figure 23-43c). One of the major classes of glutamate receptors, called AMPA receptors, traffic constitutively to and from the plasma membrane via recycling endosomes. AMPA receptors are delivered by exocytosis at extrasynaptic sites and then laterally diffuse into the postsynaptic density, the protein-dense region of the postsynaptic site that faces the synaptic cleft and thus receives neurotransmitters released by the presynaptic terminal. AMPA receptors are removed by endocytosis, which occurs when the receptors diffuse laterally to extrasynaptic sites and are then internalized by clathrin-mediated, dynamin-dependent endocytosis. While AMPA receptor trafficking occurs under basal conditions, it is modulated by activity through changes in actin and myosin dynamics as well as AMPA receptor interactions with scaffolding proteins and accessory subunits. One of these accessory subunits, Stargazin, mediates the interaction between AMPA receptors and the postsynaptic density protein PSD95. This interaction is critical to the localization of AMPA receptors at the synapse, since interaction with PSD95 stabilizes AMPA receptor localization within the postsynaptic density. Activity causes the phosphorylation of Stargazin, decreasing the mobility of AMPA receptors and increasing their concentrations at the synapse. Blocking Stargazin phosphorylation or de-phosphorylation blocks hippocampal LTP and LTD, respectively. Stargazin is one of a family of transmembrane AMPA receptor regulatory proteins (TARPs). TARPs bind to all AMPA receptor
Formation of Long-Term Memories Requires Gene Expression
subunits, are differentially expressed throughout the brain, and mediate the delivery of AMPA receptors to the surface and synapse of neurons. Formation of Long-Term Memories Requires Gene Expression The mechanisms described above are especially important for short-term forms of plasticity that underlie short-term memories. While the formation of short-term plasticity, and short-term memory, have been shown to rely on modifications of preexisting proteins at the synapse, the formation of long-term memories differs in that it depends upon new gene expression. This can be thought of in the context of the different effects of extracellular stimulation that were discussed in Chapter 15: stimuli can produce short-term changes by altering the activity of preexisting enzymes and proteins in the cell, or long-term functional changes by altering the expression of genes in the cell (see Figure 15-3). Studies in many systems and species, including in rodent hippocampus, have demonstrated that LTP and LTD can be divided into transient forms of plasticity that do not require gene expression and long-lasting forms (L-LTP and L-LTD) that require both mRNA and protein synthesis. The extreme morphological polarity and compartmentalization of neurons adds significant challenges to stimulus-induced changes in gene expression. First, to turn on transcription, signals must be relayed to the nucleus from the synapse, which in many cases is located at great distances from the cell body. Neurons are specialized for rapid signaling
between compartments by electrical signaling. However, many studies have also shown that signaling molecules, including kinases, phosphatases, and transcriptional regulators, are actively transported from stimulated synapses to the nucleus to regulate transcription. In most cases, this long-distance retrograde transport has been shown to involve dynein motor protein–mediated transport along microtubules (as described in
Chapter 18). How signaling is faithfully maintained during this longdistance transport in order to couple synaptic stimulation with gene expression is an area of active research. The second great challenge in understanding the mechanism of stimulusinduced gene expression during synaptic plasticity derives from the fact that each neuron has a single nucleus and yet can form thousands of synapses. Long-lasting forms of synaptic plasticity are often synapsespecific, that is, they involve changes in synaptic strength at some but not all synapses formed by a single neuron. Since long-term plasticity requires transcription, synapse specificity begs the question of how gene expression can be spatially regulated in such a highly compartmentalized cell. One important mechanism involves the localization of mRNAs and their local translation in response to synaptic stimulation, as was discussed in Chapter 9. Indeed, L-LTP of hippocampal synapses has been shown to require the translation of mRNAs that are localized in dendrites and at synapses. Electron micrographic studies have identified polyribosomes, actively translating ribosomes, at the base of spines in hippocampal neurons and have further shown that the number of spines controlling polyribosomes greatly increases after induction of L-LTP. Together, these studies have focused attention on the importance of post-transcriptional
gene regulation in neurons during synaptic plasticity and on a host of questions about mRNA localization and regulated translation: What mRNAs are localized to synapses? How are they localized? How is their translation regulated by synaptic activity? What is the specific function of the locally translated protein? Why are some mRNAs translated into protein in the neuronal cell body and then transported to synapses, and others translated directly at synapses? Indicative of the importance of post-transcriptional gene regulation in the proper functioning of the nervous system, mutations in an RNAbinding protein, the fragile X mental retardation protein, FMRP, cause a common form of mental retardation, fragile X syndrome (FXS). Mutations in the gene encoding FMRP, the fmr1 gene, constitute the most common single-gene cause of autism. The most common mutations that lead to FXS are expansions of CGG repeats in the fmr1 gene that leads to gene methylation and silencing, as was described for Huntington’s disease in
Chapter 6. FMRP is a translational repressor that binds target mRNA and prevents its translation. A population of FMRP localizes to the base of dendritic spines, where it is thought to maintain mRNAs in a dormant state until synaptic stimulation triggers their translation. Genetically modified mice that lack FMRP serve as remarkably good models for the human disease. The mice show deficits in learning, reflective of the intellectual disability in FXS patients. Both mice and humans have abnormalities in the structure of their synaptic spines, which are elongated, like immature spines, rather than stubby, like mature spines. Studies in the mouse have revealed excessive basal translation of mRNAs at synapses and have
further shown alterations in protein-synthesis-dependent forms of hippocampal LTD. Together, these findings indicate that synaptic translation of localized mRNAs is critical to the formation and the experience-dependent plasticity of neural circuits and that alterations in this process are a cause of neurodevelopmental and cognitive disorders. KEY CONCEPTS OF SECTION 23.5 Forming and Storing Memories Experience changes the number and strength of connections between neurons in the brain through a process known as synaptic plasticity. Synaptic plasticity provides a biological basis for the formation and storage of memories. Studies of habituation and sensitization demonstrate that learning produces changes in synaptic connectivity. Experiments looking at the gill-withdrawal reflex in marine mollusk Aplysia californica show that habituation involves decreases in the connectivity of the sensory and motor neurons that give rise to the gill-withdrawal reflex, while sensitization involves increases in sensory-motor connectivity (see
Figure 23-42). The hippocampus is a region of the brain that is required for the formation of longlasting memories (see Figure 23-43). Hippocampal synapses undergo activitydependent forms of synaptic strengthening called long-term potentiation (LTP) and activity-dependent forms of synaptic weakening called long-term depression (LTD). Changes in synaptic strength can be mediated by presynaptic, trans-synaptic, or postsynaptic mechanisms. Activity generates a constitutively active form of CaMKIIα in the postsynaptic compartment, which phosphorylates substrates in the postsynaptic density, including glutamate receptors, leading to changes in synaptic strength. Activity regulates the trafficking of AMPA glutamate receptors in the postsynaptic membrane. LTP is accompanied by an increase in insertion of AMPA receptors in the postsynaptic density, while LTD is accompanied by a decrease in the concentration of AMPA receptors in the postsynaptic density (see Figure 23-43c). Short-term forms of synaptic plasticity involve modifications of preexisting proteins at the synapses, but long-term forms require new mRNA and protein synthesis. Synapse-specific forms of plasticity involve the local translation of synaptically localized mRNAs.
Fragile X syndrome is caused by null mutations in the gene encoding the RNAbinding protein FMRP. FMRP regulates local translation at synapses. Mice lacking FMRP have abnormal synapses and exhibit learning impairments and deficits in hippocampal LTD.
Key Terms
End of Chapter Visit Achieve to access study tools and to learn more about the content of this chapter: Perspectives for the Future Analyze the Data Chapter References Additional study tools, including videos, animations, and quizzes Key Terms acetylcholine action potential afferent neurons Agrin astrocytes axon dendrites depolarization efferent neurons endocytosis excitatory receptor excitatory synapse glial cells glomeruli
hippocampus hyperpolarization inhibitory receptor inhibitory synapse interneurons mechanosensors membrane potential motor neurons MuSK myelin sheath nervous system neuromuscular junction (NMJ) neurons neurotransmitter nociceptors node of Ranvier (node) odorants olfactory receptors oligodendrocytes optogenetics refractory period repolarization saltatory conduction Schwann cells sensory neurons SM proteins SNAREs synapse elimination
Review the Concepts
synapses synaptic plasticity synaptic vesicles tastants taste receptors voltage-gated channels Review the Concepts 1. What is the role of glial cells in the brain and other parts of the nervous system? 2. The resting potential of a neuron is approximately −70 mV inside compared with outside the cell. How is the resting potential maintained in animal cells? 3. Name the three phases of an action potential. Describe for each the underlying molecular basis and the ion involved. Why is the term “voltage-gated channel” applied to channels involved in the generation of an action potential? 4. Explain how the crystal structures of potassium ion channels suggest the way in which the voltage-sensing domains interact with other parts of the proteins to open and close the ion channels. How does this structure-function relationship apply to other voltage-gated ion channels? 5. Explain why the strength of an action potential doesn’t decrease as it travels down an axon. 6. Explain why the membrane potential does not continue to increase but rather plateaus and then decreases during the course
of an action potential. 7. What does it mean to say that action potentials are “all or none”? 8. What prevents a nerve signal from traveling “backward” toward the cell body? 9. Why is the cell unable to initiate another action potential if stimulated during the refractory period? 10. Myelination increases the velocity of action potential propagation along an axon. What is myelination? Myelination causes clustering of voltage-gated channels and pumps at nodes of Ranvier along the axon. Predict the consequences to action potential propagation of increasing the spacing between nodes of Ranvier by a factor of 10. 11. Describe the mechanism of action for addictive drugs such as cocaine. 12. Acetylcholine is a common neurotransmitter released at the synapse. Predict the consequences for muscle activation of decreased acetylcholine esterase activity at nerve-muscle synapses. 13. Describe the ion dynamics of the muscle-contraction process. 14. Following the arrival of an action potential in stimulated cells, synaptic vesicles rapidly fuse with the presynaptic membrane. This happens in less than 1 ms. What mechanisms allow this process to take place at such great speed? 15. Neurons, particularly those in the brain, receive multiple excitatory and inhibitory signals. What is the name of the extension of the neuron at which such signals are received? How does the neuron integrate these signals to determine whether or not to generate an action potential?
16. Explain the mechanism by which action potentials are prevented from being propagated to a postsynaptic cell if transmitted across an inhibitory synapse. 17. What is the role of dynamin in recycling synaptic vesicles? What evidence supports this? 18. Compare and contrast electrical and chemical synapses. 19. Compare the structures and functions of the receptor molecules for salty and sour taste; the taste-receptor molecules for sweetness, bitterness, and umami; and odor-receptor molecules. 20. Describe a synaptic mechanism underlying the formation of memory.