Chapter introduction
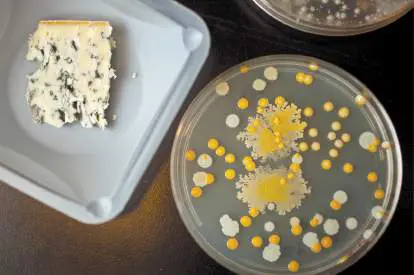
Colonies of bacteria and fungi grown in a Petri dish were cultivated from a blue cheese produced at Jasper Hill Farm in Greensboro, Vermont. Cheese is a product of microbial catabolism, the breakdown of complex food molecules to yield energy for cell processes.
Erik Jacobs/ The New York Times /Redux
All living organisms require energy. Microbes obtain energy from an astonishing range of reactions—photosynthesis, eating plastic, even conducting electrons to rocks. The energy source most familiar to us is catabolism, the step-by-step process of breaking down complex molecules into smaller ones. Microbes catabolize plant and animal biomass in the soil and water all around us. We can use microbial catabolism to make fermented foods and to remediate hazardous wastes. Within our own digestive tract, microbial communities The processes of catabolism generate intermediate organic molecules and products called catabolites. Microbial catabolites can have surprising functions for a host organism. Most remarkably, our digestive microbes release catabolites that serve our body as Chapter 13 explains how energy-yielding reactions enable microbes to transform energy to drive the cell. To go forward, reactions require a negative free energy change. And, in order to proceed quickly enough to sustain the processes of life, reactions within a cell require enzyme catalysis. These requirements apply to all processes, including catabolism, lithotrophy, and phototrophy. Sections 13.3–13.6 explore diverse kinds of microbial catabolism, while lithotrophy and phototrophy are explained in Chapter 14.
13.1 Energy for LifeUnit 4 · Metabolism
Every form of life, from a microbe to a human body, uses energy (as introduced in Chapter 4
). Energy is the ability to do work, such as flagellar propulsion or cell growth. Energy is used
to organize proteins, maintain ion gradients, and build biomass. To conduct all these
processes, life needs to perform reactions that store chemical energy and control how the
energy is spent.
A growing cell builds complexity, and thus decreases its entropy, or disorder. But the
decrease in entropy is local to the cell. Ultimately, the cell’s energy must be spent as heat.
Heat radiates away, causing entropy to increase overall. In other words, the local,
temporary gain of energy enables a cell to grow. Continued growth requires continual gain
of energy and continual radiation of heat. We see this release of heat, for example, in a
compost pile, where bacteria, archaea, and fungi obtain energy by respiring on organic
plant scraps (Fig. 13.1 ). The microbial processes release heat faster than the heat can
dissipate from the pile, and the compost temperature typically rises from 20°C to 60°C. Too
high a temperature in compost can actually cause spontaneous combustion (fire).
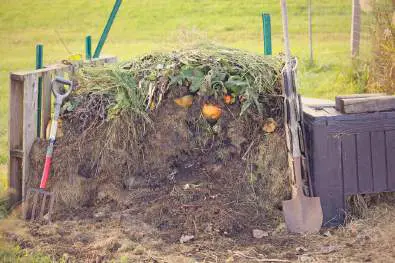
FIGURE 13.1 ■ Compost pile. Vegetable matter is broken down by worms and
insects and by microbial catabolism. Catabolism yields energy for growth but also
releases heat, increasing the temperature of the compost. Inset: Bacillus subtilis
catabolize plant biomass (heterotrophy).
LONNY GARRIS/SHUTTERSTOCK
DENNIS KUNKEL MICROSCOPY/SCIENCE SOURCE
Throughout Earth’s biosphere, the total metabolism of all life dissipates energy as heat.
Biological heat production is not always obvious, because soil and water provide a
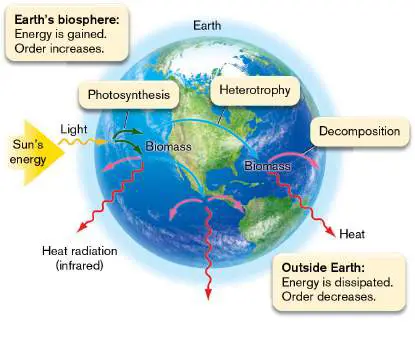
tremendous heat sink. But overall, Earth’s biosphere behaves as a giant thermal reactor (
Fig. 13.2 ). As solar radiation reaches Earth, a small fraction is captured by photosynthetic
microbes and plants. The fraction captured is largely in the range of visible light, the
wavelengths at which photon energies can be absorbed for the controlled formation and
dissociation of molecular bonds. At shorter wavelengths (X-rays), chemical bonds are
broken indiscriminately; at longer wavelengths (microwaves and radio waves), the quantum
energy is too low to drive chemical reactions.
FIGURE 13.2 ■ Solar energy. Solar radiation reaches Earth, where a small fraction
is captured by photosynthetic microbes and plants. The microbial and plant biomass
enters heterotrophs and decomposers, which convert a small fraction to biomass at
each successive level. At each level, the majority of energy is lost, radiated from Earth
as heat.
Microbial and plant photosynthesis generates biomass, which is catabolized by
consumers and decomposers. The consumers store a small fraction of their energy in
biomass. At each successive trophic level (consumers eating others), the majority of the
energy is lost and radiated from Earth as heat. Thus, despite the growth of living organisms
on Earth, the universe as a whole becomes more disordered. The complex roles of microbial
metabolism in global ecosystems are discussed in Chapters 21 and 22.
Of special importance to humans and other animals, our digestive organs
support vast communities of microbes (our gut microbiome) that digest much of
the food we eat. Gut bacteria digest a wide range of polysaccharides (or glycans) made by
plants, as well as host-derived glycans such as those found in breast milk. Breaking down
complex foods by reactions that yield energy is called catabolism. Many of our gut
microbes catabolize food molecules using enzymes that our bodies don’t have—thus
extending the repertoire of our genome. Surprisingly, bacterial waste products may become
valuable parts of our bodies, even neurotransmitters that control our brains (discussed in
Section 13.5). The gut-brain axis is an exciting product of bacterial energy-yielding
catabolism.
Note: For a review of molecular structure and biochemical reactions, see eAppendix 1. Many Sources of Energy
Collectively, microbes use diverse energy sources, many of which multicellular organisms
cannot use (Table 13.1 ). Recall from Chapter 4 that an organism may gain energy from
chemical rearrangement of molecules (prefix “chemo-”) or from light absorption (prefix
“photo-”).
TABLE Energy Acquisition in Bacteria and Archaea 13.1
Energy Class of metabolism Examples of Electron Systems for
source energy- acceptor energy
yielding acquisition
reactions
CHEMICAL
Chemo Fermentation C 6 H 12 O 6 Organic Glycolysis and
organo → 2C 3 H 6 O other catabolism
trophy Catabolism (or other
3
Organic small
compounds molecules)
(at least one
C–C bond)
donate
electrons
TABLE Energy Acquisition in Bacteria and Archaea 13.1
Organic respiration C 6 H 12 O 6 + O 2 Glycolysis and
6H 2 O + 6O other catabolism,
Catabolism with → 6CO + TCA cycle, and
inorganic electron 2 2 electron transport
acceptor, or with small 12H 2 O systems
organic electron
acceptor
C 6 H 12 O 6 + NO 3 −,
6H 2 O + SO 4 2−,
12NO 3 − → Fe 3+, or
6CO 2 + 12H other
2 O + 12NO 2
−
Chemo litho Lithotrophy or Electron O 2, NO 3 Electron transport
trophy chemolithoautotrophy donor for −, or system
respiration is other
Inorganic CO 2 fixation H 2, Fe 2+,
compounds H S, NH +
donate 2 4
electrons
Methanogenesis Electron CO 2 Methanogenesis
donor is H 2:
CO 2 + 4H 2
→ CH 4 + 2H
2 O
LIGHT
Phototrophy Photoautotrophy Photolysis of CO 2 Photosystems I
H 2 O: and II
Light Light absorption drives
absorption CO 2 fixation
TABLE Energy Acquisition in Bacteria and Archaea 13.1
excites 6CO 2 + 12H
electrons 2 O → C 6 H
12 O 6 + 6H 2
O + 6O 2
Photolysis of CO 2 Photosystem I or
H 2 S, HS −, II
or Fe 2+:
6CO 2 + 12H
2 S → C 6 H
12 O 6 + 6H 2
O + 12S
Photoheterotrophy Photolysis of Organic Photosystem I or
H 2 S, HS −, II;
Light absorption without or light- bacteriorhodopsin
CO 2 fixation driven H + or
pump. proteorhodopsin
Usually
supplements
organotrophy.
Chemotrophy yields energy from electron transfer between chemicals, releasing
products that are more stable. Chemotrophy in which organic compounds donate electrons
to yield energy is known as organo trophy or chemo organo trophy. Organic compounds
include the foods we eat—which our intestinal bacteria help catabolize. Most organotrophs
are also heterotrophs, organisms that use preformed organic compounds for biosynthesis (a
process called heterotrophy). But chemotrophy also includes litho trophy or chemo litho
trophy (literally “rock eating”), obtaining energy from inorganic reactions. For example, the
archaeon Pyrodictium occultum gains energy by oxidizing hydrogen gas with sulfur.
Phototrophy yields energy from light absorption. Phototrophs such as marine
cyanobacteria are autotrophs (build their own carbon compounds). A photoautotroph gains
energy solely from light and builds biomass solely from CO 2. Other bacteria, such as purple
proteobacteria, practice photoheterotrophy, in which energy from light supplements
chemotrophy. Phototrophy and lithotrophy are discussed in Chapter 14.
But all sources of energy pose the challenges of how to obtain the energy, how to avoid
losing it, and how to convert it for cell growth and function. The principles of energy
change, discussed next, apply to all the reactions of Table 13.1 . These reactions are
covered in detail in Chapters 13 and 14. The use of energy to build cells is then addressed
in Chapter 15.
Note: Distinguish the following prefixes for “-trophy” terms.
Carbon source for biomass:
Auto-: CO 2 is fixed and assembled into organic molecules.
Hetero-: Preformed organic molecules are acquired from outside and assembled into
new organic molecules.
Energy source:
Photo-: Light absorption captures energy.
Chemo-: Chemical reactions yield energy without absorbing light.
Electron source:
Litho-: Inorganic molecules donate electrons.
Organo-: Organic molecules donate electrons.
Gibbs Free Energy Change
Table 13.1 shows that microbes can use an enormous variety of energy-yielding chemical
reactions. But what determines whether a given reaction can support life?
Gibbs free energy change (Δ G). To provide energy to a cell, a biochemical reaction
must go forward from reactants to products. The direction of a reaction can be predicted by
a thermodynamic quantity known as the Gibbs free energy change, Δ G (also known as free
energy change or Gibbs energy change). The Δ G value of a reaction determines how much
energy is potentially available to do work, such as to drive rotary flagella, to build a cell
wall, or to store accurate information in DNA. The sign of the free energy change, Δ G,
determines whether a process may go forward. If Δ G is negative, the process may go
forward, whereas positive values mean that the reaction will go in reverse. The sign of Δ G
determines which “foods” a microbe can eat or, more precisely, which reactions between
available molecules can yield energy for microbial growth.
Δ G includes enthalpy and entropy. The free energy change Δ G has two components:
Δ H = change in enthalpy, the heat energy absorbed or released as reactants become
products at constant pressure. When reactants absorb heat from their surroundings as
they convert to products, Δ H is positive. When, instead, heat energy is released, Δ H is
negative. Release of heat (negative value of Δ H) can yield energy for the cell to use.
An example of a reaction with strongly negative Δ H is the oxidation of glucose by O 2.
Δ S = change in entropy, or disorder. Entropy is based on the number of states of a
system, such as the number of possible conformations of a molecule. If a cellular
reaction splits one molecule into two, all else being equal, entropy increases; the
system is more disordered, and Δ S is positive. Most catabolic reactions have a positive
value of entropy change. A positive value of Δ S makes Δ G more negative and
increases the potential energy yield of a reaction.
The relationship of the free energy change Δ G with Δ H and Δ S is given by:
Δ G = Δ H − T Δ S
The overall sign of Δ G depends on its two components: Δ H (the absorption or release
of heat energy) and − T Δ S [the negative product of entropy change (Δ S) and
temperature (T)]. In living organisms, a sufficiently negative Δ H (energy lost as heat)
often overrides − T Δ S, the term for increase in order (negative value of Δ S, positive
value of − T Δ S). Thus, a living organism, whose development entails increasing order and
decreasing Δ S, can grow as long as the sum of its metabolism has a sufficiently negative
value of Δ H. The heat loss associated with Δ H is obvious in a compost pile, where
temperature rises. Similarly, all living organisms and communities lose heat.
Negative Δ G Drives a Reaction Forward
An example of a thermodynamically favored reaction is the oxidation of hydrogen gas (H 2)
to form water. Hydrogen is oxidized for energy by many kinds of bacteria in soil and water
(a form of lithotrophy discussed in Chapter 14). For example, hydrogenotrophic bacteria of
the genus Ralstonia have been isolated from ultrapure water used for nuclear fuel storage,
where radioisotopes emit particles that ionize water, generating H 2. The chemical reaction
of dissolved hydrogen and oxygen gases is:
2H 2 + O 2 → 2H 2 O
In this reaction, two molecules of hydrogen gas donate four electrons to oxygen, forming
water. Under conditions of standard temperature (298 kelvins, or K) and pressure (1 atm),
Δ H = −572 kilojoules per mole (kJ/mol). The Δ H is strongly negative (much heat is
released) because the bonds of the product H 2 O are much more stable than those of the
substrates, H 2 and O 2.
However, entropy decreases because the three molecules are replaced by two—a more
ordered state. Thus, Δ S is negative: −0.327 kJ/(mol · K). In the Gibbs equation, the
negative sign on the entropy term − T Δ S makes its contribution to Δ G positive—
unfavorable for reaction. So which term wins: Δ H or − T Δ S?
Δ G = Δ H – T Δ S
= −572 kJ/mol − (298 K) [−0.327 kJ/(mol · K)]
= −572 kJ/mol + 97 kJ/mol
= −475 kJ/mol
Overall, Δ G is negative. So bacteria with the appropriate enzyme pathways can use the
reaction of hydrogen gas with oxygen to yield energy.
Note: The joule (J) is the standard SI unit to denote energy. 1 kilojoule (kJ) = 1,000
joules. Another unit commonly used is the kilocalorie (kcal). The conversion factor is: 1 kJ =
0.239 kcal.
Enthalpy and Entropy in Metabolism
How do Δ H and − T Δ S affect biochemical reactions? Each reaction in a living cell is
associated with these two types of energy change, but to differing degrees, depending on
the reaction. In general, a reaction yields energy for the cell if:
Molecular stability increases. When reactants combine to form products with more
stable bonds, the reaction has a negative Δ H. For example, the reaction of a sugar
with oxygen has a negative Δ H because the relatively unstable oxygen molecules are
reduced to H 2 O.
Entropy increases. Reactions in which a complex molecule is broken down to a
greater number of smaller molecules increase entropy (positive Δ S, negative value of
− T Δ S). An important class of such product molecules is carboxylic acids, such as
lactic acid, in which a H + dissociates from a carboxylate ion (R–COO −). Entropy also
increases with conversion of a solid reactant to a gas, such as CO 2. For example,
glucose may be fermented to ethanol and CO 2, as in the production of alcoholic
beverages.
The relative contributions of Δ H and − T Δ S are important because they determine the
effect of temperature on microbial growth. Δ H -dependent reactions such as glucose
oxidation release a lot of heat, causing, for example, the rise in temperature of an aerated
compost pile. Such a reaction is called exo thermic; that is, releasing heat.
By contrast, the entropy component of Gibbs energy, − T Δ S, does not include heat
loss. The magnitude of − T Δ S grows larger as temperature increases. Could an organism’s
metabolism be driven by a large entropy change − T Δ S with a smaller positive Δ H value?
The positive Δ H would make such a reaction endo thermic; that is, absorbing heat.
Could an organism conduct endothermic metabolism that actually cools its environment?
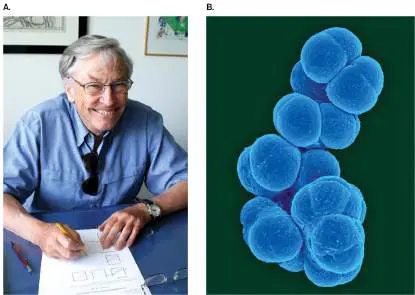
This question was addressed by Urs von Stockar (Fig. 13.3A ), now at the University of
Lausanne, Switzerland. Von Stockar was a founder of the study of biological
thermodynamics. He predicted the existence of entropy-driven metabolism that absorbs
heat, thus cooling its environment. He discovered an example, the conversion of acetate to
methane and CO 2, which is conducted by the soil archaeon Methanosarcina barkeri (Fig.
13.3B ):
CH 3 COOH → CH 4 + CO 2
FIGURE 13.3 ■ Methanosarcina barkeri converts acetic acid to methane
and CO 2. A. Urs von Stockar showed that M. barkeri metabolism cools its
surroundings. B. Methanosarcina barkeri, a coccoid archaeon that converts acetic acid
to CH 4 and CO 2.
COURTESY OF URS VON STOCKAR, UNIVERSITY OF LAUSANNE
DENNIS KUNKEL MIRCOSCOPY/SCIENCE SOURCE
The conversion of solid acetic acid into two gases incurs a tremendous increase in
entropy, Δ S, which makes the free energy change more negative (− T Δ S). But the sign
of Δ H is positive; thus the organism actually absorbs heat from its soil environment.
Despite the positive Δ H, the larger magnitude of the entropy change − T Δ S allows the
reaction to proceed, yielding net free energy.
How do we measure Δ G and its components, Δ H and − T Δ S? The amount of energy
released by a reaction is measured in an instrument called a calorimeter. A calorimeter
may be designed to measure thermal energy (heat) released by a reaction of chemicals in a
test tube. In a calorimeter, the release of heat during a reaction (or collection of reactions)
maintained at constant temperature gives a measure of Δ H. This measurement is called
isothermal calorimetry.
Because living organisms consist of chemical reactions, calorimetry can measure the
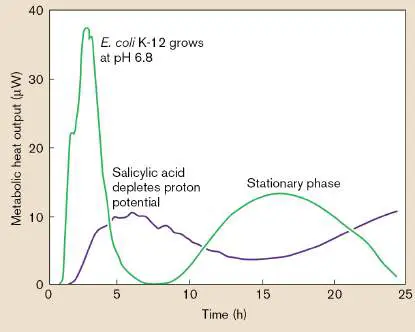
heat output Δ H of a single organism or of a population of microbes. Figure 13.4 shows
the rate of heat output in microwatts (μW) from microwells of growing bacteria. The heat
output indicates the rate of metabolism of the bacteria as they grow. The metabolic rate
rises as bacteria grow exponentially, and it then declines as the growth levels off to
stationary phase (presented in Chapter 4). But, later in stationary phase, some bacteria
begin to metabolize again by breaking down components of dead cells. Note that salicylate,
a molecule that depletes cell energy, decreases the metabolic rate and slows growth.
FIGURE 13.4 ■ Microcalorimetry. The heat output (μW) from bacterial
metabolism is measured for cultures in wells of a microplate device maintained at
constant temperature, 37°C (blue line). Heat output increases rapidly during early
growth and then declines during stationary phase. Salicylic acid depletes the cell’s
energy and decreases metabolic rate (red line).
Measurement of heat output conducted at various temperatures (T) yields the
temperature dependence of metabolic rate. From the temperature dependence of growth,
we can calculate − T Δ S. The sum of the two components Δ H and − T Δ S yields Δ G.
Thought Questions
13.1 Consider glucose catabolism by white blood cells that oxidize sugar with O 2 to form
CO 2:
C 6 H 12 O 6 + 6O 2 → 6CO 2 + 6H 2 O
Do you think this reaction releases greater energy as heat or by change in entropy? Explain.
13.2 The bacterium Lactococcus lactis was voted the official state microbe of Wisconsin
because of its importance for cheese production. During cheese production, L. lactis
ferments milk sugars to lactic acid:
C 6 H 12 O 6 → 2C 3 H 6 O 3 ⇌ 2C 3 H 5 O 3 − + 2H +
Large quantities of lactic acid are formed, with relatively small increase in bacterial
biomass. Why do you think biomass is limited? Cheese making usually runs more efficiently
at high temperature; why?
Reaction Conditions
For a given reaction in a given environment, many factors determine Δ G. These factors fall
into two classes—those intrinsic to the reaction, and those dependent on the environment:
Intrinsic properties of a reaction. The intrinsic properties of a reaction are the
changes of Δ H and Δ S contributing to Δ G. We can define standard values of these
properties relative to arbitrary standard conditions such as concentration and
temperature.
Concentrations and environmental factors. The direction of the reaction depends
on the concentrations of reactants and products. An excess of reactants over products
makes Δ G more negative (forward reaction), whereas an excess of product makes Δ G
more positive (reverse reaction). The direction of a reaction also depends on
environmental factors such as temperature, pressure, and ionic strength (salt
concentrations).
Standard Reaction Conditions
Scientists commonly present thermodynamic values under standard conditions for
temperature, pressure, and concentration. The standard conditions make it possible to
compare the intrinsic properties of reactions. The standard Gibbs free energy change is
designated Δ G °. The standard conditions for Δ G ° are as follows:
The temperature is 298 K (25°C).
The pressure is 1 atm (standard atmospheric pressure).
All concentrations of substrates and products are 1 molar (M).
For every chemical compound, a standard Δ G ° of formation can be determined by
chemical measurement. We obtain the Δ G ° for a molecular reaction under standard
conditions by summing the Δ G ° of formation of all the products, and subtracting the sum
of the Δ G ° of formation of all the reactants. A table of standard values of Δ G ° of
formation and a sample calculation are provided in eAppendix 1.
Note that the Δ G ° values reported in data tables hold only for isolated reactions under
“standard reaction conditions.” Standard conditions differ greatly from the actual conditions
of living cells. These conditions include temperature, ionic strength, and gas pressure (in
the case of gaseous components, such as CO 2), as well as the concentrations of reactants
and products. To account for some of these differences, biochemists add special standard
conditions: hydrogen ion concentration at pH 7, because living cells commonly maintain
their cytoplasm within a unit of neutral pH; and water concentration of 55.5 M for dilute
solutions. The free energy change in biochemistry is thus designated Δ G °′.
The additivity of energy change is central to all living metabolism. Additivity
makes it possible to do work by coupling an energy-yielding reaction to an energy-spending
reaction (see Section 13.2). Overall, that is the point of energy transformation: Obtaining
energy from one reaction enables a cell to do something it needs by a different reaction
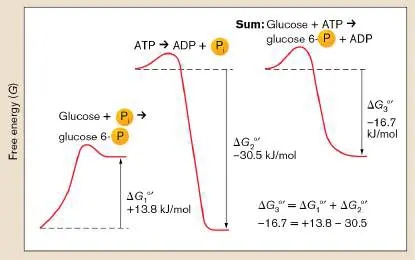
that spends the energy. Figure 13.5 shows an example, the initial reaction of glycolysis
(see Section 13.4), in which ATP phosphorylates glucose to glucose 6-phosphate, catalyzed
by the enzyme hexokinase. In this reaction, the loss of a phosphoryl group from ATP yields
energy, some of which is captured by the enzyme to transfer the phosphoryl group onto
glucose. The reactions and their Δ G °′ values are summed as follows:
Phosphorylation of glucose
C 6 H 12 O 6 + H 2 PO 4 − ⟶ C 6 H 12 O 6 PO 3 − + H 2 O
Δ G 1 °′ = +13.8 kJ/mol
ATP hydrolysis
ATP + H 2 O ⟶ ADP + H 2 PO 4 − + H +
Δ G 2 °′ = −30.5 kJ/mol
Sum:
ATP phosphorylation of glucose
C 6 H 12 O 6 + ATP ⟶ C 6 H 12 O 6 PO 3 − + ADP + H +
Δ G 3 °′ = −16.7 kJ/mol
FIGURE 13.5 ■ Calculating the standard free energy of a reaction. The Δ G °′
value for the phosphorylation of glucose by ATP equals the sum of the values for the
two coupled reactions: phosphorylation of glucose (Δ G 1 °′) and ATP hydrolysis (Δ G 2 °
′).
Note: Distinguish these forms of the Gibbs free energy term:
Δ G = change in Gibbs free energy for a reaction under defined conditions.
Δ G ° = Δ G at standard conditions of temperature (298 K) and pressure (1 atm, sea level),
with all reactants and products at a concentration of 1 M. (See table of values in
eAppendix 1.)
Δ G °′ = Δ G at standard temperature, pressure, and concentrations for Δ G °, plus the
biochemically relevant conditions of pH 7 (H + concentration of 10 −7 M) and water (H 2
O concentration of 55.5 M; activity = 1). Some biochemists standardize additional
factors, such as magnesium ion concentration: [Mg 2+] = 1 mM.
Concentrations of Reactants and Products
In living cells, the concentrations of reactants and products usually differ from 1 M; for
example, in the Escherichia coli cytoplasm, the concentrations of ATP and inorganic
phosphate (P i) are about 8 mM. Thus, the actual Δ G of reactions within a cell differs from
Δ G ° or Δ G °′.
Consider a reaction in which reactants A and B are reversibly converted to products C
and D:
A + B ⇌ C + D
Higher concentration of reactants (A or B) drives the reaction forward, whereas higher
concentration of products drives it in reverse. So, Δ G includes the ratio of products to
reactants:
where R is the gas constant [R = 8.315 × 10 −3 kJ/(mol · K)] and T is the absolute
temperature in kelvins (298 K, or 25°C). The factor 2.303 converts the logarithm of the
ratio of products to reactants from base e (ln) to base 10 (log). Note that in Δ G °′
calculations, the water activity (concentration modified by a constant) is set at 1. The
logarithm of 1 equals zero, so the water activity falls out of the equation.
Table 13.2 shows how the concentration ratio affects Δ G. In reactions at medium
temperature (25°C–40°C), a 100-fold increase in the ratio of products to reactants adds
about 11 kJ/mol to Δ G. Δ G is then less negative and the reaction less favorable. On the
other hand, a 100-fold decrease in the concentration ratio (much fewer products than
reactants) makes Δ G more negative by 11 kJ/mol.
Effect of the Concentration Ratio on Δ TABLE 13.2 G
Initial ratio of Change in Δ G (kJ/mol) Result of change from
products to at standard temperature standard concentrations
reactants: (298 K) and
atmospheric pressure
10 −4 −23 Products increase
10 −2 −11 Products increase
Effect of the Concentration Ratio on Δ TABLE 13.2 G
1 0 Δ G = Δ G °
10 2 +11 Reactants increase
10 4 +23 Reactants increase
In some environments, a highly negative concentration term can override a positive Δ G
°, resulting in a reaction with negative Δ G that microbes can use for energy. For example,
in an iron mine the high concentration of reduced iron favors iron-oxidizing microbes.
Alternatively, a high temperature may increase the magnitude of the term 2.303 RT log
[products]/[reactants] when it is negative, until it overrides a positive Δ G °. This
temperature dependence of Δ G is observed in thermophiles such as Sulfolobus, which
metabolizes sulfur at 90°C; these sulfur reactions could not go forward at lower
temperatures.
Another way the direction of reaction may change is for a second metabolic process to
remove one of the reaction’s products (C or D) as fast as it is produced. The decrease in
product concentration could then change the Δ G of the first reaction to a negative value.
For example, when bacteria break down glucose to pyruvate (see Section 13.4), many of
the individual reactions have Δ G °′ values of less than 5 kJ/mol. Their actual direction of
reaction in the cell depends on concentrations of products and reactants. Glycolytic
reactions with near-zero Δ G °′ are reversible and can, in fact, participate in the biosynthetic
pathway of gluconeogenesis (glucose biosynthesis, discussed in Chapter 15).
In natural environments many bacteria and archaea grow extremely slowly. Deep
underground, microbes might double over months or years. Most soil bacteria use energy-
yielding metabolism with values of Δ G approaching zero (that is, near thermodynamic
equilibrium). When the actual Δ G (under actual reaction conditions) equals zero, a reaction
proceeds equally forward and in reverse, and there is no net change in energy. At
equilibrium, the ratio of product and reactant concentrations exactly cancels Δ G ° or Δ G °′:
Living cells can never grow exactly at equilibrium (Δ G = 0). But most soil bacteria and
archaea gain energy from anaerobic metabolism with near-zero values of Δ G. Such
organisms must form biomass very slowly, but if no other metabolism is available, they may
outgrow competitors. The discovery of low-Δ G energetics has opened new possibilities for
environmental remediation previously thought impossible, such as the anaerobic digestion
of complex organic pollutants in contaminated soil (see Section 13.6).
Some of the near-zero anaerobic pathways involve syntrophy, an intimate metabolic
relationship between two species. For syntrophy, bacteria catabolize reactants by a reaction
with a positive Δ G °′ value, releasing a strong electron donor such as H 2. The hydrogen-
releasing reaction is tightly coupled with that of H 2 -oxidizing organisms such as
methanogens, so the complete reaction has a net negative Δ G °′. The bacterial catabolism
provides H 2 gas, which the partner species consumes, thus keeping H 2 concentration low
enough to drive the syntrophic reaction. Similar syntrophic partnerships may function in our
gut (see Section 13.5) and in anaerobic soil (see Section 13.6).
To Summarize
Energy enables cells to build ordered structures out of simple molecules from the
environment. Transfer of energy is never perfectly efficient, so metabolism releases
heat.
The free energy change (Δ G) includes enthalpy (Δ H), the heat energy
absorbed or released; and − T Δ S, the negative product of temperature and
entropy change (Δ S). Most reactions include both Δ H changes (such as oxidation-
reduction) and Δ S changes (such as breakdown to a larger number of products).
Negative values of Δ G show that a reaction can drive the cell’s metabolism. The
sign of Δ G depends on the relative magnitude of Δ H and − T Δ S.
Δ H -driven reactions release heat. Such reactions are called exothermic. By
contrast, a reaction that absorbs heat (positive value of Δ H) is endothermic.
T Δ S -driven reactions release less heat (or may absorb heat). Reactions
with a large T Δ S show a large temperature dependence of Δ G.
Intrinsic properties of the reaction determine the standard value of Δ G °.
Properties include the molecular stability of reactants and products and the entropy
change associated with product conversion to reactants. By convention, standard
conditions are set to define Δ G ° (for biochemists, Δ G °′).
Concentrations of reactants and products affect the actual value of Δ G.
The lower the concentration ratio of products to reactants, the more negative the
value of Δ G. Environmental factors such as temperature and pressure also affect Δ
G.
Within living cells, energy-yielding reactions are coupled with energy-
spending reactions. The measurement of energy flow under changing conditions
requires calculations more complex than those shown here.
Glossary
energy
The ability to do work.
entropy
A measure of the disorder in a system.
biomass
The mass found in the bodies of living organisms.
gut microbiome
The microbial community normally present in the intestinal lumen of a healthy host.
catabolism
The cellular breakdown of large molecules into smaller molecules, releasing energy.
chemotrophy
Metabolism that yields energy from oxidation-reduction reactions without using light
energy.
heterotrophy
Also called chemoorganoheterotrophy. The use of external sources of organic carbon
compounds for biosynthesis.
phototrophy
The use of chemical reactions powered by the absorption of light to yield energy.
Gibbs free energy change or Gibbs free energy change, Δ G
Also called free energy change. In a chemical reaction, a measure of how much energy
available to do work is released or required as the reaction proceeds.
enthalpy
A measure of the heat energy in a system.
entropy
A measure of the disorder in a system.
joule (J)
The standard SI unit for energy.
exothermic
Releasing heat.
endothermic
Absorbing heat.
calorimeter
A device used to measure the amount of heat released or absorbed during a reaction.
syntrophy
Metabolic cooperation between two different species; usually one member releases a
product whose removal by the second species enables the pair to metabolize with a
negative value of Δ G.
13.2 Energy Carriers and Electron TransferUnit 4 · Metabolism
Our Δ G equations show only the total energy of a reaction such as glucose oxidation. If all the energy were released at once, however, it would dissipate as heat without building biomass. In living cells, glucose is never oxidized in one step. Instead, the energy yield is divided among a large number of stepwise reactions with smaller energy changes. In this way, the cell can be thought of as “making change” by converting a large energy source to numerous smaller sources that can be “spent” conveniently for cell function and biosynthesis. These smaller energy sources are called energy carriers. An example of an energy carrier is adenosine triphosphate (ATP; Fig. 13.6). The “spending” of energy is controlled by enzymes that couple all of the energy-yielding reactions to specific energy-spending reactions.
FIGURE 13.6 ■ ADP plus inorganic phosphate makes ATP. The reaction requires energy input (positive Δ G) because the negatively charged oxygens of the phosphoryl groups are
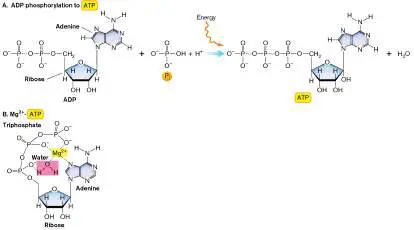
forced to interact. A. The chemical reaction phosphorylating ADP (adenosine diphosphate) to ATP (adenosine triphosphate). B. Model of Mg 2 + -ATP. The multiple negative charges of ATP are stabilized by binding a magnesium ion plus a water molecule. Energy carriers are molecules that gain and release small amounts of energy in reversible reactions. Energy carriers are used to transfer energy in a wide range of biochemical reactions. Note that in living cells, enzymes couple all energy transfer reactions to specific biochemical processes. Without enzyme coupling, energy would dissipate and be lost from the living system.
ATP Carries Energy
Adenosine triphosphate, or ATP (Fig. 13.6A), is composed of a base (adenine), a sugar (ribose), and three phosphoryl groups. Note that adenine-ribose-phosphate (adenosine nucleotide) is equivalent to a nucleotide of RNA. The base adenine is a fundamental molecule of life, one that forms spontaneously from methane and ammonia in experiments simulating the origin of life on early Earth (discussed in Chapters 1 and 17). Like the sugar ribose, ATP is an ancient component of cells, found in all living organisms.
Under physiological conditions, ATP always forms a complex with Mg 2+ (Fig. 13.6B ). The magnesium cation partly neutralizes the negative charges of the ATP phosphates, stabilizing the structure in solution. Most enzyme-binding sites for ATP actually bind Mg 2+ -ATP. This is one reason why magnesium is an essential nutrient for all living cells.
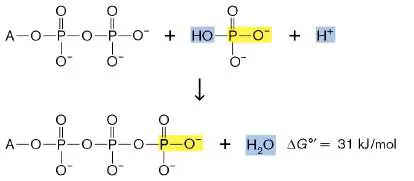
ADP phosphorylation to ATP. During cell metabolism, ATP is generated by phosphorylation, the addition of a phosphoryl group onto a molecule; in this case, the condensation of inorganic phosphate with adenosine diphosphate (ADP): The phosphorylation of ADP to form ATP requires energy input (positive Δ G).
Why does ATP formation require energy? The inorganic phosphate molecule has four oxygen atoms that share a negative charge. When phosphate reacts with another phosphate to form a bond, the charged oxygens of adjacent phosphates are forced to interact despite charge repulsion. The charge repulsion in ATP limits the rotation of oxygens, and thus decreases entropy, resulting in a negative Δ G of hydrolysis. Hydrolysis of each phosphoryl group yields energy. The formation and hydrolysis of ATP can be shown as: A–P~P + H + + P ⇌ A–P~P~P + H O
i 2
where ~ designates each energy-storing phosphoryl bond, and P i designates inorganic phosphate; or, in more concise shorthand: ADP + P i ⇌ ATP + H 2 O ATP is a “medium-sized” energy carrier, as the cell contains many phosphorylated molecules that yield greater energy upon hydrolysis. Table 13.3lists examples of free energy change associated with hydrolysis of various phosphoryl groups. As we will see, phosphoryl group hydrolysis with Δ G °′ values larger than −31 kJ/mol can yield energy that is stored by ATP formation. ATP hydrolysis can yield
energy to phosphorylate molecules at Δ G °′ values smaller than −31 kJ/mol.
Hydrolysis of Phosphoryl Groups:
TABLE 13.3
Values of Δ G °′ (pH 7.0, 25°C)
Reaction of hydrolysis Δ G °′ (kJ/mol) Glucose 6-P + H 2 O → −14 glucose + P i Fructose 1,6-bis-P + H 2 O → −16 fructose 6-P + P i PP i (pyrophosphate) + H 2 O −19 → 2 P + H +
i
ATP + H 2 O → ADP + P i + H −31
+
ADP + H 2 O → AMP + P i + −33 H + ATP + H 2 O → AMP + PP i −46 (pyrophosphate) + H + 1,3-Bis-P-glycerate + H 2 O −49 → 3-P-glycerate + P i
Hydrolysis of Phosphoryl Groups:
TABLE 13.3
Values of Δ G °′ (pH 7.0, 25°C)
Phosphoenolpyruvate + H 2 O −62 → pyruvate + P i ATP transfers energy. ATP can transfer energy to cellular processes in three different ways: hydrolysis releasing phosphate, hydrolysis releasing pyrophosphate (diphosphate), and phosphorylation of an organic molecule (Fig. 13.7). Each process serves different functions in the cell.
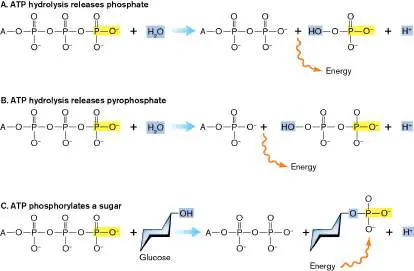
FIGURE 13.7 ■ ATP transfers energy by hydrolysis or by phosphorylation. A. ATP hydrolysis releases phosphate. B. ATP hydrolysis releases pyro phosphate. C. ATP phosphorylates a sugar.
Hydrolysis releases phosphate. The hydrolysis of ATP at the terminal phosphate consumes H 2 O to produce ADP and P i, releasing energy. The energy released by ATP hydrolysis can be transferred to a coupled reaction of biosynthesis, such as building an amino acid. A “coupled reaction” means that a reaction that spends energy can go forward if it is connected to a reaction that yields energy. For a reaction driven by ATP hydrolysis, the two reactions are coupled by an enzyme that has binding sites specific for ATP and the substrate of the energy-spending reaction.
Hydrolysis releases pyrophosphate. ATP can hydrolyze at the middle phosphate, releasing pyrophosphate (PP i). The pyrophosphate usually hydrolyzes shortly afterward to make 2 P i. Overall, the release of 2 P i from ATP yields approximately twice as much energy as the release of 1 P i. Pyrophosphate release and subsequent hydrolysis drives a reaction strongly forward, because twice as much energy would be required to reverse the reaction. Pyrophosphate is released in reactions that must avoid reversal; for example, the incorporation of nucleotides into growing chains of RNA.
Phosphorylation of an organic molecule. ATP can transfer its phosphate to the hydroxyl group of a molecule such as glucose to activate the substrate for a subsequent rapid reaction. No inorganic phosphate appears, and no water molecule is consumed.
Some enzymes catalyze ATP transfer of phosphate to activate sugar molecules for catabolism. Other enzymes couple the phosphorylation of a sugar to its transport across the cell membrane; consequently, these enzymes make up the phosphotransferase system (PTS). The PTS enzymes play a critical role in determining which nutrients from the environment some microbes can acquire and catabolize (discussed in Chapter 4).
Thought Questions
13.3 When ATP phosphorylates glucose to glucose 6-phosphate, what is the net value of Δ G °′? What if ATP phosphorylates pyruvate? Can this latter reaction go forward without additional input of energy? (See Table 13.3.)
13.4 Linking an amino acid to its cognate transfer RNA (tRNA) is driven by ATP hydrolysis to AMP (adenosine monophosphate) plus pyrophosphate. Why does it release PP i instead of P i?
ATP produced by glucose catabolism. A large number of ATPs can be formed by coupling ATP synthesis to the step-by-step breakdown and oxidation of a food molecule such as glucose. In theory, complete oxidation of glucose through respiration can produce as many as 38 ATP molecules. The overall Δ G °′ of the coupled reactions is: The difference in Δ G °′ for the coupled reactions is the energy lost as heat and entropy—in this case –1,700 kJ/mol (–2,878 kJ/mol + 1,178 kJ/mol). Thus, the maximal efficiency of energy capture by ATP is about 40%, a level that may be approached by highly efficient systems such as mitochondria. When Δ G values are corrected for cellular concentrations of reactants and products, the actual efficiency may be greater than 50%. Under conditions such as low oxygen concentration, much smaller amounts of ATP are made per molecule of glucose. For comparison, the efficiency of a typical machine, such as a new car’s internal combustion engine, is about 40%.
Thought Question
13.5 In the microbial community of the bovine rumen, the actual Δ G value has been calculated for glucose fermentation to acetate: C H O + 2H O → 2C H O − + 2H + + 4H + 2CO
6 12 6 2 2 3 2 2 2
Δ G = −318 kJ/mol If the actual Δ G for ATP formation is +44 kJ/mol and each glucose fermentation yields 4 ATP, what is the thermodynamic efficiency of energy gain? Where does the lost energy go?
Note that, besides ATP, other nucleotides carry energy.
Guanosine triphosphate (GTP) provides energy for ribosome elongation of proteins. And the phosphodiester bonds of all four nucleoside triphosphates, as well as their corresponding deoxyribonucleoside triphosphates, carry energy for their own incorporation into RNA and DNA, respectively.
NADH Carries Energy and Electrons
Some energy carriers transfer energy associated with electrons received from a food molecule. A major energy carrier that also transfers electrons is nicotinamide adenine dinucleotide, or NAD (NADH, reduced; NAD +, oxidized). Unlike ATP, NADH carries energy associated with two electrons. Gain of electrons “reduces” the substrate (Fig. 13.8A).
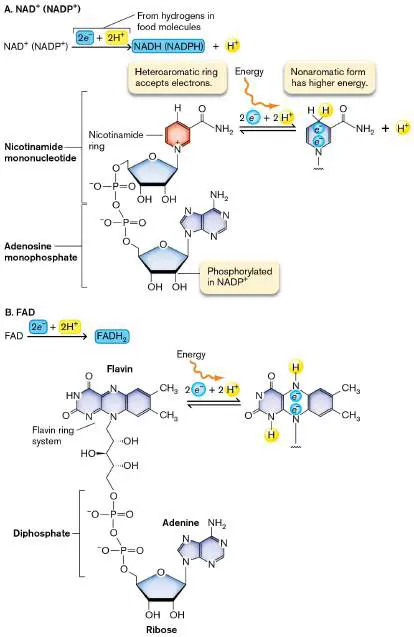
FIGURE 13.8 ■ Reduction of NAD + and FAD. A. NAD + reduction: The nicotinamide ring (shaded pink) loses a double bond as two electrons are gained from an electron donor. Two hydrogen atoms are consumed; one bonds to NADH, while the other ionizes. B. Flavin adenine dinucleotide (FAD) reduction: The flavin ring system gains two electrons associated with two hydrogens.
A molecule that transfers, or “donates,” electrons to another molecule is called an electron donor or a reducing agent; a molecule that receives, or “accepts,” electrons is called an electron acceptor. For example, during glucose catabolism a molecule of glyceraldehyde 3-phosphate transfers a pair of electrons (2 e −) with a hydrogen ion (H +) to NAD +, forming NADH. NAD + is an electron acceptor that receives the electrons; it then becomes the electron donor NADH. Electron donors such as NADH transfer electrons from reduced food molecules to a terminal electron acceptor such as oxygen (see Chapter 14).
NADH carries two or three times as much energy as ATP, depending on cellular conditions. During sugar catabolism, NADH carries electrons from breakdown products of glucose. Its oxidized form, NAD +, receives two electrons (2 e −) plus a hydrogen ion (H +) from a food molecule; a second H + from the food molecule enters the solution. Overall, reduction of NAD + consumes two hydrogen atoms to make NADH: NAD + + 2H + + 2 e − → NADH + H + Δ G °′ = +62 kJ/mol For this reaction, Δ G °′ is positive; therefore, it requires input of energy from catabolism of the food molecule. The reduced energy carrier NADH can then reverse this reaction by donating two electrons (2 e −) to another molecule, regenerating NAD +.
Note: A hydrogen ion (H +), or “proton,” does not exist free in
solution. In water, a H + combines with H O to form a hydronium
2
ion (H O +), but for clarity we use H +. An atom of hydrogen
3
removed from a C–H bond consists of a proton (H +) plus an electron (e −). In a reaction, the proton and electron may be transferred to one molecule or to separate molecules.
NADH structure and function. NAD + consists of an adenine mononucleotide molecule attached to nicotinamide. The nicotinamide mononucleotide, like a ribonucleotide, contains a nitrogenous base attached to a sugar phosphate. In NAD +, the nicotinamide has a ring structure (shaded pink in Fig. 13.8A) that forms a stable cation.
NAD + is a relatively stable structure because the ring electrons are aromatic; that is, the bonding electrons delocalize around the ring, as in benzene. Aromatic rings that contain noncarbon atoms are said to be heteroaromatic. Many biologically active molecules are heteroaromatic, including adenine and other nucleotide bases. A heteroaromatic ring is stable, but its disruption requires less energy than does the disruption of benzene. Thus, it is possible to disrupt the ring by adding two electrons with a H +, eliminating one double bond. The donation of electrons eliminates the ring’s aromaticity and thus stores energy. The reduced molecule NADH carries energy in an amount useful for cell reactions.
The electrons transferred to NADH eventually must be put somewhere else, onto the next electron acceptor. If NADH builds up in a cell, no NAD + remains to continue oxidizing food molecules. One way that the energy stored by NADH can be spent is to transfer 2H + + 2 e − onto a product of catabolism. For example, in ethanolic fermentation to make wine or beer, NADH reduces pyruvate to ethanol. In this case, however, the energy is lost to the cell. Alternatively, NADH can transfer its electrons to one of a series of electron carrier molecules known as the electron transport system (ETS), also called the electron transport chain (ETC). Electron transport within bacteria can be used to generate electricity for commercial power (discussed in Chapter 14). Examples of electron transfer reactions are shown in the “tower of power” in Table 13.4. For example, adding two electrons (2 e −) to NAD + to make NADH has a highly negative value of standard reduction potential E °′ (positive Δ G °′), which means that the reaction requires energy input.
TABLE *
Standard Reduction Potentials 13.4
Electron → Electron E ° ′ (mV) Δ G ° ′ (kJ) acceptor a donor 2H + + 2 e − → H 2 −420 +81 NAD + + 2H → NADH + H + + 2 e − + −320 +62 FAD + 2H + → FADH 2 + 2 e − −220 +42 FMN + 2H + → FMNH 2 + 2 e − −190 +37 Menaquinone → Menaquinol + 2H + + −74 +14 TABLE *
Standard Reduction Potentials 13.4
2 e − Fumarate + → Succinate 2H + + 2 e +33 −6
−
Ubiquinone → Ubiquinol + 2H + + +110 −21 2 e − NO − + 2H → NO − + H
3 2
+ − +420 −81 + 2 e 2 O ½O + 2H + → H 2 O
2
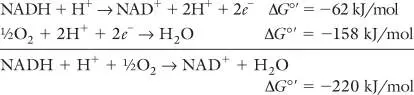
− +820 −158 + 2 e NADH oxidation and reduction participate in reactions of the ETS. The ETS includes a series of proteins and small organic molecules that can be reduced and cyclically reoxidized. The redox reactions store energy from electron transfer as ion gradients across the membrane of the cell or an organelle. At the end of the redox series, the electrons are transferred to a terminal electron acceptor whose product leaves the cell. For example, as a terminal electron acceptor, molecular oxygen (O 2) is reduced to H 2 O. The reaction of O 2 reduction to H 2 O may be coupled to oxidation of NADH: Thus, the total energy released during NADH oxidation through the ETS is −220 kJ/mol (−62 kJ/mol − 158 kJ/mol). This energy is converted to transmembrane proton potential (composed of the H + concentration difference plus the charge difference across the membrane). Reduction potentials and the proton potential (see Chapter 14) drive nutrient transport, motility, and synthesis of ATP.
Note: Reduction potentials, electron transport, and proton motive
force are discussed further in Chapter 14.
Other energy carriers that transfer electrons. Different steps of metabolism utilize different but related energy carriers. For example, NADPH differs from NADH only in the extra phosphate attached to the 2′ carbon of adenine nucleotide; the amount of energy carried is the same. Some enzymes can use both NADPH and NADH, whereas other enzymes use only one or the other.
Another related energy carrier is flavin adenine dinucleotide, or FAD (FADH 2, reduced; FAD, oxidized), in which flavin substitutes for nicotinamide. The flavin nucleotide includes a ring structure whose aromaticity is eliminated by its receiving two electrons (Fig. 13.8B ). The redox function of the flavin isoalloxazine ring system is similar to that of NADH: FAD + 2H + + 2 e − → FADH
2
Like NADH, FADH donates 2 e − to an electron acceptor. FADH is
2 2
a weaker electron donor than NADH, but when FADH 2 is combined with a strong electron acceptor such as O 2, electrons are transferred and significant energy is released: Δ G °′ = −42 − 158 = −200 kJ/mol Why do different kinds of reactions use different energy carriers? Different redox levels. Food molecules may have more or fewer electrons (level of reduction/oxidation) than do molecules associated with the cell structure. For example, lipids are more highly reduced than glucose. Thus, lipid catabolism requires a greater proportion of electron-accepting energy carriers (such as NAD + or NADP +) than does glucose catabolism, and it makes relatively few ATP molecules directly. A combination of energy carriers with different redox states enables cells to balance their overall redox potential while transferring energy. Different amounts of energy. Biochemical reactions yield different amounts of energy; that is, different values of Δ G. Suppose a reaction can provide more than enough energy to generate ATP from ADP (31 kJ), but not quite enough to generate NADH from NAD + (62 kJ). An example is the conversion of succinate to fumarate in the TCA cycle (see Section 13.4). Succinate conversion provides the energy to reduce FAD to FADH 2, whose oxidation by O 2 can yield two molecules of ATP. Thus, the use of FADH 2 enables the cell to make more efficient use of its food than if generation of ATP or NADH were the only choices.
Regulation and specificity. Specific energy carriers can direct metabolites into different pathways serving different functions. For example, in many bacteria NADH is directed into the ETS, whereas NADPH, the 2′-phosphorylated form of NADH, is directed into biosynthesis of cell components such as amino acids and lipids.
Concentration Gradients Store Energy
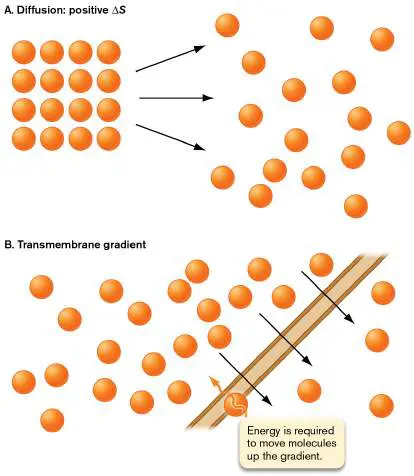
So far, our discussion of energy has assumed an isotropic system, in which concentrations are the same everywhere. But a living cell needs to obtain its molecules from outside, such as sugars, amino acids, and inorganic ions (discussed in Chapter 4). Suppose a blood pathogen needs to obtain a scarce substance such as iron (Fe 2+). How does the microbe move the iron “uphill” against its concentration gradient? In fact, a concentration gradient of any substance can store energy, just as an energy carrier molecule does. A substance dissolved in water diffuses by random movements until its distribution has the same concentration throughout (Fig. 13.9A). The random distribution of molecules at uniform concentration represents the state of greatest entropy. Diffusion in the environment ultimately brings nutrients into contact with microbial cells, even cells that lack chemotactic motility to hunt for food. For example, sugars in the food we eat diffuse through our saliva to reach the bacteria growing in biofilms on our teeth. The cell membrane contains transporters for useful molecules, allowing nutrient molecules to cross. Entropy favors their movement from higher to lower concentration (Fig. 13.9B ). In most environments, however, the nutrients are at lower concentrations than inside the cell. To obtain these molecules from outside, the bacterial cell must transport them against their gradient—that is, from lower to higher concentration—increasing the concentration difference and thus decreasing entropy. Uptake against a concentration gradient requires an energy source to power transport proteins embedded in the membrane (as shown in Chapter 4). Alternatively, a transmembrane gradient of ions can store energy for the cell. The most important ion gradient is the H + gradient, or transmembrane pH difference, a component of the proton motive force (PMF).
FIGURE 13.9 ■ Diffusion and transport. A. Water-soluble molecules diffuse to uniform concentration throughout the solution: Δ S is positive, − T Δ S negative; the entropy term favors the process. B. If a membrane separating two compartments is permeable, molecules move from a compartment with high concentration to one with low concentration. Energy is required to move molecules up their concentration gradient.
Note: The proton motive force (PMF) is composed of the
transmembrane concentration difference of hydrogen ions (ΔpH) and the electrical potential difference (−Δψ). The PMF is explained in detail in Chapter 14.
Enzymes Catalyze Metabolic Reactions
The Δ G values of energy change show whether a reaction goes forward, but not how long it will take. A few seconds or a hundred years? The Δ G value does not specify the reaction rate; that is, the kinetics of reaction.
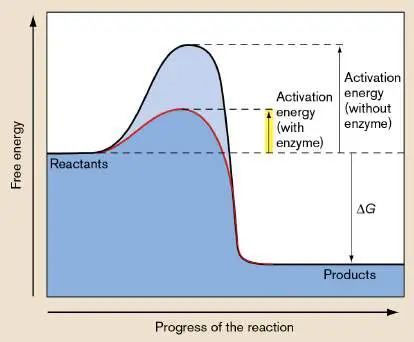
In living cells, each reaction must occur only as needed, in the right amount at the right time. The rate of a reaction is determined by the activation energy (E a), the input energy needed to generate the high-energy transition state on the way to products ( Fig. 13.10). Most biochemical reactions require an activation energy that exceeds the average kinetic energy of the reactant molecules colliding. Thus, no matter how negative the Δ G is, the reaction will proceed at a significant rate only when the activation energy is lowered by interaction with a catalyst, an agent that participates in a reaction without being consumed.
FIGURE 13.10 ■ Enzymes lower the activation energy of the transition state. In the presence of an enzyme, the activation energy of the reaction is decreased, allowing rapid conversion of reactants to products.
Biological reactions are catalyzed by enzymes, structures composed of protein (or, in some cases, RNA) that bind substrates of a specific reaction. The enzyme lowers the activation energy by bringing the substrates in proximity to one another and by correctly orienting them to react. In some cases, enzymes provide a reactive amino acid residue to stabilize a transition state between reactants and products. Microbial enzymes have growing importance in industry; they are used for food production, fabric treatment, and drug therapies (discussed in Chapter 16).
Enzymes couple specific energy-yielding reactions (such as those of glucose breakdown) to the cell’s energy-spending reactions (such as making ATP). An example of coupled reactions is shown in Figure 13.11A. The enzyme pyruvate kinase catalyzes removal of a phosphoryl group from the substrate phosphoenolpyruvate (PEP), a breakdown product of glucose. PEP is converted to pyruvate while the phosphoryl group is added to ADP, generating ATP: The Δ G °′ of phosphoryl-group cleavage from PEP is −62 kJ/mol, whereas the Δ G °′ of ATP formation is only +31 kJ/mol. Thus, the net Δ G °′ is negative (−31 kJ/mol), and the reaction goes forward to pyruvate. But a high activation energy makes the reaction extremely slow; without help, it rarely goes forward on the timescale of life. The reaction proceeds only when the two reacting substrates (PEP and ADP) are coupled by the enzyme pyruvate kinase (Fig. 13.11A). Pyruvate kinase has specific binding sites
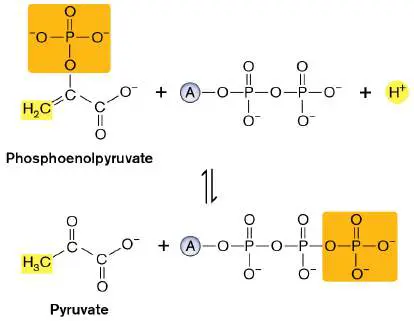
for each of its substrates: PEP and ADP. ADP and PEP are brought together by the enzyme and positioned so as to lower the activation energy of phosphoryl-group transfer.
The catalytic domain or catalytic site is the part of the protein that actually binds the substrate and catalyzes the reaction. In addition to the catalytic site, the enzyme has an allosteric site (a regulatory site distinct from the substrate-binding site) for its activator, fructose 1,6-bisphosphate. The difference between a substrate-binding site and an allosteric site can be seen in the molecular model of pyruvate kinase based on X-ray crystallography ( Fig. 13.11B ). The allosteric site is found at a distance from the substrate-binding site, but its interaction with the regulator, fructose 1,6-bisphosphate, alters the conformation of the entire enzyme, increasing the rate of reaction. As we will see later, fructose 1,6-bisphosphate is a central intermediate of glycolysis; thus, it makes sense that as this molecule builds up, it activates pyruvate kinase to remove products farther down the chain of catabolic reactions, maintaining the steady flow of metabolites.
FIGURE 13.11 ■ The enzyme pyruvate kinase. A. Pyruvate kinase catalyzes the transfer of a phosphoryl group from PEP to ADP, generating pyruvate and ATP. The enzyme
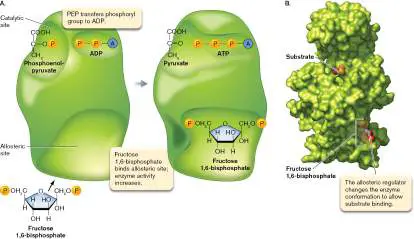
possesses separate binding sites for substrates and allosteric regulators. B. The molecular model of pyruvate kinase, based on a crystal structure of the enzyme bound to a substrate analog and an allosteric regulator, fructose 1,6-bisphosphate. (PDB code: 1A3W)
Thought Question
13.6 What would happen to the bacterial cell if pyruvate kinase catalyzed PEP conversion to pyruvate but failed to couple this reaction to ATP production?
Note that pyruvate kinase is named for its reverse reaction: pyruvate phosphorylation to PEP. The enzyme may have been named for activity that was originally observed in the reverse direction, before the cell function was understood. Enzymes can catalyze both forward and reverse reactions. The predominant direction of catalysis depends on the concentrations of substrates and products (which determine Δ G) and on allosteric regulators.
Note: In all diagrams of metabolism, assume that every reaction
requires an enzyme, even where enzymes are not shown. Enzymes determine the details of form and function for all organisms.
To Summarize
Catabolic pathways organize the breakdown of large molecules in a series of sequential steps coupled to reactions that store energy in small carriers such as ATP and NADH.
ATP and other nucleoside triphosphates store energy in the form of phosphodiester bonds.
NADH, NADPH, and FADH 2 each store energy associated with an electron pair that carries reducing power.
Concentration gradients store energy. Solutes run down their concentration gradient unless energy is applied to reverse the flow. Gradient energy can be interconverted with energy from chemical reactions.
Enzymes catalyze reactions by lowering the Δ G required to reach the transition state. They couple energy transfer reactions to specific reactions of biosynthesis and cell function.
Every metabolic reaction requires a specific enzyme.
Glossary
energy carrier A molecule in the cell, such as ATP or NADH, that serves as energy currency. Energy carriers are produced during catabolic reactions and can be used to drive energy-requiring reactions. adenosine triphosphate (ATP)
A ribonucleotide with three phosphoryl groups and the base adenine. It has many functions in the cell, including precursor for RNA synthesis and energy carrier.
adenosine triphosphate (ATP)
A ribonucleotide with three phosphoryl groups and the base adenine. It has many functions in the cell, including precursor for RNA synthesis and energy carrier.
phosphorylation The enzyme-catalyzed addition of a phosphoryl group onto a molecule.
hydrolysis The cleaving of a bond by the addition of a water molecule. nicotinamide adenine dinucleotide (NAD)
An energy carrier in the cell that can donate (NADH) or accept (NAD +) electrons.
nicotinamide adenine dinucleotide (NAD)
An energy carrier in the cell that can donate (NADH) or accept (NAD +) electrons.
electron donor Also called reducing agent. A reduced molecule (e.g., NADH) that can donate electrons.
electron acceptor An oxidized molecule (e.g., NAD +) that can accept electrons. aromatic Describing a planar, unsaturated, ring-shaped organic molecule whose bonding electrons are delocalized equally around the ring.
electron transport system (ETS) or electron transport chain (ETC) Also called cytochrome system. A series of membrane-embedded proteins that converts the energy of redox reactions into a proton potential.
terminal electron acceptor The final electron acceptor at the end of an electron transport system.
flavin adenine dinucleotide (FAD)
An energy carrier in the cell that can donate (FADH 2) or accept (FAD) electrons.
flavin adenine dinucleotide (FAD)
An energy carrier in the cell that can donate (FADH 2) or accept (FAD) electrons.
activation energy (E a)
The energy needed for reactants to reach the transition state between reactants and products.
enzyme A biological catalyst; a protein or RNA that can speed up the progress of a reaction without itself being changed.
catalytic domain 1. Also called catalytic site. The portion of an enzyme that performs catalysis. 2. The A subunit of a toxin, which carries the ADP-ribosyltransferase activity.
catalytic site See catalytic domain (definition 1).
allosteric site A regulatory site on a biological molecule distinct from the ligand/substrate-binding site.
Endnotes
1. Note *: For a more extensive list, see Table 14.1. Return to reference * 2. Note a: FAD = flavin adenine dinucleotide; FMN = flavin mononucleotide. Return to reference a
13.3 Catabolism: The Microbial BuffetUnit 4 · Metabolism
In the early twentieth century, it was thought that microbes could catabolize a limited subset of naturally occurring organic molecules, such as sugars. Molecules not known to be catabolized were termed “xenobiotics,” especially if they were “synthetic” products of human industry. We have since found that virtually any organic molecule can be catabolized by a microbe that has evolved the appropriate enzymes. Catabolism by microbes in our own digestive system helps us digest complex food molecules. Catabolism also plays key roles in microbial disease; for example, the causative agent of acne, Cutibacterium acnes, degrades skin cell components such as lipids. In our environment, microbial catabolism can break down organic pollutants, even long-lasting materials such as plastics; an example is presented in eResearch Activity 13.
Note: Besides releasing energy, the breakdown of organic food
molecules provides substrates for biosynthesis. Biosynthesis is covered in Chapter 15.
Substrates for Catabolism
Here we present several important classes of catabolic substrates ( Fig. 13.12). While, in principle, virtually any organic constituent may be catabolized, certain kinds of substrates are used more rapidly because they require less activation energy or fewer types of enzymes to break them down. Many of these substrates form products important to our nutrition and technology. Others, such as aromatic components of petroleum, are environmental pollutants that only bacteria and fungi can degrade (see Section 13.6).
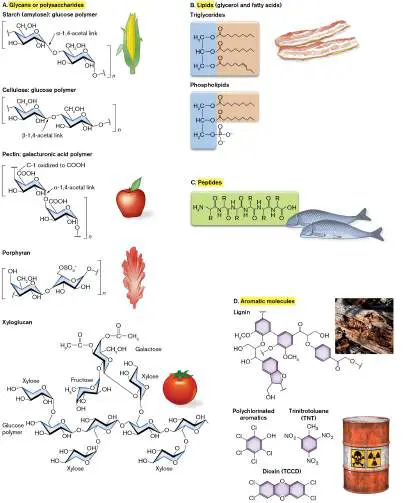
FIGURE 13.12 ■ Complex carbon sources for catabolism. A. Glycans or polysaccharides such as starch, cellulose, and pectin are hydrolyzed to six-carbon sugars. B. Lipids are broken down to acetate. C. Peptides are hydrolyzed to amino acids and then broken down to acetate, amines, and other molecules. D.
Complex aromatic molecules such as lignins and halogenated
aromatic pollutants are broken down to acetate and other molecules.
B.A.E. INC./ALAMY STOCK PHOTO
CORNISH MAN/ISTOCK PHOTO
Carbohydrates. Carbohydrates include sugars and sugar polymers, which are generally called polysaccharides or glycans (Fig. 13.12A ). Glycans are important as structural components of cells and for their central role in human digestion. Glycans composed of glucose are also called glucans.
Microbial catabolism is central to our production of food and drink (presented in Chapter 16). Glucose as such is rarely available to microbes, except to pathogens growing within a host. But the pathways of glucose catabolism complete the digestion of a diverse range of food molecules found in the environment. The main glycan digested by human enzymes is starch, a polymer of glucose monomers in which an acetal (O–COH) condenses with a hydroxyl group, releasing H 2 O. Starch is the main caloric component of foods such as bread, rice, and potatoes.
But intestinal bacteria such as Bacteroides species can digest a far greater range of polysaccharides or glycans, such as the pectin of fruit, and the multisugar xyloglucans of lettuce and tomatoes. Glycans may contain extra functional groups, such as the sulfates of porphyran, a glycan found in Porphyra seaweed. These glycans were originally defined as “fiber”; that is, polymers indigestible by humans. We now know that partial digestion of fiber contributes significant caloric content to the human diet.
Glycan sugar polymers are broken down by microbial enzymes, first to short chains (oligosaccharides), then to two-sugar units (disaccharides), and then to monosaccharides such as glucose or fructose. In some sugars, the aldehyde is replaced by a hydroxyl (sorbitol, mannitol) or a carboxylate (gluconate, glucuronate). The overall result is that glycans are hydrolyzed to products that enter central catabolic pathways such as glycolysis ( Fig. 13.13).
FIGURE 13.13 ■ Many carbon sources enter central pathways of catabolism. Glycans are broken down to disaccharides and then to monosaccharides such as glucose. Glucose and sugar acids are converted to pyruvate, which releases acetyl groups. Lignin and plastics such as polyethylene terephthalate (PET) are hydrolyzed to aromatic monomers and are then broken down to acetyl groups. Amino acids are decarboxylated and deaminated.
Lipids. Many bacteria catabolize lipids (Fig. 13.12B ) from sources such as milk, animal fats, and nuts. The oxidation of lipid catabolites causes the rancid odor of spoiled meat or butter (issues of food microbiology, discussed in Chapter 16). Microbes catabolize lipids by
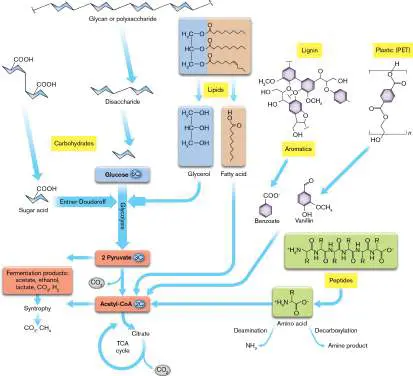
hydrolysis to glycerol and fatty acids (Fig. 13.13). Glycerol, a three-carbon triol (a compound with three –OH groups), can be considered a three-carbon sugar; it commonly enters catabolism as an intermediate of glycolysis. Alternatively, other pathways break down glycerol to acetate. Fatty acids, more highly reduced than glycerol, undergo oxidative breakdown by the fatty acid degradation pathway, forming acetyl groups. These acetyl groups enter the TCA cycle when a terminal electron acceptor is available; alternatively, they enter fermentation or anaerobic syntrophy.
Peptides. We commonly think of proteins as essential parts of a cell. When present in excess, however, proteins can be catabolized to provide energy. Initially, proteins are broken into peptides (Fig. 13.12C ) by sequence-specific proteases. Peptides are then hydrolyzed to individual amino acids (Fig. 13.13).
Enzymes catalyze the early steps in the degradation of each amino acid until products are formed that can enter common pathways of carbohydrate catabolism or the TCA cycle. The initial step of amino acid degradation is one of two kinds: decarboxylation (removal of CO 2) to produce an amine or deamination (removal of NH 3) to produce a carboxylic acid. Carboxylic acids are degraded through the TCA cycle. Amine products must be exported from the cell. For gut bacteria, these exported amines may serve host functions such as those of immunomodulators and neurotransmitters (discussed in Section 13.5). Other amines, such as cadaverine and putrescine, cause the noxious odor of decomposing flesh.
Aromatic molecules. Aromatic compounds are more difficult to digest than sugars because of the exceptional stability of aromatic ring structures. Yet many bacteria metabolize benzene derivatives, and even polycyclic aromatic molecules, either partly or all the way to CO 2. A particularly important aromatic substance found in nature is lignin (Fig. 13.12D ), which forms the key structural support of trees and woody stems. A discouragingly complex molecule, lignin is made from six-carbon sugars converted to benzene rings, with ether connections that are difficult for enzymes to break down. Fungi and soil bacteria catabolize lignin to oxidized benzene derivatives such as benzoate, a food preservative, and vanillin, a flavor molecule (Fig. 13.13). Further breakdown produces acetyl-CoA, which enters the TCA cycle (presented in Section 13.4).
Today, the environment contains increasing amounts of human-made aromatic compounds, produced for herbicides and other industrial uses, that are highly toxic pollutants. These include halogenated aromatics, such as polychlorinated biphenyls, the source of highly toxic dioxins. Halogenated aromatics turn out to be catabolized by a number of soil microbes, which are promising candidates for bioremediation of polluted environments (described in Section 13.6). Other types of aromatic molecules catabolized by microbes are polycyclic aromatic hydrocarbons (PAHs). Found in petroleum, the multiple fused rings of PAH compounds build up in natural environments—but with time, microbes can catabolize them and remediate the soil (see Section 13.6).
Products of Catabolism
What is the ultimate fate of all the bits of organic carbon chewed up by microbial catabolism? The answer has myriad consequences for human nutrition and environmental cycling, as well as food and industrial production.
From Table 13.1, recall two major forms of catabolism. In fermentation, all the electrons from organic substrates are put back onto the organic products. Thus, food ferments without oxygen. Fermentation has a negative Δ G, owing to breakdown of a large molecule to several smaller products, which are usually more stable as well. These organic products may be further catabolized by other members of an ecosystem.
In respiration, the electrons removed from food are ultimately transferred to an inorganic electron acceptor such as oxygen or nitrate or an organic electron acceptor such as fumarate. The use of an electron acceptor other than oxygen is called anaerobic respiration. The major products of respiration are water and carbon dioxide. Fermentation and respiration are discussed in Section 13.4 and in Chapter 14.
Catabolism of Complex Fibers
In natural ecosystems, how do cells manage to break down complex carbon sources? Free-living bacteria and fungi may catabolize thousands of different carbon sources, each requiring specific transporters and enzymes for initial breakdown. Most of these, particularly complex plant fibers, are not digestible by animals, whose genomes do not encode the necessary enzymes. The only polysaccharides that human enzymes can digest are starch, lactose, and sucrose. Yet human microbial communities can obtain nutrition from a vast array of plant fibers that consist of long, branched glycans.
Many animals, including humans, contain anaerobes such as the Gram-negative genus Bacteroides and the Gram-positive genera Bifidobacterium and Ruminococcus (originally named for the bovine rumen). By evolving a mutualism with microbes, animals avoid the need to acquire new catabolic genes in their own genome. The microbial genomes function as part of the animal metagenome, the total sequence of genomes of a community of organisms.
Tomato xyloglucans. The fibers of lettuce and tomatoes include xyloglucans, beta-linked glucose polymers with side chains containing xylose, galactose, and fructose or arabinose (Fig. 13.12A). A major challenge to the digestion of plant fibers is their extended chain length, which prevents uptake into bacterial cells. Because bacteria have solid cell walls and are incapable of phagocytosis, a bacterium cannot take up a large, branched molecule. For starch, a simple polymer of glucose monomers, the solution was revealed by Abigail Salyers (1942–2013) and colleagues at the University of Illinois. In Bacteroides thetaiotaomicron, the starch fibers become bound to outer-membrane proteins called the starch utilization system (Sus system). These proteins actually begin digestion outside the cell by cleaving the long fibers into short chains. The short chains can cross the outer membrane into the periplasm via porins (outer membrane proteins, presented in Chapter 3).
Digestion of each type of xyloglucan requires a slightly different set of genes, called a polysaccharide utilization locus (PUL). The PULs, or Sus-like systems, evolved from a common ancestor including the starch utilization system (Fig. 13.14). These important catabolic systems are studied by many laboratories, notably the lab of Nicole Koropatkin at the University of Michigan ( Fig. 13.14A). Figure 13.14B shows the xyloglucan PUL for each of four different species of Bacteroides found in the human gut. The DNA sequences of these species show synteny; that is, sufficient similarity of sequence and map position to predict common ancestry (discussed in Chapter 17). Most gut bacteria possess a number of PULs distributed around their genomes, showing evidence of horizontal gene transfer and evolution of genomic islands (discussed in Chapter 9).
To catabolize xyloglucans by breaking down the fibers into short oligosaccharides, the bacterium either secretes enzymes or places enzymes on the outer membrane (Fig. 13.14C ). Some of the xyloglucan PUL genes encode outer membrane–inserted enzymes (GH5A and GH9A in Figure 13.14C ) that specifically cleave xyloglucans. Other PUL genes encode oligosaccharide outer membrane transporters such as SusC-related proteins for xyloglucans, analogous to SusC for starch breakdown. Within the periplasm, various amylases break down the oligosaccharides to monosaccharides. The monosaccharide products are then transported across the inner membrane into the cytoplasm, where they undergo glycolysis (discussed in Section 13.4). Metagenome analysis reveals hundreds of Sus homologs that target different polysaccharides; these Sus-like systems compose, for example, 18% of the genome of Bacteroides thetaiotaomicron.
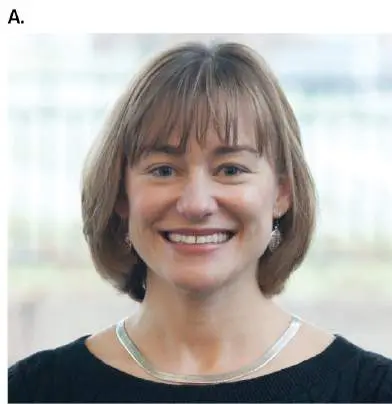
FIGURE 13.14 ■ Xyloglucan catabolism by a Sus-like system in gut bacteria. A. Nicole Koropatkin studies xyloglucan
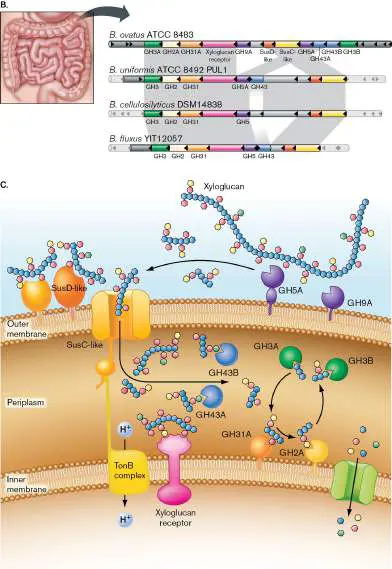
catabolism at the University of Michigan. B. Some Bacteroides species have PUL sets of genes encoding xyloglucan degradation. The PULs show synteny (conserved order of genes), evidence of descent from a common ancestor. C. Xyloglucan degradation enzymes and transporters within a Bacteroides envelope.
Xyloglucan cleavage by enzyme GH9A releases short sugar chains that cross the outer membrane via a SusC-like complex.
Periplasmic enzymes further break down the chains. Protein colors are matched to their genes in (B). Source: Modified from Johan Larsbrink et al. 2014. Nature 506:498.
NICOLE KOROPATKIN
Yet other Sus-like proteins catabolize different types of polysaccharides, such as those with sulfated sugars or aromatic lignin derivatives, or glycosylated proteins (glycoproteins). Suppose two different species in your digestive microbiome possess enzymes for different steps of a pathway. Individually, the two bacteria might not digest a certain substrate—but together they may complete its breakdown. The surprising nutritional cooperation of our microbiome is discussed further in Chapter 21.
Human milk oligosaccharides. A remarkable class of glycans is produced in mammalian breast milk. In humans, these glycans are called human milk oligosaccharides (HMOs). HMOs consist of branched chains of hexoses alternating galactose and N - acetylglucosamine (glucose with an added acetyl group and an amine group). Some chains end in fucose (6-deoxy-L -galactose) or N - acetylneuraminic acid. These unique sugar chains form a large share of the nutritional content of milk, yet they cannot be digested by human enzymes. Instead, the HMOs select for gut colonization by microbes beneficial to the infant, particularly species of the Gram-positive anaerobe Bifidobacterium. Bifidobacterium species have numerous benefits for infant digestion and development.
Bifidobacteria ferment by converting pyruvate to lactate (lactic acid fermentation) and thus avoid the gas production that is typical of Escherichia coli and related bacteria (fermentation pathways are discussed next). Gas from E. coli fermentation causes infant colic (abdominal pain). Besides decreasing colic, bifidobacteria also produce anti-inflammatory molecules and immunomodulators. In effect, the mother’s milk uses catabolic substrates to manipulate the composition of the infant gut microbiome for improved health. As we saw in Figure 13.13, the products of catabolism of many diverse substrates ultimately funnel into a few common pathways of metabolism. The remainder of this chapter presents key metabolic pathways in detail: glycolysis and other pathways of glucose catabolism, the TCA cycle, and the catechol pathway of benzoate catabolism. These pathways play key roles in medical microbiology and in industrial fields such as bioremediation.
To Summarize
Carbohydrates such as polysaccharides (glycans) are broken down to disaccharides, and then to monosaccharides. Sugars and sugar derivatives, such as amines and acids, are catabolized to pyruvate.
Pyruvate and other intermediary products of sugar catabolism are fermented by electron transfer from NADH to form fermentation products; or they are further catabolized to CO 2 and H 2 O through the TCA cycle (in the presence of a terminal electron acceptor).
Lipids, amino acids, and lignin are catabolized to acetate and other metabolic intermediates.
Catabolism yields products that may be used by a host or other organisms in the ecosystem.
Fermentation and respiration complete the process of catabolism. In fermentation, the catabolite is broken down to smaller molecules without an inorganic electron acceptor. Respiration requires a terminal electron acceptor such as O 2. Catabolism of complex substrates requires outer-membrane enzymes and transporters (Sus and Sus-like systems). Different bacteria contain homologous Sus or Sus-like complexes that fit different carbon sources.
Glossary
polysaccharide A polymer of sugars. See also glycan .
glycan A polysaccharide chain composed of oxygen-linked (O-linked) monosaccharides.
starch A glucose polymer in which an acetal (O–COH) of each glucose has condensed with a hydroxyl group of the next glucose, releasing H 2 O.
lignin A complex aromatic organic compound that forms the key structural support for trees and woody stems.
fermentation Also called fermentative metabolism. 1. The production of ATP via substrate-level phosphorylation, using organic compounds as both electron donors and electron acceptors. 2. Industrial fermentation is the production of microbial products that are made by microbes grown in fermentation vessels; it may include respiratory metabolism to maximize microbial growth.
respiration The oxidation of reduced organic electron donors through a series of membrane-embedded electron carriers to a final electron acceptor. The energy derived from the redox reactions is stored as an electrochemical gradient across the membrane, which may be harnessed to produce ATP.
anaerobic respiration The use of a molecule other than oxygen as the final electron acceptor of an electron transport chain.
human milk oligosaccharide (HMO)
A glycan secreted in milk by a lactating human.
13.4 Glucose Fermentation and RespirationUnit 4 · Metabolism
For microbes feasting on glycans, a major breakdown product is glucose. Glucose catabolism is important as a widespread source of energy, and also as a source of key substrates for biosynthesis, such as five-carbon sugars to build nucleic acids (discussed in Chapter 15 ). Blood plasma contains glucose, which pathogens can exploit. Glucose and related sugars are catabolized through a series of phosphorylated sugar derivatives. A common theme in sugar catabolism is the splitting of a six-carbon substrate into two three-carbon products. The three-carbon products may form two molecules of pyruvate: C H O → 2C H O + 4H (2 NADH + 2H +)
6 12 6 3 4 3
Under anaerobiosis—the prevailing condition of many microbial habitats—the pyruvate obtained from sugar breakdown must be converted to compounds that receive electrons from NADH, in order to restore the electron-accepting form NAD +. Different microbes reduce pyruvate to different end products of fermentation.
Alternatively, through respiration, NADH may reduce an electron acceptor such as oxygen or nitrate, allowing pyruvate to be broken down via the TCA cycle (discussed in Section 13.6).
Note: The carboxylic acid intermediates of metabolism exist in
equilibrium with their dissociated, or ionized, forms, identified by the suffix “-ate.” For example, lactic acid dissociates to lactate; acetic acid dissociates to acetate. We use the “-ate” terms for acids whose ionized form predominates under typical cell conditions (around pH 7).
To catabolize glucose, bacteria and archaea use three main routes to pyruvate (Fig. 13.15). Most species can switch among these pathways, depending on their current requirements for ATP or for substrates for biosynthesis.
FIGURE 13.15 ■ From glucose to pyruvate: three pathways. The Embden-Meyerhof-Parnas (EMP) pathway of glycolysis, the Entner-Doudoroff (ED) pathway, and the pentose phosphate pathway (PPP) catabolize carbohydrates by related but different routes.
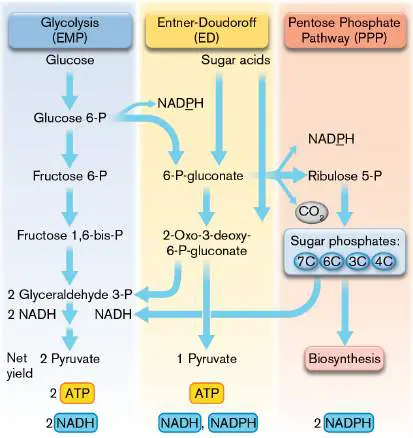
Glycolysis, or the Embden-Meyerhof-Parnas (EMP) pathway, in which glucose 6-phosphate isomerizes to fructose 6-phosphate, ultimately forming two molecules of pyruvate. EMP is used by many bacteria, eukaryotes, and archaea. From each glucose, the pathway generates net 2 ATP and 2 NADH.
Entner-Doudoroff (ED) pathway, in which glucose 6-phosphate is oxidized to 6-phosphogluconate, a phosphorylated sugar acid. Alternatively, sugar acids may be converted directly to 6-phosphogluconate. Sugar acids often derive from intestinal mucus, and the ED pathway is essential for enteric bacteria to colonize the intestinal epithelium. The ED pathway generates only 1 ATP, 1 NADH, and 1 NADPH.
Pentose phosphate pathway (PPP), also known as the pentose phosphate shunt (PPS), in which glucose 6-phosphate is oxidized to 6-phosphogluconate, and then decarboxylated to a five-carbon sugar (a pentose), ribulose 5-phosphate. The PPP produces sugars of three to seven carbons, which serve as precursors for biosynthesis or are converted to pyruvate as needed. The PPP generates 2 NADPH, the reducing cofactor most commonly associated with biosynthesis.
Glycolysis: The Embden-Meyerhof-Parnas Pathway
The Embden-Meyerhof-Parnas (EMP) pathway, or glycolysis, is the form of glucose catabolism most commonly studied in introductory biology; it is central for animals and plants, as well as many bacteria. In the EMP pathway, one molecule of D -glucose undergoes stepwise breakdown to two molecules of pyruvic acid (or its anion, pyruvate; Fig. 13.16). Glucose is broken down in two stages. In the first stage, the glucose molecule is primed for breakdown by two steps of sugar phosphorylation by ATP. Each ATP phosphotransfer step spends Gibbs free energy. The phosphoryl groups tag two sides of the glucose molecule for subsequent splitting into two three-carbon molecules of glyceraldehyde 3-phosphate (G3P).
FIGURE 13.16 ■ Substrate energy changes during the Embden-Meyerhof-Parnas pathway (glycolysis). Glucose is activated through two substrate phosphorylations by ATP. The breakdown of glucose to two molecules of pyruvate is coupled to net production of 2 ATP and 2 NADH. Phosphoryl groups are shown as P.
In the second stage, each glyceraldehyde 3-phosphate is oxidized by NAD + through steps leading to pyruvate. Each conversion of G3P to pyruvate forms 2 ATP—one ATP molecule from dephosphorylation of the substrate, and one from addition of inorganic phosphate. Because 2 ATP were spent originally to phosphorylate glucose, the net gain of energy carriers from each glucose is 2 NADH plus 2 ATP. Most of the conversion steps are associated with a small change in energy—so small that the sign of Δ G depends on the concentrations of substrates or products; thus, some individual steps are reversible. In the cytoplasm, however, as intermediate products form they are quickly consumed by the next step, so the pathway flows in one direction. The direction of flow is determined by the key irreversible reactions that consume ATP. These steps drive the pathway by spending energy.
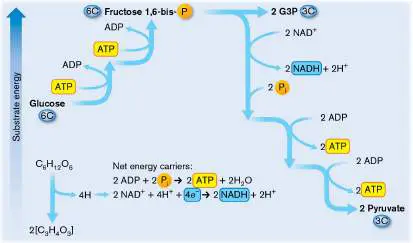
Phosphorylation and splitting of glucose. In the first stage of the EMP pathway, the six-carbon sugar is activated by two phosphorylation steps (Fig. 13.17, left). The first phosphoryl group (phosphate) is added at carbon 6 of glucose. (In some species of bacteria, the first phosphoryl group is added by phosphoenolpyruvate instead of ATP, but the net effect is the same.) The next enzyme-catalyzed step—rearrangement of glucose 6-phosphate to fructose 6-phosphate—involves no significant change in energy but prepares the sugar to receive the second phosphoryl group, forming fructose 1,6-bisphosphate.
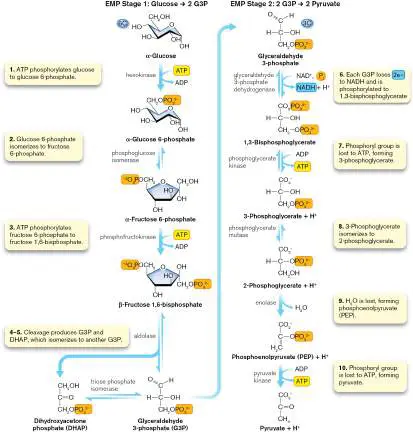
FIGURE 13.17 ■ Embden-Meyerhof-Parnas pathway (glycolysis).
The sugar then splits into two three-carbon sugars (trioses), each tagged with one of the two phosphates. The splitting of this molecule has a favorable entropy change (Δ S), but its enthalpy change (Δ H) is unfavorable, largely canceling out the energy yield. The two triose phosphates—glyceraldehyde 3-phosphate (G3P) and dihydroxyacetone phosphate (DHAP)—have nearly the same energy, so an enzyme interconverts them reversibly. Interconversion is necessary because only G3P proceeds further in the pathway.
Note: In Chapters 13–16, every substrate conversion shown
requires catalysis by an enzyme. For the EMP pathway, the enzymes are shown (see Fig. 13.17), but for other pathways, the enzyme names are omitted.
ATP generation. In the second stage of the EMP pathway, each three-carbon G3P is directed into an energy-yielding pathway to pyruvate (Fig. 13.17, right). First, the aldehyde (R–CHO) is converted to the carboxylate ion (R–COO −) plus H +. Conversion to a carboxylate releases a substantial amount of energy (negative Δ G ). This oxidation of the aldehyde represents the major source of energy in glycolysis—the step at which the energy obtained is used to transfer a pair of electrons onto NAD +, forming NADH (with an ionized H +). In addition, sufficient energy is released to add a phosphoryl group (from inorganic phosphate, P i) to the carboxylate, generating 1,3-bisphosphoglycerate.
In subsequent steps, the added phosphoryl group will be transferred to ADP, yielding net 1 ATP per pyruvate (2 ATP per glucose). The transfer of a phosphoryl group from an organic substrate to make ATP is called substrate-level phosphorylation. With subtraction of the initial two ATP molecules invested, the net energy carriers gained from each glucose molecule are as follows: 2 NAD + + 4 e − + 4H + → 2 NADH + 2H + 2 ADP + 2 P i → 2 ATP + 2H 2 O Regulation of glycolysis. Enzymes of catabolism are regulated at the level of transcription of the enzyme. In addition, the activities of certain enzymes in long pathways require allosteric regulation. Allosteric regulation by enzyme substrates and products ensures that excess intermediates do not build up, and it avoids releasing more energy than the cell can use at a given time. Glycolysis is regulated so that its reactions go forward only when the cell needs energy, not when the cell is trying to synthesize glucose. The regulation occurs at steps where the products are consumed so rapidly that their forward reaction is effectively irreversible. Irreversible steps are shown as unidirectional arrows in Figure 13.17.
Thought Question
13.7 Some bacteria make an enzyme, dihydroxyacetone kinase, that phosphorylates dihydroxyacetone to dihydroxyacetone phosphate (DHAP). How could this enzyme help the cell yield energy? Enzymes that catalyze irreversible steps are regulated so as to maintain consistent levels of intermediates in the pathway. The most important irreversible reaction in glycolysis is the phosphorylation of fructose 6-phosphate to fructose 1,6-bisphosphate, mediated by the enzyme phosphofructokinase. This enzyme is activated allosterically by ADP and inhibited by ATP or by the alternative phosphoryl donor, phosphoenolpyruvate.
What happens when the cell needs to reverse glycolysis in order to make glucose? Most of the intermediate reactions are reversible, so the same enzymes can be used for biosynthesis. Pathways that participate in both catabolism (breakdown) and anabolism (biosynthesis) are described as amphibolic.
The amphibolic pathway of glycolysis includes enzymes that can run in either direction, such as phosphoglucose isomerase. The direction of the pathway at a given time is determined by key enzymes that operate only in the catabolic direction or in the anabolic direction. For example, in glycolysis the ATP phosphorylation of fructose 6-phosphate is catalyzed by the enzyme phosphofructokinase, whereas in biosynthesis this step is reversed by a different enzyme, fructose bisphosphatase. Instead of regenerating ATP, fructose bisphosphatase removes the second phosphoryl group as inorganic phosphate—a step yielding energy and thus driving the whole pathway in reverse (toward biosynthesis of sugar). The two enzymes are regulated differently; the catabolic enzyme phosphofructokinase is activated by ADP, a signal of energy need, whereas the biosynthetic enzyme fructose bisphosphatase is inhibited by such signals.
The Entner-Doudoroff Pathway
The Entner-Doudoroff (ED) pathway offers a slightly different route to catabolize sugars, as well as sugar acids (sugars with acidic side chains). The ED pathway was originally studied for its role in production of the Mexican beverage pulque, or “cactus beer,” by Zymomonas fermentation of the blue agave plant. Later, Tyrrell Conway and colleagues at the University of Oklahoma discovered genes encoding the Entner-Doudoroff enzymes in the genomes of many bacteria and archaea. In the human colon, the ED pathway enables enteric bacteria to feed on mucus glycoproteins secreted by the intestinal epithelium. Some gut bacteria actually induce colonic production of the mucus that they consume. These bacteria that “farm” intestinal mucus enhance human health by preventing pathogen colonization and by stimulating the immune system. The ED pathway appears to have evolved earlier than the EMP pathway, because it involves fewer substrate phosphorylation steps and produces less ATP, and it is found in a wider range of prokaryotes. As in the EMP pathway, glucose is phosphorylated to glucose 6-phosphate (Fig. 13.18). The next step, however, involves oxidation by NADP + at carbon 1, with loss of two hydrogens to form 6-phosphogluconate, a sugar acid. Gluconate is also found in intestinal mucus; the sugar acid can be phosphorylated to enter the ED pathway.
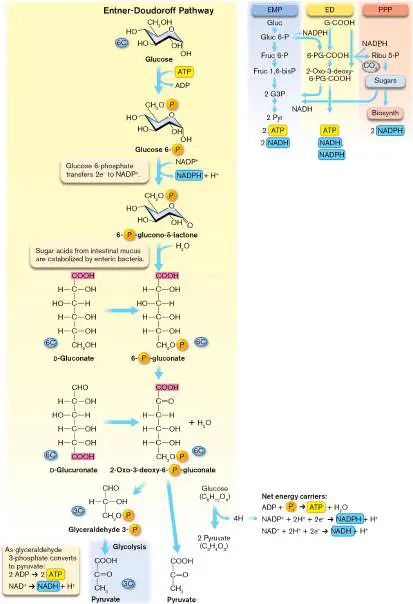
FIGURE 13.18 ■ Entner-Doudoroff pathway. Glucose 6-phosphate is oxidized to 6-phosphogluconate, with one pair of electrons transferred to NADPH. The 6-phosphogluconate is dehydrated and cleaved to form one pyruvate plus one glyceraldehyde 3-phosphate (G3P), which enters the EMP pathway to pyruvate.
During ED, the hydrogens and electrons from glucose 6-phosphate are transferred to NADP + instead of NAD + as in the EMP pathway. This step differs from the EMP pathway in two respects: The carrier used is NADP + instead of NAD +, and the electrons are transferred earlier, without a second ATP-consuming phosphorylation step. When the six-carbon substrate is eventually split into two three-carbon products, one of the three-carbon products is G3P, which enters the second stage of glycolysis (see Fig. 13.17). NADH is made, and 2 ATP are made by substrate-level phosphorylation. The remaining three-carbon product, however, is pyruvate. This one-step production of pyruvate short-circuits the catabolic pathway, missing the formation of an ATP. The unused potential energy is released as waste heat.
The net ATP gain from the Entner-Doudoroff pathway is only 1 ATP per molecule of glucose—half that of the EMP pathway (see Fig. 13.18, inset). The electrons transferred, however, are equivalent: Instead of 2 NADH, the Entner-Doudoroff pathway generates 1 NADH and 1 NADPH.
What is the significance of NADPH, compared to NADH? In most cases, NADH transfers electrons to the ETS to store energy, whereas NADPH is used for biosynthesis (see Chapter 15). Thus, enzymes for amino acid biosynthesis will use NADPH but not NADH. The ratio between NADH and NADPH enables cells to balance their need for energy with their need to build biomass.
Thought Question
13.8 Explain why the ED pathway generates only 1 ATP, whereas the EMP pathway generates 2 ATP. What is the consequence for cell metabolism?
The Pentose Phosphate Pathway
A third pathway of glucose catabolism is the pentose phosphate pathway (PPP), which forms the key intermediate ribulose 5-phosphate, a five-carbon sugar. The pentose phosphate pathway generates no NADH, but 2 NADPH for biosynthesis (Fig. 13.19). In addition, the PPP generates a complex series of intermediates that can be redirected as substrates for biosynthesis of diverse cell components such as amino acids and vitamins.
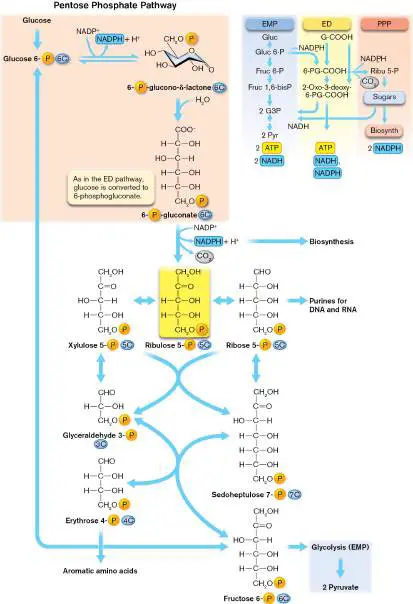
FIGURE 13.19 ■ Pentose phosphate pathway. Like the Entner-Doudoroff pathway, the pentose phosphate pathway forms 6-phosphogluconate. One CO 2 is released, and 2 NADPH are produced for biosynthesis. The pathway can generate ribose 5-phosphate for purine synthesis or erythrose 4-phosphate to synthesize aromatic amino acids.
Note: The PPP generates no ATP, except when some sugar
products transfer into the EMP.
The pentose phosphate pathway starts like the Entner-Doudoroff pathway: Glucose 6-phosphate gives up two electrons to form NADPH and is oxidized to 6-phosphogluconate. The next step involves a second oxidation by NADP +, with loss of a carbon as CO. The loss
2
of CO 2 generates the five-carbon sugar ribulose 5-phosphate (hence the pathway name “pentose phosphate”). In succeeding steps, pairs of sugars, such as sedoheptulose 7-phosphate and glyceraldehyde 3-phosphate, exchange short carbon chains, giving rise to sugar phosphates of various lengths; for example, ribose 5-phosphate and erythrose 4-phosphate, which are precursors of purines and aromatic amino acids, respectively. Alternatively, if these routes to biosynthesis are not taken, the intermediates convert to fructose 6-phosphate and reenter the EMP pathway, where ATP and NADH are produced.
Fermentation Completes Catabolism
None of the pathways from glucose to pyruvate constitute completed pathways of catabolism, because NADH (and for some pathways, NADPH) remains to be recycled. In the absence of oxygen or other electron acceptors, heterotrophic cells must transfer the hydrogens from NADH + H + back onto pyruvate or its breakdown products, forming partly oxidized fermentation products with the same redox level (balance of O and H) as the original glucose had (Table 13.5 ).
Fermentation
TABLE 13.5 Reactions in
Bacteria (Examples)
Reaction ATP Species of produced bacteria C 6 H 12 O 6 → 2CH 3 CH 2 OH 2 Zymomonas sp. + 2CO 2 [ethanolic] C 6 H 12 O 6 → 2CH 3 CH 2 2 Lactobacillus OCOO − + 2H + [lactate] acidophilus C 6 H 12 O 6 → CH 3 CH 2 OH 2 Leuconostoc + CO + CH CH OCOO − mesenteroides
2 3 2
+ H + [heterolactic] C 6 H 12 O 6 → succinate, 2-Varies Escherichia coli oxoglutarate, acetate, ethanol, formate, lactate, CO 2, H 2 [mixed-acid; equation unbalanced]
Fermentation
TABLE 13.5 Reactions in
Bacteria (Examples)
C 6 H 12 O 6 → butanol, Varies Clostridium acetone, butyric acid, acetobutylicum isopropanol, CO 2 [equation unbalanced] 2CH CH OCOO − (lactate) 3 Propionibacterium
3 2
→ CH (CH)COO − freudenreichii
3 2
(propionate) + CH COO − +
3
CO + 2H +
2
2C 2 H 2 (acetylene) + 3H 2 O 1 Pelobacter → CH 3 CH 2 OH + CH 3 COO acetylenicus − + H + 2 Citrate 3− + H + → 2 1 Providencia succinate 2− + CH COO − + rettgeri
3
2CO 2
Fermentation
TABLE 13.5 Reactions in
Bacteria (Examples)
CH 3 CHNH 2 COOH (alanine) 3 Clostridium + 2NH 2 CH 2 COOH (glycine) sporogenes + 2H O → 3CH COO − +
2 3
2NH + + CO [Stickland
4 2
reaction] COOH(CH) COO − 0 Propionigenium
2 2
(succinate) → CH (CH modestum
3 2
)COO − (propionate) + CO
2
[Na + → Na +]
in out
The “waste products” of fermentation retain much of their organic structure and food value. Their carbon-hydrogen bonds retain the ability to reduce oxygen, and their organic structures can be used for biosynthesis. Thus, fermentation products have proved extremely useful in human culture and technology (Fig. 13.20). For thousands of years, ethanolic fermentation by yeast has been used to produce wine and beer, while lactic acid fermentation has been used to produce yogurt and cheese (see Chapter 16). The minor product butyric acid (butyrate) lends taste to butter.
FIGURE 13.20 ■ Fermentation pathways. Alternative pathways from pyruvate and phosphoenolpyruvate to end products, many of which we use for food or industry. Different species conduct different portions of the pathways shown.
FOOD COLLECTION/SUPERSTOCK
AGE FOTOSTOCK/ALAMY STOCK PHOTO
LEE HACKER/ALAMY
D. HURST/ALAMY
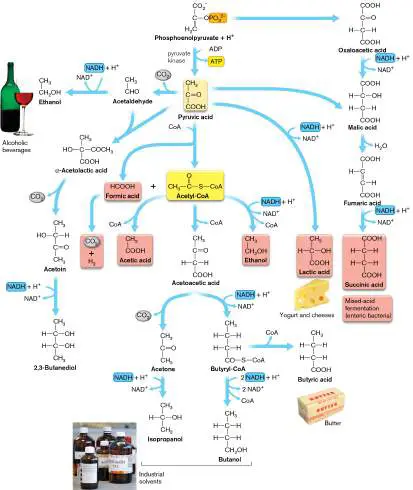
Lactic acid fermentation. In lactic acid fermentation, the pyruvate is converted to lactate by the addition of two electrons (with two hydrogen atoms) at the ketone, generating an alcohol group. The product, lactic acid, has a number of atoms (C 3 H 6 O 3) equal to half of the original glucose (C 6 H 12 O 6). Overall, one glucose is converted into two molecules of lactic acid: How does lactic acid fermentation yield energy to be stored as ATP? While two molecules of lactic acid contain the same number of atoms and electrons as those found in glucose, the molecular bonds are rearranged to form two carboxylic acids. The carboxylate/carboxylic acid has multiple states and increased entropy compared to the hydroxyl groups of glucose. Overall, glucose conversion releases free energy, and the reaction has a net negative value of Δ G. The ATP formation in such a reaction is substrate-level phosphorylation because it involves only substrate reactions—no proton pumping across membranes (discussed in Chapter 14).
Ethanolic fermentation. Alternative pathways of fermentation produce two molecules of ethanol plus two CO 2 molecules (ethanolic fermentation) or one lactic acid, one ethanol, and one CO 2 (heterolactic fermentation). Other kinds of fermentation are shown in
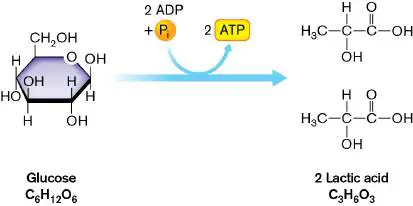
Table 13.5. In all cases, fermentation products must be excreted from the cell. The large quantities of substrate consumed in fermentation generate large amounts of waste products to be excreted. These bacterial wastes are actually useful to human “fermentation industries” such as the production of alcoholic beverages (ethanolic fermentation) or cheese (lactic acid fermentation).
Why do fermenting bacteria give up such large quantities of waste products that retain usable energy? The reason is that in the absence of oxygen (or another electron acceptor), the fermentation products cannot yield energy. Most fermentation pathways do not generate ATP beyond that produced by substrate-level phosphorylation, the direct transfer of a phosphoryl group from an organic phosphate to ADP. An example is the final step of glycolysis, catalyzed by pyruvate kinase (Fig. 13.17). Much of the energy available from glucose remains unspent or is lost as heat. Nevertheless, fermentation is essential for microbes in environments such as anaerobic soil or animal digestive tracts. Even aerated cultures of bacteria start fermenting once their demand for oxygen exceeds the rate at which oxygen dissolves in water. Microbes compensate for the low efficiency of fermentation by consuming large quantities of substrate and excreting large quantities of fermentation products. An advantage of fermentation is that the rapid accumulation of acids or ethanol can inhibit growth of competitors.
Mixed-acid fermentation. Numerous pathways have evolved to dispose of the waste in different forms (Fig. 13.20). Escherichia coli ferments by a combination of routes known collectively as mixed-acid fermentation, forming acetate, formate, lactate, and succinate, as well as ethanol, H 2, and CO 2. Hydrogen (H 2) and carbon dioxide (CO 2) are the main gases passed by the human colon. Colonic H 2 plus CO 2 from bacterial fermentation can yield further energy for methanogens, archaea that reduce CO 2 to methane (discussed in Chapter 14). Hydrogen and methane gases must be considered during medical procedures such as colonoscopy. When a polyp is removed from the colon by electrocautery (high-frequency electric current), the gas could ignite, causing an explosion. Colonic explosion is avoided by flushing out the gases before electrocautery. During mixed-acid fermentation, the proportions of products vary with pH. Low pH favors ethanol and lactate (which minimize acidification) over formate and acetate.
Clostridium species produce alcohols (butanol, isopropanol); Porphyromonas gingivalis, a cause of periodontal disease, produces short-chain acids (propionate, butyrate).
Many fermentation products share key intermediates, such as acetyl-CoA. Acetyl-CoA is a versatile two-carbon intermediate that serves as the “Lego block” of metabolism. The molecule consists of an acetyl group esterified to coenzyme A (CoA; Fig. 13.21), an important coenzyme whose discovery won Fritz Lipmann (1899–1986) the 1953 Nobel Prize in Physiology or Medicine. CoA has a thiol (SH) that exchanges its hydrogen for an acyl group, thus activating the molecule for transfer in various metabolic pathways. For example, the hydrogen of the SH group is transferred onto the carboxyl carbon of pyruvate, generating formate: FIGURE 13.21 ■ Structure of coenzyme A. The thiol (SH) forms a thioester link with the COOH of acetic acid, generating acetyl-CoA.
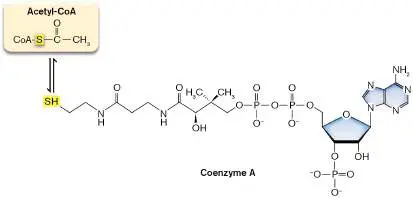
Acetyl-CoA can be converted to various fermentation products by several different pathways. The simplest is an exchange of water with CoA, forming acetate: CH CO—S-CoA + H O ⇌ CH COO − + H + + HS-CoA
3 2 3
Incorporation of water restores the hydrogen to the thiol of CoA, and the OH to acetate. The acetate thus formed may then be excreted by the cell.
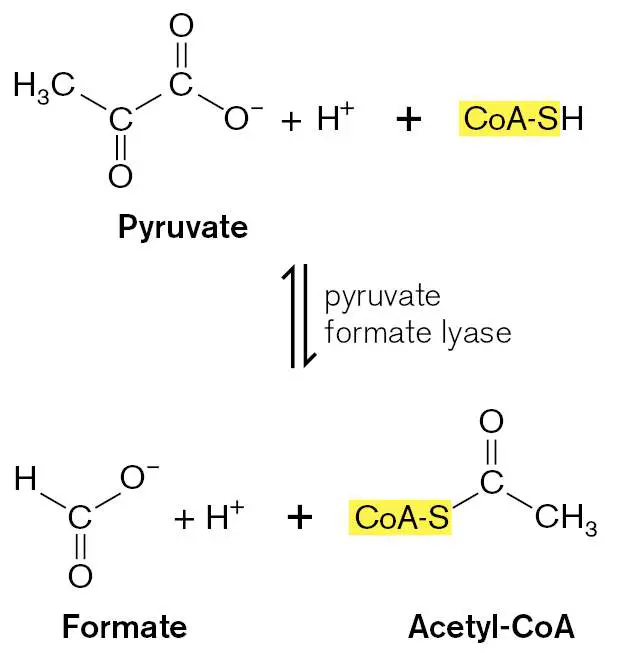
Note that the excreted acids and alcohols are readily recovered by cells when an electron acceptor becomes available for oxidation or when these fermentation products are needed as building blocks for biosynthesis. Alternatively, the excreted “wastes” may be utilized by other species capable of metabolizing them further. For example, the H 2 released by gut bacteria through mixed-acid fermentation can be oxidized to water by the gastric pathogen Helicobacter pylori. Alternatively, H 2 plus CO 2 can be used by gut methanogens to yield energy with release of methane.
In soil ecosystems, various other fermentations have evolved to utilize available substrates (Table 13.5). Clostridium species generate butanol and other solvents of great industrial value. Other species ferment pairs of amino acids, in a type of mechanism called the Stickland reaction. Fermenting a pair of amino acids avoids generating H 2 (a loss that would waste reduction potential) and produces as much as 3 ATP. By contrast, the succinate fermentation of Propionigenium modestum is an anaerobic reaction that proceeds with too small a Δ G value to generate a single ATP. Instead, the decarboxylation step (catalyzed by methylmalonyl-CoA decarboxylase) is coupled to the pumping of sodium ions across the cell membrane. The sodium pump stores energy (discussed in Chapter 14).
Industrial and Clinical Applications
In the chemical industry, microbial fermentation produces industrial solvents such as butanol and acetone. Acetone production had historic impact during World War I, when Britain needed a source of acetone to manufacture gunpowder. Acetone and butanol were produced as fermentation products by Clostridium acetobutylicum, a bacterium identified by the biochemist Chaim Weizmann (1874– 1952). Weizmann was a Russian-born Jew who helped the British government produce acetone via C. acetobutylicum fermentation. Weizmann later became the first president of Israel. Today, the fermentation process discovered in Clostridium species is used to convert industrial waste into ethanol fuels and chemicals such as ethanol, butanol, and glycerol.
Another important application of fermentation lies in diagnostic microbiology. To quickly identify the microbe causing a disease and prescribe an effective antibiotic, hospitals use rapid and inexpensive biochemical tests (see Chapter 28). A pH indicator added to growth media can detect the acid produced when a substrate is fermented, resulting in a color change (Fig. 13.22A). Phenol red is a pH indicator that is orange-red at neutral pH. It turns yellow in media acidified by fermentation acids (below pH 6.8) and red at higher pH (above pH 7.4). A culture of Escherichia coli, which ferments quickly, turns phenol red to a medium yellow after 24 hours.
FIGURE 13.22 ■ Clinical tests based on fermentation. A. Phenol red broth test with Durham tube. From left to right: An inoculated control is red; Escherichia coli gives acidic fermentation products (yellow) and a bubble of gas (CO 2 and H 2) in a Durham tube; a nonfermenter stays red; a fermenter without gas turns yellow, but forms no bubble. B. Sorbitol fermentation test for pathogen E. coli O157:H7. The pale colonies (strain O157:H7) failed to ferment sorbitol, unlike the red colonies (nonpathogenic E. coli).
W.W. NORTON & COMPANY, INC.
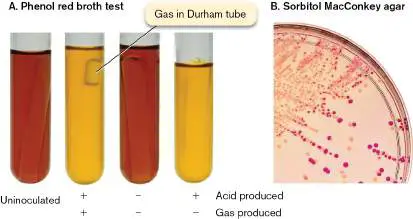
COURTESY OF © BECTON, DICKINSON AND COMPANY
More specific tests depend on the microbe’s ability to ferment specific sugars. Different species possess different enzymes able to convert different sugars and sugar derivatives into glucose, which then enters the common fermentation pathway. An example is the use of sorbitol MacConkey agar to test for E. coli O157:H7, a lethal pathogen contaminating beef and vegetables. The O157:H7 strain of E. coli has a set of virulence genes absent from nonpathogenic E. coli strains that are present among our normal colon biota. But the pathogen also happens to lack genes present in normal E. coli, such as a gene encoding an enzyme to ferment sorbitol. Thus, failure to ferment sorbitol indicates a high probability that the strain is E. coli O157:H7. On sorbitol MacConkey agar, bacteria that ferment sorbitol during growth produce acids. The acidity causes a dye to turn red (the opposite of the phenol red test). Failure to ferment sorbitol (observed as pale colonies) indicates a high probability of E. coli O157:H7 (Fig. 13.22B ).
The Tricarboxylic Acid Cycle
The products of sugar breakdown can be catabolized to CO 2 and H 2 O through the tricarboxylic acid (TCA) cycle. The TCA cycle generates molecules of NADH and FADH 2, which donate electrons to an electron transport system (ETS) with a terminal electron acceptor such as O 2 (see Chapter 14). But sugars are not the cycle’s only substrates. Lignins, fatty acids, and even polycyclic aromatic toxicants are degraded to acetyl-CoA and other products that enter the TCA cycle.
The TCA cycle is also known as the Krebs cycle, named for Hans Krebs (1900–1981), who shared the 1953 Nobel Prize in Physiology or Medicine with Fritz Lipmann. Krebs and his colleagues at Sheffield University, England, studied catabolism by observing the oxidizing activities of crude enzyme preparations from sources such as pigeon breast muscle, beef liver, and cucumber seeds. In all of these animal and plant tissues, the TCA cycle is conducted by mitochondria, using virtually the same process as their bacterial ancestors used.
Pyruvate Is Converted to Acetyl-CoA
Glucose catabolism connects with the TCA cycle through the breakdown of pyruvate to acetyl-CoA and CO 2. Recall from Figure 13.13that acetyl-CoA is also generated from many other catabolic pathways, including those for breakdown of fatty acids, amino acids, and lignin fragments in soil. Regardless of its source, acetyl-CoA enters the TCA cycle by condensing with the four-carbon intermediate oxaloacetate to form citrate (Fig. 13.23). Citrate undergoes two steps of oxidative decarboxylation, in which CO 2 is released. After each step, two hydrogens with electrons are transferred to make NADH + H + or FADH. The TCA cycle, in whole or in part, is found
2
in all microbial species except for degenerately evolved pathogens that are dependent on host metabolism, such as Treponema pallidum, the cause of syphilis.
FIGURE 13.23 ■ Acetyl-CoA feeds into the TCA cycle. Pyruvate undergoes oxidative decarboxylation and incorporates CoA to form acetyl-CoA. Depending on the state of the cell, either acetyl-CoA is converted to acetate for excretion or it enters the TCA cycle.
Thought Question
13.9 If a cell respiring on glucose runs out of oxygen and other electron acceptors, what happens to the electrons transferred from the catabolic substrates?
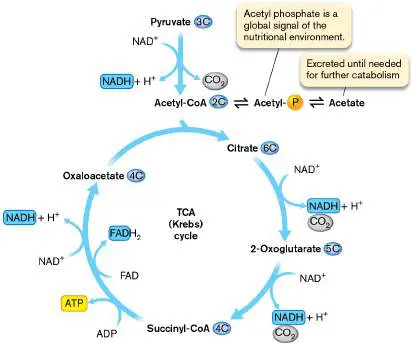
We present first the connecting step between pyruvate and acetyl-CoA, followed by the details of the TCA cycle. Bacteria and archaea use at least ten known variations on the TCA cycle, conducted by diverse species under various environmental conditions. You will no doubt be relieved to hear that we present only one: the Krebs pathway, which is found in most Gram-negative and Gram-positive bacteria, and in most eukaryotes. Other pathways are detailed in online resources such as the KEGG Pathway Database. The KEGG Pathway database (Kyoto Encyclopedia of Genes and Genomes) collects information on gene expression and metabolic interactions for all different kinds of cells.
Pyruvate is converted to acetyl-CoA through removal of CO 2 and transfer of 2 e − onto NAD +. The removal of CO and transfer of
2
two electrons is known as oxidative decarboxylation. The oxidative decarboxylation of pyruvate, coupled to CoA incorporation, is performed by an unusually large multisubunit enzyme called the pyruvate dehydrogenase complex, or PDC. PDC is a key component of metabolism in bacteria and mitochondria, the first molecular player to direct sugar catabolism into respiration. In human mitochondria, defects in PDC affect organs that have a high metabolic rate, such as the heart and brain, causing myocardial malfunction, heart failure, and neurodegeneration.
The overall reactions catalyzed by PDC are: The removal of stable CO 2 yields energy for the electron transfer to NADH. The protons dissociated from pyruvate and from the thiol (SH) of CoA (2H + in total) are balanced by the net gain of protons by NADH + H +.
The activity of PDC is increased by high concentrations of its substrates (CoA and NAD +) and inhibited by its products (acetyl-CoA and NADH). The product acetyl-CoA may enter one of several pathways. In E. coli, when glucose is plentiful, acetyl-CoA is mostly converted to acetate via the intermediate acetyl phosphate (Fig. 13.23). Acetyl phosphate is a global signaling molecule that indicates to the cell the quantity and quality of carbon source available. As glucose decreases, the cell starts to reclaim acetate, converting it back to acetyl-CoA for entry into the TCA cycle. At the level of gene expression, PDC responds to environmental conditions. As would be expected, PDC gene expression is repressed by carbon starvation and by low levels of oxygen.
Thought Question
13.10 Compare the reactions catalyzed by pyruvate dehydrogenase and by pyruvate formate lyase, the enzyme that converts pyruvate to products of mixed-acid fermentation (Fig. 13.20). What conditions do you think favor each reaction, and why?
Acetyl-CoA Enters the TCA Cycle
Recall that acetyl-CoA can participate in various fermentations (Fig. 13.20). But when a strong terminal electron acceptor is available (such as O 2), acetyl-CoA can enter the TCA cycle to transfer its electrons to electron carriers (Figs. 13.23 and 13.24 ). First, the acetyl group condenses with oxaloacetate, a four-carbon dicarboxylate (double acid). The condensation forms citrate, a six-carbon tricarboxylate. An advantage of intermediates with two or more acidic groups is that the concentration of the fully protonated form is extremely low; thus, the molecule is unlikely to be lost from the cell by diffusion across the membrane, as are monocarboxylic acids, such as acetate. Through the rest of the cycle, citrate loses two carbons as CO 2 by a series of reactions that transfer increments of energy to 3 NADH, 1 FADH 2, and 1 ATP. Each reaction step couples energy-yielding to energy-storing events (Fig. 13.24).
FIGURE 13.24 ■ The tricarboxylic acid (TCA) cycle. Acetyl-CoA derived from pyruvate and other catabolic pathways enters the TCA cycle. Green highlighting shows the fate of labeled acetate incorporated into the TCA cycle. Some forms of isocitrate dehydrogenase reduce NADP + instead of NAD +.
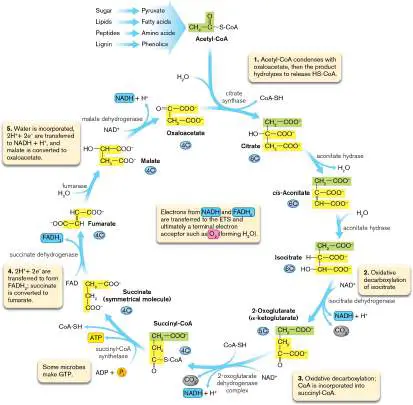
Step 1. As the acetyl group condenses with oxaloacetate, the product hydrolyzes and consumes a molecule of H 2 O to restore HS-CoA. The removal of HS-CoA yields energy to form citrate.
Step 2. Citrate undergoes two rearrangements (with little energy change) to form isocitrate. Isocitrate then undergoes oxidative decarboxylation. As we saw for pyruvate, removal of CO yields energy to transfer 2H + + 2 e − to form NADH
2
+ H +, producing 2-oxoglutarate (alpha-ketoglutarate).
Step 3. 2-Oxoglutarate undergoes decarboxylation to release CO and make another NADH + H +. In this case, CoA is
2
incorporated, making succinyl-CoA.
Step 4. Succinyl-CoA releases CoA, yielding energy to phosphorylate ADP to ATP. To form fumarate, 2H + + 2 e − are transferred to FAD to form FADH 2 —a reaction involving negligible free energy change. FAD is reduced instead of NAD + because electron donation from succinyl-CoA does not yield enough energy to reduce NAD +.
Step 5. Fumarate incorporates water across its double bond, forming the hydroxy acid malate. The increasing stability from fumarate to malate and from malate to oxaloacetate yields enough energy to form the final NADH + H +. Oxaloacetate is the original intermediate of the cycle, which again accepts the next acetyl-CoA.
Note: The enzyme succinyl-CoA synthetase catalyzes step 4 in the
TCA cycle (Fig. 13.24). In E. coli, the enzyme phosphorylates ADP to ATP, whereas in other bacteria GDP is phosphorylated to GTP. Human mitochondria have two enzymes, which form ATP and GTP, respectively (David Lambeth et al. 2004. J. Biol. Chem. 279 :36621).
Thought Question
13.11 Suppose a cell is radiolabeled briefly with 14 C-acetate (pulse-labeled, then chased with unlabeled acetate). Can you predict what will happen to the level of radioactivity observed in isolated TCA intermediates? Plot a curve showing your predicted level of radioactivity as a function of the number of rounds of the cycle. The TCA cycle and oxidative phosphorylation. In all, each acetate generates 3 NADH molecules, 1 FADH 2, and 1 ATP; and all the carbons from pyruvate (ultimately from glucose) are released as waste CO 2. From the standpoint of the carbon skeleton, the glucose breakdown is now complete. But do we have a completed metabolic pathway? No, because all of the NADH and FADH 2 need to be recycled by donating their electrons onto a terminal electron acceptor.
The process of electron transfer from NADH and FADH 2 is mediated by the electron transport system (ETS; discussed in Chapter 14). In the ETS, electrons are transferred from reduced proteins and cofactors to more oxidized proteins and cofactors, as in the examples in Table 13.4. Some of the membrane proteins use the energy of electron transfer to pump protons, generating a gradient of hydrogen ions across the membrane (Fig. 13.25).
FIGURE 13.25 ■ Complete oxidation of glucose. Glucose catabolism generates ATP through substrate-level phosphorylation and through the electron transport system’s pumping of H + ions to drive the ATP synthase (details in Chapter 14). The complete oxidative breakdown of glucose to CO 2 and H 2 O could theoretically generate up to 38 ATP. Under actual conditions, the number is smaller.
Note: The electron transport system (ETS) and the proton motive
force (PMF) are discussed in detail in Chapter 14.
Assuming a theoretical maximum yield of 3 ATP generated per NADH and 2 ATP per FADH 2, the hydrogen ion gradient then drives the membrane ATP synthase to synthesize as many as 34 ATP.
Another 4 ATP come from glucose breakdown and the TCA cycle (38 total per glucose). Under actual conditions, however, bacteria make less ATP; about 20 ATP per glucose are made by a well-aerated culture of E. coli. Bacterial cells make trade-offs for flexibility,
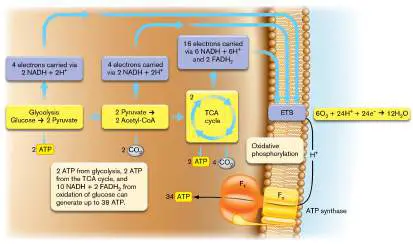
spending energy to maintain a stable proton potential during extreme changes in external pH and redox levels.
The process of electron transport and ATP generation is termed oxidative phosphorylation. Oxidative phosphorylation from a catabolized organic substrate is a form of respiration. The overall equation for the aerobic respiration of glucose is: C 6 H 12 O 6 + 6H 2 O + 6O 2 → 12H 2 O + 6CO 2 Glucose respiration can generate a relatively large number of ATPs per glucose—far more than fermentation can. In bacteria, however, the actual number of ATP molecules generated varies widely with availability of carbon source and oxygen. For example, as oxygen decreases in the environment, the ability to oxidize NADH decreases, so the cell may make only 1 or 2 ATP per NADH (discussed in Chapter 14). In addition, the enzymes of the TCA cycle are regulated extensively by substrate activation and product inhibition, and their expression is induced by high levels of oxygen and glucose. Glyoxylate bypass. What happens when glucose is scarce and cells need carbon both for energy and for biosynthesis? Bacteria may catabolize lipids instead of glucose, breaking down the fatty acids into acetyl-CoA for the TCA cycle. But oxygen may be limited, and carbons would be lost as CO 2. Some bacteria can switch to using a modified TCA cycle called the glyoxylate bypass (Fig. 13.26A). The glyoxylate bypass cycle enables bacteria to obtain energy from fatty acids and other sources of acetyl-CoA without losing the carbons as CO 2; instead, the acetyl groups are used to build biomass. For example, lung pathogens such as Pseudomonas aeruginosa and Mycobacterium tuberculosis catabolize fatty acids using the glyoxylate bypass.
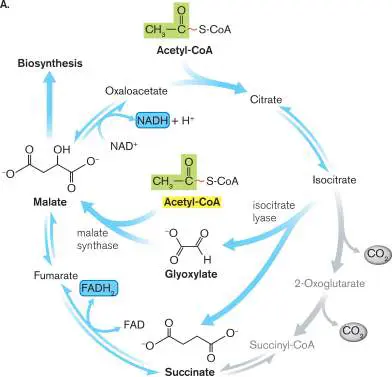
FIGURE 13.26 ■ The glyoxylate bypass incorporates a second acetyl-CoA. A. Instead of releasing two CO 2, the glyoxylate bypass incorporates a second molecule of acetyl-CoA,
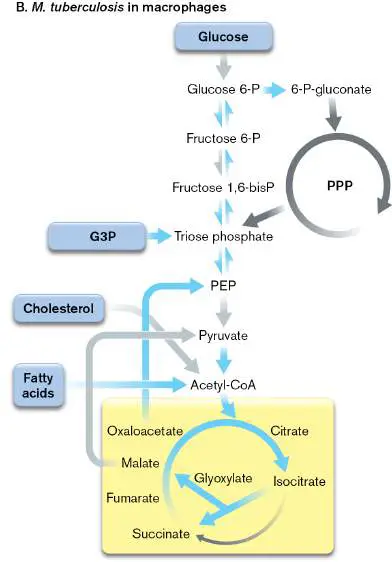
producing succinate plus malate. B. The glyoxylate bypass in the metabolism of Mycobacterium tuberculosis growing within mouse macrophages. For glucose biosynthesis, some glycolytic enzymes act in reverse.
The glyoxylate bypass consists of two enzymes that divert isocitrate to glyoxylate and then incorporate a second acetyl-CoA to form malate. The malate can then regenerate oxaloacetate to complete the bypass cycle, donating 2 e − to form NADH. The net reaction is: 2 Acetyl-CoA + oxaloacetate + NAD + → succinate + malate + 2 CoA + NADH + H + Alternatively, malate or oxaloacetate can be diverted into biosynthesis of glucose (gluconeogenesis)—a pathway that reverses much of glucose catabolism (see Chapter 15). Most bacteria need sugar biosynthesis to build their cell walls.
The glyoxylate bypass cuts out all loss of CO 2 and electron transfer to energy carriers, with the exception of 1 FADH 2 and possibly 1 NADH from malate to oxaloacetate. Thus, limited energy is released, but two carbons can be diverted to biosynthesis. Figure 13.26B shows how M. tuberculosis uses the glyoxylate bypass. Persistent intracellular M. tuberculosis catabolizes host lipids via the glyoxylate bypass, diverting much of the carbon to build sugars and amino acids for bacterial cell growth. Thus, key enzymes of the glyoxylate bypass, and their regulators, offer targets for new antibiotics.
The TCA cycle for amino acid biosynthesis. Analysis of pathway evolution indicates that the TCA cycle originally evolved to provide substrates for building amino acids (see Chapter 15). For example, the TCA cycle intermediate 2-oxoglutarate (alpha-ketoglutarate) is aminated to form glutamate, which leads to glutamine. The amine group comes from an ammonium ion. (The various sources of nitrogen for biosynthesis are discussed in Chapter 15.) Oxaloacetate is aminated to form aspartate, which enters pathways to purines and pyrimidines. The TCA cycle, like glycolysis, is an amphibolic pathway that provides substrates for biosynthesis. Many bacteria use the TCA cycle and glycolytic enzymes to build their sugars and amino acids. Others, such as Treponema pallidum, the cause of syphilis, have lost the TCA cycle by reductive evolution. These pathogens must obtain amino acids synthesized by their host.
To Summarize
Embden-Meyerhof-Parnas (EMP) pathway: Glucose is activated by two substrate phosphorylations, and then cleaved to two three-carbon sugars. Both sugars eventually are converted to pyruvate. The pathway produces 2 ATP and 2 NADH.
Entner-Doudoroff (ED) pathway: Glucose is activated by one phosphorylation, and then dehydrogenated to 6-phosphogluconate. Alternatively, gluconates are obtained from intestinal mucus. 6-Phosphogluconate is cleaved to pyruvate and a three-carbon sugar, which enters the EMP pathway to form pyruvate. The ED pathway produces 1 ATP, 1 NADH, and 1 NADPH.
Pentose phosphate pathway (PPP): Glucose is dehydrogenated to 6-phosphogluconate, and decarboxylated to ribulose 5-phosphate. A series of intermediate sugars may serve as substrates for biosynthesis. The PPP may produce 2 NADPH.
Fermentation is the completion of catabolism without the electron transport system and a terminal electron acceptor. The electrons from NADH are restored to pyruvate or its products in reactions that generate fermentation products, including alcohols and carboxylates, as well as H 2 and CO 2. Energy is stored in the form of ATP from substrate phosphorylation.
Fermentation has applications in food, industrial, and diagnostic microbiology.
The pyruvate dehydrogenase complex (PDC) removes CO 2 from pyruvate, generating acetyl-CoA. PDC activity is a key control point of metabolism, induced when carbon sources are plentiful, and repressed under carbon starvation and low oxygen.
Acetyl-CoA enters the TCA cycle by condensing with oxaloacetate to form citrate. A series of enzymes sequentially removes carbon dioxide and water molecules and generates 3 NADH, 1 FADH 2, and 1 ATP. Each reaction step couples energy-yielding to energy-storing events. A terminal electron acceptor such as O 2 must receive electrons. The glyoxylate bypass provides a way to gain limited energy from the TCA cycle while avoiding CO 2 loss. The bypass diverts intermediates to sugar biosynthesis.
Glossary
glycolysis Also called Embden-Meyerhof-Parnas (EMP) pathway. The catabolic pathway of glucose oxidation to pyruvate, in which glucose 6-phosphate isomerizes to fructose 6-phosphate, ultimately yielding 2 pyruvate, 2 ATP, and 2 NADH.
Embden-Meyerhof-Parnas (EMP) pathway See glycolysis .
Entner-Doudoroff (ED) pathway A glycolytic pathway in which glucose 6-phosphate is initially oxidized to 6-phosphogluconate, and ultimately yields 1 pyruvate, 1 ATP, 1 NADH, and 1 NADPH.
pentose phosphate pathway (PPP) or pentose phosphate shunt (PPS) An alternate glycolytic pathway in which glucose 6-phosphate is first oxidized and then decarboxylated to ribulose 5-phosphate, ultimately generating 2 NADPH.
Embden-Meyerhof-Parnas (EMP) pathway See glycolysis .
glycolysis Also called Embden-Meyerhof-Parnas (EMP) pathway. The catabolic pathway of glucose oxidation to pyruvate, in which glucose 6-phosphate isomerizes to fructose 6-phosphate, ultimately yielding 2 pyruvate, 2 ATP, and 2 NADH.
substrate-level phosphorylation The formation of ATP by the enzymatic transfer of a phosphoryl group from a substrate molecule onto ADP.
amphibolic Describing a metabolic pathway that is reversible and can be used for both catabolism and anabolism.
Entner-Doudoroff (ED) pathway A glycolytic pathway in which glucose 6-phosphate is initially oxidized to 6-phosphogluconate, and ultimately yields 1 pyruvate, 1 ATP, 1 NADH, and 1 NADPH.
pentose phosphate pathway (PPP) or pentose phosphate shunt (PPS) An alternate glycolytic pathway in which glucose 6-phosphate is first oxidized and then decarboxylated to ribulose 5-phosphate, ultimately generating 2 NADPH.
ribulose 5-phosphate The five-carbon sugar ribulose, phosphorylated at carbon 5. lactic acid fermentation A fermentation reaction that generates lactic acid from reduction of pyruvic acid.
ethanolic fermentation Also called alcoholic fermentation. A fermentation reaction yielding 2 ethanol and 2CO 2 as products.
mixed-acid fermentation A bacterial fermentation process in which pyruvate is converted to several different organic acids, as well as ethanol, CO 2, and H 2 O.
coenzyme A (CoA)
A nonprotein cellular organic molecule that can carry acetyl groups and participates in metabolism.
Stickland reaction An energy-yielding reaction between two amino acids in which one oxidizes the other. The reaction typically produces short organic acids plus 2NH +; it may also produce CO and H.
4 2 2
tricarboxylic acid (TCA) cycle Also called Krebs cycle. A metabolic cycle that catabolizes the acetyl group from acetyl-CoA to 2CO 2 with the concomitant production of NADH, FADH 2, and ATP.
PDC The multisubunit enzyme that couples the oxidative decarboxylation of pyruvate, forming acetyl-CoA and NADH. PDC The multisubunit enzyme that couples the oxidative decarboxylation of pyruvate, forming acetyl-CoA and NADH. oxidative phosphorylation A process of an electron transport chain that uses diatomic oxygen as a final electron acceptor and generates a proton gradient across a membrane for the production of ATP via ATP synthase.
respiration The oxidation of reduced organic electron donors through a series of membrane-embedded electron carriers to a final electron acceptor. The energy derived from the redox reactions is stored as an electrochemical gradient across the membrane, which may be harnessed to produce ATP.
glyoxylate bypass An alternative to the tricarboxylic acid cycle in which isocitrate is converted to glyoxylate and then malate; induced under low glucose conditions.
13.5 Our Gut Microbiome: Friends with BenefitsUnit 4 · Metabolism
Catabolism enables microbes to obtain energy for their own cellular processes. But what happens to the catabolites, the bacterial waste products of catabolism? The catabolites of a microbial community such as our gut microbiome can be useful to other microbial members. And they serve remarkable functions for their host. For example, the breakdown and remodeling of peptidoglycan releases fragments called “muropeptides” consisting of a wall disaccharide (N -acetylglucosamine– N -acetylmuramic acid) plus a short peptide used to form cross-bridges (discussed in Chapter 3). These muropeptides stimulate the immune system and modulate neural activity of the brain. In mice, muropeptide detection by the hypothalamus can regulate feeding behavior.
Bacterial catabolites include molecules that serve the host as neurotransmitters, such as 4-aminobutanoic acid (GABA). GABA is famous for regulating human anxiety and depressive illness. Yet a major source of our GABA comes from gut bacterial catabolism of glutamic acid (Fig. 13.27). Other bacterial catabolites such as histamine serve as immune modulators that develop our immune system (discussed in Chapters 23 and 24).
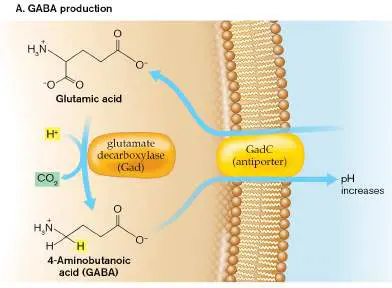
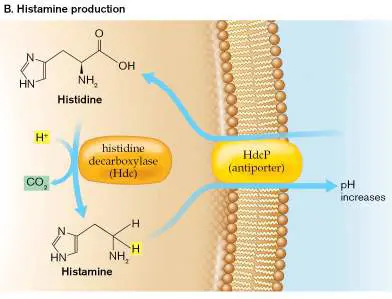
FIGURE 13.27 ■ Bacterial amino-acid decarboxylases produce catabolites with key functions in the brain and the immune system. A. Glutamate decarboxylase produces GABA (a neurotransmitter), which is exported by a glutamate/GABA antiporter. B. Histidine decarboxylase produces histamine, which is exported by a histidine/histamine antiporter.
Amino Acid Decarboxylation Produces Neurotransmitters and Immune Modulators
Peptides and amino acids in our diet are important for our own protein synthesis, but they also are catabolized by microbes. Our gut bacteria catabolize amino acids by fermentation that involves removal of either the amino group or the carboxylate.
Decarboxylation of amino acids consumes a proton and forms an organic amine (Fig. 13.27). The amine is generally exported by an antiporter that exchanges the amino acid substrate for the exported amine. Thus, the overall reaction removes acid. Hope Richard and John Foster at the University of South Alabama showed how decarboxylation of glutamate and arginine is induced by extreme acid, producing the neurotransmitters GABA and agmatine, respectively. Thus, bacteria passing through the stomach produce our neurotransmitters. GABA binds inhibitory synapses in neurons of the intestine and other organs. In the brain, GABA modulates pain reception, brain development, and behavior.
Could bacteria that produce GABA serve as a probiotic to control pain? James Versalovic and colleagues at Baylor University tested this question in a rat model for abdominal pain. The rats, which show overstimulation of pain neurons, received a daily dose of Bifidobacterium dentium, a GABA-producing species. The rats treated with B. dentium showed decreased activity of pain sensory neurons— but only if the bacteria administered had a functional gadB gene, encoding glutamate decarboxylase. Thus, GABA-producing bacteria might be developed for probiotic analgesia. Could GABA-producing bacteria modulate our brain chemistry, and even our behavior? For fascinating experiments, see Special Topic 13.
Another bacterial catabolite with great importance to our bodies is histamine, formed by decarboxylation of histidine (Fig. 13.27B ). Histamine is an inflammatory mediator for the innate immune system (discussed in Chapter 23). Histamine-producing bacteria, such as Lactobacillus species, may serve as probiotics to suppress chronic intestinal inflammation.
SPECIAL TOPIC 13 Gut Bacteria Guide Host Behavior
Bacteria export GABA as a fermentation product, one of the most important mammalian neurotransmitters. Could gut bacteria actually regulate development and function of the brain? James Versalovic and colleagues at Baylor University tested this question, starting with germ-free mice (Fig. ST 13.1 ). Mice reared without microbes are known to show many defects in behavior, including motor performance, anxiety, and memory. So Versalovic’s team generated three classes of mice: germ-free mice raised to adulthood, germ-free mice with a conventional microbiome restored after birth, and germ-free mice colonized by four strains of Bifidobacterium prominent in the microbiomes of normal human infants. The bifidobacteria decarboxylate glutamate to GABA, suggesting a possible biochemical mechanism for the bacteria to affect the brain during early development.
FIGURE ST 13.1 ■ James Versalovic compared behaviors of germ-free mice with those of mice colonized postnatally with conventional microbiota or with infant-associated bifidobacteria. A. James Versalovic. B. Fluorescence micrographs of murine colon sections labeled with Bifidobacterium -specific ribosomal RNA (rRNA)-hybridizing probe (red) or with a universal bacterial probe (green). Blue label (DAPI) indicates mouse chromosomes. White arrows indicate examples of probe-identified bacteria.
DR. JAMES VERSALOVIC
B. LUK ET AL. 2018. PLOS ONE 13 :E0196510, FIG. 2A
Figure ST 13.1B shows sections of mouse colon colonized by bifidobacteria or by conventional mouse gut bacteria. Staining by FISH (fluorescence in situ hybridization) labels a DNA sequence specific to the genus Bifidobacterium (red) or to a general bacterial sequence of 16S rRNA (green).
The researchers found that postnatal introduction of either the human infant–associated bifidobacteria or a conventional mouse microbiome significantly improved several types of behavior, including motor function, anxiety response, and recognition memory. Figure ST 13.2 shows the setup and data from an experiment testing recognition memory (the ability to distinguish a novel object from a familiar one). In this experiment, each mouse is presented with a familiar object and a novel object. A camera then records the amount of time the mouse spends exploring each object; normally, mice spend more
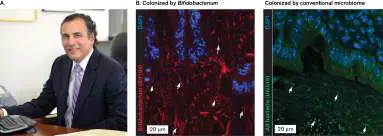
time exploring an object that is novel. Figure ST 13.2B shows the results for the three treatment groups: the germ-free mice, the mice with a conventional microbiome restored after birth, and germ-free mice colonized by infant-type Bifidobacterium species.
FIGURE ST 13.2 ■ Bifidobacteria or conventional microbiome restores memory deficit in germ-free mice. A. Training setup: Each mouse is introduced to a pair of familiar objects or a familiar object plus a novel object. B. Germ-free mice spend equal time around the familiar and novel objects, whereas mice colonized with a conventional microbiome or with bifidobacteria spend more time exploring the novel object. Color scale indicates time spent in position, from zero (blue) to 5 seconds (red).
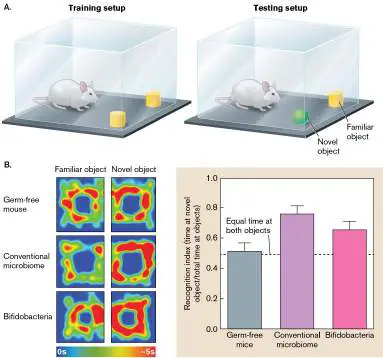
B. LUK ET AL. 2018. PLOS ONE 13 :EO196510
What were the results? The mice with conventional microbiomes or with infant-type bifidobacteria-only microbiomes spent more time exploring the novel object, whereas germ-free mice explored both objects equally, as if they had seen neither before. This result and results from experiments testing other behaviors are consistent with a role for gut bacterial catabolism in mammalian development. It remains to be seen how much of our brain function comes from our gut.
RESEARCH QUESTION
The authors speculate that GABA produced by metabolism mediates the effect of bifidobacteria on the behaviors of germ-free mice. Can you propose an experiment to test this hypothesis?
Luk, Berkley, Surabi Veeraragavan, Melinda Engevik, Miriam
Balderas, Angela Major, et al. 2018. Postnatal colonization with human
“infant-type” Bifidobacterium species alters behavior of adult gnotobiotic mice. PLoS One 13 :e0196510.
Short-Chain Fatty Acids from Fermentation Have Many Host Benefits
As we saw in Figure 13.20, carbohydrate fermentation produces many catabolites that are short-chain fatty acids (SCFAs). Particularly prominent catabolites are acetate, propionate, and butyrate. These molecules are produced in quantity from catabolism of complex fibers, but their production is decreased by high-fat, high-protein diets. SCFAs have numerous positive functions in our bodies, although the mechanisms are poorly understood (Fig. 13.28).
In the human intestine and colon, SCFAs are largely made by obligate anaerobes. Acetate and propionate are commonly made by Bacteroidetes bacteria, as well as by Firmicutes such as Lactobacillus and Bifidobacterium and Verrucomicrobia such as Akkermansia. Butyrate is made by Firmicutes such as Clostridium and Faecalibacterium. Overall, the gut SCFAs are associated with maintenance of intestinal balance and prevention of inflammatory bowel diseases (IBDs) such as ulcerative colitis and Crohn’s disease. These molecules are absorbed by cells of the intestinal epithelium, where they regulate cell proliferation and differentiation. They regulate hormones such as nerve growth factor and pituitary growth hormone. Kimberly Krautkramer in Fredrik Bäckhed’s laboratory at the University of Gothenburg has shown how SCFAs can activate histone acetylation leading to epigenetic regulation of human gene expression, with unknown health effects (Fig. 13.28).
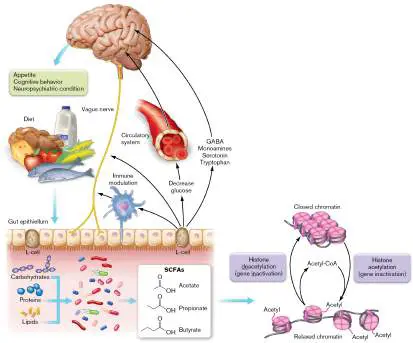
FIGURE 13.28 ■ Short-chain fatty acids are associated with many positive functions for the brain and the immune system. SCFAs produced by bacterial fiber catabolism have many effects on the brain and immune system.
While molecular mechanisms remain poorly understood, clinical studies link SCFA depletion with a startling array of human disorders. SCFA depletion may have roles in Alzheimer’s disease, mood disorders (anxiety and depression), Parkinson’s disease, autism spectrum disorder, and amyotrophic lateral sclerosis (ALS). SCFA enhancement may improve therapy for type 2 diabetes and obesity, as these molecules activate brain receptors involved in appetite control (discussed in Chapter 23).
Metabolomics: Discovery of Complex Metabolic Systems
The contributions of bacterial catabolites to human medicine are at the forefront of current research. But how do we investigate such complex systems—a myriad of different microbes making thousands of unknown products?
Metabolomics is the study of metabolic pathways and metabolites (catabolites as well as products of biosynthesis) that are found within microbial communities. Metabolomic investigations involve several stages that draw on methods from various fields of biochemistry, computation, microbial culture, and host animal physiology. Typically, a large group of researchers will collaborate, as in the laboratory of Justin Sonnenburg and Erica Sonnenburg at Stanford University (Fig. 13.29). While we celebrate the unique contributions of individual scientists, we recognize that many innovations arise from collaborative groups where individuals share their diverse talents and expertise.
FIGURE 13.29 ■ Laboratory research group of Justin Sonnenburg and Erica Sonnenburg. The group explores gut microbial metabolism and products for potential therapeutic agents.
COURTESY OF SONNENBURG LAB
The Sonnenburg lab devised a “pipeline”: a series of procedures for defining the roles of community metabolites (Fig. 13.30). A metabolomics pipeline requires construction of a reference library of small molecules found in microbial environments, such as amino acids and vitamins and modified forms of these (Fig. 13.30A). The library enables compound identification on the basis of mass spectrometry data.
In mass spectrometry, a beam of electrons bombards a sample, leading to a breakdown pattern of ions. The ion abundance (amount formed) as a function of mass-to-charge ratio (m/z) generates a spectrum unique to a particular molecule (MS1 in Fig. 13.30B ). The major ions can then be subjected to secondary bombardment for further data on the structure (MS-MS), a process known as “tandem
mass spectrometry.” An example of a molecule with a distinctive mass spectrum is 3-indolepropionic acid, a product of tryptophan formed by certain Gram-positive species of the gut microbiome. This product has antioxidant and anti-inflammatory properties for host animals.
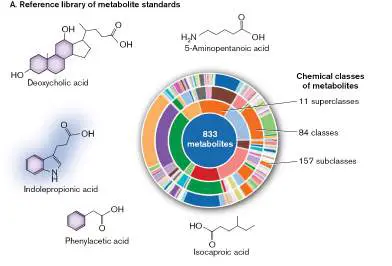
FIGURE 13.30 ■ A metabolomics pipeline for metabolites of gut microorganisms. A. A reference library of metabolites and their spectral data enables identification of microbial products. B. Unknown isolated products are analyzed by tandem mass spectroscopy. The first stage of mass spectroscopy (MS1) reveals the molecular mass of the major ion (most abundant part of the molecule). The second stage (MS/MS) measures the mass of various ions from breakdown of the peak ion in the primary spectrum, and it then compares the breakdown pattern with reference spectra. The proposed molecule is then tested for function in various organisms cultured from the gut.
S. HAN ET AL. 2021. NATURE 595: 415–420
S. HAN ET AL. 2021. NATURE 595: 415–420
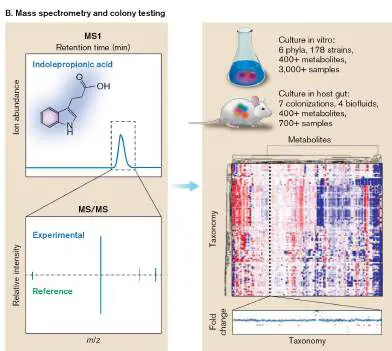
The metabolites library is then used to test prominent gut microorganisms for their range of metabolic products. To do this requires isolation and culture, often based on novel approaches for culturing species thought to be unculturable (discussed in Chapter 4 and Chapter 21). The Sonnenberg lab selected 178 strains and cultured them across multiple kinds of media providing various kinds of catabolic substrates (such as sugars versus amino acids). For each strain cultured on each medium, a profile of products was obtained, and major products were identified by tandem mass spectrometry. This approach generated a data set of metabolomic profiles for bacteria known in the human gut microbiome. Comparison of metabolomic profiles revealed strains and culture conditions that led to production of molecules with medically significant effects. For example, Enterococcus species were shown to produce high levels of tyramine, a tryptophan catabolite that modulates host neurological functions.
To Summarize
Gut microbial catabolism provides products that function in the human body.
Amino acid decarboxylation produces neurotransmitters. Bacterial production of GABA and agmatine may regulate sensory neurons and may influence brain function and development.
Bacterial histamine modulates the immune system.
Short-chain fatty acids (SCFAs) include acetate, propionate, and butyrate. These acids are produced via fermentation by Bacteroidetes, Firmicutes, and other bacteria. SCFAs activate host neural modulators and immune regulators. SCFA depletion is associated with inflammatory bowel diseases and type 2 diabetes, and possibly with numerous neurological disorders.
Metabolomics is the study of metabolic pathways and metabolites within a microbial community. Metabolomic investigation requires pipelines of reference libraries with products identified by mass spectrometry. Gut microbial isolates are cultured and their metabolomes discovered, revealing compounds with novel medical properties.
Glossary
catabolites The products of catabolism, usually excreted from the cell. metabolomics The study of the overall collection of small molecules (metabolites) within a cell.
Figure 13.20 FIGURE 13.20 ■ Fermentation pathways. Alternative pathways from pyruvate and phosphoenolpyruvate to end products, many of which we use for food or industry. Different species conduct different portions of the pathways shown.
FOOD COLLECTION/SUPERSTOCK
AGE FOTOSTOCK/ALAMY STOCK PHOTO
LEE HACKER/ALAMY
D. HURST/ALAMY
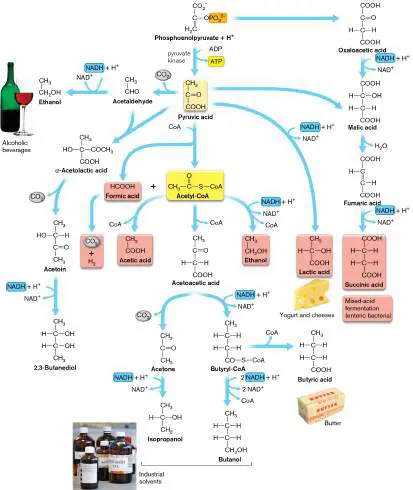
13.6 Aromatic Catabolism and SyntrophyUnit 4 · Metabolism
The TCA cycle, presented in Section 13.4, plays essential roles in the catabolism of sugars, lipids, and amino acids. It also enables microbial breakdown of some of our environment’s hardest-to-digest molecules: those containing aromatic carbon structures such as the benzene ring.
Catabolism of Benzene Derivatives
Natural sources of aromatic carbon include lignin from wood and polycyclic aromatic hydrocarbons (PAHs) from petroleum. Aromatic components of petroleum cause much of the environmental damage during oil spills such as the Deepwater Horizon spill in the Gulf of Mexico in 2010. Soil is often polluted by industrial aromatic compounds, such as nitrate explosives, aniline dyes, and the solvent toluene. Even the most remote places on Earth, such as Antarctica, show such pollution.
To remove aromatic pollutants from water and soil, we depend on microbial catabolism. Aromatic molecules are notoriously hard to break down because of the stability of the benzene ring. The benzene ring breaks down slowly, but over time, bacteria and fungi catabolize a wide range of aromatic molecules. Figure 13.31shows an example of research to study microbial digestion of phenanthrene (a tricyclic PAH) in the soil of Antarctica. Because the Antarctic Treaty forbids introduction of exogenous organisms, any bioremediation of pollutants must be accomplished by microbes that are native to Antarctica.
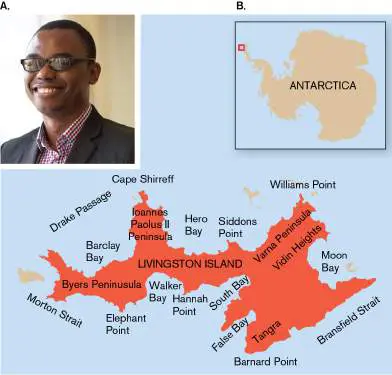
FIGURE 13.31 ■ Phenanthrene bioremediation by Antarctic psychrotrophs. A. Uchechukwu Okere, environmental microbiologist. B. Livingston Island, Antarctic Peninsula. C. Phenanthrene is broken down to CO 2 by indigenous psychrotrophs. Source: Uchechukwu Okere et al. 2012. FEMS Microbiol. Lett. 329: 69.
COURTESY OF UCHECHUKWU OKERE
Uchechukwu Okere and colleagues at Lancaster University sought evidence for phenanthrene biodegradation by soil microbial communities at Livingston Island, off the tip of the Antarctic Peninsula. The temperatures at this northernmost end of the continent are moderately cold, between 3°C in southern summer and −11°C in winter. Okere incubated soil samples with phenanthrene substrates containing 14 C-radiolabeled carbons. The incubation was performed in a respirometer with a CO trap, and the 14 C
2
radioactivity was measured in the trapped CO 2. Okere found that over 10–30 days, microbes degraded as much as 30% of the
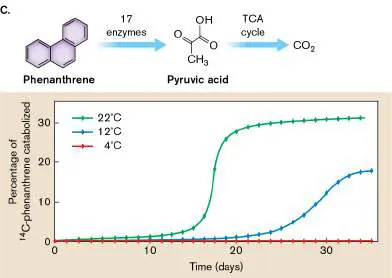
phenanthrene to CO 2. The degradation rate was higher at higher temperatures; thus, the catabolic microbes appear to be psychrotrophs (cold tolerant) rather than psychrophiles, which require cold for growth. Psychrotrophs may take advantage of a temporary rise in temperature to outgrow their competitors.
How do microbes catabolize such tough carbon sources? As we saw earlier (Fig. 13.13), fungi and bacteria break down lignin, plastics, and PAHs to form single-ring aromatic compounds such as benzoate and phenols. Some of these products have commercial uses: Benzoate is a food preservative; vanillin, a flavor additive; phenol, an industrial solvent. eResearch Activity 13 describes how bacteria were engineered to convert plastic bottles to vanillin. In nature, the single-ring compounds are further catabolized to acetyl-CoA, which enters the TCA cycle. Benzoate, activated to benzoyl-CoA, has a central role in the catabolism of aromatic molecules, comparable to that of glucose in polysaccharide catabolism. Bacteria such as Pseudomonas and Rhodococcus species degrade benzoate and related molecules aerobically or anaerobically. Anaerobic degradation takes much longer, but it is critical because the volume of anaerobic habitat (such as soil) greatly exceeds that of oxygenated habitat.
Aerobic benzene catabolism. Benzene and related aromatic compounds, such as toluene (methylbenzene), chlorobenzoate, and nitrobenzene, can be catabolized via sequential oxidation steps, requiring the presence of an ETS that terminates with O 2 (Fig. 13.32). Early in the pathways, enzymes must remove substituents such as chlorides or nitrates. The methyl group of toluene is oxidized to carboxylate (R–COO −), whose removal then drives a key breakdown step. Aerobic degradation commonly proceeds through the intermediate catechol, a benzene ring bearing two adjacent hydroxyl groups. Each benzene derivative is converted to catechol by a specific dioxygenase, an enzyme that coordinately oxygenates two adjacent ring carbons.
FIGURE 13.32 ■ Aerobic aromatic catabolism. Oxidative catabolism of benzoate and various related compounds proceeds through catechols. Catechols are degraded through several alternative pathways to the TCA cycle. Steps requiring oxidation are marked O 2. Inset: Bird contaminated by petroleum from an offshore wellhead.
WIN MCNAMEE/GETTY IMAGES
The intermediate catechol then undergoes another key oxidation by a catechol dioxygenase, which adds two more oxygens while cleaving the ring (Fig. 13.32). In different bacterial species, the enzyme may oxidize catechol by one of two different enzymes that act on either the 1 and 2 positions (forming muconate, a dicarboxylate) or the 2 and 3 positions (forming a muconate aldehyde). Either pathway generates products that can enter the TCA cycle, completing breakdown to CO 2. The details of benzene
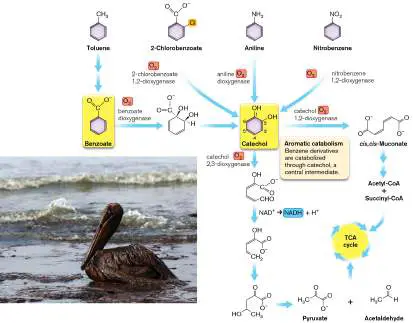
catabolism vary among bacterial species, and diverse mechanisms continue to be discovered.
Anaerobic benzene catabolism. A challenge for biodegradation is that many aromatic pollutants reach deep underground, where the soil is anoxic. Thus, oxygen is unavailable to conduct the conversions shown in Figure 13.32, particularly the formation of carboxylate (R–COO −) and the introduction of hydroxyl groups. How can microbes catabolize benzene and benzoate derivatives without oxygen? Surprisingly, many Gram-negative soil bacteria of the phylum Proteobacteria (Pseudomonadota) can break down benzene and naphthalene by anaerobic respiration. For example, Desulfobacterium donates electrons to sulfate, whereas Azoarcus species donate electrons to nitrate.
In early stages of anaerobic catabolism (Fig. 13.33), benzene and naphthalene incorporate CO 2, forming the carboxylate group of benzoate. Because CO 2 is a very weak oxidant, these reactions require input of energy by hydrolysis of ATP. The carboxylate is then activated by HS-CoA, forming benzoyl-CoA, the same key intermediate as for aerobic benzene catabolism.
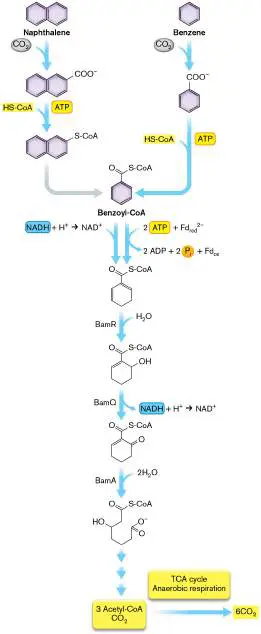
FIGURE 13.33 ■ Anaerobic benzoate catabolism. In the absence of oxygen, benzene and naphthalene incorporate CO 2 and are activated by HS-CoA to form benzoyl-CoA. Benzoyl-CoA breakdown requires hydrolysis (incorporating H 2 O) and reduction by ferredoxin (Fd) and NADH.
Source: Modified from Georg Fuchs et al. 2011. Nat. Rev. Microbiol. 9 :803. Anaerobically, the benzoyl-CoA must use reducing energy from NADH to hydrogenate its ring carbons, thus breaking the aromaticity. Some bacteria spend ATP as well, whereas others, such as the iron-reducing bacterium Geobacter metallireducens, can break the ring without spending ATP. The hydroxyl groups that enable shifting of the double-bond positions are introduced by incorporation of H 2 O. Catabolism continues, forming three acetyl groups activated by HS-CoA, plus one CO 2. Aromatic catabolism requires high initial investment of reducing energy—one reason the process operates slowly. For soil bacteria, the energy invested must come from anaerobic phototrophy or from anaerobic respiration.
The discovery of effective benzene degraders is of great interest for bioremediation of sites such as the South Platte River, north of Denver, where a spill from the Suncor oil refinery in 2011 released benzene (Fig. 13.34A). To identify novel benzene-degrading microbes, Nidal Abu Laban and colleagues at the Helmholtz Centre in Munich performed benzene enrichment culture of soil from a coal gasification site. From the enrichment culture, the predominant organism was identified as Pelotomaculum species of Gram-positive endospore-formers. The bacterium was identified by PCR amplification of 16S rRNA gene sequence (for methods, see Chapter 17).
FIGURE 13.34 ■ Benzene catabolism for bioremediation. A. Workers build a dam on the South Platte River in Denver, Colorado, in 2011, in their efforts to clean up contamination by benzene from the Suncor oil refinery. B. Anaerobic oxidation of benzene by sulfate.
Source: Nidal Abu Laban et al. 2009. FEMS Microbiol. Ecol. 68 :300.
AP PHOTO/ED ANDRIESKI
Pelotomaculum bacteria are related to other clostridia that use the anaerobic electron acceptor sulfate (SO 2−). So, Abu Laban
4
hypothesized that sulfate could be used during benzene catabolism. In the experiment to test this hypothesis (Fig. 13.34B ), 13 CO
2
was measured by gas chromatography–mass spectrometry (GC-MS), a technique that measures molecular masses and can thus distinguish “heavy isotopes” such as 13 C from the more common isotope, in this case 12 C. When benzene enrichment was performed in the presence of sulfate, the 13 C-labeled benzene showed conversion to 13 CO,
2
while at the same time the sulfate concentration decreased. The autoclaved controls showed no change in 13 CO or sulfate
2
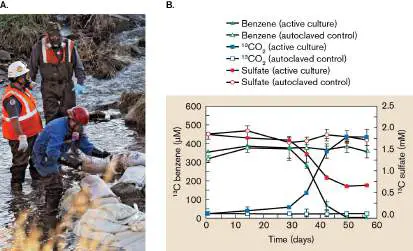
concentration. These data are consistent with anaerobic breakdown of benzene via the TCA cycle and ETS, with sulfate oxidation.
Microbial Syntrophy Cleans Up Oil
Aromatic and short-chain waste products of petroleum are often so stable that their breakdown reactions appear to incur positive values of Δ G. Michael McInerney at the University of Oklahoma, Norman, and his collaborator Jessica Sieber, now at the University of Minnesota, Duluth, think about waste cleanup from the point of view of microbial energetics (Fig. 13.35). They showed how key forms of anaerobic metabolism require syntrophy, the coupling of metabolism between two organisms such that the overall reaction yields energy (−Δ G).
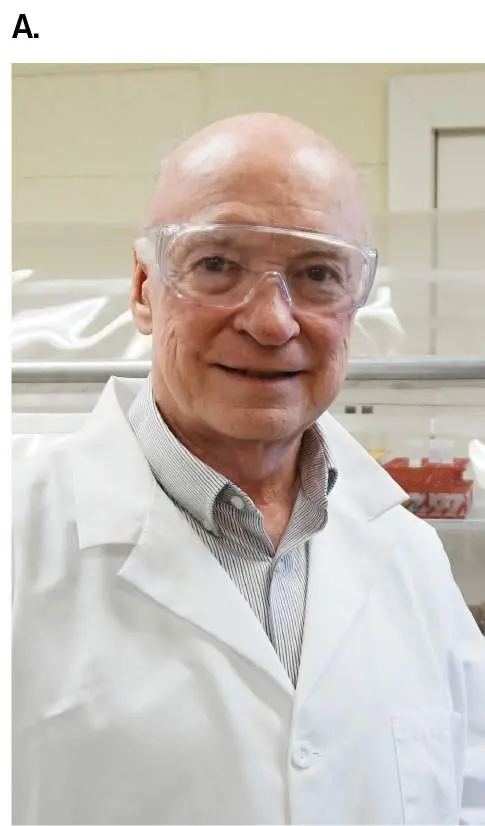

FIGURE 13.35 ■ Michael McInerney (A) and Jessica Sieber (B) collaborate on syntrophy in the pursuit of waste cleanup.
COURTESY OF JESSICA SIEBER
A fundamental challenge to degrading pollutants is the lack of oxygen. The molecules seep into the depths of soil or water, where any oxygen is quickly used up by microbes capable of respiration. As microbes use up the long-chain components of sewage or oil, the remaining short-chain molecules and aromatic rings can be broken down only through the transfer of leftover electrons onto hydrogen ions, forming H 2. For example, Syntrophus aciditrophicus and Syntrophomonas wolfei catabolize benzoate into acetate and bicarbonate ions, releasing H 2 (Table 13.6).
Syntrophy: Reactions
TABLE 13.6
Producing and Consuming H 2
Δ G °′ (kJ/mol)
Genus Reaction a Δ G ′ (kJ/mol) b 3H reduces an oxidant (HCO −, SO 2−, or NO −)
2 3 4 3
Methanospirillum 4H 2 + −136 HCO −
3
+ H + → CH 4 + 3H 2 O
Syntrophy: Reactions
TABLE 13.6
Producing and Consuming H 2
Desulfovibrio 4H 2 + SO −152 2− + H
4
+ → HS − + 4H
2
O Desulfovibrio 4H 2 + NO −600 Oxidant for − + 2H syntrophy:
3
+ → NH + + 3H
4
2 O SO HCO 4 NO Syntrophic catabolism producing H − 2− −
2 3 3
Syntrophus Benzoate +70 −25 −33 −45 + 7H 2 O → 3 acetate + HCO 3 − + 3H + + 3H 2 Syntrophomonas Butyrate + +49 −5 −13 −18 2H 2 O → 2
Syntrophy: Reactions
TABLE 13.6
Producing and Consuming H 2
acetate + H + + 2H 2 Sources: Michael McInerney et al. 2007. PNAS 104 :7600; Ralf Cord-Ruwisch et al. 1988. Arch. Microbio1. 149 :350; Bradley E. Jackson and Michael J. McInerney. 2002. Nature 415 :454.
But the H 2 -releasing reactions of Syntrophus and Syntrophomonas have a positive value of Δ G ° (Table 13.6), and thus they cannot go forward to yield energy. So, how can these bacteria obtain energy? The Δ G can be shifted by rapidly removing H 2 gas, thus lowering the concentration of this key product. Once the equations are balanced, negative values of Δ G are obtained. H 2 can be removed by other microbes that oxidize hydrogen using alternative electron acceptors such as bicarbonate (for example, the archaeal methanogen Methanospirillum), sulfate, or nitrate (for example, the bacterium Desulfovibrio; Fig. 13.36A).
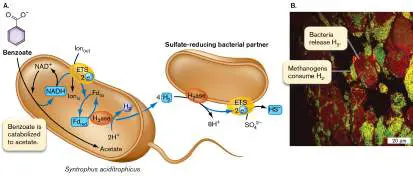
FIGURE 13.36 ■ Syntrophy between Syntrophus aciditrophicus and a sulfate-reducing bacterium, Desulfovibrio. A. Syntrophus aciditrophicus catabolizes benzoate to acetate, transferring electrons back onto the hydrogen ions removed from the substrate. The H 2 formed must donate electrons to an electron transport system (ETS), despite a positive Δ G value (reverse electron transfer). Rapid removal of H 2 by the sulfate-reducing partner (Desulfovibrio sp.) provides energy, making the net Δ G value negative. B. Syntrophic community labeled by fluorescence in situ hybridization (FISH). H 2 ase = hydrogenase.
COURTESY OF J. M. HARMSEN, UNIV. OF GRONINGEN, THE NETHERLANDS
Hydrogen-producing bacteria have evolved to grow in close proximity to the hydrogen-oxidizing bacteria or archaea. Figure 13.36B shows a section through a syntrophic community within a wastewater sludge granule, where anaerobic catabolism must degrade sewage components to CO 2. The granule is stained with fluorescent markers for the H 2 -producing bacteria (red) and their partner methanogen (yellow). In order for the syntrophy to proceed, the H 2 from the catabolizing bacteria must be transferred quickly to the methanogenic partner, by processes that are not yet understood. Microscopy reveals intercellular nanotubes that may transmit electrons from the H 2 producer to the partner.
Under laboratory conditions, Sieber and McInerney demonstrated syntrophic growth in the presence of defined concentrations of reactants and products (Table 13.6). Their calculations showed that cells grew with negative values of free energy change. Yet even in the presence of the syntrophic partner, these anaerobic pathways have free energy changes that are remarkably low (about −20 kJ/mol), often below the theoretical minimum required to generate ATP (about −60 kJ/mol). Such extremely low energy levels require special arrangements called “reverse electron transport,” in which electrons are transferred from one carrier to the next, despite a positive Δ G value (requiring energy input). The electron transfer must be coupled with a compensating reaction that spends enough energy to yield a net negative Δ G.
Syntrophic partners are considered “thermodynamic extremophiles” because they grow at such low Δ G values.
Nonetheless, these organisms are of global importance because they play an essential role in recycling the small-molecule products of anaerobic catabolism. Furthermore, they present exciting industrial applications. For instance, the methanogenic partnership between H 2 -producing bacteria and Methanococcus maripaludis might be used to attack unextractable oil residues and convert the carbon into methane for recovery as natural gas. Other syntrophic interactions may be used to increase the efficiency of sewage mineralization during water treatment.
Thought Question
13.12 The thermophilic bacteria Thermus species grow in deep-sea hydrothermal vents at 80°C. It was proposed that they metabolize formate to bicarbonate ion and hydrogen gas: HCOO − + H O → HCO − + H
2 3 2
But the standard Δ G °′ is near zero (−2.6 kJ/mol). Under actual conditions, do you think the reaction yields energy? Assume concentrations of 150 mM for formate, 20 mM for bicarbonate ion, and 10 mM for hydrogen gas.
To Summarize
Catabolism of aromatic molecules by bacteria and fungi recycles lignin and PAHs within ecosystems. Aromatic metabolism is used for bioremediation.
Benzoate undergoes aerobic catabolism to catechol.
The catechol ring is cleaved, generating acetyl-CoA, which enters the TCA cycle.
Anaerobic catabolism of benzoate involves activation by HS-CoA and reduction by NADH. The energy for reduction comes from anaerobic respiration or phototrophy.
Benzene derivatives and short-chain acids can be catabolized by syntrophy. In syntrophy, one partner species breaks down a molecule releasing H 2, while a tightly coupled partner species removes the H 2 to reduce an oxidant. The net reaction has a negative value of Δ G.
Glossary
syntrophy Metabolic cooperation between two different species; usually one member releases a product whose removal by the second species enables the pair to metabolize with a negative value of Δ G.
Fig. 13.13 FIGURE 13.13 ■ Many carbon sources enter central pathways of catabolism. Glycans are broken down to disaccharides and then to monosaccharides such as glucose. Glucose and sugar acids are converted to pyruvate, which releases acetyl groups. Lignin and plastics such as polyethylene terephthalate (PET) are hydrolyzed to aromatic monomers and are then broken down to acetyl groups. Amino acids are decarboxylated and deaminated.
Endnotes
1. Note a: Δ G °′ is the standard free energy change at pH 7 when the concentrations of reactants and products are the same. Return to reference a
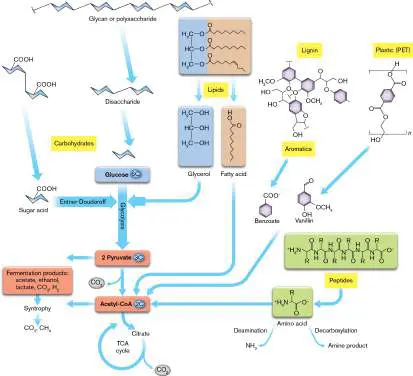
2. Note b: Δ G ′ was the measured free energy change at pH 7 when syntrophic metabolism stopped. Return to reference b eResearch Activity 13
Can Escherichia coli with a Rat Enzyme Convert Used Plastic Bottles to Vanillin?
Our world is swamped with plastics—discarded packaging and bottles litter our environment and clog our oceans (Fig. ERA 13.1 ). Despite efforts to recycle such materials, they pile up ever faster. Yet these materials are composed of carbon, oxygen, and hydrogen —the very atoms that microbes need for catabolism and biosynthesis. Can microbes help us break them down? In fact, researchers have discovered a number of bacteria and microbial communities such as compost that degrade certain plastics such as polyethylene terephthalate (PET).
FIGURE ERA 13.1 ■ Researchers investigate plastic waste conversion. A. Joanna Sadler, University of Edinburgh. B. Discarded bottles made of polyethylene terephthalate (PET) can be biodegraded by microbes.
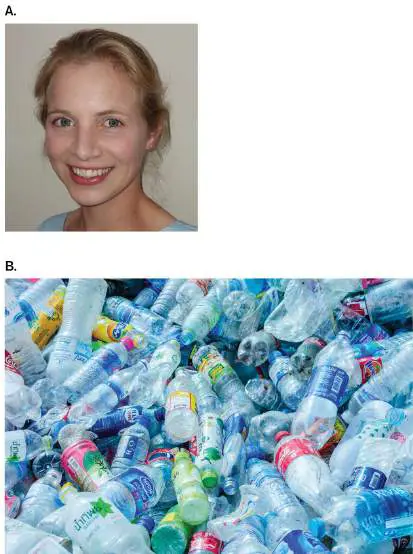
JOANNA SADLER
GIGIRA/SHUTTERSTOCK
Recycling at the source is more effective than dumping trash in a landfill or aquatic system, where breakdown is slow. But recycling needs to be made more economical. So researchers seek means of “upcycling,” the conversion of waste into products of greater value. One such process for PET was devised by Joanna Sadler and Stephen Wallace at the University of Edinburgh. They devised a two-stage process for breakdown of PET with conversion to vanillin. Vanillin is a substance of high value that is used as a flavoring agent and as a chemical feedstock otherwise obtained from petroleum. The process devised by Sadler and Wallace involved a first stage of breakdown using an enzyme called leaf-branch compost cutinase, a class of enzyme that hydrolyzes the tough cuticle (surface layer) of plant leaves. The cutinase found by Sadler was derived from a microbial compost consortium. The cutinase enzyme hydrolyzes the PET polymer to its monomer, terephthalic acid (PA; Fig. ERA 13.2 ). This monomer (repeating unit from the plastic) is a simple benzene ring with two carboxylate groups. For comparison, see the catabolism of aromatic molecules such as benzoate in Figure 13.32.
FIGURE ERA 13.2 ■ Polyethylene terephthalate is degraded by a microbial enzyme and converted to vanillin by engineered Escherichia coli. An enzyme (cutinase) from a compost microbe degrades the bottle plastic to terephthalate monomer. A strain of E. coli engineered for the vanillin biosynthesis pathway converts terephthalate to vanillin.
WOJCIECH BORUCH/SHUTTERSTOCK
PANTHER MEDIA GMBH/ALAMY STOCK PHOTO
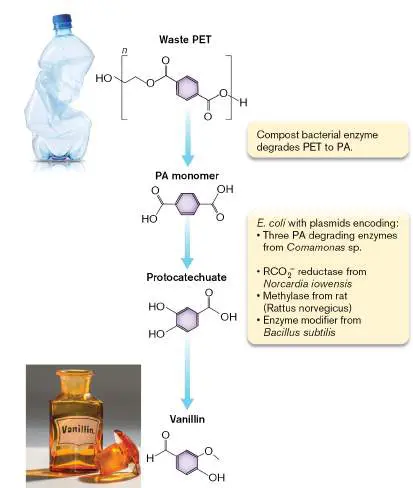
The conversion of PA monomer to vanillin, however, requires several enzymes from different sources. Sadler and Wallace cloned these enzymes on three plasmids, all of which were transformed together into a commercial production strain of Escherichia coli. (Commercial strains for applied biotechnology are discussed in Chapter 16.) Three genes encoding enzymes were obtained from Comamonas sp., a soil Betaproteobacteria. These enzymes catalyzed known reactions that would lead to a precursor of vanillin. The Comamonas enzymes remove one carboxylic group and oxidize one carbon (forming an OH group). The product is called protocatechuate. (Compare the oxidation of benzoate to catechol in Figure 13.32.)
The final steps forming vanillin require three enzymes on two plasmids, which were also transformed into Sadler and Wallace’s commercial production strain of E. coli. An enzyme reducing the remaining carboxylate to aldehyde was cloned from the filamentous bacterium Nocardia iowensis. A Bacillus enzyme was needed to modify the Nocardia enzyme. Finally, to add a methyl group to one hydroxyl, a methylase came from a surprising source—the genome of the common brown rat, Rattus norvegicus. For today’s bioengineer, the genomes of all kinds of life provide tools in the toolbox.
This scheme converting bottles to vanillin works in the lab, an impressive feat of genetic engineering. But could it scale up as a process that works in the marketplace? Commercial biotechnology and other kinds of applied microbiology are discussed in Chapter 16.
Further Exploration
What problems would need to be solved to make vanillin production economical? What other products might be made from plastic? How might the bacterial producers be engineered for greater efficiency? Sadler, Joanna C., and Stephen Wallace. 2021. Microbial synthesis of vanillin from waste poly (ethylene terephthalate). Green Chemistry 23 :4665–4672.
Glossary
Figure 13.32 FIGURE 13.32 ■ Aerobic aromatic catabolism. Oxidative catabolism of benzoate and various related compounds proceeds through catechols. Catechols are degraded through several alternative pathways to the TCA cycle. Steps requiring oxidation are marked O 2. Inset: Bird contaminated by petroleum from an offshore wellhead.
WIN MCNAMEE/GETTY IMAGES
Figure 13.32
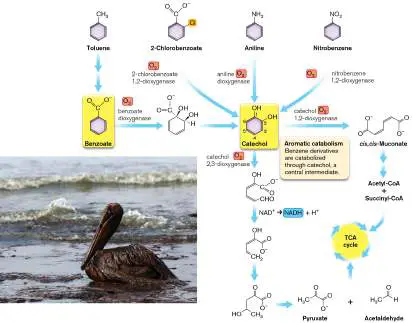
FIGURE 13.32 ■ Aerobic aromatic catabolism. Oxidative catabolism of benzoate and various related compounds proceeds through catechols. Catechols are degraded through several alternative pathways to the TCA cycle. Steps requiring oxidation are marked O 2. Inset: Bird contaminated by petroleum from an offshore wellhead.
WIN MCNAMEE/GETTY IMAGES
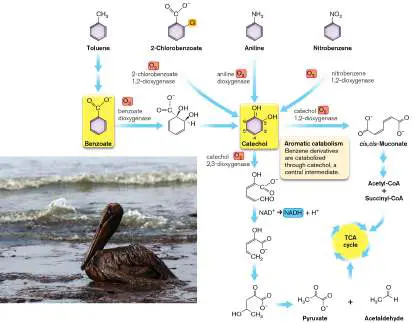
CHAPTER REVIEW
Review Questions
1. Why must the biosphere continually take up energy from outside? Why can’t all the energy be recycled among organisms, like the fundamental elements of matter? 2. Explain how a biochemical reaction can be driven by a change in enthalpy, Δ H. Explain how a different reaction can be driven by a change in entropy, Δ S. In each case, explain the role of the free energy change, Δ G.
3. Why do some biochemical reactions release energy only above a threshold temperature?
4. How do organisms determine which of their catabolic pathways to use? How does catabolism depend on environmental factors?
5. Beer is produced by yeast fermentation of grain to ethanol. To make beer, why must oxygen be limited? Why are such large quantities of ethanol produced with a relatively small production of yeast biomass?
6. Explain the three different routes to catabolize glucose to pyruvate. Why is it necessary to start by spending one or two molecules of ATP?
7. Explain how the TCA cycle incorporates an acetyl group. How are the two CO 2 molecules removed?
8. How do bacterial catabolic reactions in the gut microbiome generate molecules that modulate the host brain and immune system? How does the human body regulate microbial metabolism?
9. Compare and contrast aerobic and anaerobic processes of benzoate catabolism. Explain why some kinds of anaerobic metabolism require syntrophy between two species.
Thought Questions
1. Why are glucose catabolism pathways ubiquitous, even in bacterial habitats where glucose is scarce? Give several reasons.
2. In glycolysis, explain why bacteria have to return the hydrogens from NADH back onto pyruvate to make fermentation products. Why can’t NAD + serve as a terminal electron acceptor, like O 2?
3. Why does catabolism of benzene derivatives yield less energy than does sugar catabolism? Why is benzene-derivative catabolism nevertheless widespread among soil bacteria?
4. How do host factors affect gut bacterial catabolism? How can we determine which members of the gut microbiome are producing products that modulate host function?
Key Terms
activation energy (E a) (507)
adenosine triphosphate (ATP) (501) allosteric site (507)
amphibolic (517)
anaerobic respiration (512)
aromatic (504)
biomass (495)
calorimeter (497)
catabolism (495)
catabolites (529)
catalytic domain (catalytic site) (507) chemotrophy (496)
coenzyme A (CoA) (522)
electron acceptor (504)
electron donor (504)
electron transport system (ETS) (505) Embden-Meyerhof-Parnas (EMP) pathway (514, 515) endothermic (497)
energy (494)
energy carrier (501)
enthalpy (496)
Entner-Doudoroff (ED) pathway (515, 517) entropy (494)
enzyme (507)
ethanolic fermentation (522)
exothermic (497)
fermentation (512)
flavin adenine dinucleotide (FAD) (505) Gibbs free energy change or Gibbs free energy change (Δ G) (496) glycan (509)
glycolysis (514, 515)
glyoxylate bypass (527)
gut microbiome (495)
heterotrophy (496)
human milk oligosaccharide (HMO) (513) hydrolysis (502)
joule (J) (497)
lactic acid fermentation (520)
lignin (511)
metabolomics (532)
mixed-acid fermentation (522)
nicotinamide adenine dinucleotide (NAD) (504) oxidative phosphorylation (526)
pentose phosphate pathway (PPP) (515, 519) phosphorylation (501)
phototrophy (496)
polysaccharide (509)
pyruvate dehydrogenase complex (PDC) (524) respiration (512, 526)
ribulose 5-phosphate (519)
starch (509)
Stickland reaction (523)
substrate-level phosphorylation (517) syntrophy (500, 537)
terminal electron acceptor (505)
tricarboxylic acid (TCA) cycle (524)
Recommended Reading
Fuchs, Georg, Matthias Boll, and Johann Heider. 2011. Microbial degradation of aromatic compounds—From one strategy to four. Nature Reviews. Microbiology 9 :803–816. Gabanyi, Ilana, Gabriel Lepousez, Richard Wheeler, Alba Vieites-Prado, Antoine Nissant, et al. 2022. Bacterial sensing via neuronal Nod2 regulates appetite and body temperature. Science 376 (6590):eabj3986.
Head, Ian M., D. Martin Jones, and Wilfred F. M. Röling. 2006. Marine microorganisms make a meal of oil. Nature Reviews. Microbiology 4 :173–182.
Jackson, Bradley E., and Michael J. McInerney. 2002. Anaerobic microbial metabolism can proceed close to thermodynamic limits. Nature 415 :454–456.
Koropatkin, Nicole M., Elizabeth A. Cameron, and Eric C. Martens. 2012. How glycan metabolism shapes the human gut microbiota. Nature Reviews. Microbiology 10 :323–335. Larsbrink, Johan, Theresa E. Rogers, Glyn R. Hemsworth, Lauren S. McKee, Alexandra S. Tauzin, et al. 2014. A discrete genetic locus confers xyloglucan metabolism in select human gut Bacteroidetes. Nature 506 :498–502.
Mazzoli, Roberto, and Enrica Pessione. 2016. The neuro-endocrinological role of microbial glutamate and GABA signaling. Frontiers in Microbiology 7 :1934.
McInerney, Michael J., Jessica R. Sieber, and Robert P. Gunsalus. 2011. Microbial syntrophy: Ecosystem-level biochemical cooperation. Microbe 6 :479–485.
Meng, Di, Eduardo Sommella, Emanuela Salviati, Pietro Campiglia, Kriston Ganguli, et al. 2020. Indole-3-lactic acid, a metabolite of tryptophan, secreted by Bifidobacterium longum subspecies infantis is anti-inflammatory in the immature intestine. Pediatric Research 88 :209–217.
Okere, Uchechukwu V., Ana Cabrerizo, Jordi Dachs, Kevin C. Jones, and Kirk T. Semple. 2012. Biodegradation of phenanthrene by indigenous microorganisms in soils from Livingstone Island, Antarctica. FEMS Microbiological Letters 329:69–77.
Shepherd, Elizabeth S., William C. DeLoache, Kali M. Pruss, Weston R. Whitaker, and Justin L. Sonnenburg. 2018. An exclusive metabolic niche enables strain engraftment in the gut. Nature 557 :434–438.
Sieber, Jessica R., Huynh M. Le, and Michael J. McInerney. 2014. The importance of hydrogen and formate transfer for syntrophic fatty, aromatic and alicyclic metabolism. Environmental Microbiology 16 :177–188.
Tamura, Kazune, Matthew H. Foley, Bernd R. Gardill, Guillaume Dejean, Matthew Schnizlein, et al. 2019. Surface glycan-binding proteins are essential for cereal beta-glucan utilization by the human gut symbiont Bacteroides ovatus. Cellular and Molecular Life Sciences 76 :4319–4340.
Turroni, Francesca, Christian Milani, Sabrina Duranti, Chiara Ferrario, Gabriele Andrea Lugli, et al. 2018. Bifidobacteria and the infant gut: An example of co-evolution and natural selection. Cellular and Molecular Life Sciences 75 :103–118. Tuson, Hannah H., Matthew H. Foley, Nicole M. Koropatkin, and Julie S. Biteen. 2018. The starch utilization system assembles around stationary starch-binding proteins. Biophysical Journa l 115 :242–250.
Yoshida, Shosuke, Kazumi Hiraga, Toshihiko Takehana, Ikuo Taniguchi, Hironao Yamaji, et al. 2016. A bacterium that degrades and assimilates poly(ethylene terephthalate). Science 351 :1196–1199.
Glossary
activation energy (E)
The energy needed for reactants to reach the transition state between reactants and products.
adenosine triphosphate (ATP)
A ribonucleotide with three phosphoryl groups and the base adenine. It has many functions in the cell, including precursor for RNA synthesis and energy carrier.
allosteric site A regulatory site on a biological molecule distinct from the ligand/substrate-binding site.
amphibolic Describing a metabolic pathway that is reversible and can be used for both catabolism and anabolism.
anaerobic respiration The use of a molecule other than oxygen as the final electron acceptor of an electron transport chain.
aromatic Describing a planar, unsaturated, ring-shaped organic molecule whose bonding electrons are delocalized equally around the ring.
biomass The mass found in the bodies of living organisms.
calorimeter A device used to measure the amount of heat released or absorbed during a reaction.
catabolism The cellular breakdown of large molecules into smaller molecules, releasing energy.
catabolites The products of catabolism, usually excreted from the cell. catalytic domain 1. Also called catalytic site. The portion of an enzyme that performs catalysis. 2. The A subunit of a toxin, which carries the ADP-ribosyltransferase activity.
chemotrophy Metabolism that yields energy from oxidation-reduction reactions without using light energy.
coenzyme A (CoA)
A nonprotein cellular organic molecule that can carry acetyl groups and participates in metabolism.
electron acceptor An oxidized molecule (e.g., NAD +) that can accept electrons. electron donor Also called reducing agent. A reduced molecule (e.g., NADH) that can donate electrons.
electron transport system (ETS) or electron transport chain (ETC) Also called cytochrome system. A series of membrane-embedded proteins that converts the energy of redox reactions into a proton potential.
Embden-Meyerhof-Parnas (EMP) pathway Also called glycolysis. The catabolic pathway of glucose oxidation to pyruvate, in which glucose 6-phosphate isomerizes to fructose 6-phosphate, ultimately yielding 2 pyruvate, 2 ATP, and 2 NADH.
endothermic Absorbing heat.
energy The ability to do work.
energy carrier A molecule in the cell, such as ATP or NADH, that serves as energy currency. Energy carriers are produced during catabolic reactions and can be used to drive energy-requiring reactions. enthalpy A measure of the heat energy in a system.
Entner-Doudoroff (ED) pathway A glycolytic pathway in which glucose 6-phosphate is initially oxidized to 6-phosphogluconate, and ultimately yields 1 pyruvate, 1 ATP, 1 NADH, and 1 NADPH.
entropy A measure of the disorder in a system.
enzyme A biological catalyst; a protein or RNA that can speed up the progress of a reaction without itself being changed.
ethanolic fermentation Also called alcoholic fermentation. A fermentation reaction yielding 2 ethanol and 2CO 2 as products.
exothermic Releasing heat.
fermentation Also called fermentative metabolism. 1. The production of ATP via substrate-level phosphorylation, using organic compounds as both electron donors and electron acceptors. 2. Industrial fermentation is the production of microbial products that are made by microbes grown in fermentation vessels; it may include respiratory metabolism to maximize microbial growth. flavin adenine dinucleotide (FAD)
An energy carrier in the cell that can donate (FADH 2) or accept (FAD) electrons.
free energy change Also called free energy change. In a chemical reaction, a measure of how much energy available to do work is released or required as the reaction proceeds.
glycan A polysaccharide chain composed of oxygen-linked (O-linked) monosaccharides.
glycolysis Also called Embden-Meyerhof-Parnas (EMP) pathway. The catabolic pathway of glucose oxidation to pyruvate, in which glucose 6-phosphate isomerizes to fructose 6-phosphate, ultimately yielding 2 pyruvate, 2 ATP, and 2 NADH.
glyoxylate bypass An alternative to the tricarboxylic acid cycle in which isocitrate is converted to glyoxylate and then malate; induced under low glucose conditions.
gut microbiome The microbial community normally present in the intestinal lumen of a healthy host.
heterotrophy Also called chemoorganoheterotrophy. The use of external sources of organic carbon compounds for biosynthesis. human milk oligosaccharide (HMO)
A glycan secreted in milk by a lactating human.
hydrolysis The cleaving of a bond by the addition of a water molecule. joule (J)
The standard SI unit for energy.
lactic acid fermentation A fermentation reaction that generates lactic acid from reduction of pyruvic acid.
lignin A complex aromatic organic compound that forms the key structural support for trees and woody stems.
metabolomics The study of the overall collection of small molecules (metabolites) within a cell.
mixed-acid fermentation A bacterial fermentation process in which pyruvate is converted to several different organic acids, as well as ethanol, CO 2, and H 2 O.
nicotinamide adenine dinucleotide (NAD)
An energy carrier in the cell that can donate (NADH) or accept (NAD +) electrons.
oxidative phosphorylation A process of an electron transport chain that uses diatomic oxygen as a final electron acceptor and generates a proton gradient across a membrane for the production of ATP via ATP synthase.
pentose phosphate pathway (PPP) or pentose phosphate shunt (PPS)
An alternate glycolytic pathway in which glucose 6-phosphate is first oxidized and then decarboxylated to ribulose 5-phosphate, ultimately generating 2 NADPH.
phosphorylation The enzyme-catalyzed addition of a phosphoryl group onto a molecule.
phototrophy The use of chemical reactions powered by the absorption of light to yield energy.
polysaccharide A polymer of sugars. See also glycan .
pyruvate dehydrogenase complex (PDC)
The multisubunit enzyme that couples the oxidative decarboxylation of pyruvate, forming acetyl-CoA and NADH. respiration The oxidation of reduced organic electron donors through a series of membrane-embedded electron carriers to a final electron acceptor. The energy derived from the redox reactions is stored as an electrochemical gradient across the membrane, which may be harnessed to produce ATP.
ribulose 5-phosphate The five-carbon sugar ribulose, phosphorylated at carbon 5. starch A glucose polymer in which an acetal (O–COH) of each glucose has condensed with a hydroxyl group of the next glucose, releasing H 2 O.
substrate-level phosphorylation The formation of ATP by the enzymatic transfer of a phosphoryl group from a substrate molecule onto ADP.
Stickland reaction An energy-yielding reaction between two amino acids in which one oxidizes the other. The reaction typically produces short organic acids plus 2NH +; it may also produce CO and H.
4 2 2
syntrophy Metabolic cooperation between two different species; usually one member releases a product whose removal by the second species enables the pair to metabolize with a negative value of Δ G.
terminal electron acceptor The final electron acceptor at the end of an electron transport system.
tricarboxylic acid (TCA) cycle Also called Krebs cycle. A metabolic cycle that catabolizes the acetyl group from acetyl-CoA to 2CO 2 with the concomitant production of NADH, FADH 2, and ATP.