Chapter introduction
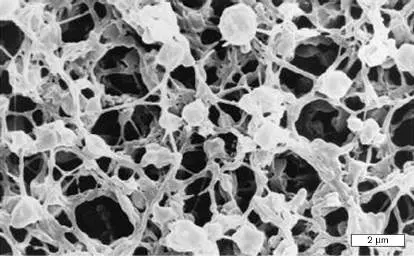
Wrinkly-spreader mutants (arrow) of Pseudomonas fluorescens SBW25 arise after less than a week of experimental evolution conducted by an undergraduate student. Beads colonized by biofilm are serially transferred to fresh medium, followed by plating on tryptone agar. The P. fluorescens biofilm condition selects for mutants with elevated production of the signal molecule
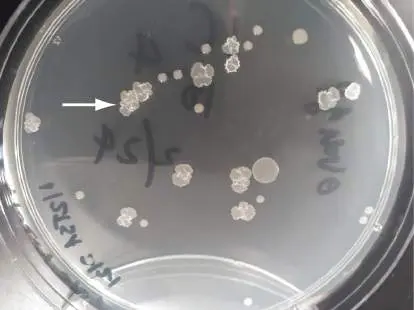
Observers of the natural world have long wondered where life came from. Medieval alchemists in Europe argued that life arose spontaneously from inert matter—a concept called spontaneous generation (discussed in Chapter 1). Others argued against spontaneous generation and devised experiments to show that even microbes have “parents.” Today, lines of evidence from geology, biochemistry, and genetics overwhelmingly confirm that all life on Earth, including microbes, arises from preexisting life—and that microbial life appeared as early as 3.7 billion years ago, soon after our planet formed out of dust surrounding the young Sun. Evolution experiments show how microbes continue evolving new forms, such as the colony variants of Pseudomonas bacteria evolving from selection for biofilm, as seen in the chapter-opening image. Biofilm evolution explains, for example, how infections fill the lungs of cystic Evolution experiments do not address the origin of the very first living cells—or how early life gave rise to multicellular plants and animals. But the natural world has long provided clues. In 1802, the naturalist Erasmus Darwin, grandfather of Charles Darwin, wrote: Organic life beneath the shoreless waves Was born and nurs’d in ocean’s pearly caves; First forms minute, unseen by spheric glass, Move on the mud, or pierce the watery mass; These, as successive generations bloom, New powers acquire and larger limbs assume.
Thus, nineteenth-century biologists developed the idea that “minute” life forms arose in the ocean—and that all organisms evolved from microbes, perhaps even from cells too small to be seen with the “spheric glass” of a microscope. Even without the tools of genetics, thoughtful observers recognized the commonalities among all living cells, such as the membrane-enclosed compartment of cytoplasm and common metabolic pathways, like sugar metabolism.
Chapter 17 explores evidence for the origin of the earliest cells on Earth and the challenges in interpreting data from so long ago. We show how molecular techniques reveal deep similarities among all life forms, such as the core macromolecular apparatus of DNA, RNA, and proteins. We also watch the mechanisms of ongoing microbial evolution emerge from laboratory experiments (discussed in Section 17.4). We present: The origin of life on Earth and the nature of the earliest cells.
The divergence of microbes from common ancestors, modified by gene transfer and symbiosis.
The mechanisms of microbial evolution as it unfolds in nature and in the laboratory.
17.1 Origins of Lifenot assigned
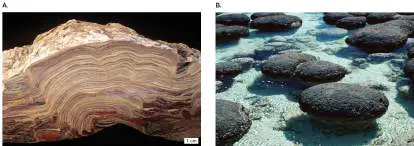
Microbiologists find clues to the nature of early life in geology—rock formations that preserve fossil evidence of the earliest life, from billions of years past. Fossil layers of microbes appear in granite from Pilbara Craton, Australia, where the rock is dated to 3.4 billion years ago (3.4 Gyr ago; Fig. 17.1A). Pilbara is a dry land, one of a few places on Earth where ancient rock was uplifted and remains exposed in cliffs and mountains. The Pilbara rock layers preserve the wavy form of microbial mats, thick masses of biofilm that probably included cyanobacteria. The cyanobacterial mats formed towering colonies called stromatolites (Fig. 17.1B ).
FIGURE 17.1 ■ Stromatolites: ancient life forms in modern seas. A. Cross section of a 3.4-billion-year-old fossil stromatolite from the Strelley Pool Chert, Pilbara Craton, Australia. B. Cyanobacterial stromatolites, present-day structures that resemble the earliest forms of life on Earth. Shark Bay, Western Australia.
FRANCOIS GOHIER/SCIENCE SOURCE
JANE GOULD/ALAMY
Note: In geological description, a billion years (10 9) is a
gigayear, or Gyr. A million years (10 6) is a megayear, or Myr. A modern living stromatolite is a mass of layered limestone (calcium carbonate, CaCO 3) accreted by microbial mats. The mat layers can build over centuries, even more than a thousand years, reaching heights exceeding 2 meters. The outermost layers of the mat contain oxygenic phototrophs, such as diatoms and filamentous cyanobacteria, that exude bubbles of oxygen. A few millimeters below the surface, red light supports bacteria photolyzing H 2 S to sulfate, which is then reduced by still lower layers of bacteria. Stromatolites today grow mainly in tidal pools whose high salt concentration excludes predators, as in Hamlin Pool, Shark Bay, Australia. But 3 billion years ago, stromatolites covered shallow seas all over Earth.
How do living microbes become fossilized? The stromatolite fossils formed as silicate grains sedimented in the mat and gradually replaced their organic structure. The sedimentary layers and wrinkled surface remain visible after billions of years. Remarkably, similar rock formations appear on Mars, suggesting that microbial life may have evolved there too. Of the planets in our solar system, Mars most closely resembles Earth in geology and distance from the Sun, and its crust might provide a habitat for life similar to Earth’s (discussed in Chapter 22).
Fossils such as stromatolites reveal well-organized life forms but little about what must have been their predecessors, the earliest rudimentary cells. How did Earth’s very first life forms arise out of inert molecules? This process remains one of the great mysteries of science. But we know certain things that life required: Essential elements. The origin of life required fundamental elements that compose biological molecules, such as hydrogen, carbon, oxygen, nitrogen, sulfur, and phosphorus.
Continual source of energy. The generation of life requires the continual input of energy, which ultimately is dissipated as heat. The main source of energy for life is solar radiation. Temperature range permitting liquid water. Above 150°C, life’s macromolecules fall apart; below the freezing point of water, metabolic reactions cease. Maintaining the relatively narrow temperature range conducive to life depends on the nature of our Sun, our planet’s distance from the Sun, and the heat-trapping capacity of our atmosphere.
Elements of Life
For life to arise and multiply, elements such as carbon and oxygen needed to be available on Earth. The planet Earth coalesced during formation of the solar system 4.5 Gyr ago. Central to the solar system is our Sun, a “yellow” star of medium size and surface temperature (5,770 K). The Sun’s surface temperature generates electromagnetic radiation across the spectrum, peaking in the range of visible light. As we learned in Chapter 13, the photon energies of visible light are sufficient to drive photosynthesis but not so energetic that they destroy biomolecules. Thus, the stellar class of our Sun makes organic life possible.
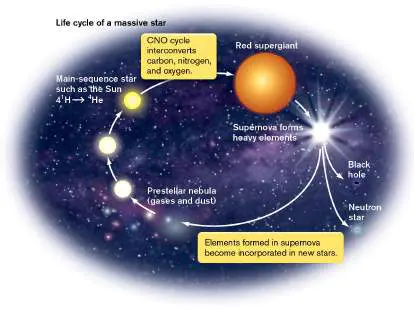
The Sun’s surface temperature and luminosity are generated by nuclear fusion reactions in which hydrogen nuclei fuse to form helium nuclei. (Be careful to distinguish nuclear reactions, involving nuclei, from chemical reactions, involving electrons.) Besides hydrogen and helium, 2% of the solar mass consists of heavier elements, such as carbon, nitrogen, and oxygen, as well as traces of iron and other metals—elements that compose Earth, including its living organisms. Where did these heavier elements come from? To answer this question, we must look to other stars in the universe at different stages of their development (Fig. 17.2).
FIGURE 17.2 ■ Stellar origin of atomic nuclei that form living organisms. In young stars, hydrogen nuclei fuse to form helium. In older stars, fusion of helium forms carbon, nitrogen, oxygen, and all the heavier elements up through iron. Massive stars explode as supernovas, spreading all the elements of the periodic table across space. These elements are picked up by newly forming stars, such as our own Sun.
Elements of life formed within stars. Throughout the universe, young stars such as our Sun fuse hydrogen to form helium. As stars age, they use up all their hydrogen. With hydrogen gone, the aging star contracts and its temperature rises, enabling helium nuclei to fuse, forming carbon (Fig. 17.2). Carbon drives a cyclic nuclear reaction, the carbon-nitrogen-oxygen (CNO) cycle, to form isotopes of nitrogen and oxygen. Subsequent nuclear reactions generate heavier elements through iron (Fe). In this way, the major elements
of biomolecules were formed within stars that aged before our solar system was born.
The later nuclear reactions of aging stars generate heavier nuclei, as large as that of iron. The aging star expands, forming a red giant (Fig. 17.2). When a star of sufficient mass expands (becoming a supergiant), it explodes as a supernova. The explosion of a supernova generates in a brief time all the heaviest elements and ejects the entire content of the star at near light speed. Billions of years before our Sun was born, the first stars aged and died, spreading all the elements of the periodic table across the universe. Some of these elements coalesced with our Sun and formed the planets of our solar system. In effect, all life on Earth is made of stardust, the remains of stars long gone.
Thought Question
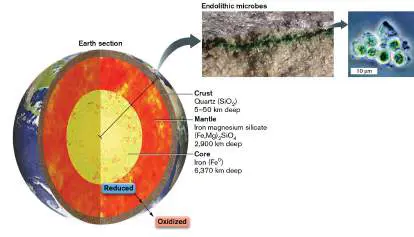
17.1 What would have happened to life on Earth if the Sun were of a different stellar class, substantially hotter or colder than it is? Elemental composition of Earth. When our solar system formed, individual planets coalesced out of matter attracted by the force of gravity. Because of Earth’s small size, most of the hydrogen gas escaped Earth’s gravity very early. The most abundant dense component of Earth was iron (Fig. 17.3). Much of Earth’s iron sank to the center to form the core. The core is surrounded by a mantle, composed primarily of iron combined with less dense crystalline minerals, such as silicates of iron and magnesium: (Fe,Mg) 2 SiO 4. The mantle is coated by Earth’s thin outer crust. The crust is composed primarily of silicon dioxide, SiO 2, also known as quartz or chert. Crustal rock contains smaller amounts of numerous minerals, including the carbonates and nitrates that provided the essential elements for life. Overall, the crust shows a redox gradient, reducing in the interior and oxidizing at the surface. FIGURE 17.3 ■ Geological composition of Earth. This cross section of Earth shows the core, the mantle, and the thin outer crust. The core and mantle are rich in iron; oxygen content increases toward the crust. The crust is composed primarily of silicates such as quartz (SiO 2). Crustal rock supports endolithic microbes. Insets: Endolithic algae, Cyanidium sp.
J. WALKER ET AL. 2005. NATURE 434 :1011–1014, FIG. 1C
J. WALKER ET AL. 2005. NATURE 434 :1011–1014, FIG. 1F
The crust provides a habitat for microbes, including endoliths, microbes that grow within the interstices of rock crystals. Figure 17.3(insets) shows endolithic algae that absorb light and photosynthesize, supporting diverse communities within the rock. Other endoliths are found at surprising depths, such as within gold mines excavated down to 3 kilometers (km). Some endolithic microbes obtain energy by oxidizing electron donors generated through decay of radioactive metals. The discovery of endolithic
organisms deep in Earth’s crust was of great interest to NASA scientists seeking life on Mars.
The outer surface of the crust and the atmosphere above it support the remainder of the biosphere, the sum total of all life on Earth. The biosphere generates oxidants (electron acceptors), most notably O 2. Oxygen-breathing organisms can live only on the outer surface, where O 2 is produced by photosynthesis.
Earth’s atmosphere. From the crust and the mantle of early Earth, volcanic activity released gases such as carbon dioxide and nitrogen, which formed Earth’s first atmosphere, while volcanic water vapor formed the ocean. The composition of this first atmosphere, before life evolved, looked much like that of Mars: thin, about 1% as dense as that of Earth today, and consisting primarily of CO 2. But unlike Mars, Earth developed living organisms that filled the atmosphere with gaseous N 2 and O 2 and that continue to produce these gases today. Organisms also produce CO 2 and fix it into biomass. Some CO 2 and N 2 arise from geological sources such as volcanoes, but their contribution is small compared to that of biological cycles (discussed in Chapter 22). The overall composition of Earth’s atmosphere is determined by living organisms, primarily microbes.
Temperature. Another important aspect of Earth’s habitat, determined by the atmospheric density and composition, is temperature. Atmospheric gases absorb light and convert the energy to heat, raising the temperature of the surface and atmosphere. This rise in temperature is known as the greenhouse effect. Because carbon dioxide is an especially potent greenhouse gas, the CO 2 -rich atmosphere of early Earth could have heated the planet to temperatures approaching those of Venus, eliminating the possibility of life. Instead, microbial consumption of CO 2 and generation of nitrogen and oxygen gases limited Earth’s surface temperature to an average of 13°C. The cooling effect may have led to an ice age, possibly reversed by rising methane from methanogens. One way or another, the history of Earth’s atmosphere is intimately related to the history of microbial evolution.
Geological Biosignatures for Early Life
Evidence for life in the geological record is called a biosignature, or biological signature. Biosignatures have been found that are even earlier than the oldest fossils. Their significance is limited, however, because it is hard to rule out nonbiogenic explanations, so researchers seek additional evidence that is based on independent principles (Table 17.1).
When in Earth’s geological record do the first biosignatures appear? Little evidence appears in the very earliest period of Earth’s existence, ranging from 4.6 to 4.0 Gyr ago; it is called the Hadean eon, named for Hades, the ancient Greek world of the dead. During the Hadean eon, repeated bombardment by meteorites vaporized the oceans, which then cooled and recondensed. Meteor bombardment may have killed off incipient life more than once before living microbes finally became established. Still, scientists speculate on whether some forms of life might have survived Hadean conditions, perhaps growing 3 km below Earth’s surface. Like the dead spirits imagined by the Greeks to have populated Hades, Earth’s earliest cells may have reached deep enough within the crust that they were protected from the heat and vaporization at the surface.
The Archean eon. The earliest geological evidence for life that is generally accepted dates to 4.0–2.5 Gyr ago, in the Archean eon ( Fig. 17.4). In the Archean, meteor bombardment was less frequent, and Earth’s crust had become solid. The Archean marked the first period with stable oceans containing the key ingredient of life: liquid water. Water is a key medium for life because it remains liquid over a wide range of temperatures and because it dissolves a wide range of inorganic and organic chemicals. Rock strata dating to the Archean eon reveal the first evidence of living organisms and their metabolic processes.
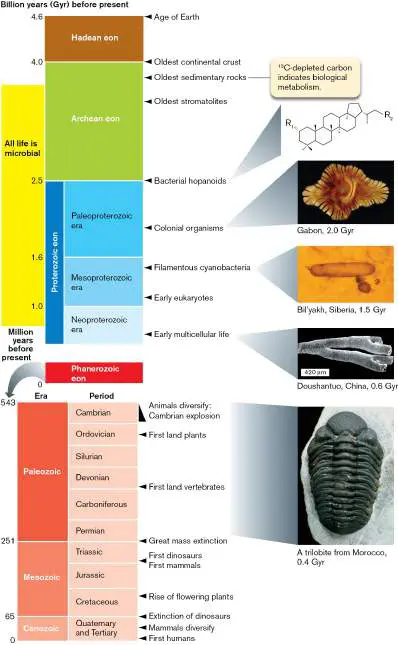
FIGURE 17.4 ■ Geological evidence for early life. The geological record shows biosignatures of microbial life early in Earth’s history, 3 Gyr before the first multicellular forms.
A. EL ALBANI ET AL. 2010. NATURE 466 :100
ANDREW KNOLL
SHUHAI XIAO AT VIRGINIA TECH
SINCLAIR STAMMERS/SPL/SCIENCE SOURCE
Note: The term “Archean,” also spelled “Archaean,” refers to the
earliest geological eon when life existed.
The adjective “arch a eal” refers to the taxonomic domain of life Arch a ea. The domain Archaea (originally “Archaebacteria”) was named by Carl Woese because known members of this domain were thought to resemble the earliest life forms of the Archaean eon. Today, a broader range of Archaea are known to possess diverse traits and habitats.
The term “archae o n” refers to a single organism of the Archaea. How and when did living cells arise out of inert materials? Without a time machine to take us back 4 Gyr, we must rely on evidence from Earth’s geology. Interpreting geology is a challenge because most forms of evidence for early life are indirect and subject to multiple interpretations. The further back in time, the more the rock has changed, and the greater the difficulties are. One way to meet this challenge, however, is to compare the results from different kinds of biosignatures (Table 17.1). If two or more kinds of evidence (such as microfossils and isotope ratios) point to life in the same location, the conclusion is strengthened.
Geological Evidence of
TABLE 17.1
Early Life
Type of Advantages Limitations evidence Stromatolites Layers of Fossil Some layered phototrophic stromatolites formations microbial appear in the attributed to communities grew oldest rock of the stromatolites have and died, and their Archean eon. Their been shown to be form was filled in distinctive shapes formed by abiotic by calcium resemble those of processes.
carbonate or silica. modern living stromatolites.
Microfossils Early microbial Microfossils are Microscopic rock cells decayed, and visible and formations require their form was measurable, subjective filled in by calcium offering direct interpretation.
carbonate or silica. evidence of cell Some formations The size and form. Elemental may result from shape of content can be abiotic processes.
microfossils analyzed by resemble those of Raman modern cells. spectroscopy and by NanoSIMS for isotope ratios.
Isotope ratios Microbes fix 12 CO Isotope ratios are We cannot prove 2 more readily a highly absolutely that no than 13 CO. reproducible abiotic process 2 physical could generate a Thus, limestone 13 measurement. given isotope ratio.
depleted of C Isotope ratios Isotope ratios tell must have come generated by key us nothing about from living cells. biochemical the shape of early Similarly, sulfate-reactions can cells or how they respiring bacteria calibrate the time evolved.
cause more lines of depletion of 34 S phylogenetic trees.
compared with 32 NanoSIMS can S. reveal isotope ratios of microfossils.
Organic biosignatures Certain organic Biosignatures such A molecule thought molecules found in as hopanoids are to be made only by sedimentary rock complex molecules living organisms are known to be specific to may be discovered formed only by bacteria. in abiotic reactions certain microbes. of organic These molecules chemistry. In the oldest rocks, are used as organic biosignatures. biosignatures are eliminated by metamorphic processes.
Oxidation state The oxidation Oxidized metals It is hard to rule state of metals offer evidence of out abiotic causes such as iron and microbial of oxidation. Even uranium indicates processes even in if the oxidation was the level of O 2 highly deformed biogenic, it does available when the rock. not reveal the kind rock formed. of metabolism.
Banded iron formations suggest intermittent oxidation by microbial phototrophs.
Raman spectroscopy Raman Raman signals Raman spectroscopy reveal the spectroscopy measures energy presence of requires high levels of laser light organic molecules sensitivity and scattering. The that compose advanced levels are shifted living organisms. equipment. It does by vibrational not reveal details energy states Measurement is of complex characteristic of nondestructive. molecules.
carbon molecular bonds.
Microfossils. The most direct evidence for early microbial life is the appearance of microfossils, microscopic fossils in which minerals have precipitated and filled in the form of ancient microbial cells ( Fig. 17.5). Microfossils often appear strikingly similar in form to present-day microbes. For example, fossil cells of 1.2-Gyr-old filamentous algae from Arctic Canada (Fig. 17.5A) appear comparable in form and size distribution to cells of modern algae ( Fig. 17.5B ). Microfossils are dated by the age of the rock formation in which they are found, which in turn is based on evidence such as radioisotope decay.
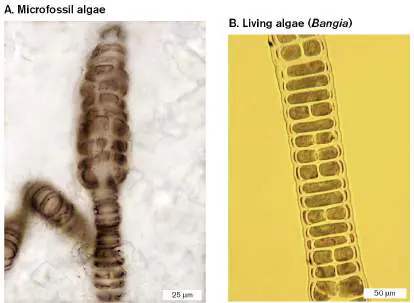
FIGURE 17.5 ■ Microfossils compared with modern bacteria. A. Filamentous algae, 1.2 Gyr old, from Arctic Canada. B. Modern red algae, Bangia sp.
NICHOLAS J. BUTTERFIELD, UNIVERSITY OF CAMBRIDGE
NICHOLAS J. BUTTERFIELD, UNIVERSITY OF CAMBRIDGE
Yet how can we be sure that a microscopic shape in a rock is actually the imprint of a once-living organism? To be accepted as biogenic (formed from living organisms), a microfossil must meet at least two criteria: Cellular form. The fossil needs to show regular patterns of cells that resemble the form of modern living cells and which cannot be ascribed to abiotic (nonbiological) causes.
Traces of organic carbon. Chemical analysis can be performed by Raman spectroscopy, which measures the effect of carbon bond vibrational energy on scattering of laser light. Mass spectrometry techniques such as NanoSIMS (see Chapter 2) can reveal carbon isotope ratios, a further sign of biochemical activity.
Figure 17.6Ashows a sample of a microfossil obtained from chert in a mountain outcrop dated at 1.5 Gyr ago, in Gaoyuzhuang, China. A thin section was taken for microscopy. In the micrograph, the regular formation of ovoid cells is consistent with the size and shape of modern cyanobacteria such as Chroococcus (discussed in Chapter 18). Raman spectroscopy shows concentrated organic biomass in the curved shape of each fossil cell (Fig. 17.6B ). In addition, mass spectrometry was applied at the microscopic level using NanoSIMS. The NanoSIMS map (Fig. 17.6C ) shows the ratio of 13 C/ 12 C across the sample. 13 C depletion is found in the envelope of each putative cell, a sign of enzyme-mediated carbon fixation. Thus, three types of evidence—cell-like form, Raman signal of carbon, and NanoSIMS 13 C depletion—confirm the microbial identification of the Gaoyuzhuang microfossil. But the exact nature of these cells—their genetics and metabolism—remains a mystery.
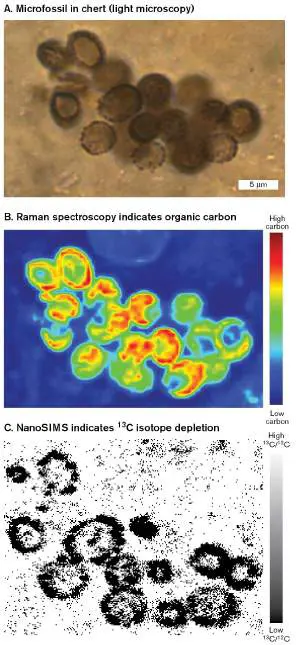
FIGURE 17.6 ■ Microfossil cyanobacteria confirmed by carbon isotope depletion. A. Microfossil cyanobacteria embedded in chert dated to 1.5 Gyr ago in Gaoyuzhuang, China, show size distribution consistent with that of living cells. B. Raman spectroscopy indicates organic carbon content of cells. C. NanoSIMS indicates 13 C isotope depletion levels consistent with cyanobacterial photosynthesis.
Z. GUO ET AL. 2018. PRECAMBRIAN RES. 304 :88–98, FIG. 4B
Z. GUO ET AL. 2018. PRECAMBRIAN RES. 304 :88–98, FIG. 4D
Z. GUO ET AL. 2018. PRECAMBRIAN RES. 304 :88–98, FIG. 4F
Isotope ratios. Even without microfossils, the past presence of life can be inferred from a physical or chemical biosignature. A key biosignature in ancient rock is that of stable isotope ratios. As in the Gaoyuzhuang microfossil, an isotope ratio provides quantitative evidence of life if the ratio between certain isotopes of a given element has been altered by biological activity. Enzymatic reactions, unlike abiotic processes, are so selective for their substrates that their rates may differ for molecules containing different isotopes. For example, the carbon-fixing enzyme Rubisco, found in chloroplasts, preferentially fixes CO containing 12 C rather than 13 C
2
(Fig. 17.7). The carbon dioxide fixed into microbial cells eventually is converted to calcium carbonate in sedimentary rock. The difference, δ 13 C, is defined by the fractional difference (in parts per thousand) between the 13 C/ 12 C ratio in a sample and that in a standard inorganic rock: FIGURE 17.7 ■ Carbon isotope depletion. A. 13 C isotope depletion (negative δ 13 C) occurs in biomass as a result of the Calvin cycle. Negative δ 13 C is observed at 3.7 Gyr in sedimentary graphite, which may derive from sedimented phototrophs. Little or no isotope depletion is seen in carbonate rock, which has no biological origin. B. Minik Rosing (right), in Greenland, shows the Isua rocks whose carbon isotope ratios indicate photosynthesis at 3.8 Gyr ago.
CHRISTIAN KNUDSEN
The calcium carbonate deposited by CO 2 -fixing autotrophs (such as cyanobacteria) shows lower 13 C content than does calcium carbonate deposited by abiotic processes. Typical δ 13 C values are shown in Figure 17.7A. Organisms on land and sea, and the CO 2 derived from their breakdown, show δ 13 C values of −10 to −30 parts per thousand. These negative δ 13 C values represent a significant 13 C depletion through carbon fixation into the original biomass that entered the food web. A comparable δ 13 C is observed in fossil fuels, which formed from plant and animal bodies decomposed by bacteria.
Thought Questions
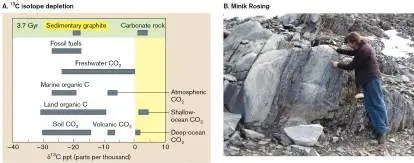
17.2 In Figure 17.7A, why does the shallow-ocean CO 2 show a positive value of δ 13 C?
17.3 Evolution by natural selection is based on competition, yet the earliest fossil life shows organized structures such as a stromatolite built by cooperating cells. How could this be explained? The most ancient mineral samples showing a substantial δ 13 C (about −18 parts per thousand) are graphite granules in the Isua rock bed of West Greenland, dated to 3.7 Gyr ago. The graphite granules were analyzed by Minik Rosing, a native Greenlander at the Danish Lithosphere Centre (Fig. 17.7B ). The graphite grains derive from microbial remains buried within sediment that subsequently metamorphosed, driving out the water content but leaving behind the telltale carbon. By contrast, nonbiogenic carbonate rock from the same formation shows a δ 13 C near zero. How old are the oldest microfossils known? In 2021, Barbara Cavalazzi and colleagues at the University of Bologna, Italy, identified microfossil chains of cells from an ancient seafloor hydrothermal vein in South Africa, dated to 3.42 Gyr ago. The microfossils show spectroscopic evidence of organic carbon. This evidence supports the existence of microbial life that fixed carbon by an enzymatic mechanism more than 3 billion years ago.
Organic biosignatures. A different kind of biosignature is given by organic molecules specific to a particular life form. Certain organic molecules may last within rock for hundreds of millions of years. A particularly durable class of molecules consists of membrane lipids. Recall from Chapter 3 that some bacterial cell membranes contain steroid-like molecules called hopanoids. A hopanoid consists of four or five fused rings of hydrocarbon with side groups that vary depending on the kind of bacteria. The hopanoid derivative 2-methylhopane is found in sedimentary rock of the Hamersley Basin of Western Australia, dated to 2.5 Gyr ago. This biosignature offers evidence that some kind of bacteria existed by the end of the Archean eon.
Banded Iron Formations Reveal Oxidation by O 2
An extraordinary event in the planet’s history was the evolution of the first oxygenic phototrophs: cyanobacteria that split water to form O 2. The entry of O 2 into Earth’s biosphere is often portrayed as a sudden event that would have been disastrous to microbial populations lacking defenses against its toxicity. In fact, geological evidence shows that oxygen arose gradually in the oceans, starting about 2 Gyr ago, and may have arisen and disappeared numerous times before reaching a high, steady-state level in our atmosphere. The mechanism of the oxygen fluctuation is unknown, but it caused cycles of aerobic and anaerobic microbial metabolism.
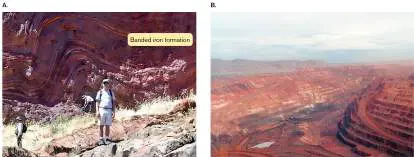
Evidence for oxygen in the biosphere comes from the oxidation state of minerals, particularly those containing iron. The bulk of crustal iron is in the reduced form (Fe 2+), which is soluble in water and reached high concentrations in the anoxic early oceans. Sedimentary rock, however, contains many fine layers of oxidized iron (Fe 3+), which is insoluble and forms a precipitate, such as iron oxide (Fe 2 O 3). The layers of iron oxide suggest periods of alternating oxygen-rich and anoxic conditions. The layered rock is called a banded iron formation (BIF; Fig. 17.8A). A common form of banded iron consists of gray layers of silicon dioxide (SiO 2) alternating with layers colored red by iron oxides and iron oxyhydroxides [FeO x (OH) y]. Banded iron formations are widespread around the world and provide our major sources of iron ore (Fig. 17.8B ).
FIGURE 17.8 ■ Banded iron formations. A. Jim Crowley, U.S. Geological Survey, studies a banded iron formation in Dales Gorge, Australia. B. The BHP Billiton Iron Ore mine at Newman, Western Australia.
DR. KURT KONHAUSER/USGS
DR. KURT KONHAUSER/USGS
Banded iron formations are often found in rock strata containing signs of past life such as 13 C depletion and other biomarkers. For example, the Isua formations (Greenland) and Hamersley formations (Western Australia), which both show 13 C depletion, also contain extensive banded iron. Calculations indicate that the layers of oxidized iron could result from biological metabolism involving iron oxidation. One possibility is that chemolithotrophs oxidized the iron, using molecular oxygen produced by cyanobacteria. The Archean and early Proterozoic eons experienced fluctuating levels of molecular oxygen in the atmosphere. These fluctuations could have led to oscillating levels of iron oxide, thus producing bands in the sediment, as microbes used up all the oxygen.
By 2.3 Gyr ago, the prevalence of oxidized iron and other minerals indicates the steady rise of oxygen from photosynthesis in Earth’s atmosphere. Most of the dissolved Fe 2+ from the ocean floor was oxidized, leaving the oceans in the iron-poor state that persists today. As the most efficient electron acceptor, molecular oxygen enabled the evolution of aerobic respiratory bacteria. Aerobic bacteria gave rise to mitochondria, which enabled the evolution of
eukaryotes and, ultimately, multicellular organisms (Fig. 17.9). But even today, cells consist mainly of reduced molecules, highly reactive with oxygen—a relic of the time when our ancestral cells evolved in the absence of oxygen.
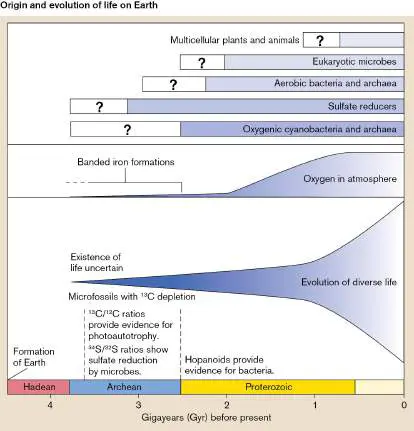
FIGURE 17.9 ■ Proposed time line for the origin and evolution of life. The planet Earth formed during the Hadean eon (about 4.6–4.0 Gyr ago). The environment was largely reducing until cyanobacteria pumped O 2 into the atmosphere. When the O 2 level reached sufficient levels (about 0.6 Gyr ago), multicellular animals and plants evolved. Question marks
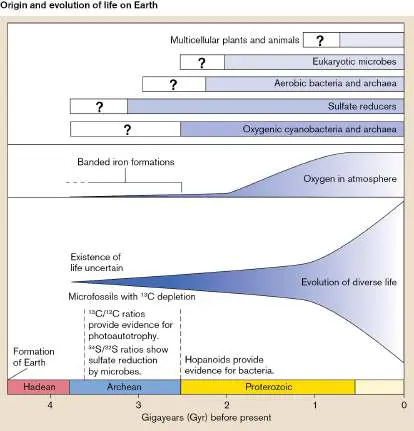
designate periods when evidence for given life forms is uncertain.
To Summarize
Elements of life were formed through nuclear reactions within stars that exploded into supernovas before the birth of our own Sun.
Reduced molecules compose Earth’s interior. Oxidized minerals are found only near the surface. Early Earth had no molecular oxygen (O 2).
Archean rocks show evidence for life based on the basis of fossil stromatolites, isotope ratios, and chemical biosignatures. Fossil stromatolites appear in chert formations that arose 3.4 Gyr ago. Isotope ratios for carbon indicate photosynthesis at 3.7 Gyr ago. Bacterial hopanoids appear at 2.5 Gyr ago.
Microfossils of filamentous and colonial prokaryotes date to 3.4 Gyr ago. At 1.2 Gyr ago, larger fossil cells resemble those of modern eukaryotes.
Microfossils are confirmed by Raman spectroscopy revealing organic carbon and by NanoSIMS showing 13 C depletion.
Banded iron formations reflect the cyclic increase and decrease of oxygen produced by cyanobacteria and consumed through reaction with reduced iron. After most of the ocean’s iron was oxidized, oxygen increased gradually in the atmosphere.
Glossary
microbial mat A complex biofilm of microbes, usually containing multiple layers.
stromatolite A mass of sedimentary layers of limestone produced by a marine microbial community over many years.
endolith A bacterium that grows within the crystals of solid rock. biosphere The region containing the sum total of all life on Earth. greenhouse effect The trapping of solar radiation heat in the atmosphere by CO 2; a cause of global warming.
biosignature Also called biological signature. A type of chemical believed to be formed only by specific life processes.
biological signature See biosignature .
Hadean eon The first eon (major time period) of Earth’s existence, from 4.6 to approximately 4.0 gigayears (Gyr, 10 9 years) before the present.
Archean eon The second eon (major time period) of Earth’s existence, from 4.0 gigayears (Gyr, 10 9 years) to 2.5 Gyr before the present. The earliest geological evidence for life dates to this eon. microfossil A microscopic fossil in which calcium carbonate deposits have filled in the form of ancient microbial cells.
biogenic Formed by living organisms.
isotope ratio The ratio of amounts of two different isotopes of an element. It may serve as a biosignature if the ratio between certain isotopes of a given element is altered by biological activity. banded iron formation (BIF)
A geological formation containing layers of oxidized iron (Fe 3+ ), which indicates formation under oxygen-rich conditions. BIF See banded iron formation .
17.2 Forming the First Cellsnot assigned
Various models have been proposed to explain how the first living cells originated from nonliving materials and how they replicated and evolved. Models for early life attempt to address the following questions: In what kind of environment did the first cells form? What kind of metabolism did the first cells use to generate energy? What was their hereditary material?
The Prebiotic Soup
The prebiotic soup model proposes that abiotic (nonliving) reactions in the Archean oceans could have assembled complex organic molecules of life (Fig. 17.10). These reactions would have involved simple reduced chemicals such as ammonia and methane, which led to more complex macromolecules that acquired the apparatus needed for self-replication and membrane compartmentalization.
FIGURE 17.10 ■ The prebiotic soup model for the origin of life. A. In the prebiotic soup, inorganic molecules could have reacted to form complex macromolecules that eventually acquired the apparatus for self-replication and membrane compartmentalization. B. Lightning accompanies an eruption of
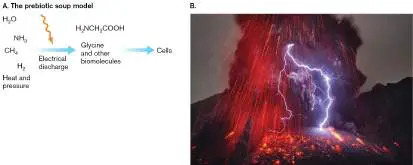
the Sakurajima Volcano in Japan in 2013. The first biomolecules may have formed as a result of lightning triggered by volcanic eruption.
NATIONAL NEWS/ZUMA PRESS/NEWS.COM
What evidence supports the prebiotic soup? In the mid-twentieth century, biochemists Aleksandr Oparin (1894–1980), at Moscow University, and Stanley Miller (1930–2007) and Harold Urey (1893– 1981), at the University of Chicago, showed that organic building blocks of life such as amino acids could arise abiotically out of a mixture of water and reduced chemicals, including CH 4, NH 3, and H 2 (Fig. 17.10). The mixture was subjected to an electrical discharge, similar to the lightning discharges that arise from volcanic eruptions, which would have been common in the late Hadean or early Archean eon. The chemical reaction produced fundamental amino acids such as glycine and alanine. Similar experiments by Joan Oró (1923–2004), at the University of Houston, showed the formation of adenine by condensation of ammonia and hydrogen cyanide.
The same amino acids and nucleobases arising from early-Earth simulation are also found in meteorites, which are believed to retain the chemistry of the early solar system “frozen” in time. But unlike the chemical experiments, the meteorites show a remarkable predominance of left-handed mirror forms (L enantiomers) of the amino acids—the same L form utilized in the protein synthesis of all life on Earth. Some researchers hypothesize that organic compounds formed in outer space were restricted to the L form by an unknown process and then “seeded” the propagation of L -form compounds in Earth’s prebiotic soup.
How were the first biochemical reactions contained in a cell, the fundamental unit of life? Forming the first cells must have required enclosing the first biochemical reactants within a membrane-like compartment. Jack Szostak and colleagues at Harvard Medical School investigate how such compartments can arise spontaneously from fatty acid glycerol esters. The fatty acid derivatives are “amphipathic”; that is, they possess both hydrophobic portions that associate together and hydrophilic portions that associate with water. In water, the fatty acid derivatives collect in micelles—small, round aggregates in which the hydrophobic portions associate in the interior and the hydrophilic portions associate with water. Under certain conditions, micelles can aggregate to form hollow vesicles of membrane. Szostak showed how the vesicles can take up molecules such as RNA, suggesting a primitive cell-like form. These spontaneous processes of membrane formation offer models for how the first living cells may have arisen.
Early Oxidation-Reduction Reactions
How did the earliest life forms gain energy without oxygen gas to respire and without the complex machinery of photosynthesis? The original model conditions for the prebiotic soup assumed that molecules in the early Archean ocean were largely reduced, with little or no oxygen present in the atmosphere. More recent geochemical evidence suggests that the early ocean actually included oxidized forms of nitrogen, sulfur, and iron that arose through abiotic reactions driven by ultraviolet radiation, which penetrated the atmosphere in the absence of the ozone layer. These oxidized minerals could have reacted with the reduced crustal minerals, releasing energy to drive production of more complex reactions. For example, nitrate (NO −) or sulfate (SO 2−) could
3 4
be reduced by hydrogen gas to yield energy (hydrogenotrophy; discussed in Chapter 14).
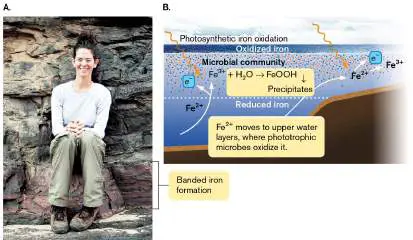
The major source of energy for ecosystems is sunlight, which drives oxidation-reduction cycles via photosynthesis (Chapter 14). But early photosynthesis could have looked very different from the Rubisco-mediated Calvin cycle. Dianne Newman (Fig. 17.11A), at the California Institute of Technology, proposes that iron oxides arose directly from anaerobic photosynthesis, in which the reduced iron served as the electron donor. In iron phototrophy, or photoferrotrophy, light excites an electron from Fe 2+, oxidizing the ion to Fe 3+, while the excited electron cycles through an electron transport system to yield energy (Fig. 17.11B ). Newman discovered iron phototrophy in modern purple bacteria such as Rhodopseudomonas palustris, growing in the anoxic bottom layer of iron-rich lakes.
FIGURE 17.11 ■ Iron phototrophy. A. Dianne Newman proposes that early iron phototrophs caused the iron oxide deposition generating banded iron formations. B. Photosynthetic oxidation of Fe 2+ to Fe 3+ by microbes (orange and blue dots) may have generated sedimentary layers of Fe 2 O 3 and FeO x (OH) y.
DIANNE NEWMAN, CALTECH
On the ancient Earth, photosynthetic oxidation of Fe 2+ to Fe 3+ could have occurred in cycles until the marine iron was all oxidized. The oxidized Fe 3+ would then serve as an electron acceptor for benthic organisms. Alternating redox reactions generated the sedimentary layers of iron oxides and iron oxyhydroxides in banded iron formations.
Early 13 C depletion signals offer surprisingly early evidence for carbon fixation cycles based on Rubisco, powered either by photosynthesis or by chemolithotrophy. Another early redox metabolism would have been methanogenesis. The most fundamental form of methanogenesis involves the reaction of H 2 and CO 2 producing CH 4 and H 2 O. Methanogens show highly divergent genomes—a finding that suggests early evolution of their common ancestor. Their biochemistry and evolution (discussed in Chapter 19) are consistent with proposed models of ancient life.
The RNA World
The prebiotic soup model does not account for the evolution of macromolecules that encode complex information, such as long chains of nucleic acids and proteins. A candidate for life’s first “informational molecule” is RNA. The RNA world is a model of early life in which RNA performed all the informational and catalytic roles of today’s DNA and proteins. The concept of an RNA world draws upon genome sequences, which reveal thousands of catalytic and structural RNAs. The concept has surprising relevance for medicine, as we investigate the function of RNA viruses such as influenza virus and human immunodeficiency virus (HIV; discussed in Chapters 6 and 11).
RNA is a relatively simple biomolecule, with only four different “letters,” compared to the 20 standard amino acids of proteins. Its purine base adenine arises spontaneously from ammonia and carbon dioxide under conditions believed to resemble those of the Archean eon. In 2022, biochemists identified all the major purines and pyrimidines of nucleic acids in asteroids visited by the Japan Aerospace Exploration Agency (JAXA) and by the U.S. National Aeronautics and Space Administration (NASA). The presence of these bases is evidence that the essential “letters” of the RNA/DNA alphabet would have been available to nascent microbial life when Earth first formed in the solar system.
The ribose sugar of RNA is a fundamental building block of living cells, with key roles in numerous biochemical pathways such as the Calvin cycle. For several reasons, RNA is a better candidate than DNA for the earliest information molecule. Compared to DNA, RNA requires less energy to form and degrade. RNA’s pyrimidine base uracil is formed early by biochemical pathways; only later is it converted to the thymine used by DNA.
Most important, RNA molecules have been shown to possess catalytic properties analogous to those of proteins. Catalytic RNA molecules are called ribozymes. The first ribozyme, discovered by Nobel laureate Thomas Cech in the protist Tetrahymena, can splice introns in messenger RNA (mRNA). Other ribozymes actually catalyze synthesis of complementary strands of RNA, suggesting a model for early replication of RNA chromosomes. The most elaborate example of catalytic RNA is found in the ribosome. X-ray crystallography of the ribosome reveals that the key steps of protein synthesis, such as peptide bond formation, are actually catalyzed by the RNA components, not proteins (discussed in Chapter 8). The ribosomal proteins possess relatively little catalytic function; their main role seems to be protection and structural support of the RNA. Could RNA molecules have composed the earliest cells? In 2009, Tracey Lincoln and Gerald Joyce at the Scripps Research Institute devised a system in which two RNA ribozymes catalyze each other’s synthesis. The ribozyme model system suggests how, in the earliest cells, RNA might have fulfilled the key functions that are today filled by DNA and proteins, including information storage, replication, and catalysis (Fig. 17.12).
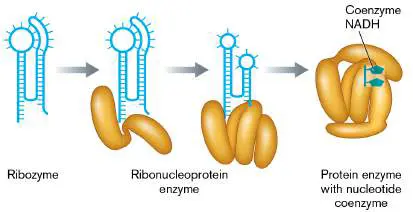
FIGURE 17.12 ■ From the RNA world to proteins. The earliest cells may have been composed of RNA enzymes (ribozymes). As the RNA cells evolved, ribozymes acquired protein subunits that eventually assumed most of their catalytic functions. Remnants of the original RNA may persist as nucleotide cofactors such as NADH.
The prominent function of RNA in the ribosome, one of life’s most ancient and conserved molecular machines, suggests a model for the transition from an RNA world to the modern cell. In the ribosome, the actual steps of catalysis, such as forming the peptide bond, are conducted by RNA subunits acting as ribozymes. The ribozymes are stabilized by protein subunits. Thomas Cech, Sidney Altman, and colleagues propose that the earliest RNA components of cells evolved by acquiring proteins to enhance stability. The proteins helped prevent the tendency of RNA to hydrolyze (come apart in reaction with water). As cells evolved, their peptide components increased through natural selection, and the RNA subunits may have shrunk by reductive evolution (the evolutionary loss of unneeded parts). A few complexes, such as the ribosome, still maintain their ribozymes; for others, perhaps all that remains are one or two nucleotides. Dinucleotide cofactors such as NADH persist in enzymes today, perhaps representing vestigial remnants of the RNA world.
Thought Question
17.4 Outline the strengths and limitations of the prebiotic soup model and the RNA world model of the origin of living cells. Which aspects of living cells does each model explain?
Unresolved Questions about Early Life
Overall, geology and biochemistry provide compelling evidence that organisms resembling today’s cyanobacteria lived on Earth at least 2.5 Gyr ago, possibly 3.7 Gyr ago, and that bacteria or archaea with anaerobic metabolism evolved as early or earlier. Many intriguing questions remain.
Thermophile or psychrophile? The apparent existence of life so soon after Earth cooled suggests a thermophilic origin. Thermophily is supported by the fact that in the domains Bacteria and Archaea, the deepest-branching clades (that is, kinds of organisms that diverged the earliest from others in the domain) are thermophiles. Such organisms could have thrived at hydrothermal vents, which offer a continual supply of H 2 S and carbonates.
On the other hand, after meteoric bombardment abated, early Earth should have become glacially cold. In the Archean, solar radiation was 20%–30% less intense than it is today, and the thin CO 2 atmosphere was insufficient to increase the temperature by a greenhouse effect. A colder habitat would support psychrophiles. Psychrophiles might have had an advantage in an RNA world, given the thermal instability of RNA compared to DNA and proteins. A methane atmosphere? If the Archean Earth was much cooler than today, what prevented Earth from freezing like Mars? Some researchers argue that the production of methane, an extremely potent greenhouse gas, could have greatly increased Earth’s temperature during the Archean eon. The methane produced would have been oxidized by methanotrophs (methane oxidizers), thus preventing the planet from overheating like Venus. The subsequent decline of methane and the rise of CO 2 then would have brought about relative thermal stability.
The debate over the temperature and climate of early Earth has interesting implications for Earth today, when we again face the prospect of massive global climate change.
Human agriculture favors explosive growth of methanogens, which threaten to accelerate global warming faster than the biosphere can moderate it. Understanding the climate of early Earth may help us better understand and manage our own climate, discussed in Chapter 22.
Rapid evolution of first cells? Emerging evidence from fossils and geochemistry has inexorably pushed back the earliest known dates for several kinds of metabolism closer to 3.7 Gyr ago (Fig. 17.9). This adjusted time frame implies that as soon as Earth cooled to a temperature suitable for life, all the fundamental components of cells evolved almost immediately. How could microbial life, with all its diverse kinds of metabolism, have arisen so quickly?
One possible explanation is that life evolved on early Earth faster than it does today. Today, RNA viruses such as the coronavirus SARS-CoV-2, influenza, and HIV mutate and evolve much faster than modern cells (discussed in Chapter 11). If early cells with RNA genomes mutated as fast as viruses, they might have evolved and diverged faster than cellular organisms that we know today. Some microbiologists propose an alternate explanation, that life forms originated elsewhere and “seeded” life on Earth. The concept that terrestrial life came from outside Earth is called panspermia. Theories of panspermia remain highly speculative. One hypothesis is that microbial cells originated on Mars and were then carried to Earth on meteorites. As the solar system formed, Mars would have cooled sooner than Earth, and because it is also smaller than Earth, Mars’s weaker gravity would have generated less bombardment by meteorites. Martian rocks ejected into space by meteor impact have reached Earth, and calculations based on simulated space habitats show that microbes could survive such a journey. A Martian origin, however, gains us only about half a billion years; it does not really explain the origin of life’s complexity and diversity. Did life forms come from still farther away, perhaps borne on interstellar dust from some other solar system? In that case, it would be hard to imagine how organic cells could survive light-years of travel subjected to cosmic radiation.
Thought Question
17.5 Suppose a NASA rover discovered living organisms on Mars. How might such a find shed light on the origin and evolution of life on Earth?
To Summarize
Prebiotic soup models propose that the fundamental biochemicals of life arose spontaneously through condensation of reduced inorganic molecules.
Early metabolism involved anaerobic oxidation-reduction reactions. Likely forms of early metabolism include sulfate respiration, light-driven ion pumps, photoferrotrophy, iron phototrophy, and methanogenesis.
The RNA-world model proposes that in the first cells, RNA performed all the informational and catalytic roles of today’s DNA and proteins.
Thermophile or psychrophile? Classic models of early life assume thermophily, but Earth may actually have been cold when the first cells originated.
A world of methane? If the first cells were methanogens, methane production could have led to the first greenhouse effect, warming Earth and enabling evolution of other kinds of life.
Origin on Earth or elsewhere? Isotope ratios suggest the presence of complex metabolism by 3.7 Gyr ago, shortly after Earth cooled (4.0 Gyr ago). Simpler cells existing before 4.0 Gyr ago may have evolved much faster than life today does. A more speculative possibility is that life first evolved on another planet.
Glossary
prebiotic soup A model for the origin of life that is based on the abiotic formation of fundamental biomolecules and cell structures such as membranes out of a “soup” of nutrients present on early Earth.
abiotic Produced without living organisms; occurring in the absence of life.
photoferrotrophy Photosynthesis in which light absorption provides energy to separate an electron from reduced iron (Fe 2+).
RNA world A model of early life in which RNA performed all the informational and catalytic roles of today’s DNA and proteins. ribozyme See catalytic RNA .
panspermia The hypothesis that life forms originated elsewhere in the universe and “seeded” life on Earth.
Fig. 17.9 FIGURE 17.9 ■ Proposed time line for the origin and evolution of life. The planet Earth formed during the Hadean eon (about 4.6–4.0 Gyr ago). The environment was largely reducing until cyanobacteria pumped O 2 into the atmosphere. When the O 2 level reached sufficient levels (about 0.6 Gyr ago), multicellular animals and plants evolved. Question marks designate periods when evidence for given life forms is uncertain.
17.3 Evolution: Phylogeny and Gene TransferUnit 2 · Genomes
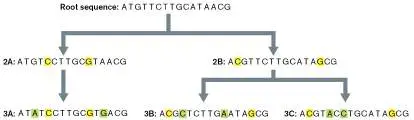
The unifying assumption of modern biology is genetic relatedness. As organisms reproduce themselves, they generate progeny with genomes that are nearly identical—but differ slightly due to mutation. In Figure 17.13, for example, each offspring in generation 2 acquires two new mutations; their sequences now differ by 25%. In the next generation, each individual propagates the earlier mutant sequences while acquiring two more random mutations. Strain 3A now differs by 50% from strains 3B and 3C, which differ by 25% from each other. (Actual mutation frequencies, of course, are much lower—about one base per million per generation.) We assume that the chromosomes of offspring acquire a consistent number of random mutations from their parents, if environmental conditions are similar, and therefore the number of sequence differences between two species should be proportional to the time of divergence between them. FIGURE 17.13 ■ Genetic sequences diverge. As genetic molecules reproduce, the number of mutations (shaded in yellow and green) accumulated at random is proportional to the number of generations and thus the time since divergence. In each sequence designation (for example, “2A”), the number indicates the generation and the letter identifies a specific strain.
Genetic Divergence Generates Phylogeny
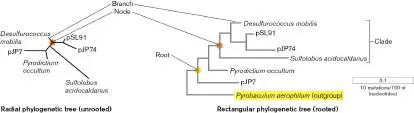
The history of branching divergence of multiple species and strains is called phylogeny. Phylogeny generates a phylogenetic tree; that is, a series of branching groups of related organisms. Figure 17.14, for example, shows two views of a phylogenetic tree generated from data obtained from polymerase chain reaction (PCR)-amplified sequences of small-subunit ribosomal RNA (SSU rRNA) from isolates in Obsidian Pool, a thermal spring at Yellowstone National Park. The sequences were analyzed by Susan Barns and colleagues at Indiana University in the laboratory of Norman Pace, a pioneering investigator of extreme habitats. Note that some of the Obsidian Pool samples are known species, such as the thermophile Pyrodictium occultum, whereas others are uncharacterized organisms given alphanumeric designations, their existence known only by the rRNA sequences reported here. In fact, any microbial habitat surveyed by PCR, including a human body, will yield previously unknown species.
FIGURE 17.14 ■ Phylogenetic trees: rooted and unrooted. Comparison of rRNA sequences was used to generate a phylogenetic tree for thermophiles isolated from Obsidian Pool in Yellowstone National Park. Left: The radial phylogenetic tree shows the degrees of relatedness among taxa on the basis of the number of molecular substitutions on each branch (see scale bar). Right: The rectangular tree shows the same divergence distances lined up in parallel. This rectangular tree includes a root, a common ancestor defined by divergence from an outgroup taxon (yellow highlight). A rooted tree indicates the position of a common ancestor.
Source: Susan M. Barnes et al. 1996. PNAS 93 :9188.
Within a phylogenetic tree, groups of related organisms that share a common ancestor are called clades (Fig. 17.14). Each clade is a monophyletic group; that is, a group of organisms that share a common ancestor not shared by any kind of organism outside the clade. Each
monophyletic group then branches into smaller monophyletic groups, and ultimately into species, the fundamental kind of organism (discussed in Section 17.5). Species inevitably diverge into strains or subspecies that have acquired different mutations.
A branch of a phylogenetic tree is a lineage of organisms that share a common ancestor. The length of the branch represents the number of mutations in a class of organism compared to its ancestor. Assuming constant mutation rate and generation time, the branch length should represent the amount of time since divergence from other descendants of the ancestor. The total distance (in terms of base-substitution frequency) between any two sequences is approximated by the distance from each sequence and its branch point, or node (Fig. 17.14). A node for a group of branches is called a root; that is, a common ancestor. Moving from the root to the tips of the branches means moving forward in time; a line of individuals, past and present, that descends from one ancestor is called a lineage. The root is defined by comparing the entire tree with an outgroup, which must be known to have diverged from the root before every other lineage in the tree did. In the tree at right in Figure 17.14, for example, a lineage connects the root with the present-day archaeon Desulfurococcus mobilis, and the tree is rooted by the outgroup Pyrobaculum aerophilum, which is equally distant from the entire clade of the tree.
Phylogenetic trees can be drawn in different ways. The tree at left in Figure 17.14is a radial tree, in which branches indicate distance outward from their nodes. The tree at right in Figure 17.14shows the same divergence distances from nodes, drawn as a rectangular tree. In a rectangular tree, all branches run in parallel. A rectangular tree enables easier comparison between divergent branches, but it takes up more space than a radial tree, especially when large numbers of organisms are compared.
If the length of each branch corresponds to a given length of time, we might expect each of the lineages of branches to add up to the same total length, assuming a constant rate of mutation. In some trees this condition is approximated, but in microbial trees the branch lengths differ greatly. For example, in Figure 17.14, Sulfolobus acidocaldarius appears to have evolved much more than Desulfurococcus mobilis. The reason is that S. acidocaldarius and its recent ancestors have accumulated mutations faster. In every microbial tree, some lineages accumulate mutations faster than others. The differences in branch length arise from differences in mutation rate and from differences in generation time between organisms whose sequences are compared. Thus, our molecular phylogeny is inevitably distorted.
Populations of organisms diverge from each other through several fundamental mechanisms of evolution. These include: Random mutation. DNA sequences change through rare mistakes (in bacteria and archaea, typically one out of a million base pairs) as the chromosome replicates (discussed in Chapter 7). Replication errors result in mutation (discussed in Chapter 9). Most mutations are neutral; that is, they have no effect on gene function.
Natural selection and adaptation. In a given environment, natural selection favors organisms that produce greater numbers of offspring in that environment (discussed in Section 17.4). Genes encoding traits under selection pressure may show mutation frequencies much higher or lower than those generated by the random mutation rate. Natural selection enables a population to adapt to a changing environment. Reductive evolution (degenerative evolution). In the absence of selection for a trait, the genes encoding the trait accumulate mutations without affecting the organism’s reproductive success. Because mutations that decrease function are more common than mutations that improve function, accumulating mutations without selection pressure leads to decline and ultimately loss of the trait. The loss or mutation of DNA encoding unselected traits is called reductive evolution (or degenerative evolution).
Horizontal gene transfer. Phylogeny consists of more than branching divergence; the ancestry of all life forms includes horizontal gene transfer (discussed in Chapters 7 and 9). Both vertical gene transfer (from parent to offspring) and horizontal gene transfer shape all life forms, including humans.
Random mutations with neutral effects that are not subject to selection tend to accumulate at a steady rate over generations because the error rate of the DNA replication machinery stays about the same. After mutations accumulate, “genetic drift” can cause sequences in separate populations to diverge over time. The constancy of the mutation rate (within limits) provides a tool for us to measure the time of divergence of organisms on the basis of their DNA sequences.
Thought Question
17.6 What kinds of DNA sequence changes have no effect on gene function? (Hint: Refer to the table of the genetic code, Figure 8.12.)
Predicting Phylogeny of Gene and Genome
How do we calculate, or “predict,” the actual phylogeny of a group of related organisms? Although we can never know for certain, the divergence of genetic information (DNA, RNA, or peptide sequence) enables us to calculate the probability of a given tree. But, given all the factors that influence mutation rate, how good is our prediction? One approach is to select a particular gene (or set of genes) that is known to accumulate mutations at a steady rate, relatively impervious to selection effects. The gene must be shared by all organisms in the tree. Such a gene or macromolecular sequence is called a molecular clock. Molecular clocks have revolutionized our understanding of the emergence of all living organisms, including human beings.
Ideally, a molecular clock gene has the following features: The gene has the same function across all types of organisms compared. That is, all versions are orthologous; they have not evolved to serve different functions. Functional difference may lead to different rates of change.
The generation time is the same for all organisms compared.
Shorter generation times (more frequent reproductive cycles) lead to overestimates of the overall time of divergence because of the increased opportunity for DNA mutation.
The average mutation rate remains constant among organisms and across generations. If different kinds of life mutate at different rates, then organisms with more rapid rates of mutation will appear to have diverged over a longer time than is actually the case.
In practice, these requirements are never fulfilled exactly, but we do the best we can, and we remember the various ways that a tree may deviate from measuring time. Genes that show the most consistent measures of evolutionary time encode components of the transcription and translation apparatus, such as ribosomal RNA and proteins, transfer RNA (tRNA), and RNA polymerase. The most widely used molecular clock is the gene encoding the small-subunit ribosomal RNA (SSU rRNA). The SSU rRNA is also known by its sedimentation coefficient: 16S rRNA (bacteria and archaea) or 18S rRNA (eukaryotes). The SSU rRNA was first used by Carl Woese (1928–2012) in 1977 to reveal the domain Archaea (discussed shortly).
The SSU rRNA is particularly useful because certain portions of its sequence are remarkably conserved across all forms of life. These portions can be used to define primers to PCR-amplify the DNA of the gene encoding the rRNA (PCR is discussed in eAppendix 3). The gene sequence lying between the pair of highly conserved rDNA sequences will show greater variation, allowing distinction between different clades. PCR can be used to amplify genes even from a mixture of uncultured organisms.
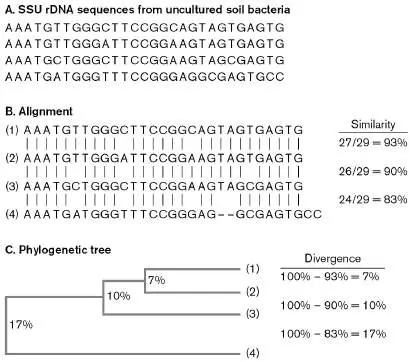
Use of a molecular clock requires the alignment of homologous sequences in divergent species or strains (Fig. 17.15). Alignment is the correlation of portions of two gene sequences that diverged from a common ancestral sequence (homologous sequence). The process requires assumptions and decisions about base substitutions and about insertions and deletions. For example, in Figure 17.15B , the best alignment requires us to assume that two bases were lost from the fourth sequence (or else inserted into the ancestor of the other sequences). The relative differences among the sequences can be used to propose a tree of divergence (Fig. 17.15C ) in which the length of each branch is proportional to the number of differences between two sequences. The number of differences, or divergence, is given by 100% minus the percentage of similarity between the aligned sequences.
FIGURE 17.15 ■ DNA sequence alignment. A. SSU rDNA sequences from different organisms can be aligned at homologous regions. B. The best alignment is that minimizing mismatches. C. A possible phylogenetic tree of divergence of the four sequences. See above for Phylogenic Trees animation In practice, a much larger amount of sequence with multiple differences is needed to calculate a phylogenetic tree. All trees are based on probability, with ambiguities depending on the assumptions of how sequences change. The data are calculated by computer programs, which may yield different results depending on their assumptions, such as: The minimum number of changes gives the best alignment.
The best alignment between two sequences is that assuming the smallest number of mutational changes.
Functional sequences change more slowly. Sequences that encode essential catalytic portions of the gene product are maintained by selection pressure and change more slowly than portions of the molecule without essential function.
A phylogenetic tree is a model. All phylogenetic trees depend on complex mathematical analysis to measure degrees of divergence and propose a tree that most probably connects current sequences with their common ancestor. Because we can never know the exact tree with certainty, different types of calculations may lead to slightly different results. Two common approaches are: Maximum parsimony. Evolutionary distances are computed for all pairs of taxa on the basis of the numbers of nucleotide or amino acid substitutions between them. A proposed common ancestor, or “ancestral state,” is reconstructed. All possible trees comparing relative time of divergence from the common ancestor are computed. The “best fit” tree is defined as the one requiring the fewest mutations to fit the data (that is, the one that is most “parsimonious”). A limitation of parsimonious reconstruction is that more than one tree may produce results consistent with the data.
Maximum likelihood. For each possible tree, one calculates the likelihood (probability) that such a tree would have produced the observed DNA sequences. The probability of given mutations is based on complex statistical calculations. Maximum-likelihood methods require large amounts of computation but obtain the most information from the data, usually generating one tree or a small set of probable trees. The Obsidian Pool tree (Fig. 17.14) was computed by maximum likelihood.
Genomic Phylogeny
Today, entire genomes of microbes are sequenced readily—even hundreds of isolates from a given strain. So, in principle, phylogeny can be based on entire genomes. Genomic trees, however, include many genes present in one organism but not others, as well as genes transmitted horizontally. An intermediate approach is to use a set of multiple clock genes shared by all genomes compared, in the hope that their deviations will cancel out. For example, Figure 17.16shows the phylogeny of selected bacteria from the human intestine, within a larger clade of Gammaproteobacteria (presented in Chapter 18). This tree is based on a set of protein sequences of “housekeeping” genes; that is, genes encoding functions essential for all cells, such as RNA polymerase, and usually transmitted vertically (parent to offspring). Escherichia, Shigella, and Salmonella are closely related genera, including pathogenic strains as well as normal members of the gut microbiome. The genus Klebsiella includes species that grow outside the gut, causing pneumonia. Photorhabdus luminescens is a nematode bacterium that helps its host parasitize insects. Erwinia carotovora infects carrots and other plants; it is closely related to Yersinia pestis, the cause of bubonic plague. Photobacterium profundum is a marine barophile (an organism adapted for high pressure) growing in a deep-sea trench.
FIGURE 17.16 ■ Intestinal bacteria and related proteobacteria. The phylogenetic tree was derived from concatenated sequences of highly conserved “housekeeping” proteins. The scale bar corresponds to 5% amino acid sequence divergence.
Inset: Aphid embryo contains bacterial symbionts (DNA labeled by fluorescence in situ hybridization; FISH). Green = Buchnera; pink = Regiella; blue = aphid nuclei.
Sources: Phylogeny modified from Morgan Price et al. 2008. Genome Biol. 9 :R4; and
from Fabia Battistuzzi et al. 2004. BMC Evol. Biol. 4 :44.
RYUICHI KOGA, NATIONAL INSTITUTE OF ADVANCED INDUSTRIAL SCIENCE AND
TECHNOLOGY, JAPAN
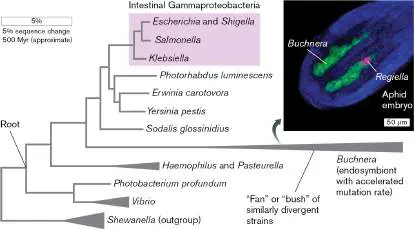
See above for Phylogenic Trees animation The tree in Figure 17.16is rooted by the branch to an outgroup, Shewanella, a genus of metal reducers used to construct fuel cells. Shewanella defines the root because its branch diverged earlier than that of the common ancestor of the tree’s other branches. Nevertheless, even Shewanella shares an ancestor with the other bacteria. The tree shows how bacteria of bewildering diversity, from human pathogens to deep-ocean dwellers, diverged relatively recently from a common ancestor.
One group, the genus Buchnera, appears to have diverged much faster than the others. Buchnera species are intracellular endosymbionts of aphids (Fig. 17.16, inset). The intracellular symbionts have undergone reductive evolution, losing many functions supplied by their host. Intracellular endosymbionts typically mutate much faster than free-living bacteria. In addition, they undergo intense selection pressure for adaptation to their obligate host. Note, however, that other parasites can evolve the opposite way: They gain genes encoding parasitic factors. Endosymbiosis is discussed further in Section 17.6.
Buchnera and several other lineages show a widening branch. The widening branch indicates a “fan” or “bush” of strains equally distant from a common node (branch point). The cause of “bushy” branches is debated; some researchers argue that all branches become bushy once enough strains have been sequenced.
How do we calibrate a phylogenetic tree; that is, relate the number of mutations to the time since divergence? We need an external measure of time. A tree can be calibrated if some kind of fossil evidence or geological record exists to confirm at least one branch point of the tree. But for microbes, such fossil calibrations remain speculative. One method of calibration is to correlate, on the basis of the fossil record, the divergence of microbial species growing only inside of particular host species with the divergences of their hosts. For example, the exceedingly rapid divergence of Buchnera species (Fig. 17.16) can be calibrated on the basis of their host insects. Such calculations, however, reveal vastly divergent rates of evolutionary change in different bacterial taxa.
Thought Question
17.7 What are the major sources of error and uncertainty in constructing phylogenetic trees?
Divergence of Three Domains of Life
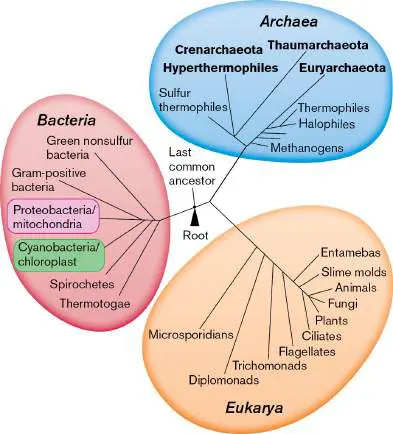
Carl Woese first used SSU rRNA phylogeny to reveal the existence of a third kind of life, Archaea, roughly as distant from bacteria as from eukaryotes ( Fig. 17.17). The three fundamental groups of life forms—Archaea, Bacteria, and Eukarya—are termed domains. Today, genomic phylogeny as well as structural and physiological comparison of the three domains ( Table 17.2) largely confirm the prediction of Woese’s SSU rRNA tree.
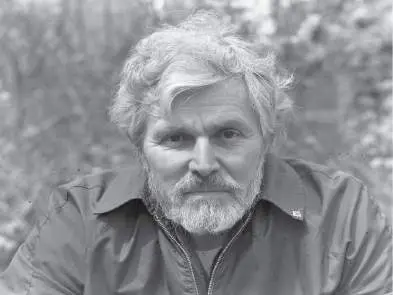
FIGURE 17.17 ■ Three domains of life. Carl Woese (1928–2012; inset) used SSU rRNA sequencing to reveal three equally distinct domains of life: Bacteria, Eukarya (eukaryotes), and Archaea.
CHARLES VOSSBRINCK
How was an entire domain of life missed in the past? Many archaea in soil and water, and even methanogens in the human gut, were long known to microbial ecologists—but, without tools for genetic analysis, they were simply classified among bacteria. Other archaea grow in habitats previously thought inhospitable for life; for example, Thermoplasma species grow at 60°C and pH 2 (Fig. 17.18). These thermoacidophiles surprisingly lack cell walls to protect their cells from osmotic stress, and their cells
interconnect by extensive membrane nanotubes. The fascinating diversity of Archaea is explored in Chapter 19.
FIGURE 17.18 ■ Thermoplasma. This archaeon lives at 60°C at pH 2—with no cell wall, only a cell membrane. Cells share cytoplasm by a network of membrane nanotubes.
M. YASUDA ET AL. 1995. APPL. ENVIRON. MICROBIOL. 61 :3482–3485
Rooting the tree of life. Note first that all living cells on Earth share profound similarities. All cells consist of membrane-enclosed compartments that shelter the same fundamental apparatus of cell production: the DNA-RNA-protein machine. The fundamental components of this machine appear to have evolved before the three domains diverged from their last universal common ancestor. From a molecular standpoint, all cells on Earth appear more similar than they are different.
So, how did early life diverge? Where is the root of the tree, the position of the last universal common ancestor of all life forms? Which of the three domains (Bacteria, Archaea, Eukarya) first diverged from the other two? The question has profound importance for biology because the research community bases its “model systems” for study on their commonalities with organisms of importance to humans. For example, investigators of intron splicing in archaea argue that archaea represent a
model system for related processes in complex eukaryotes such as humans.
Most phylogenetic measurements now indicate a root between Bacteria and the common ancestor of Archaea and Eukarya. That is, Bacteria diverged from Archaea and Eukarya before Archaea and Eukarya diverged from each other. Both phylogeny and cellular data now support the branching of Eukarya from within the Archaea (discussed in Chapter 19). Nonetheless, important differences emerge between domains in each pair; indeed, each domain shows distinctive traits absent or scarce in the other two. We summarize here the major features common to most members of each domain. Various classes and species within each domain are explored in Chapters 18–20.
Archaea, bacteria, and eukaryotes. Of the three domains, the eukaryotes stand out as having a nucleus and other complex membranous organelles (Table 17.2). Eukaryotic organelles include mitochondria and chloroplasts, which evolved from internalized bacteria. Bacteria and archaea possess no nucleus and have relatively simple intracellular membranes. Their size is limited by diffusion across the cell membrane, with occasional exceptions, such as the “giant bacterium” Epulopiscium fishelsoni. The larger size and complexity of eukaryotic cells mean that they generally require the most highly powered sources of energy, such as aerobic respiration and oxygenic photosynthesis, although some protists and fungi conduct fermentation. By contrast, the prokaryotes (bacteria and archaea) employ a wider range of metabolic alternatives, including lithotrophy and anaerobic respiration. Finally, eukaryotic plants and animals have attained a degree of multicellular complexity unknown in the prokaryotic domains.
TABLE Three Domains of Life 17.2
Characteristic Traits of living organisms All cells on Earth resemble each other in these traits: Chromosomal Double-stranded DNA material RNA Common ancestral RNA polymerase transcription Translation Nearly universal genetic code; shared ancestral rRNAs and elongation factors Protein Common ancestral functional domains Cell structure Aqueous cell compartment enclosed by a membrane COMPARISON OF DOMAINS Bacteria Archaea Eukarya Archaea resemble bacteria in these traits: Cell volume 1–100 μm 3 (usually) 1–10 6 μm 3 DNA Circular (usually) Linear chromosome DNA Nucleoid Nucleus with organization membran e Gene Multigene operons Single genes organization Metabolism Denitrification, N 2 fixation, lithotrophy, Respiration respiration, and fermentation and fermentati on Multicellularity Simple Simple or complex Archaea resemble eukaryotes in these traits: Intron splicing Introns are rare Introns are common RNA polymerase Bacterial homologs Eukaryotic homologs Transcription Bacterial homologs Eukaryotic homologs factors Ribosome Sensitive Resistant sensitivity to chloramphenic ol, kanamycin, and streptomycin Translation Formylmethionine Methionine (except initiator mitochondria and chloroplasts use formylmethionine)
Bacteria resemble eukaryotes and differ from archaea in these traits: Methanogenesis No Yes No Thermophilic Up to 95°C Up to 120°C Up to 80°C growth Photosynthesis Many species; Haloarchaea Many bacteriochloroph only; species; yll bacteriorhodop chlorophyl (proteorhodopsi sin (shares l n) homology with (bacterial proteorhodopsi origin)
n)
Light absorption Yes No Yes by (chloropla chlorophylls sts of bacterial origin)
Membrane lipids Ester-linked fatty Ether-linked Ester-linked (major) acids isoprenoids fatty acids Pathogens Many pathogens No pathogens Many infecting pathogens animals or plants On the other hand, eukaryotes share key traits with archaea that distinguish both from bacteria. The core information machinery of eukaryotes more closely resembles that of archaea. The two domains share closely related components of the central DNA-RNA-protein machine: RNA polymerase, ribosomes, and transcription factors. Even such hallmarks of eukaryotes as intragenic introns, the splicing machinery, and the “RNA interference” regulatory complexes are found in archaea. All this explains why rRNA trees place archaea closer to eukaryotes than to bacteria. Nevertheless, eukaryotes share fundamental structures with bacteria that differ from those in archaea. Archaea possess unique cell membrane components, such as their ether-linked lipids (see Chapter 19). Outside the archaea, ether-linked membrane lipids are found only in deep-branching bacterial species that share habitat (and exchange genes) with hyperthermophilic archaea. Only the domain Archaea includes species capable of growth in the most “extreme” environments of temperature (above 110°C or below −20°C) and pH (below pH 1). At the same time, many other archaeal species grow well at mesophilic temperatures in soil or water.
Perhaps the most striking distinction of archaea is the absence of archaeal pathogens of animals or plants. Even the many methanogens that live within animal digestive tracts have not been shown to cause disease.
Horizontal Gene Transfer
The three-domain phylogeny divides life usefully into three distinctive groups. Yet the tree also shows signs of gene flow unaccounted for by monophyletic descent. The eukaryotes contain mitochondria derived from assimilated bacteria whose genomes persist within the organelle. And pathogenic bacteria such as Agrobacterium species transfer DNA into the genomes of plants (discussed in Chapter 18). Moreover, sequenced genomes reveal evidence of gene transfer between bacteria and archaea sharing habitats at high temperature. What if the tree of life is not strictly monophyletic?
Horizontal gene transfer is the acquisition of a piece of DNA from another cell, as distinguished from vertical gene transfer, the transmission of an entire genome from parent to offspring. As discussed in Chapter 9, DNA is transferred horizontally by plasmids, transposable elements, and bacteriophages, as well as through the process of transformation. Closely related taxa show evidence of numerous past transfer events. For example, the Escherichia coli genome acquired about 18% of its genes from closely related species after its relatively recent divergence from the close relative Salmonella enterica. Some medically important genera, such as Neisseria (which causes gonorrhea and meningitis), are particularly “recombinogenic.” Rapid gene exchange enables pathogens to evade the host immune system by expressing novel proteins not recognized by host antibodies.
How can we tell when a genome contains a DNA sequence “transferred” from a different species? One sign of past horizontal transfer is a DNA sequence whose GC/AT ratio (proportion of GC and AT base pairs) differs from that of the rest of the genome. A surprising proportion of genomic DNA can show “spikes” of GC content that differ from the GC/AT ratio of neighboring sequences. These regions of anomalous GC/AT ratio, sometimes referred to as genomic islands (see Chapter 9), indicate an origin elsewhere.
Genes are transferred most frequently between closely related strains or taxa. Yet, remarkably, some genes can be transferred across distant phyla, even from species of a different domain. A striking example is the transfer of genes encoding light-driven proton pumps (bacteriorhodopsin) from halophilic archaea into many species of marine bacteria (where they are called proteorhodopsins). Such transfer events are relatively rare, occurring perhaps once in a million generations. But over time, the number of such “rare” events can accumulate. In some archaea, particularly the hyperthermophiles Pyrococcus and Aeropyrum, 10%–20% of the genes appear to come from bacteria that share their high-temperature environment. Similarly, the thermophilic bacterium Thermotoga maritima shows many genes transferred from archaea.
How does horizontal gene transfer affect microbial phylogeny? In 1999, Ford Doolittle, at Dalhousie University, redrew the standard tree of life with a bewildering array of cross-cutting lineages to show how actual phylogeny combines horizontal and vertical transfer (Fig. 17.19). Doolittle’s tree ( Fig. 17.19B ) acknowledges the ancestral transfer of entire bacterial genomes into eukaryotes, via the endosymbiotic ancestors of their mitochondria and chloroplasts (discussed further in Section 17.6). Then there are bacteria, such as the hyperthermophile Aquifex pyrophilus (Fig. 17.19B , inset), that share genes with archaea—and with distantly related bacterial phyla, such as Epsilonproteobacteria and Actinobacteria (discussed in Chapter 18). For Aquifex, the very definition of domain, let alone species, is problematic. Further back, perhaps the “last common ancestor” of all life forms was actually a last common community of diverse life forms that contributed different parts of our genetic legacy. FIGURE 17.19 ■ Vertical and horizontal gene transfer. A. The traditional view of phylogeny. Most gene transfer is vertical, and horizontal transfer is limited to rare cases such as transfer of
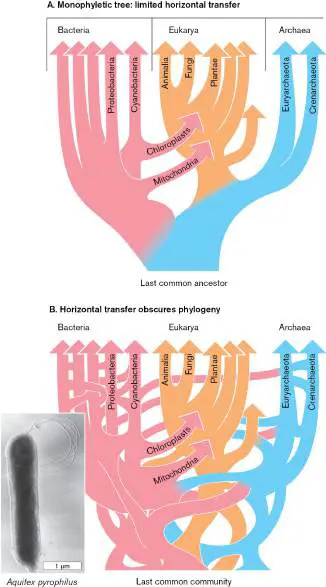
mitochondria and chloroplasts from bacteria into eukaryotes. B. The modern view. Horizontal gene transfer occurs so often that it obscures monophyletic distinctions between taxa.
Source: Modified from W. Ford Doolittle. 1999. Science 284 :2124.
R. HUBER ET AL. 1992. SYST. APPL. MICROBIOL. 15 :340–351, FIG. 2
Thought Question
17.8 What are the limits of evidence for horizontal gene transfer in ancestral genomes? What alternative interpretation might be offered?
Reconciling Vertical and Horizontal Gene Transfer
One approach to sorting out vertical and horizontal gene transfer was proposed by James Lake and colleagues at UCLA and developed further by Doolittle. Lake’s approach assumes that some classes of genes nearly always transmit vertically—particularly “informational genes,” which specify products essential for transcription and translation. Informational genes include those that encode RNA polymerase, ribosomal RNAs such as SSU rRNA, and elongation factors. Informational genes need to interact directly in complex ways with large numbers of cell components; thus, their capacity for horizontal transfer is limited.
On the other hand, “operational genes” are those whose products govern metabolism, stress response, and pathogenicity. Operational genes function with relative independence from other cell components and consequently move more easily among distantly related organisms, particularly organisms that share the same habitat. An important category of such movable genes is virulence factors. Pathogens show extensive horizontal transfer of virulence genes and genes encoding resistance to host defenses and antibiotics (see Chapter 25). Groups of such genes are often transferred together on plasmids or conjugative transposons (see Chapter 9).
A balanced view of vertical and horizontal gene transfer is shown in Figure 17.20. The row of arrows designates vertical transfer of the bulk of the genomes of two closely related species— E. coli and Salmonella enterica —as they diverge from a common ancestor. Black lines represent vertically transferred genes, such as ribosomal RNA; gray lines indicate genes with more flexible function that can be gained or lost from evolving genomes. At various levels, colored lines indicate horizontal transfer, where genes enter each lineage by processes such as conjugation or transformation. Gray lines peel out, indicating loss of a gene by mutation. Overall, the vertical lineage persists for most of the core informational genes (black lines), while horizontally acquired genes enter the genome. The persistence of genes showing vertical inheritance in nearly all life (such as SSU rRNA) may reflect the phylogeny of the organism as a whole, despite the other genes that are transferred horizontally. But to fully assess phylogeny, we must sequence entire genomes.
FIGURE 17.20 ■ Genes enter and leave genomes of two closely related species. Both rRNA trees and whole-genome trees consistently reflect monophyletic descent (black lineages) down to the genus level. For closely related species, monophyletic descent may be obscured by high rates of horizontal transfer (colored lines entering, gray lines departing). White lines indicate genes lost by reductive evolution.
To Summarize
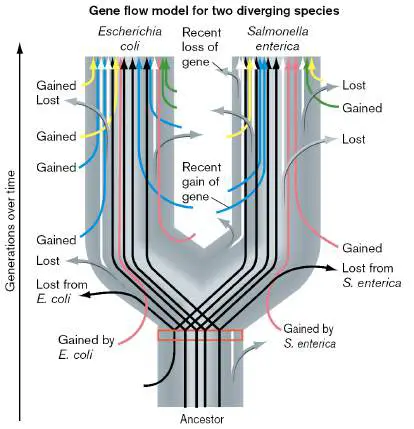
Phylogeny is the divergence of related organisms. Organisms diverge through random mutation, natural selection, and reductive evolution.
Phylogenetic trees are based on sequence analysis. The more different the two sequences are, the longer is the branch representing time since divergence from the common ancestor. Rooting a tree requires comparison with an outgroup.
Molecular clock genes assume a consistent mutation rate and generation time. The degree of difference between two DNA sequences correlates with the time since the two sequences diverged from a common ancestor.
Under selection pressure, different sequences diverge at different rates. The actual divergence rates of sequences depend on structure and function of the RNA or protein products. The early tree of life diverges to three domains: Bacteria, Archaea, and Eukarya. Eukaryotes are distinguished by the nucleus, which is lacking in archaea and bacteria. Archaea possess ether-linked isoprenoid lipids that are rare or absent in bacteria and eukaryotes, and they are never pathogens. The machinery of archaeal gene expression resembles that of eukaryotes.
Genes transfer occurs between different species. Horizontal transfer is most frequent between closely related species or between distantly related species that share a common habitat. Informational genes with many molecular interactions transfer vertically, whereas operational genes that function independently of other components are more likely to transfer horizontally. Horizontal gene transfer is important for adaptation to new environments and for pathogenesis. Gene transfer among pathogenic and nonpathogenic strains leads to emergence of new pathogens.
Glossary
phylogeny A measurement of genetic relatedness. The classification of organisms on the basis of their genetic relatedness.
phylogenetic tree A diagram depicting estimates of the relative amounts of evolutionary divergence among different species.
clade Also called monophyletic group. A group of organisms that includes an ancestral species and all of its descendants.
monophyletic group See clade .
species A single, specific type of organism, designated by a genus and species name.
branch A lineage of organisms that share a common ancestor.
node In a phylogenetic tree, the most recent common ancestor of branching descendants.
root In a phylogenetic tree, the earliest common ancestor of all members shown.
lineage In a phylogenetic tree, a line of individuals, past and present, that descends from one common ancestor. Also called a branch .
outgroup In a phylogenetic tree, a taxon that diverged from a lineage before the ancestor shared by all other taxa in the tree.
molecular clock The use of DNA or RNA sequence information to measure the time of divergence among different species.
small-subunit ribosomal RNA (SSU rRNA)
In bacteria and archaea, 16S rRNA; in eukaryotes, 18S rRNA. A ribosomal RNA found in the small subunit of the ribosome. Its gene is often sequenced for phylogenetic comparisons.
domain 1. In taxonomy, one of three major subdivisions of life: Archaea, Bacteria, and Eukarya. 2. In protein structure, a portion of a protein that possesses a defined function, such as binding DNA. 3. In membranes, a region of membrane consisting of certain types of phospholipids that are distinct from surrounding lipids.
horizontal gene transfer Also called lateral gene transfer. The natural movement of genes from one genome into another, nonprogeny genome.
vertical gene transfer The generational movement of genes from parent to offspring through reproduction.
Figure 8.12 FIGURE 8.12 ■ The standard genetic code. Codons within a single box encode the same amino acid. Blue-and green-highlighted amino acids are encoded by codons in two boxes. Stop codons are highlighted red. Often, single-letter abbreviations for amino acids are used to convey protein sequences (see legend).
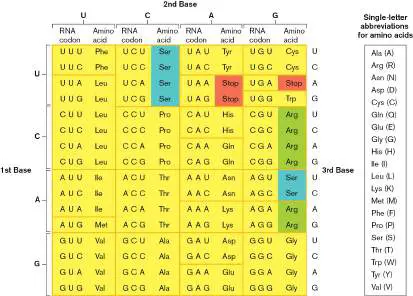
17.4 Natural Selection and Adaptationnot assigned
For phylogeny, we focused on the accumulation of random mutations that cause genome sequences to diverge at a steady rate. The rate of nonselected sequence changes enables us to measure evolutionary time. But how does evolution help life survive in a new environment? The genetic variants that arise by random mutation differ in their chance of survival. Those variants that survive to leave more offspring undergo natural selection; that is, their traits are overrepresented in the next generation.
Note: Mutations occur randomly, without regard to selective
pressure. Random mutations occur first, generating diversity in a population. Next, selection pressure acts on the population, altering the relative proportion of genetic variants.
How can we study the mechanisms of natural selection and adaptation? We have several kinds of evidence: Strongly selective environments. Environments under intensive selective pressure, such as exposure to antibiotics ( Special Topic 17), lead to rapid evolution that can easily be observed.
Genome analysis. Comparing gene sequences, both within and between genomes, enables us to track how organisms adapted in the past.
Experimental evolution. Experimental strategies reveal evolution in the laboratory, enabling us to test predictive models.
Strongly Selective Environments: Antibiotic Selection
Evolution requires many generations, but certain microbes may produce 40 generations in a day. When such microbes grow under strong selection pressure, evolution may occur surprisingly fast. One of the strongest selective conditions we can study is the presence of an antibiotic (as seen in Michael Baym’s “giant Petri dish” experiment of Special Topic 17). Antibiotics reveal evolution at work in real time, within hospital environments, and even within the body of one hospital patient.
SPECIAL TOPIC 17 A Giant Petri Dish and the Race to Drug Resistance
Bacterial resistance to antibiotics is a huge threat to our health, affecting all kinds of medical care. Hospitals are breeding grounds for newly resistant strains. But how does it happen? How can bacteria that fail to grow in the presence of an antibiotic evolve to produce descendants that grow with a thousand times as much antibiotic present?
This question was tested by culturing Escherichia coli in a giant Petri dish (Fig. ST 17.1 ). The Petri dish contained a concentration series of the antibiotic trimethoprim, which inhibits dihydrofolate reductase, an enzyme needed for incorporation of folic acid into biosynthesis. Michael Baym (Fig. ST 17.2 ), along with colleagues in Roy Kishony’s lab at Harvard School of Medicine, built the Petri dish 2 feet wide and 4 feet long. The dish was filled with a layer of agar media containing increasing amounts of trimethoprim when proceeding from either end of the Petri dish toward the middle. The concentration of trimethoprim grew in four discrete steps. The first step (defined as one unit) contained three times the level of trimethoprim shown to kill the starting culture of E. coli. Each succeeding level contained a tenfold higher concentration than the preceding level. Atop the antibiotic agar, a thin layer of medium containing a lower agar concentration was provided through which the bacteria could swim—if they could survive the antibiotic diffusing from below.
FIGURE ST 17.1 ■ Bacteria evolve antibiotic-resistant strains in a giant Petri dish. A. Giant dish contains strips of agar with increasing concentrations of the antibiotic trimethoprim. B. Escherichia coli bacteria after 10 days of growth. Bacteria were inoculated along each side
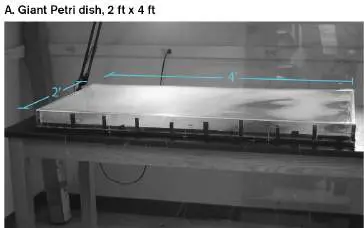
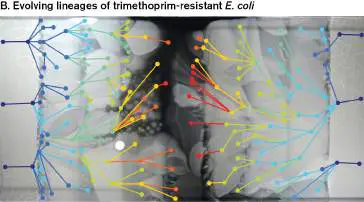
(right and left) and were then allowed to swim across and grow in toward the center. Trimethoprim concentration starts at each side of the dish at one selective unit, which is three times the minimum inhibitory concentration of the original inoculant. Each succeeding step of agar from either side toward the center has tenfold greater concentration. Colors indicate evolving clones that gain a mutation enabling growth into the higher antibiotic concentration.
COURTESY OF HARVARD MEDICAL SCHOOL AND TECHNION–ISRAEL INSTITUTE
OF TECHNOLOGY
COURTESY OF HARVARD MEDICAL SCHOOL AND TECHNION–ISRAEL INSTITUTE
OF TECHNOLOGY

FIGURE ST 17.2 ■ Michael Baym studies the evolution of drug-resistant bacteria.
COURTESY OF HARVARD MEDICAL SCHOOL AND TECHNION–ISRAEL INSTITUTE
OF TECHNOLOGY
As the bacteria grew to fill one section of agar, their growth would slow to a near halt, until a single mutant clone was able to break through and grow into the next level. Other strains appeared with a different mutation that increased antibiotic resistance, and in some cases the different mutant strains competed with each other in the next level of antibiotic. Ultimately, bacteria from both sides of the plate gave rise to descendants that achieved 1,000-fold higher trimethoprim resistance than their ancestral strain.
What kinds of mutations were selected for resistance? The most frequent mutations were found in a gene encoding the enzyme dihydrofolate reductase—the target of the antibiotic trimethoprim. Secondary mutations were selected in general stress genes that confer resistance to multiple antibiotics. In some cases, a mutation led to drug resistance at the expense of growth rate; then a secondary mutation compensated, restoring growth rate. Yet another kind of mutation, called a “mutator,” simply increased the rate of many different mutations.
Although the setup of Baym’s experiment differs from natural and clinical environments, the general classes of mutation and the overall trajectory of evolution observed in the experiment include mechanisms seen in nature, such as the appearance of secondary mutations that compensate for drawbacks of the early mutations. The more we learn, the more we realize the daunting challenge of antibiotic resistance for antimicrobial therapy.
RESEARCH QUESTION
What do you think would happen if the agar medium contained two kinds of antibiotics? How might the experimental setup require adjustment? What kind of bacterial genotypes and phenotypes do you predict?
Baym, Michael, Tami D. Lieberman, Eric D. Kelsic, Remy Chait,
Rotem Gross, et al. 2016. Spatiotemporal microbial evolution on antibiotic
landscapes. Science 353 :1147–1151.
Figure 17.21depicts an actual clinical case of a hospitalized patient infected by MRSA, a deadly strain of Staphylococcus aureus that had already evolved resistance to drugs such as methicillin. The patient was an elderly man with a weakened immune system, unable to eliminate even small populations of an opportunistic pathogen such as MRSA. The original culture from the patient’s blood showed bacteria sensitive to four antibiotics (different from methicillin). But prolonged exposure resulted in natural selection for resistance. Ultimately, after a total of 12 weeks’ exposure to linezolid and other antibiotics, the bacteria isolated showed resistance to three other antibiotics plus partial resistance to linezolid.
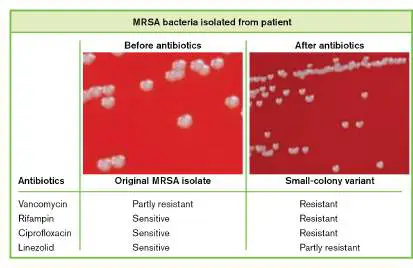
FIGURE 17.21 ■ Evolution of antibiotic resistance in methicillin-resistant Staphylococcus aureus (MRSA). Left: The initial MRSA isolate infecting the patient showed partial resistance to vancomycin but was sensitive to rifampin, ciprofloxacin, and linezolid. Right: After exposure to these antibiotics, a new strain was isolated that grew more slowly (the small-colony variant) but was at least partly resistant to all the antibiotics.
Sources: Wei Gao et al. 2010. PLoS Pathog. 6 :e1000944; images from Y. Lin. 2016. J. Antimicrob. Chemother. 71 :1807.
In Figure 17.21, note that the latest drug-resistant strain actually made smaller colonies with or without the drug—the “small-colony variant.” In other words, natural selection yielded a population that was the “fittest” under a particular environmental condition—the presence of linezolid in an immunocompromised host—where even a slow-growing strain could persist. In the absence of the drug, the original strain would outcompete the small-colony variant.
In the case just described, what was the molecular basis of the multidrug resistance? Researchers obtained DNA from the patient’s original MRSA and from the later small-colony variant. They sequenced the two genomes and compared them. Just three point mutations in the small-colony variant accounted for the drug resistance and for the retarded growth. One of these mutations derepressed a stress regulon (group of genes under one regulator), causing accumulation of the stress signal ppGpp (guanosine tetraphosphate). The ppGpp stress regulon includes expression of many protective genes that enable a cell to survive in the presence of antibiotics. But the cost to the cell of expressing this regulon is a slower growth rate; like a community under “terror alert,” the cell’s normal everyday processes are slowed by the demands of the stress response. This cost, or downside, of a trait under natural selection is called a fitness trade-off or fitness cost.
The MRSA example illustrates two key points: The “fittest” trait depends on the environment in which selection occurs. The presence of an antibiotic selects individuals that are resistant, despite the fitness trade-off of slower growth (small-colony size). Without the antibiotic, the faster-growing individuals prevail.
Altering regulation is an effective mechanism of adaptive evolution. In this case, the ppGpp stress regulon was derepressed, enabling stress responses that normally would be turned off because they inhibit cell growth.
Antibiotic resistance: selective concentrations. Quantitative questions about antibiotic resistance can be addressed in the laboratory. For example, what concentrations of an antibiotic are needed for natural selection? This question is important because every time a drug is prescribed, we provide potential conditions for selection of resistance. And low levels of medications continually enter sewage and reach our aquatic environments. Do these low levels constitute selective pressure? Until recently, it was thought that only drug levels sufficient to prevent microbial growth (the minimum inhibitory concentration; MIC) would have selective pressure. Most mutations conferring drug resistance have deleterious effects in the absence of the drug.
But small degrees of selective pressure can add up over time. Erik Wistrand-Yuen (Gullberg) and Dan Andersson at Uppsala University, Sweden, devised a method to measure very small population shifts arising from selective pressure. Their method uses flow cytometry to count individual bacteria that express one of two protein fluorophores: yellow fluorescent protein (YFP) or cyan fluorescent protein (CFP). Protein fluorophores made by gene fusions are discussed in Chapter 2. Two different strains of bacteria (one sensitive to an antibiotic, the other resistant) each express a gene-fusion YFP or CFP, respectively. A coculture of the two strains is sampled by flow cytometry. The two strains are detected by distinct fluorescence excitation patterns and counted by a laser (Fig. 17.22 ). Over generations, their ratios shift, revealing small differences in growth rate. Even the smallest differences may lead to natural selection.

FIGURE 17.22 ■ Fitness competition measured by flow cytometry. A. Erik Wistrand-Yuen, now at Astrego Diagnostics. B. Flow cytometry counts two members of a mixed population, labeled by gene fusions to YFP and CFP fluorophores. Source: Part B modified from Samantha Schaffner et al. 2021. Appl. Environ. Microbiol. 87 :e00724.
ERIK WISTRAND-YUEN
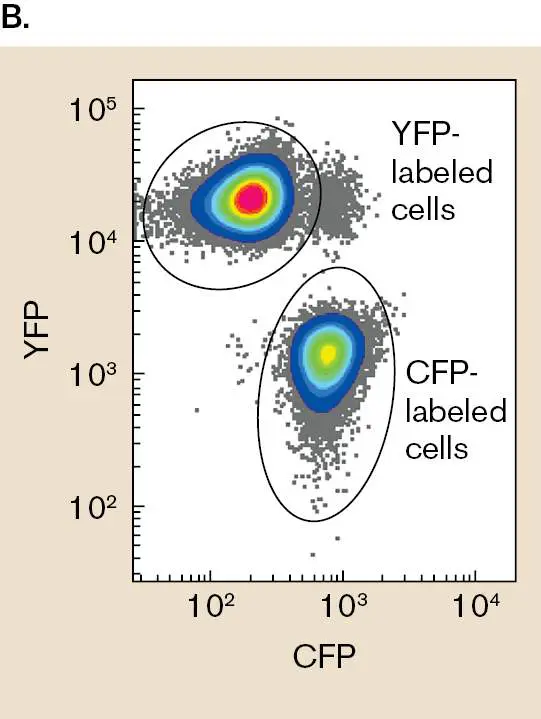
Wistrand-Yuen used flow cytometry to measure the ratios of resistant over sensitive cells during growth in the presence of various concentrations of an antibiotic, such as tetracycline (Fig. 17.23A). The slope of increase of resistant cells in the mixture was measured over generations, yielding a “selection coefficient,” or measure of the degree of selection pressure. The selection coefficients were plotted as a function of tetracycline concentration (Fig. 17.23B ).
Surprisingly, selection pressure was detectable at a tetracycline concentration 100-fold lower than the concentration that prevents growth (MIC). Thus, a new term was defined: the minimum selective concentration (MSC). The minimum selective concentration is defined as the threshold concentration at which resistance provides a positive selective value. These small selective concentrations are comparable to the levels of antibiotics entering our waterways and our drinking supplies.
FIGURE 17.23 ■ Minimum selective concentration of an antibiotic. A. Relative fitness of Escherichia coli cells resistant or sensitive to an antibiotic (tetracycline). Strains were marked with genes encoding YFP or CFP and differentially counted by flow cytometry. B. Rate of resistance selection (population sweep) plotted as a function of tetracycline (Tet) concentration. Positive selection for resistance is seen at 15 ng/ml, which is one-hundredth the concentration needed to prevent observable growth.
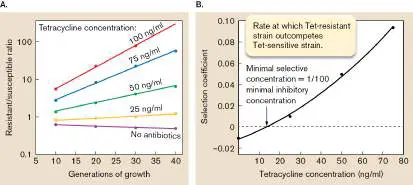
Source: Modified from E. Gullberg et al. 2011. PLoS Pathog. 7 :e1002158.
Thought Question
17.9 In the fitness competition between cells labeled by YFP and CFP, how can we rule out fitness differences associated with the bacterial expression of the two different fluorescent proteins?
Genome Analysis
As discussed in Section 17.3, the sequence of genomes reveals descent over time on the basis of steady accumulation of mutations. But other mutations undergo selection that provides a cell with new functions.
One source of material to evolve a new function is gene duplication (discussed in Chapter 9). As cells replicate their DNA over many generations, occasionally the DNA polymerase will make a duplicate copy of a gene. With duplicate copies of a gene, one copy may acquire mutations that change its function without detriment to the organism because the “backup” copy still functions. Now, suppose the mutated copy gains additional mutations that further alter its function, providing a new function to the cell. For example, a gene encoding a transporter for one sugar may now encode a transporter that better “fits” a different sugar. The two paralogous genes, or paralogs, have evolved to serve different functions.
Paralogs are a major source of raw material that contributes to new functions arising through evolution. We can detect paralogs in a genome through sequence relatedness; for example, the genome of the hyperthermophilic bacterium Thermotoga maritima shows paralogous ATP-binding cassette (ABC) transporters for lactose, cellobiose, mannose, and xylose, among others. Evolution of paralogs provides an important way for organisms to enhance fitness in a complex environment.
Does a population ever lose some of its paralogs? Certain environments select for loss of many genes—a phenomenon called reductive evolution, or degenerative evolution. In cases of relatively small population size, such as intracellular symbionts, genes are lost via genetic drift. There can also be positive selection for gene loss, such that organisms save energy by avoiding replication and expression of unneeded genes. Intracellular pathogens and obligate symbionts often lose large chunks of their genome by processes such as intracellular recombination of the chromosome. The lost genes typically encoded functions supplied by the host, such as capture of nutrients and generation of energy. Lost genes can be identified by comparison with free-living species. For example, Treponema pallidum, the cause of syphilis, has a genome of 1.1 million base pairs, which is about a quarter the size of the Escherichia coli genome. T. pallidum has lost all of its enzymes used in the tricarboxylic acid (TCA) cycle, respiration, and amino acid biosynthesis. These genes remain in the genomes of free-living treponemes.
In other species, dilute, nutrient-poor natural environments select for gene reduction. Marine cyanobacteria, a major source of global photosynthesis, have lost numerous genes that confer little advantage in the open ocean. Missing genes encode transporters for sugars and amino acids (which are scarce in the ocean), as well as proteins for flagellar motility and pili. More surprising, Prochlorococcus species have lost catalase, an enzyme that destroys the hydrogen peroxide they produce. Their hydrogen peroxide is detoxified by catalase-positive bacteria that share their marine habitat. Erik Zinser at the University of Tennessee, Knoxville, showed that Prochlorococcus could be cultured on agar only in the presence of partner bacteria that supply catalase. Given that catalase is an expensive enzyme to produce, Prochlorococcus may have gained an advantage when this enzyme was deleted during its evolution in the nutrient-poor open ocean.
Experimental Evolution in the Laboratory
Natural selection for single genes is part of a much larger process of evolution that comprises entire genomes of individuals across populations over time. The study of overall evolution in the laboratory is called experimental evolution, or laboratory evolution. A landmark experiment on evolution in the laboratory was undertaken by Richard Lenski, Zachary Blount, and colleagues at Michigan State University (Fig. 17.24). Their aim was simple but vast in scope: Subject the bacterium Escherichia coli K-12 to selection pressure by carbon starvation for many generations and record its entire history of adaptive evolution.
FIGURE 17.24 ■ Rich Lenski and Zack Blount conduct the Long-Term Evolution Experiment (LTEE). At Michigan State University, Lenski (inset) opens a box of evolved clones stored in the −80°C freezer. Blount meditates before a tower of Petri plates that represent 1 year of competition assays for the relative fitness of evolved clones.
MICHIGAN STATE UNIVERSITY COMMUNICATIONS AND BRAND STRATEGY
COURTESY OF BRIAN BAER
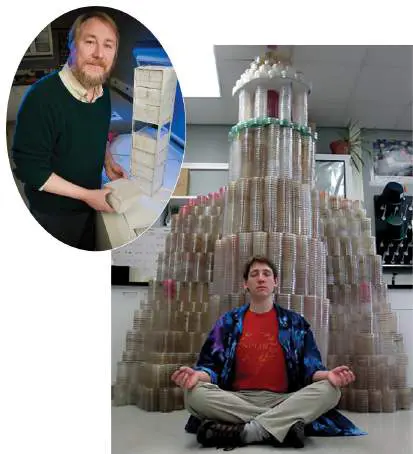
In 1988, Lenski’s research team began the Long-Term Evolution Experiment (LTEE) by founding 12 populations of E. coli from a single clone. The 12 populations were cultured in a medium in which growth is limited by a small amount of glucose (Fig. 17.25). This medium allows exponential growth for a couple of hours, followed by more than 20 hours of starvation. Every 24 hours, 1% of each population is transferred to fresh medium and then grows at the rate of about 6.6 generations per day. Every 500 generations, samples of each population are frozen for later study. As of 2021, the populations have evolved for more than 74,000 generations, and Lenski’s students continue the daily dilutions.
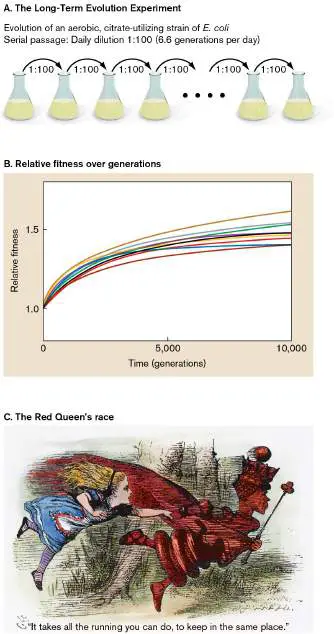
FIGURE 17.25 ■ Relative fitness increases over generations in a stable environment. A. Bacteria were diluted daily in a glucose-limited medium. The medium also contained citrate to enable the bacteria to take up iron. B. Relative fitness indicates the ratio of offspring produced by an evolved strain to offspring produced by its ancestral strain in direct competition. Colored lines represent independent flasks undergoing evolution under the same conditions. In a constant experimental environment, fitness increases over generations. The rate of increase declines but never reaches zero. C. The Red Queen’s race, from Lewis Carroll’s Through the Looking-Glass. Even under constant abiotic conditions, individuals keep changing (by mutation) and thus change the environment experienced by their competitors. Thus, all population members must change in order to maintain relative fitness.
Source: Part B modified from R. E. Lenski and M. Travisano. 1994. Dynamics of adaptation and diversification. Chapter 13 in Tempo and Mode in Evolution,
National Academies Press.
SARIN IMAGES/GRANGER
The bacteria in Lenski’s frozen populations remain alive and can be revived at any time to sequence genomes and start new experiments. Clones are isolated from these frozen time points, and entire genomes are sequenced by short-read Illumina technology (see Chapter 7). From these genomes of stress-adapted clones, we can detect every mutation. Thus, with laboratory experiments, we can test predictions of how new traits appear and discover mutations that led to the new traits. Evolution experiments can include replicate populations, making it possible to examine the repeatability of evolution.
Adaptation to the experimental environment. During the LTEE, the E. coli populations have changed and adapted to the fixed conditions of the experimental environment, such as glucose as the sole available carbon source. Within populations, some bacteria have been able to grow faster than their ancestral strain. The researchers measure the relative fitness, a strain’s ability to yield more progeny than a competitor. Relative fitness is measured by direct competition assays, in which two strains are cultured together, then quantified by viable count assay on agar plates. The relative fitness of each evolved isolate under a given condition is determined by competition with the ancestral strain revived from a frozen stock. Figure 17.25B shows the result of competition assays for nine different strains evolved for increasing numbers of generations (doublings) cultured together with the ancestral strain.
Several features of Lenski’s relative fitness curve proved surprisingly consistent over many evolution experiments conducted under various defined conditions: Relative fitness increases at approximately equal rates for all replicate populations, even though different independent mutations are occurring.
The rate of fitness increase declines over succeeding generations. But the fitness increase never goes to zero, even over 30 years and tens of thousands of generations.
Genome sequences of persisting lineages show independent collections of distinct, independent mutations.
The continuing fitness increase of competing microbes, albeit at a decreasing rate, confirms a view of evolution formulated in the twentieth century as the “Red Queen’s race” (Fig. 17.25C ). The name of this hypothesis refers to the scene in Lewis Carroll’s Through the Looking-Glass in which the Red Queen (an animated chess piece) tells Alice, “It takes all the running you can do, to keep in the same place.” In other words, to sustain a given level of reproductive success, individuals must keep undergoing selection against their ever-evolving competitors. Even if the abiotic environmental conditions remain consistent, the individuals propagating within a population alter the environment inhabited by each other; for example, by producing or consuming molecules that are nutrients or toxins.
A new phenotype appears. Besides the general curve of fitness increase, we know that natural populations undergo radical shifts in phenotype, such as the appearance of the small-colony variant of MRSA (Fig. 17.21). Such shifts have rarely been seen in evolution experiments—but one occurred in Lenski’s LTEE. After generation 33,000, one of the 12 populations suddenly became much denser ( Fig. 17.26A). In this one population, some of the bacteria had evolved a new phenotype: They were able to grow aerobically on citrate—a substance originally included in the medium as a buffer, not intended as a nutrient. Citrate catabolism is a trait found in other species but is rare in E. coli. The citrate-catabolizing E. coli are called citrate plus, or Cit +.
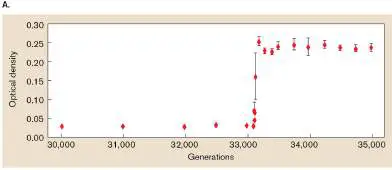
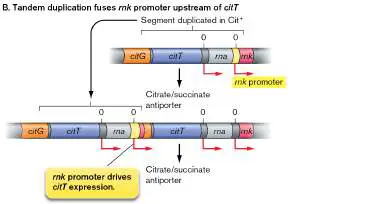
coli. A. The bacteria were diluted daily in a glucose-limited growth medium. The medium also contained citrate as a buffer. After 33,000 generations (estimated cell doublings), the bacterial population suddenly grew to a much greater density because of the rise to high frequency of a strain that had evolved the ability to catabolize the citrate. B. The Cit + mutation. After 31,000 generations, a tandem duplication event placed a copy of the rnk promoter upstream of the citT gene encoding a citrate/succinate antiporter that is normally repressed by oxygen. This new rnk - citT module now expresses CitT, which takes up citrate, enabling bacteria to respire on citrate from the medium. Source: Zachary Blount et al. 2012. Nature 489 :513.
The genetic basis for the sudden ability to grow on citrate was found to be a tandem duplication of a gene encoding a citrate/succinate antiporter, citT (Fig. 17.26B ). (Antiporters and other nutrient transporters are discussed in Chapter 4.) The duplicated citT (upstream of the first copy) happens to include a promoter for an adjacent gene, rnk, which encodes a regulator of nucleic acid metabolism, expressed in the presence of oxygen. Thus, the duplication places citT expression under control of the copied rnk promoter. The rnk promoter now expresses citT in the presence of oxygen, enabling the cell to respire on citrate. The bacterium that showed this original Cit + mutation then produced more offspring than others. Over a few generations, the Cit + cells increased their proportion of the population until they became the predominant strain.
Given that citrate has been available in the LTEE medium from the beginning, why did the Cit + mutation take so long to evolve? And why was the Cit + trait so rare, arising in only one of the 12 original populations? Could any E. coli cell mutate to catabolize citrate—or were other hidden mutations required? Lenski proposed that the earlier generations had acquired some kind of mutations that enabled E. coli later to use the citrate obtained by the antiporter and thereby exhibit the Cit + trait. He called this the “historical contingency” hypothesis—that evolution of a new trait may require some other unknown trait to appear first.
To test the hypothesis, Blount delved into the “fossil record” (frozen samples) of the evolving populations and isolated clones from various time points. He and Lenski then tested the ability of these clones, as well as of the ancestral strain, to mutate to Cit +. They found that only clones isolated from time points after 20,000 generations reevolved the new Cit + phenotype; the original strain did not. This result supported the hypothesis that some other mutation was needed first.
To gain additional information about the early and late mutations, Blount sequenced the genomes of 29 clones isolated from the population’s frozen fossil record at numerous time points through 40,000 generations (Fig. 17.27). The strains were measured for citrate utilization and for ability to evolve Cit +. The data fit the following model of stages of evolving a new trait: (1) early mutations; (2) mutation leads to novel trait; (3) trait refinement. FIGURE 17.27 ■ Evolution of aerobic citrate catabolism in Escherichia coli. An earlier mutation (gltA) that occurred before 30,000 generations enabled selection for the eventual Cit + trait. The Cit + trait first appeared in about generation 31,000. Subsequent mutations refined the phenotype by increasing the rate of citrate utilization. Ball symbols indicate genomes from the population’s history that were sequenced for analysis. Colors indicate evolving clades that share an ancestor.
Source: Zachary Blount et al. 2012. Nature 489 :513.
Early mutations. During the first 31,000 generations, early random mutations occurred in some cells that did not confer citrate catabolism but somehow enabled cells to use the citrate transport
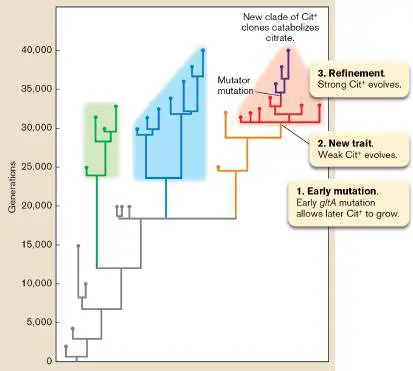
mutation later. These mutations led to the appearance of Cit + cells (red lineages in Fig. 17.27). They also allowed the appearance of similar traits in “replayed” evolution from late-generation strains. One such early mutation was shown to affect the gene gltA, encoding an enzyme that increases growth on acetate, which is excreted during growth on glucose using the TCA cycle (discussed in Chapter 13). New trait appears. The history of the initial Cit + clone thus required two rare events: the potentiating mutation gltA; and the tandem duplication of citT-rnk, which placed citT expression under control of a promoter active in the presence of oxygen.
Refinement of the phenotype. The earliest Cit + clones were very poor at growing on the citrate, although they slowly outcompeted other clones after glucose was used up. But later clones had increased the rate of citrate use as a result of secondary mutations; that is, by evolutionary refinement of the Cit + trait. The researchers showed that this improvement was due to an increase in the copy number of the duplicated segment that produces the rnk - citT module, which increased the number of expressed copies of citT. This improved growth on citrate eventually led the Cit + clones to dominate the population. Notably, though, even the “refined” Cit + cells never fully took over the cultures. Some cells always remained that had adapted to limiting glucose by other means.
Another source of phenotype refinement was the appearance of mutators. A mutator is a random mutation that occurs in a gene encoding a DNA repair enzyme. The loss of DNA repair increases the overall frequency of mutations in a genome, thereby increasing the rate of refinement of a new trait (purple branches in Fig. 17.27). Eventually, however, the overall increase of random mutations decreases fitness, and there is selection for restored DNA repair.
Thought Question
17.10 In an evolution experiment, some clones require nutrient molecules produced by other clones. How might the mechanisms of evolution favor the emergence of dependent clones?
The results of Lenski’s Long-Term Evolution Experiment raise this question: If E. coli is evolving new traits, is it in the process of evolving a new species? (We address the species concept in Section 17.5.) Meanwhile, industrial laboratories now use advanced forms of experimental evolution. For example, the Merck pharmaceutical company’s synthesis of the COVID-19 drug molnupiravir requires industrial enzymes whose rate of catalysis is amplified by “directed evolution” (see eResearch Activity 16). In directed evolution, we generate a clone library of mutant forms of a gene encoding the enzyme. (DNA libraries are discussed in Chapter 7.) The clones are then screened for activity on a substrate needed for the drug synthesis.
Evolution and Growth Cycles
Discussions of evolution tend to leave the impression that natural selection is all about producing large numbers of progeny. But actual growth cycles (discussed in Chapter 4) offer more than one way to outreproduce one’s competitor.
Mechanisms of natural selection depend on the cell cycle. In natural environments, microbes experience all phases of batch culture (Fig. 17.28). When nongrowing cells experience a sudden influx of nutrients, they need a period of lag phase to gear up their metabolism for exponential growth. Forms of suspended animation such as endospores require an elaborate program of reversal by germination. Thus, within a population, those individuals requiring shorter times for lag phase or germination will get a head start and produce offspring before their neighbors do. So, a shorter lag phase is one mechanism that mediates natural selection.
Once exponential growth occurs, a lineage of microbes may outcompete others by having a faster doubling rate (k doublings per unit time, discussed in Chapter 4). But a comparable competition may be achieved by outsurviving one’s competitors during death phase; that is, by dying more slowly than one’s competitors (Fig. 17.28). A genetic variant that confers a fitness advantage in exponential phase may actually incur disadvantage during death phase. For example, E. coli bacteria cultured in acid (pH 4.8) show selection against genes encoding amino acid decarboxylases that degrade valuable nutrients. Yet the same bacteria exposed to more extreme acid (pH 2), where the cells start to die, show strong selection for the amino acid decarboxylases, which consume protons and protect the cytoplasm from acidification.
FIGURE 17.28 ■ Fitness competition during serial batch culture. A subpopulation may achieve higher fitness (more offspring compared to a competitor) by different mechanisms in different phases of the growth cycle (red lines). After dilution into fresh medium, an individual with a shortened lag phase may outcompete others in the population. During log phase, relative
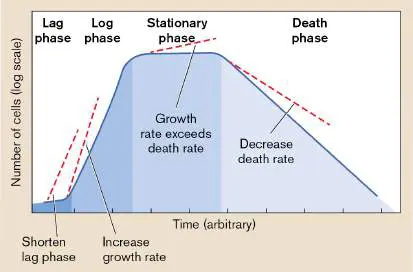
fitness increases by increasing growth rate. In stationary phase, higher fitness requires growth rate to exceed death rate. During death phase, higher fitness requires a lower relative death rate. Stationary phase leads to a complex mix of selective effects, in which some subpopulations die off, whereas others show a net growth rate. In stationary phase, and under other kinds of stress, such as low oxygen or antibiotic exposure, highly expressed genes may show an increased rate of mutation. The higher mutation rate offers a temporary opportunity for genetic adaptation to conditions outside the optimal “window” of environment for the organism. Because the mutation increase is temporary, it incurs fewer long-term side effects than does the appearance of mutator gene variants that increase the mutation rate permanently.
Susan Rosenberg at Baylor College of Medicine (Fig. 17.29) has conducted a series of experiments that reveal mechanisms by which starvation stress leads to mutation. Some of these mechanisms were first detected as the basis of sectored colonies because color phenotypes arise from late mutations that turn on lac fermentation within the colony (Fig. 17.29B ).
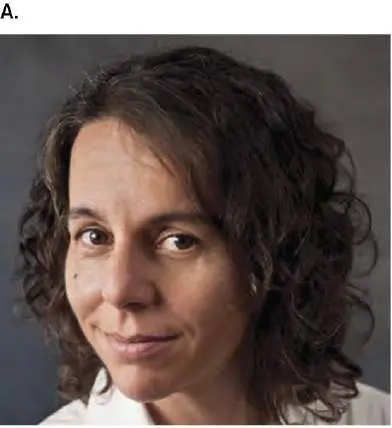
FIGURE 17.29 ■ Stress conditions lead to increased rates of random mutation. A. Susan Rosenberg showed how bacteria under starvation stress increase their rate of random mutation and evolve novel variants faster. B. Sectored colonies form as a result of random mutations leading to Lac + phenotype (green indicator).
COURTESY OF SUSAN ROSENBERG
P. J. HASTINGS ET AL. 2004. PLOS BIOL. 2 :E399, FIG. 1B
The basis of stress-associated means of mutation increase is of great interest for medical fields such as cancer, where similar mechanisms may underlie the development of tumors. In bacteria, mechanisms of stress-induced mutation include: Double-strand-break repair. The rate of errors increases during double-strand-break repair, which is mediated by homologous recombination (see Chapter 9). Error-prone repair leads to “hot spots” of mutations affecting those genes involved in stress response.
Up-regulation of the stress sigma factor. Sigma S is induced by stresses such as starvation, acid, or oxygen radicals (see
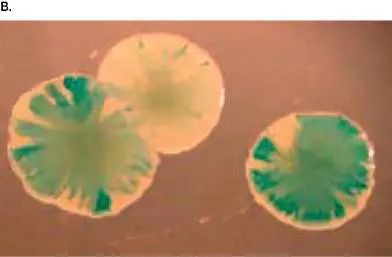
Chapter 10). Sigma S activates error-prone DNA polymerases, leading to base substitutions as well as insertions and deletions. Decrease in mismatch repair. Stress down-regulates mismatch repair by MutS, MutL, and MutH (see Chapter 9).
One result of such stress-induced processes is that error rates— that is, mutations—actually increase at genes highly transcribed during stress response. Thus, mutations are not completely random; the genes most needed in a changed environment may be those more likely to mutate. The result is to increase variation in those gene sequences whose phenotype may most need to change. A case of possible stress-induced mutation is shown in eResearch Activity 17, which explores experimental evolution in the presence of a food preservative, benzoate.
Surprisingly, the fundamental mechanism of RNA transcription contains built-in opportunities to cause mutation (Fig. 17.30). In bacteria, the growing mRNA has ribosomes conducting translation as the message grows (see Chapter 8). The ribosomes protect growing RNA chains from hybridizing with their template DNA after transcription. Under various kinds of stress, such as starvation or host defense reactions, protein synthesis declines. Ribosomes and other protective proteins may be scarce. An unprotected mRNA strand may stay hybridized to its DNA template, forming an “R loop” where the nontemplate DNA loops out. The RNA may then get incorporated by mistake into DNA synthesis. This aberrant DNA synthesis leads to double-strand breaks and mutations.
FIGURE 17.30 ■ Stress-induced genes form R loops and increase mutation. In bacteria, ribosomes protect growing RNA chains from hybridizing with DNA. Under stress, ribosomes and other protective proteins are missing. An mRNA strand may stay hybridized to its DNA template. The RNA gets incorporated into
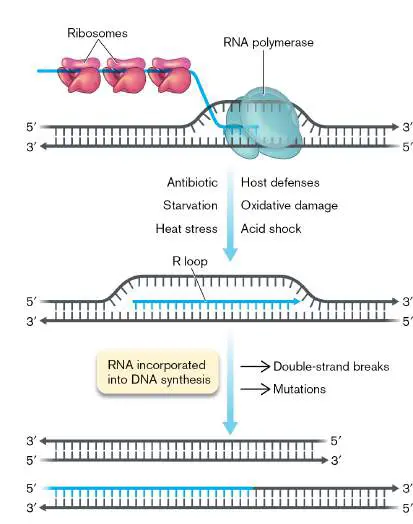
aberrant DNA synthesis, thus increasing mutations in stress-induced genes.
To Summarize
Natural selection is a process by which a genetically defined subpopulation leaves a greater number of offspring than its competitors do. The genome of the more successful competitor is said to show greater fitness for the given environment. Strongly selective environments , such as antibiotic exposure, lead to rapid evolution that is easy to observe. Selective pressure depends on the particular environment. A trait favored in one environment may be disadvantageous in another.
Genome analysis tracks how organisms adapted in the past. Gene duplications provide the opportunity to evolve paralogous genes with different functions.
Reductive (degenerative) evolution happens when unneeded genes are lost from the genome. The organism saves energy by avoiding their replication and expression. Experimental evolution in the laboratory enables us to test hypotheses about natural selection. Trait evolution involves three stages: Early mutations enable later mutations to confer fitness, mutation confers a novel phenotype, and refinement increases the degree of the phenotype.
Mechanisms of natural selection depend on the cell cycle. Microbes may outcompete their competitors by having a shorter lag phase, faster growth rate in log phase, increased survival in stationary phase, or slower death rate in death phase.
Stress conditions increase the mutation rate. Under starvation, several processes increase the rate of mutation and thus increase the opportunity for genetic adaptation. Highly transcribed genes may show higher mutation rate associated with R-loop formation. The increased mutation rate may lead to more rapid evolution of traits associated with active genes.
Glossary
natural selection The change in frequency of genes in a population under environmental conditions that favor some genes over others. fitness trade-off The situation where a trait improves fitness in one condition, but lowers fitness in a different condition.
gene duplication The formation of an extra copy of a gene within a genome. paralogous gene or paralog A gene that arises by gene duplication within a species and evolves to carry out a different function from that of the original gene.
reductive evolution Also called degenerative evolution. The loss or mutation of DNA encoding unselected traits.
degenerative evolution See reductive evolution .
experimental evolution Also called laboratory evolution. The repeated culturing of a population in a laboratory under defined environmental conditions, leading to evolution of adapted genotypes. laboratory evolution See experimental evolution .
relative fitness The ability of one strain of an organism to yield more progeny than a competitor does.
mutator A mutation that inactivates a gene encoding a DNA repair enzyme, leading to increase in frequency of random mutations throughout the genome.
17.5 Microbial Species and TaxonomyUnit 2 · Genomes
What is a species? Among eukaryotes, a species is defined by the principle that members of different species do not normally interbreed. The failure to interbreed is the traditional property that distinguishes eukaryotic species. For bacteria and archaea, however, reproduction is primarily asexual; thus, species borders are harder to define. The definition of bacterial species is complex, subject to heated debate among microbiologists. Also much debated is the classifying of life forms into different kinds (classification) and the naming of species (taxonomy).
Defining a Species
As genome sequence data became available for microbes, scientists hoped that quantitative measures of divergence could provide a consistent basis for defining microbial species. But for some organisms, such as Helicobacter pylori, the genomes of different strains that cause the same disease (gastritis) differ by as much as 7%. On the other hand, strains of Bacillus with nearly identical genomes cause completely different diseases, such as anthrax (B. anthracis) and caterpillar infection (the biological pesticide B. thuringiensis). Even more puzzling, hyperthermophilic bacteria such as Aquifex aeolicus show a high proportion of genes from the domain Archaea. Some researchers argue that the species concept lacks meaning for microbes.
Amid the debates, microbiologists generally agree on the importance of two perspectives: phylogeny (based on DNA relatedness) and ecology (based on shared traits and ecological niche).
Phylogenetic relatedness. A species is a group of individuals that share relatedness of a key set of “housekeeping genes,” typically informational genes such as ribosomal and transcriptional components. Ideally, these genes should all be orthologs (genes with a common origin and function), not paralogs (which diverged from a common ancestor but now differ in function). Within a genus, species that cannot be distinguished by SSU rRNA alone may be defined by analysis of multiple genes. For example, analysis of multiple gene loci effectively distinguishes Neisseria meningitidis (the cause of meningitis) from Neisseria lactamica, a harmless resident of the nasopharynx. The multigene approach has proved successful even in the case of highly “recombinogenic” organisms known to acquire and rearrange genes readily.
Ecological niche (ecotype). Besides a high degree of genomic relatedness, a species should include individuals that share common traits and an ecological niche, or “ecotype.” Shared traits should include cell shape and nutritional requirements, and there should be a common habitat and life history (for example, causing the same disease). By these criteria, highly divergent strains of Helicobacter pylori causing gastritis make up one species, whereas Bacillus anthracis (anthrax) and Bacillus thuringiensis (caterpillar infection) are different species despite their highly similar genomes. A working definition of species. While the debate goes on, many microbiologists accept the following criteria for a working definition of a microbial species: SSU rRNA identity ≥ 95%. Two organisms with 95% or greater similarity in SSU rRNA sequence generally are considered to share the same genus. Beyond the genus level, rRNA sequence lacks resolution.
Whole-genome similarity: average nucleotide identity (ANI) of orthologs ≥ 95%. Within whole genomes, we can define all the orthologous genes (orthologs, genes of the same function) that two strains share. If the strains share 95% or greater ANI for their orthologs, they may be considered the same species.
Shared ecotype. If two organisms with 95% or greater identity share a common habitat and metabolism or cause the same disease, they are considered the same species.
This working definition classifies most known bacteria in a way that reconciles phylogeny with ecotype. For example, Helicobacter pylori genomes with a common gastric pathology show exceptional variation due to horizontal gene transfer, even including their SSU rRNA genes. Nevertheless, a set of orthologs can be defined that share 95% ANI.
At the same time, new questions arise from the availability of multiple sequenced genomes for a single species. Suppose that every time we sequence a new isolate from nature or from a clinical specimen, we find that every new genome sequenced has a few new genes absent from previously sequenced isolates. How, then, do we define the gene map? This situation would be unheard of for animals and plants, in which the gene map is fixed by Mendelian recombination. It is common, however, for bacteria such as Clostridioides difficile, a cause of deadly infections in patients having antibiotic-depleted microbiomes (Fig. 17.31). For each new genome sequenced, several hundred new genes are identified that are absent from all the other genomes so far. Some of these new genes could be involved in pathogenesis, with profound implications for medicine.
FIGURE 17.31 ■ Pangenome and core genome of Clostridioides difficile. The median number of genes found is shown as a function of the number of Clostridioides difficile genomes sequenced. Error bars indicate the range in the number of genes found upon sequencing different combinations of genomes.
Source: Modified from Daniel Knight et al. 2019. mBio 10 :300446. Should we now attempt to define bacterial and archaeal genomes not just by a single sequenced genome, but by the sum total of all expected genes in all possible isolates? This theoretical total is called the pangenome. The pangenome includes a surprisingly small subset of genes present in all sequenced genomes of a species, known as its core genome. In addition, there are “accessory genes” present in one or more sequenced isolates. But how do we estimate the size of a pangenome for a given species?
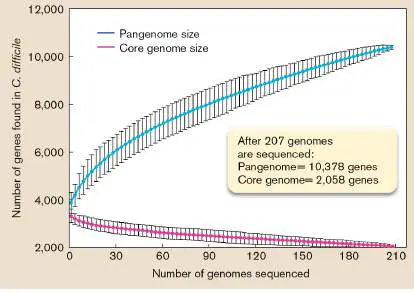
A statistical model can predict the chance of finding new genes every time we sequence another genome. A few species, such as the anthrax agent Bacillus anthracis, have a “closed” pangenome that appears to be defined by a relatively small number of natural isolates. But for C. difficile (Fig. 17.31), even after sequencing 207 isolates, each new genome still reveals additional genes. Amazingly, the size of the C. difficile pangenome appears to be infinite! This is called an “open” pangenome. Other species with open pangenomes include the pneumonia pathogen Streptococcus pneumoniae, the marine cyanobacterium Prochlorococcus marinus, and the halophilic archaeon Haloquadratum walsbyi. Open pangenomes may predominate in nature; thus, most bacterial and archaeal species have access to their core genome plus an uncountable number of possible accessory genes.
Classification and Nomenclature
Defining a species is part of the task of taxonomy, the classifying of life forms into different phylogenetic categories. Taxonomy is critical for every microbiological pursuit, from diagnosing a patient’s illness to understanding microbial ecosystems.
Classification generates a hierarchy of taxa (groups of related organisms; singular, taxon ) on the basis of successively narrow criteria. The fundamental basis of modern taxonomy is DNA sequence similarity, but the use of DNA arises within a long historical tradition of phenotypic description that shapes the views and practice of microbial taxonomy. Historically, taxa have been defined and named on the basis of a combination of genetic and phenotypic traits.
Traditional classification designates levels of taxonomic hierarchy, or rank, such as phylum, class, order, and family (Table 17.3). Some levels of rank may be designated by certain suffixes; for example, “-ota” (phylum), “-ales” (order), and “-aceae” (family). The ultimate designation of a type of organism is that of species, which includes the capitalized name of the genus (group of closely related species; plural genera ) followed by the uncapitalized species name; for example, the well-known species Streptomyces coelicolor. S. coelicolor is a member of the Actinomycetales (informally called actinomycetes), filamentous Gram-positive bacteria that produce many kinds of antibiotics. Actinomycetes are subdivided into families and genera, such as the genus Streptomyces.
Taxonomic Hierarchy of
TABLE 17.3
Classification
Taxon rank Example Domain Bacteria Division (phylum) Actinobacteria (Actinomycetota)
High-GC; Gram-positive Class Actinobacteria Subclass Actinobacteridae Order Actinomycetales Filamentous; acid-fast stain Family Streptomycetaceae Hyphae produce spores Genus Streptomyces Species (date first described) Streptomyces coelicolor (1908)
The definitions of taxonomic levels, however, are fluid, subject to change as microbiologists sequence new genomes. For example, the rhizobia are nitrogen-fixing soil bacteria that may develop intracellular mutualism within nodules of legume roots. The first rhizobial species characterized was Rhizobium leguminosarum in 1889. Since then, however, the “rhizobia” group was recognized to be paraphyletic; that is, it contains members of larger clades that do not share a unique common ancestor excluding members of other groups. Rhizobia are now classified under six families of Alphaproteobacteria, such as Rhizobiaceae and Bradyrhizobiaceae, as well as one family of Betaproteobacteria, the Burkholderiaceae. Nomenclature is the naming of categories, including species and more deeply branching clades. Current information on names of bacteria and archaea is described online at the List of Prokaryotic Names with Standing in Nomenclature (LPSN). The nomenclature of microbes remains surprisingly fluid: As new traits are identified and the genetic sequence of a microbe is established, species are all too frequently renamed. Nomenclature is supervised by the International Committee on Systematics of Prokaryotes (ICSP). In 2021, the ICSP proposed a list of revised names for numerous phyla of bacteria and archaea, in order to standardize their nomenclature and provide the regular suffix “—ota”; for example, Bacteroidetes was given the name Bacteroidota. Nevertheless, historical phylum names remain in use in the literature. A table of commonly studied phyla and their ICSP synonyms is provided in eAppendix 3.
Note: Taxonomic categories generally have two forms: formal
and informal. The formal term is capitalized, with a latinized suffix: Actinomycetales, Pseudomonas, Micrococcus. The informal term is lowercase, in some cases with an altered ending, and informal references to genera are not italicized: actinomycetes, pseudomonads, micrococci.
Emerging Clades: Unclassified and Uncultured Bacteria
As we discover new microorganisms, how do we decide what to call them? The term emerging is used to refer to an organism recently discovered or described. If the new organism causes a disease, it is called an “emerging pathogen.” An emerging organism that cannot be cultured may be known only by its habitat and its SSU rRNA sequence. Such organisms require a culture method and a description of essential cell structure and metabolism before designation as a new species. “Incompletely described” emerging organisms are designated as follows: Unclassified/uncultured organism. An unclassified organism, or uncultured organism, is assigned to a taxonomic rank on the basis of SSU rRNA sequence but has not yet been grown in pure culture; for example, an “uncultured actinomycete.”
Environmental sample. An environmental sample is designated by its habitat and assigned a rank on the basis of SSU rRNA. Examples of environmentally defined actinomycetes in the National Center for Biotechnology Information (NCBI) database include “oil-degrading bacterium AOB1” and “glacier bacterium FJS11.”
Candidate species. A cultured organism with some physiological characterization beyond DNA sequence may be published with a provisional status of candidate species, designated by the prefatory term “ Candidatus.” For example, in 2018, Philip Pope’s lab at the Norwegian University of Life Sciences reported the discovery of “ Candidatus Paraporphyromonas polyenzymogenes,” a candidate species of the phylum Bacteroidetes that breaks down complex sugar chains in the rumen of cattle.
Nongenetic Categories for Medicine and Ecology
Genetic relatedness is the standard for classifying and naming organisms in all fields of biology. At the same time, several nongenetic systems of categorization serve a practical purpose in certain fields. These systems include: Phenotypic categories for identification. Categories such as pigmentation or cell shape (rod or coccus) may have minor genetic significance but are useful for practical identification of organisms isolated from field or clinical sources.
Ecological categories. In ecology, the niche filled by an organism may be more important than its phylogeny. For example, cyanobacteria and sequoia trees both fill the role of photosynthetic producers of biomass. Both are primary producers—a trophic category of organisms that feed other organisms in the food web. Ecological categories are discussed further in Chapter 21.
Disease categories. In medical microbiology, microorganisms are categorized according to the type of disease they cause or the host organ system they inhabit. For example, Mycoplasma pneumoniae (a cell wall–less bacterium) and influenza virus are both pulmonary pathogens, whereas Escherichia coli and Bacteroides thetaiotaomicron are both normal members of the gut microbiome. Disease categories are discussed further in Chapters 25 and 26.
Naming a Species
A commonly accepted set of names for species and higher taxa is essential for research and communication. The accepted rules for naming species and taxa have been determined by the International Committee on Systematics of Prokaryotes (ICSP). The ICSP establishes minimal criteria for designating species, genera, classes, and other taxa of bacteria and archaea. To establish a new species, a previously unknown form of microbe must be isolated and grown in pure culture; this cultured organism is known as an isolate. The isolate’s unique genetic and phenotypic traits are published, with a proposed species name designated “ Candidatus ” for candidate species. The candidate species becomes accepted as an official species upon publication in the International Journal of Systematic and Evolutionary Microbiology, the official journal of record for novel prokaryotic taxa.
In the twenty-first century, the standard practice for accepting and naming species is overwhelmed by the number of new isolates, as well as uncultured microbes, reported in the literature. Many uncultured microbes are known only by their genome sequences. Today, microbial genomes are being discovered and sequenced much faster than our ability to culture them. To meet this challenge, scientists are working on a radical approach to define microbial types based on DNA sequence without culture. Such an approach called SeqCode was proposed by an international group of microbiologists in 2022.
Identification
Once a species has been described and classified, we need a way to identify future members of the species isolated from natural environments. Identification requires recognition of the class of a given microbe isolated in pure culture. Identification poses special difficulties with microbes, which, by definition, are invisible to the unaided eye. Even under the electron microscope, thousands of divergent species may possess similar shape and form.
Because the definition of a species is based on its gene sequence, the most consistent way to identify an isolate is to sequence part or all of its genome and compare with known sequences in databases such as those of the National Center for Biotechnology Information (NCBI). In clinical practice, such DNA-based methods are used increasingly. Nevertheless, even in the clinical lab—as well as in field and environmental microbiology—it is convenient to narrow down the possibilities using various easily determined traits, such as cell shape, staining properties, and metabolic reactions. Thus, practical identification is based on a combination of phylogeny (relatedness based on DNA sequence divergence) and phenetic, or phenotypic, traits.
A traditional strategy of practical identification is the dichotomous key, in which a series of yes/no decisions successively narrows down the possible categories of species. The dichotomous key approach is still used for some kinds of clinical diagnosis (see Chapter 28). However, a disadvantage of the dichotomous key is that it requires a series of steps, each of which takes time. And one wrong step leads the clinician down a wrong path. An alternative means of identification is the probabilistic indicator. A probabilistic indicator is a battery of biochemical tests performed simultaneously on an isolated strain (discussed in Chapter 28). The indicator requires a predefined database of known bacteria from a well-studied habitat, such as Gram-negative bacteria from the human intestinal tract. The database can be used to identify a specimen isolated from a patient, if the isolate coincides with a member of the predefined database.
To Summarize
Microbial species are defined primarily by sequence similarity of vertically transmitted genes such as SSU rRNA sequences and multiple orthologous genes. The species definition should also be consistent with the ecological niche or pathogenicity.
A working definition of a species includes shared identity of SSR rRNA above 95%, average nucleotide identity of orthologs greater than 95%, and a shared ecotype.
A pangenome includes the core genome possessed by all isolates of a species plus accessory genes found in some isolates but not others. A pangenome may be open (infinite number of genes) or closed (finite set of available genes). Taxonomy is the description and organization of life forms into classes (taxa). Taxonomy includes classification, nomenclature, and identification.
Classification is traditionally based on a hierarchy of ranks. Groups of organisms long studied tend to have many ranks, whereas recent isolates have few.
Nomenclature is the naming of categories, including species and more deeply branching clades.
DNA sequence relatedness defines microbial taxa. Below genus level, however, the definition of bacterial species can be problematic.
Emerging taxa are types of organisms recently discovered or described. They may be uncultured, and their phylogeny may be uncertain.
Practical identification is based on phenotypic and genetic traits. Methods of identification include the dichotomous key and the probabilistic test battery. Both methods assume a predefined set of organisms.
Glossary
classification The recognition of different forms of life and their placement into different categories.
pangenome All the genes possessed by all individual members of a species. core genome A set of genes shared by a group of related bacterial strains, showing stable inheritance.
taxonomy The description of distinct life forms and their organization into different categories on the basis of genetic relatedness. taxon pl. taxa A category of organisms with a shared genetic ancestor. species A single, specific type of organism, designated by a genus and species name.
genus pl. genera A group of closely related species.
paraphyletic group A group of organisms that contains members of larger clades that do not share a unique common ancestor excluding members of other groups.
nomenclature The naming of different taxonomic groups of organisms. emerging Describing an organism or other entity that is newly isolated, defined, or recognized, as in “emerging clade,” “emerging pathogen,” or “emerging disease.”
candidate species A newly described microbial isolate that may become accepted as an official species.
isolate A microbe that has been obtained from a specific location and grown in pure culture.
identification The recognition of the species (or higher taxonomic category) of a microbe isolated in pure culture.
dichotomous key A tool for identifying organisms, in which a series of yes/no decisions successively narrows down the possible categories of species.
17.6 Symbiosis and the Origin of Mitochondria and Chloroplastsnot assigned
So far, we have largely considered single species in isolation. In fact, however, all organisms evolve in the presence of other kinds of species, with whom they share interactions, both positive and negative. A major engine of evolution is symbiosis, the intimate association of two unrelated species. The ecology and behavioral adaptations of microbial symbiosis are discussed in Chapter 21; here we focus on the role of symbiosis in the evolution of cells.
Evolution of Endosymbiosis
The word “symbiosis” is popularly understood to mean mutualism, a relationship in which both partners benefit and may absolutely require each other. For example, an important bacterial mutualism is that of nitrogen fixation, in which rhizobia form intracellular “bacteroids” within legume plants that cannot fix nitrogen on their own. Both rhizobia and their plant hosts are highly evolved to respond to each other chemically and develop the nitrogen-fixing system. Biologists, however, recognize parasitism, in which one partner is harmed, as a relationship equally as intimate as mutualism; both mutualism and parasitism are forms of symbiosis. Intimate relationships between species, either negative or positive, lead to coevolution, the evolution of two species in response to one another, showing parallel phylogeny.
The most intimate kind of symbiosis is endosymbiosis, in which one partner population grows within the body of another organism. Endosymbiosis includes communities of microbes within the digestive tracts of animals, such as the human intestinal microbiome (discussed in Chapters 21 and 23). The internalized endosymbiont can also be intracellular, as in the case of rhizobial bacteroids within legume tissues. Rhizobia retain the genetic capacity for independence, growing readily in soil. Other intracellular endosymbionts, however, become wholly dependent on their host cells. Pathogenic endosymbionts, such as chlamydias, evolve specialized traits enabling their growth at the expense of the host and their evasion of the host immune system. But endosymbionts also undergo drastic reductive evolution, evolving ever-deeper interdependence with their host cells.
A simple example of intracellular endosymbiosis is that of the alga Chlorella growing within Paramecium bursaria (Fig. 17.32). The algae conduct photosynthesis and provide nutrients to the paramecium, which in turn shelters the algae from predators and viruses. The relationship is highly specific—only certain species of algae and paramecia participate—and the algal growth is limited to a population that avoids harming the host. This relationship may give clues to how the bacterial ancestor of chloroplasts began its intracellular existence.
FIGURE 17.32 ■ Endosymbiosis. Paramecium bursaria, a ciliate protist with endosymbiotic Chlorella algae.
GERD GUENTHER/SCIENCE SOURCE
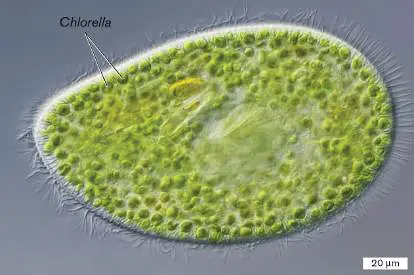
Despite this intimate relationship, Chlorella retains its ability to multiply outside the paramecium; thus this symbiosis is reversible. Moreover, under conditions of starvation in the absence of light, the paramecium may start to digest its endosymbionts as prey. Thus, the nature of the symbiosis (mutualistic or predatory) depends on the environment.
Many invertebrate animals, often themselves parasites of animals or plants, possess obligate bacterial endosymbionts. For example, the fruit fly, Drosophila, carries a parasitic endosymbiont, the bacterium Wolbachia pipientis. The Wolbachia strains that infect Drosophila cells are transmitted only through egg cells; they cannot exist outside the insect. Other invertebrate endosymbionts, however, are mutualists. In fact, 15% of insect species depend on intracellular bacteria to produce essential nutrients, such as certain amino acids or vitamins. In these mutualisms, both partners have lost essential traits by reductive evolution, and each now requires the partner species to provide the lost function.
A surprising number of human invertebrate parasites, such as filarial nematodes and Anopheles mosquitoes, carry bacterial endosymbionts required for host growth. This discovery has exciting implications for treatment of parasitic diseases. Invertebrate parasites such as filarial nematode worms invade human lymph nodes, causing forms of disease (filariasis) that are notoriously difficult to treat. Few anti-nematode compounds are sufficiently selective for worm metabolism versus human metabolism, because both are eukaryotic animals.
A form of filariasis is elephantiasis, in which a limb expands with edema because the lymph ducts are blocked by worms (Fig.
17.33A ). Filariasis afflicts more than 120 million people worldwide, largely in the Indian subcontinent and in Africa.
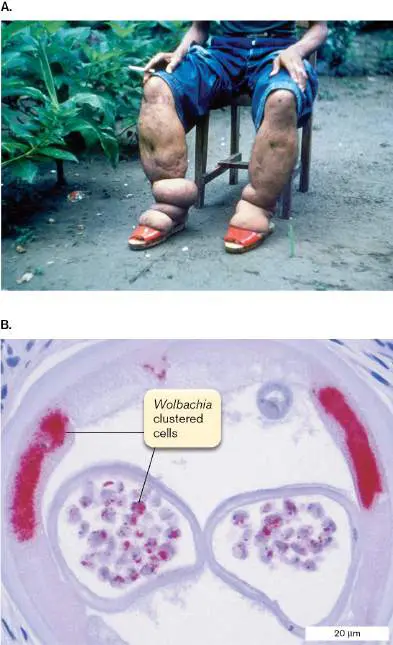
FIGURE 17.33 ■ The filarial endosymbiont Wolbachia. A. Patient suffering from a form of filarial infection known as elephantiasis. B. Cross section of the nematode Brugia malayi, showing Wolbachia bacteria (stained pink) within the worm’s dermis and uterine tubes.
CDC
K. PFARR AND A. HOERAUF. 2005. PLOS MED. 2 :E110
A filarial nematode, Brugia malayi, harbors endosymbiotic Wolbachia (a different strain from the one that infects Drosophila; Fig. 17.33B ). Wolbachia may have entered the nematode originally as a pathogen or parasite, and then persisted because of its metabolic contributions to the host. The nematode’s Wolbachia inhabitants are mutualists; the nematode needs them for embryonic development. The bacteria are found within tissue layers beneath the nematodes’ cuticle and within the uterine tubes of females, where they enter the developing offspring (Fig. 17.33B ). When human patients infected by the nematodes are treated with antibiotics such as tetracycline, the bacteria disappear from worm tissues. The worm burden gradually decreases, and no offspring are produced. Antibacterial antibiotics eliminate the worms sooner and more completely than does treatment with anti-nematode agents. The genome of a Wolbachia strain from a filarial nematode reveals extensive reductive evolution. With barely a million base pairs, the Wolbachia genome has lost many metabolic pathways. It retains glycolysis and the TCA cycle but has lost the pathways for biosynthesis of all amino acids and most vitamins. It nonetheless retains pathways to make purines, pyrimidines, and the coenzymes riboflavin and flavin adenine dinucleotide (FAD)—essential pathways lost by its host nematode. Overall, Wolbachia appears to be evolving into an organelle of its host, like the ancestors of mitochondria and chloroplasts.
Mitochondria and Chloroplasts
Lynn Margulis (1938–2011) famously showed how the assimilation of endosymbionts as mitochondria and chloroplasts played a central role in the evolution of eukaryotes (Fig. 17.34). Like Wolbachia, mitochondria evolved from a bacterium related to the rickettsias (intracellular pathogens). The mitochondrial ancestor must have entered the eukaryotic lineage as, or shortly after, the eukaryotes diverged from archaea, as all known eukaryotes retain mitochondria or vestigial remnants of mitochondrial genomes (discussed in Chapter 20).
FIGURE 17.34 ■ Endosymbiotic cells evolved into mitochondria and chloroplasts. Eukaryotic cells contain
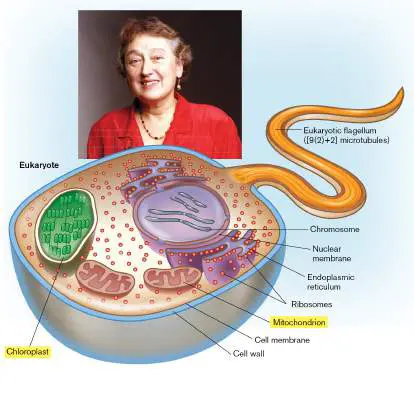
mitochondria and chloroplasts, organellar remnants of ancient endosymbioses. Inset: Lynn Margulis (1938–2011).
TOMMASO BONAVENTURA/CONTRASTO/REDUX
Mitochondria provide the cell with the essential functions of electron transport and respiration. The electron transport system (ETS) is found in the mitochondrial inner membrane, believed to derive from the cell membrane of the ancestral bacterium. The outer membrane may derive from the invaginating membrane of the host cell that originally engulfed the endosymbiont.
Chloroplasts arose from cyanobacteria at some point before the divergence of red and green algae (discussed in Chapter 20). A model for cyanobacterial uptake can be seen in the protist Glaucocystophyta, whose cyanobacterial endosymbionts retain cell walls and some metabolism. Like mitochondria, chloroplasts possess inner and outer membranes, believed to derive from the ancestral endosymbiont and host, respectively. Photosynthetic complexes are located in the thylakoid membranes, similar to those of modern cyanobacteria.
The genomes of mitochondria and chloroplasts both show extreme reduction (Fig. 17.35)—even more extreme than that of any known endosymbiotic bacteria. The few genes that remain in the organellar genome include remnants of the central transcription-translation apparatus, such as rRNA and tRNAs, as well as a handful of genes whose products are essential for survival of the host cell: for respiration (mitochondria) or photosynthesis (chloroplasts). FIGURE 17.35 ■ Genomes of mitochondria and chloroplasts. A. The mitochondrial genome retains large-subunit and small-subunit rRNAs, tRNA genes, plus subunits of the respiratory electron transport system. Text bubbles indicate human diseases associated with mitochondrial defects. B. The chloroplast genome retains large-subunit and small-subunit rRNAs (23S and 16S), several tRNA and RNA polymerase genes, plus Rubisco (large subunit) and components of photosystems I and II (dispersed around the circle, not labeled in the figure). Mitochondrial genome. In human mitochondria, the mitochondrial genome encodes key parts of the respiratory chain, including subunits of NADH dehydrogenase, cytochrome c oxidase, and ATP synthase (Fig. 17.35B ). Mutations in these key genes lead to serious diseases; for example, damage to mitochondrial genes of respiration is associated with motor neuron disease, parkinsonism, and forms of ataxia.
But thousands of genes encoding ETS subunits, as well as other essential parts of mitochondria, have migrated from the mitochondrion to the nucleus. The nuclear acquisition probably occurred through accidental copying of mitochondrial genes into the nuclear genome. Reductive evolution then occurred, faster in the mitochondrial copy because of the faster mutation rate. Some of
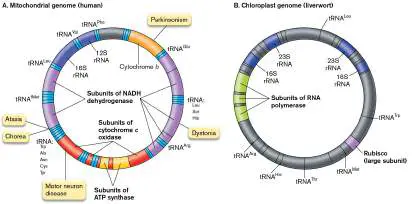
these nuclear-acquired mitochondrial genes show tissue-specific expression, resulting in different mitochondrial types associated with different tissues. Thus, some mitochondrial defects are actually inherited through the nuclear genome. The mitochondria have evolved as integral parts of the host cell.
Chloroplast genome. In chloroplasts, the organellar genome encodes essential products for photosynthesis, including photosystems I and II and the ATP synthase. The chloroplast genome shown in Figure 17.35B retains the large subunit of Rubisco, whereas the gene encoding the small subunit has migrated to the nucleus.
Remarkably, the process of symbiogenesis, the generation of new symbiotic associations, continues in many protists. Protist-algae, also known as “secondary symbiont” algae, result from symbiogenesis in which an alga (containing a chloroplast) was engulfed by an ancestral protist. Secondary endosymbionts are presented in the context of eukaryotic diversity in Chapter 20.
Thought Question
17.11 Besides mitochondria and chloroplasts, what other kinds of entities within cells might have evolved from endosymbionts? Overall, it is hard to say which is more astonishing: the fundamental shared traits of all living cells, including membrane-enclosed support systems for genomes of shared ancestry, or the subsequent evolution of organisms with vastly different adaptations to exploit every possible niche of our planet. In the next three chapters we explore these diverse adaptations: Chapter 18, bacterial diversity; Chapter 19, archaeal diversity; and Chapter 20, diversity among microbial eukaryotes, including fungi, algae, and protozoa.
To Summarize
Symbiosis is the intimate association of two unrelated species. A symbiosis in which both partners benefit is called mutualism . If one partner benefits while harming the other, the symbiosis is called parasitism .
Symbiotic partners undergo coevolution , the evolution of two species in response to one another. Coevolution involves reductive (degenerative) evolution, in which each partner species loses some functions that the other partner provides. An endosymbiont lives inside a much larger host species. Many microbial cells harbor endosymbiotic bacteria whose metabolism yields energy for their hosts.
Many invertebrates harbor endosymbiotic bacteria. The bacteria are required for host survival and, in some cases, for pathology caused by a parasitic invertebrate.
Mitochondria evolved from endosymbionts. The ancestor of mitochondria was an alphaproteobacterium related to rickettsias.
Chloroplasts evolved from endosymbionts. The chloroplast ancestor was a cyanobacterium.
Glossary
mutualism A symbiotic relationship in which both partners benefit. parasitism A symbiotic relationship in which one member benefits and the other is harmed.
coevolution The evolution of two species in response to one another. endosymbiosis An intimate association between different species in which one partner population grows within the body of another organism. symbiosis pl. symbioses The intimate association of two different species.
eResearch Activity 17
Does a Food Preservative Select for Stress-Induced Mutations?
We commonly ingest food products without thinking about the molecules added to retard spoilage or the loss of food value caused by microbial decomposition. Some of the most common food preservatives are organic acids, such as benzoic acid, sorbic acid, and propionic acid. So, what happens when these molecules enter our stomach and pass into our gut microbiome? Their concentrations are small, but even small amounts of growth-retarding substances can have selective effects on bacterial evolution (see Section 17.4). At Kenyon College, an undergraduate research team established an evolution experiment to study the results of natural selection on Escherichia coli in the presence of sodium benzoate (in equilibrium with benzoic acid). Sodium benzoate, or benzoic acid, occurs naturally in foods such as apples and prunes; food manufacturers add small amounts of it to preserve salad dressings, sodas, and yogurts. The weak acidity of benzoic acid concentrates the molecule within cells, a process driven by the proton motive force (described in Chapter 14). Students hypothesized that over generations of growth, bacteria would undergo natural selection for genes conferring resistance to acidification. Two of the students who maintained the experiment and analyzed the results were Jeremy Moore and Haofan Li, who later attended graduate school at Yale University (Fig. ERA 17.1 ).

FIGURE ERA 17.1 ■ Jeremy Moore and Haofan Li analyzed Escherichia coli strains evolved under benzoate stress.
JEREMY MOORE
ELLA MUSHER-EIZENMAN
The evolution experiment was originally established in microtiter plates, allowing multiple populations to be maintained in convenient small containers (Fig. ERA 17.2A ). After 2,000 generations in the presence of increasing concentrations of benzoate, isolates were obtained, and their genomes were sequenced. To everyone’s surprise, the benzoate-evolved genomes showed loss of some major acid

resistance genes such as those of the Gad acid fitness island. The Gad island encodes enzymes that reverse acidity, chaperones that refold acid-denatured proteins, and acid-dependent multidrug efflux pumps. Why would benzoate exposure select for their loss?
FIGURE ERA 17.2 ■ Benzoate-evolved strains show loss of benzoate-induced gene expression. A. Escherichia coli populations underwent 2,000 generations of serial culture in microtiter plates. B. Sequencing of mRNA showed that genes up-regulated by benzoate in the ancestral strain were down-regulated after adaptive evolution with benzoate, and vice versa. Source: Jeremy Moore et al. 2019. Appl. Environ. Microbiol. 85:e00966-19.
ECZSERAPYILMAZ/SHUTTERSTOCK
For further insights, Moore and Li analyzed mutant constructs containing knockout resistance genes. They also sequenced the RNA transcripts (the transcriptome) from benzoate-evolved strains. Figure ERA 17.2B compares the transcriptome of one benzoate-evolved strain with that of its ancestral strain of E. coli K-12. Surprisingly, the majority of genes induced by benzoate stress in the
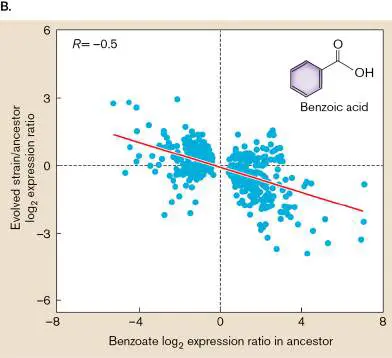
ancestor (horizontal axis) are down-regulated in the transcriptome of the benzoate-evolved strain. This group included genes encoding several multidrug efflux pumps. More surprising, many genes down-regulated by benzoate in the ancestor, such as those encoding large-hole porins, were up-regulated in the benzoate-evolved strain. These porins let benzoate cross the outer membrane but also admit fermentable nutrients, a function important during the stationary phase of growth. Similar results were found for three independent benzoate-evolved clones.
The results suggest several observations and new hypotheses: Stress-induced genes may accumulate mutations associated with transcription and error-prone DNA repair, as predicted by Susan Rosenberg’s model (see Fig. 17.29).
Genes induced by transient stress during early log phase (see Fig. 17.28) may decrease relative fitness during later portions of the growth cycle and after long-term serial culture. So, tamping down extreme stress response may increase fitness during chronic stress exposure.
The long-term selection against multidrug efflux pumps might be a useful property of benzoate and related compounds.
Further Exploration
How might you test the hypothesis that food preservatives cause stress-induced mutations? Does this phenomenon require acid pH?
What other classes of preservatives or pharmaceuticals might lead to selection against bacterial multidrug efflux pumps?
Moore, Jeremy P., Haofan Li, Morgan L. Engmann, Katarina M. Bischof,
Karina S. Kunka, et al. 2019. Inverted regulation of multidrug efflux pumps, acid
resistance, and porins in benzoate-evolved Escherichia coli K-12. Applied and Environmental Microbiology 85 :e00966-19.
Glossary
Fig. 17.28 FIGURE 17.28 ■ Fitness competition during serial batch culture. A subpopulation may achieve higher fitness (more offspring compared to a competitor) by different mechanisms in different phases of the growth cycle (red lines). After dilution into fresh medium, an individual with a shortened lag phase may outcompete others in the population. During log phase, relative fitness increases by increasing growth rate. In stationary phase, higher fitness requires growth rate to exceed death rate. During death phase, higher fitness requires a lower relative death rate. Fig. 17.29
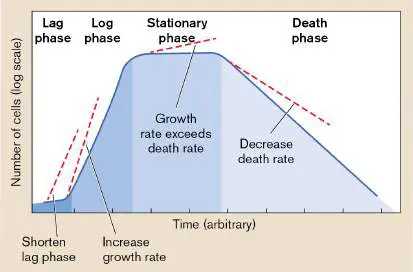
FIGURE 17.29 ■ Stress conditions lead to increased rates of random mutation. A. Susan Rosenberg showed how bacteria under starvation stress increase their rate of random mutation and evolve novel variants faster. B. Sectored colonies form as a result of random mutations leading to Lac + phenotype (green indicator).
COURTESY OF SUSAN ROSENBERG
P. J. HASTINGS ET AL. 2004. PLOS BIOL. 2 :E399, FIG. 1B
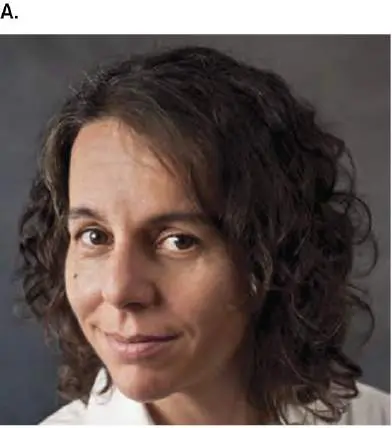
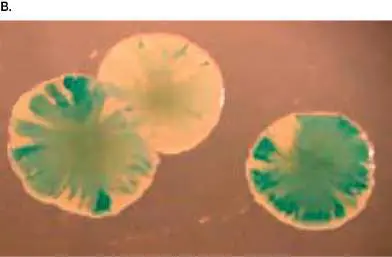
CHAPTER REVIEW
Review Questions
1. What was the composition of Earth’s early crust and atmosphere? What processes changed their composition to that found today?
2. What kinds of evidence support the presence of life in the Archean eon? What are the advantages and limitations of each kind of evidence?
3. What kinds of metabolism are believed to have existed in Archean life? What kinds of evidence support their existence?
4. Compare and contrast two models for the origin of the first cells. Which features of life does each model explain, and which features are unexplained?
5. Explain the roles of classification, nomenclature, and identification for microbial taxonomy.
6. Why is the definition of species in bacteria and archaea more problematic than in eukaryotes? What is generally considered the current basis for defining prokaryotic species?
7. Discuss the roles of mutation, natural selection, and reductive evolution in the divergence of microbial species. Cite specific examples.
8. Explain the basis of a “molecular clock” for measuring microbial evolution. What fundamental properties must be met by a gene to function as a molecular clock? What are the limitations of a molecular clock?
9. Explain the basis of a phylogenetic tree. Why is the fundamental tree at the divergence of bacteria, archaea, and eukaryotes unrooted?
10. How does horizontal gene transfer determine genome content? What kinds of genes are likely to undergo horizontal transfer?
11. Explain three different ways that we can test questions about natural selection.
12. Explain how endosymbiosis can lead to obligate association. Explain how reductive evolution and gene transfer lead to the evolution of organelles that are inseparable from host cells.
Thought Questions
1. How convincing is the microfossil in Figure 17.5A? What criteria do you think would define a microfossil?
2. In the phylogeny shown here, where are the root and the outgroup? How does the outgroup organism differ from the others? Which two organisms are the most closely related? Which node represents the last common ancestor of Neisseria and Haemophilus? Which genome has evolved much faster than the others, and why?
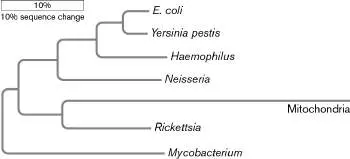
3. Design an evolution experiment in the laboratory to evolve a bacterium that breaks down a dangerous pollutant such as dioxin. How would you select the starting organism, and what experimental steps would you perform?
Key Terms
abiotic (683)
Archean eon (677)
banded iron formation (BIF) (681) biogenic (678)
biosignature (biological signature) (677) biosphere (676)
branch (688)
candidate species (708) clade (687)
classification (705, 707) coevolution (709)
core genome (706)
degenerative evolution (699) dichotomous key (708)
domain (691)
emerging (707)
endolith (676)
endosymbiosis (709)
experimental evolution (700) fitness trade-off (698) gene duplication (699) genus (707)
greenhouse effect (677) Hadean eon (677)
horizontal gene transfer (693) identification (708)
isolate (708)
isotope ratio (678)
laboratory evolution (700) lineage (688)
microbial mat (674)
microfossil (678)
molecular clock (689)
monophyletic group (687) mutator (702)
mutualism (709)
natural selection (696) node (688)
nomenclature (707)
outgroup (688)
pangenome (706)
panspermia (686)
paralogous gene (paralog) (699) paraphyletic group (707) parasitism (709)
photoferrotrophy (684) phylogenetic tree (687) phylogeny (687)
prebiotic soup (683)
reductive evolution (699) relative fitness (701) ribozyme (685)
RNA world (684)
root (688)
small-subunit ribosomal RNA (SSU rRNA) (689) species (687, 707)
stromatolite (674)
symbiosis (709)
taxon (707)
taxonomy (705, 707)
vertical gene transfer (693)
Recommended Reading
Attwater, James, Aditya Raguram, Alexey S. Morgunov, Edoardo Gianni, and Philipp Holliger. 2018. Ribozyme-catalysed RNA synthesis using triplet building blocks. eLife 7:e35255.
Blount, Zachary D., Jeffrey E. Barrick, Carla J. Davidson, and Richard E. Lenski. 2012. Genomic analysis of a key innovation in an experimental Escherichia coli population. Nature 489 :513– 518.
Cavalazzi, Barbara, Laurence Lemelle, Alexandre Simionovici, Sherry L. Cady, Michael J. Russell, et al. 2021. Cellular remains in a ~3.42-billion-year-old subseafloor hydrothermal environment. Science Advances 7 : eabf3963. Charusanti, Pep, Nicole L. Fong, Harish Nagarajan, Alban R. Pereira, Howard J. Li, et al. 2012. Exploiting adaptive laboratory evolution of Streptomyces clavuligerus for antibiotic discovery and overproduction. PLoS One 7 :e33722.
Didelot, Xavier, A. Sarah Walker, Tim E. Peto, Derrick W. Crook, and Daniel J. Wilson. 2016. Within-host evolution of bacterial pathogens. Nature Reviews. Microbiology 14 :150–162. Fitzgerald, Devon M., P. J. Hastings, and Susan M.
Rosenberg. 2017. Stress-induced mutagenesis: Implications in cancer and drug resistance. Annual Review of Cancer Biology 1:119–140.
Harris, Katrina B., Kenneth M. Flynn, and Vaughn S. Cooper. 2021. Polygenic adaptation and clonal interference enable sustained diversity in experimental Pseudomonas aeruginosa populations. Molecular Biology and Evolution 38 (12):5359–5375. He, Amanda, Stephanie R. Penix, Preston J. Basting, Jessie M. Griffith, Kaitlin E. Creamer, et al. 2017. Acid evolution of Escherichia coli K-12 eliminates amino acid decarboxylases and reregulates catabolism. Applied and Environmental Microbiology 83 :e00442-17.
Hedlund, Brian P., Maria Chuvochina, Philip Hugenholtz, Konstantinos T. Konstantinidis, Alison E. Murray, et al. 2022. SeqCode: A nomenclatural code for prokaryotes described from sequence data. Nature Microbiology in press.
Johnson, Matthew D., James Bell, Kim Clarke, Rachel Chandler, Prachi Pathak, et al. 2014. Characterization of mutations in the PAS domain of the EvgS sensor kinase selected by laboratory evolution for acid resistance in Escherichia coli. Molecular Microbiology 93 :911–927.
Morris, J. Jeffrey, Richard E. Lenski, and Erik R. Zinser. 2012. The Black Queen hypothesis: Evolution of dependencies through adaptive gene loss. mBio 3 :e00036-12.
Noffke, Nora, Daniel Christian, David Wacey, and Robert M. Hazen. 2013. Microbially induced sedimentary structures recording an ancient ecosystem in the ca. 3.48 billion-year-old Dresser Formation, Pilbara, Western Australia. Astrobiology 13:1103–1124.
Oba, Yasuhiro, Yoshinori Takano, Yoshihiro Furukawa, Toshiki Koga, Daniel P. Glavin, et al. 2022. Identifying the wide diversity of extraterrestrial purine and pyrimidine nucleobases in carbonaceous meteorites. Nature Communications 13 :1–10.
Oren, Aharon, and George M. Garrity. 2021. Valid publication of the names of forty-two phyla of prokaryotes. International Journal of Systematic and Evolutionary Microbiology 71 :005056. Yang, Tingting, Jun Zhong, Ju Zhang, Cuidan Li, Xia Yu, et al. 2018. Pan-genomic study of Mycobacterium tuberculosis reflecting the primary/secondary genes, generality/individuality, and the interconversion through copy number variations. Frontiers in Microbiology 9 :1886.
Glossary
abiotic Produced without living organisms; occurring in the absence of life.
Archean eon The second eon (major time period) of Earth’s existence, from 4.0 gigayears (Gyr, 10 9 years) to 2.5 Gyr before the present. The earliest geological evidence for life dates to this eon. banded iron formation (BIF)
A geological formation containing layers of oxidized iron (Fe 3+ ), which indicates formation under oxygen-rich conditions. biogenic Formed by living organisms.
biosignature Also called biological signature. A type of chemical believed to be formed only by specific life processes.
biosphere The region containing the sum total of all life on Earth. branch A lineage of organisms that share a common ancestor.
candidate species A newly described microbial isolate that may become accepted as an official species.
clade Also called monophyletic group. A group of organisms that includes an ancestral species and all of its descendants. classification The recognition of different forms of life and their placement into different categories.
coevolution The evolution of two species in response to one another. core genome A set of genes shared by a group of related bacterial strains, showing stable inheritance.
degenerative evolution See reductive evolution .
dichotomous key A tool for identifying organisms, in which a series of yes/no decisions successively narrows down the possible categories of species.
domain 1. In taxonomy, one of three major subdivisions of life: Archaea, Bacteria, and Eukarya. 2. In protein structure, a portion of a protein that possesses a defined function, such as binding DNA. 3. In membranes, a region of membrane consisting of certain types of phospholipids that are distinct from surrounding lipids. emerging Describing an organism or other entity that is newly isolated, defined, or recognized, as in “emerging clade,” “emerging pathogen,” or “emerging disease.”
endolith A bacterium that grows within the crystals of solid rock. endosymbiosis An intimate association between different species in which one partner population grows within the body of another organism. experimental evolution Also called laboratory evolution. The repeated culturing of a population in a laboratory under defined environmental conditions, leading to evolution of adapted genotypes. fitness trade-off The situation where a trait improves fitness in one condition, but lowers fitness in a different condition.
gene duplication The formation of an extra copy of a gene within a genome. genus pl. genera A group of closely related species.
greenhouse effect The trapping of solar radiation heat in the atmosphere by CO 2; a cause of global warming.
Hadean eon The first eon (major time period) of Earth’s existence, from 4.6 to approximately 4.0 gigayears (Gyr, 10 9 years) before the present.
horizontal gene transfer Also called lateral gene transfer. The natural movement of genes from one genome into another, nonprogeny genome. identification The recognition of the species (or higher taxonomic category) of a microbe isolated in pure culture.
isolate A microbe that has been obtained from a specific location and grown in pure culture.
isotope ratio The ratio of amounts of two different isotopes of an element. It may serve as a biosignature if the ratio between certain isotopes of a given element is altered by biological activity. laboratory evolution See experimental evolution .
lineage In a phylogenetic tree, a line of individuals, past and present, that descends from one common ancestor. Also called a branch.
microbial mat A complex biofilm of microbes, usually containing multiple layers.
microfossil A microscopic fossil in which calcium carbonate deposits have filled in the form of ancient microbial cells.
molecular clock The use of DNA or RNA sequence information to measure the time of divergence among different species.
monophyletic group See clade .
mutator A mutation that inactivates a gene encoding a DNA repair enzyme, leading to increase in frequency of random mutations throughout the genome.
mutualism A symbiotic relationship in which both partners benefit. natural selection The change in frequency of genes in a population under environmental conditions that favor some genes over others. node In a phylogenetic tree, the most recent common ancestor of branching descendants.
nomenclature The naming of different taxonomic groups of organisms. outgroup In a phylogenetic tree, a taxon that diverged from a lineage before the ancestor shared by all other taxa in the tree. pangenome All the genes possessed by all individual members of a species. panspermia The hypothesis that life forms originated elsewhere in the universe and “seeded” life on Earth.
paralogous gene or paralog A gene that arises by gene duplication within a species and evolves to carry out a different function from that of the original gene.
paraphyletic group A group of organisms that contains members of larger clades that do not share a unique common ancestor excluding members of other groups.
parasitism A symbiotic relationship in which one member benefits and the other is harmed.
photoferrotrophy Photosynthesis in which light absorption provides energy to separate an electron from reduced iron (Fe 2+).
phylogenetic tree A diagram depicting estimates of the relative amounts of evolutionary divergence among different species.
phylogeny A measurement of genetic relatedness. The classification of organisms on the basis of their genetic relatedness.
prebiotic soup A model for the origin of life that is based on the abiotic formation of fundamental biomolecules and cell structures such as membranes out of a “soup” of nutrients present on early Earth.
reductive evolution Also called degenerative evolution. The loss or mutation of DNA encoding unselected traits.
relative fitness The ability of one strain of an organism to yield more progeny than a competitor does.
ribozyme See catalytic RNA .
RNA world A model of early life in which RNA performed all the informational and catalytic roles of today’s DNA and proteins. root In a phylogenetic tree, the earliest common ancestor of all members shown.
small-subunit ribosomal RNA (SSU rRNA)
In bacteria and archaea, 16S rRNA; in eukaryotes, 18S rRNA. A ribosomal RNA found in the small subunit of the ribosome. Its gene is often sequenced for phylogenetic comparisons.
species A single, specific type of organism, designated by a genus and species name.
stromatolite A mass of sedimentary layers of limestone produced by a marine microbial community over many years.
symbiosis pl. symbioses The intimate association of two different species.
taxon pl. taxa A category of organisms with a shared genetic ancestor. taxonomy The description of distinct life forms and their organization into different categories on the basis of genetic relatedness. vertical gene transfer The generational movement of genes from parent to offspring through reproduction.
Figure 17.5A FIGURE 17.5 ■ Microfossils compared with modern bacteria. A. Filamentous algae, 1.2 Gyr old, from Arctic
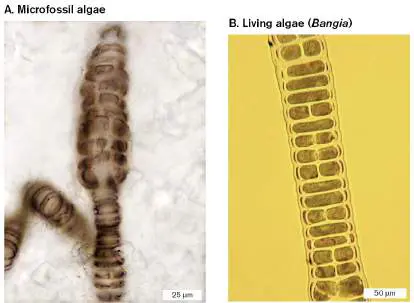
Canada. B. Modern red algae, Bangia sp.
NICHOLAS J. BUTTERFIELD, UNIVERSITY OF CAMBRIDGE
NICHOLAS J. BUTTERFIELD, UNIVERSITY OF CAMBRIDGE