Chapter introduction
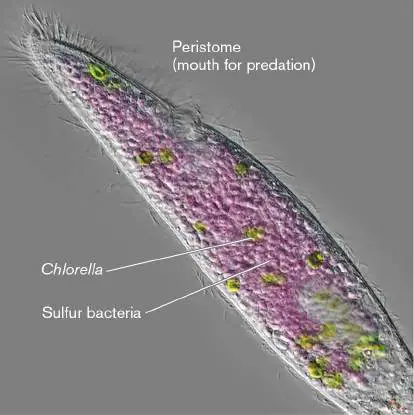
The ciliated protist Pseudoblepharisma tenue harbors two mutualistic phototrophs: green algae resembling
“No one is an island,” nor is any microbe. All life exists amidst other forms of life, in communities of an ecosystem—populations of species plus their habitat or environment. And the foundation of all ecosystems is communities of microbes. Microbes colonize every habitat of Earth’s biosphere, including soil, water, air, and the bodies of plants and animals, including humans. Even ocean microbes consume plastic from human pollution. An animal’s microbial community provides essential nutrients by digesting complex foods into small molecules that the host can use. Our own gut communities help shape our brain and our immune system.
Ultimately, animal bodies give back to the ecosystem when their microbial decomposition releases elements that build other community members.
Microbial ecology is an experimental science at the forefront of biological discovery. The sequences of microbial metagenomes (community DNA) and metatranscriptomes (community RNA) reveal astonishing new forms of life and new roles for microbes. New tools of fluorescence detection and microbial culture reveal complex multispecies biofilms within environments and within our bodies. Experimental investigations show how succession of microbial communities transforms entire ecosystems, with unexpected responses to human pollution and environmental change.
In Chapter 21 we explore how microbes interact with each other and with their animal and plant partners in water and soil. Chapter 22 then takes a global perspective on how microbes shape our planet’s climate and the quality of our biosphere, as well as the “built environment” of human communities.
21.1 Microbial Communities: Omics Analysisnot assigned
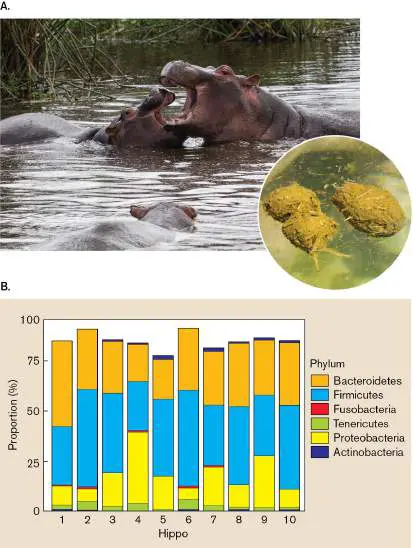
What is ecology? Unlike “Fiona the hippo” in the Cincinnati Zoo, living organisms evolve in an ecosystem of organisms interacting within a given habitat, such as a wetland in Tanzania (Fig. 21.1). Each kind of organism forms a population, a group of individuals of one species or taxon (such as hippopotamus) living in a shared habitat. The sum of populations of different species in an ecosystem, including animals, plants, and microbes, constitutes a community. All communities, from oceans and forests to the interstices of rock, depend on contributions of microbes. At the Tanzanian river, hippopotamuses (hippos) deposit their feces in the water (Fig. 21.1, inset), providing half-digested grass caked with minerals and microbes that fish consume as food. Thus, the hippos’ digestion transfers nutrients and microbial communities that enrich the food web.
FIGURE 21.1 ■ Every ecosystem includes microbes. A. Hippopotamuses (hippos), the plants and animals they feed on, and the water all contain microbes. Ngorongoro crater, Tanzania. Inset: Hippo feces released into water. B. Gut microbiomes
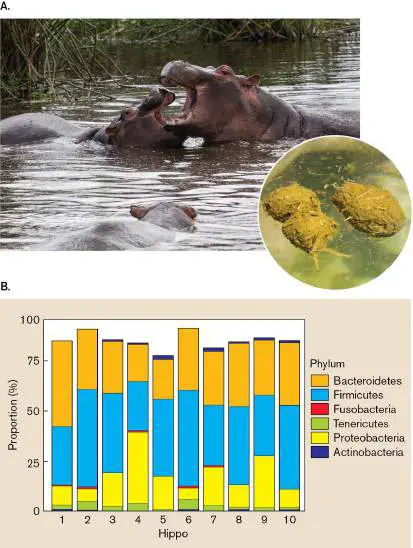
sampled from feces of individual hippos in the Mara River in Tanzania show consistent proportions of Firmicutes, Bacteroidetes, and Proteobacteria. Data are from 16S ribosomal RNA (rRNA)
reverse transcription and polymerase chain reaction (PCR)
amplification, representing metabolically active bacteria.
Source: Christopher Dutton et al. 2021. Sci. Rep. 11 :23117.
ANDERS BOESEN/ALAMY STOCK PHOTO
BIGBOOM/SHUTTERSTOCK
The hippo can be seen and observed directly, but how do we assess its microbial community? The microbes found in a defined habitat constitute a microbial community or microbiome, also known as the microbiota. A microbiome may be associated with a host animal or plant or with a region of soil or water—even the global ocean, as analyzed by Shinichi Sunagawa (see Fig. 7.29).
Microbiomes recycle organic material in aquatic and terrestrial ecosystems, providing resources for plants and animals. And deep below Earth’s surface, microbes shape the rock of Earth’s crust. Amplicon analysis of microbiomes. To explore the hippo microbiomes, Christopher Dutton, Amanda Subalusky, and colleagues amplified the nucleic acid sequences of bacterial small-subunit ribosomal RNA (SSU rRNA, or 16S rRNA) using polymerase chain reaction (PCR; see eAppendix 3), as discussed in Chapters 17 and 18. To analyze rRNA, we can use pairs of highly conserved primer sequences to amplify regions of the DNA gene that diverge among taxa. Such amplified sequences are called amplicons. Amplicon analysis of the hippo gut microbiomes (Fig. 21.1B ) showed relatively consistent proportions of bacterial phyla Firmicutes (Bacillota), Bacteroidetes (Bacteroidota), and Proteobacteria (Pseudomonadota; see Chapter 18 for discussion of bacterial taxonomy). These phyla, especially Bacteroidetes, are known for breakdown of complex plant fibers into small organic molecules that the host animal can digest.
Microbiomes can be defined at various levels of scale—and they may interact with each other. How do hippo microbiomes interact with the river ecosystem (Fig. 21.2A)? In addition to analyzing the bacterial genomes, Dutton and Subalusky also amplified complementary DNA (cDNA) copies of the rRNA molecules present in ribosomes. Functional rRNA in ribosomes likely represents “active microbes”; that is, microbes actively metabolizing and thus contributing to their ecosystem at the time of sampling. The researchers aimed to focus on functioning members of a microbiome rather than those present only temporarily, outside their functional habitat.
FIGURE 21.2 ■ The hippopotamus gut microbiome influences the river microbiome. A. Hippos generate gut microbiomes and deposit feces in a pool, where deeper water becomes anoxic. Inset: Christopher Dutton (Yale University) and Amanda Subalusky (University of Florida) led the study. B. Active bacteria from the hippo gut microbiome show more taxa in
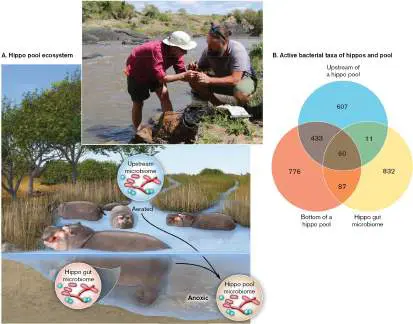
common with the bacteria in the hippo pool than with the water upstream (where hippos are absent).
Source: Christopher Dutton et al. 2021. Sci. Rep. 11 :23117.
CHRISTOPHER DUTTON
When the taxa of “active bacteria” were analyzed at the genus level, they were compared to microbiomes from the river water upstream of the hippos and in the anoxic pool water downstream. The Venn diagram in Figure 21.2B shows overlap between the various microbiomes sampled. Of the taxa identified by PCR, the hippo gut shared 87 taxa with the deep pool water but not water upstream, and it shared only 11 taxa uniquely with upstream water but not the deep pool water. This analysis implies that the hippos add bacteria to the river. Further experiments can test the prediction that hippo gut bacteria contribute to the river. These bacteria could help fish extract nutrients from land plants while also releasing minerals to benefit river algae. The discovery of actively growing bacteria shared by the hippo gut and the river—two very different habitats—argues for functional continuity in the hippo gut-river system.
Thought Question
21.1 In many ecosystems, the products released by one organism are used as food by another. Can you think of examples of microbes whose products are used by other organisms? Recall Chapter 13. Ecosystem complexity. Ecosystems are always more complex than any one experiment can show, and the techniques used in this hippo study have limitations. Only 16S rRNA sequences were amplified, thus restricting the target to bacteria. Few archaea would have been detected by this technique, and none of the eukaryotic microbes, whose 18S rRNA sequences are too different for amplification by the bacterial primers. Even among bacteria, many unknown species’ rRNA sequences escape amplification from a given primer set. And, of course, the SSU rRNA is just one gene—this study did not address the thousands of other genes of functional interest in the microbiomes. Besides adding taxa, what biochemical or metabolic functions do the hippo microbes have on the river? To answer these and other questions, experimental microbial ecology uses exciting methods that draw on state-of-the-art technologies, from chip devices and lasers to computational pipelines. These methods are introduced throughout our book, in earlier chapters as well as in this chapter; for reference, see Table 21.1. Experiments address:
Experimental
TABLE 21.1 Methods of Microbial
Ecology
Experimental method Description location Sample collection Chapter 21 Membrane filter Fig. 21.3 Diafiltration and flow filtration Fig. 16.38 Niskin bottle Fig. 21.7 Sequence omics Chapters 7, 8, 21 PCR amplicons eAppendix 3 SSU rRNA phylogeny Section 7.6; Fig. 17.15 rRNA of active microbes Fig. 21.1 Metagenomic DNA isolation Fig. 7.31 and sequencing Functional marker genes Figs. 21.4, 21.7 Heat map Fig. 21.4 Alignment and assembly Fig. 7.33
Experimental
TABLE 21.1 Methods of Microbial
Ecology
Experimental method Description location Metagenome-assembled Figs. 7.32, 21.5, 22.8, 22.9 genomes (MAGs)
Single-cell genomics Fig. ERA 7.4, 21.8 Metatranscriptomes Fig. 21.7, 21.30 Metabolomes Fig. 13.30 Proteomes Fig. 8.30 Visualization Chapters 2, 4, 21 Flow cytometry and sorting Figs. 4.20, 21.9 (FACS)
FISH, CARD-FISH Figs. 2.34, 21.10 CLASI-FISH Fig. 21.31 Culturing the uncultured Chapters 4, 21 Enrichment culture Figs. 21.10, 21.12 Environmental exposure Fig. 4.16 (iChip)
Continuous culture with Fig. 4.26 dilution to extinction Microfluidic culture Fig. 21.11 Antibiotic culture Fig. 21.25 Chemical imaging Chapter 2 SIMS, NanoSIMS Figs. 2.35, 17.6 Raman spectroscopy Fig. 17.6 Carbon isotope depletion Fig. 17.6, 17.7
Experimental
TABLE 21.1 Methods of Microbial
Ecology
Experimental method Description location Global cycles Chapter 22 FLUXNET tower Fig. 22.3 Biochemical oxygen demand Fig. 22.10 (BOD)
Who is there? What microbes inhabit a given environment or a human body part?
What are they doing? What function do the microbes contribute? Do they fix carbon, break down toxic waste, or produce antibiotics? Do they control behavior of their host? How do microbiomes vary under different conditions?
How do microbial communities change; that is, undergo succession? As the climate changes, what happens to the microbial community structure of forests, rivers, and coral reefs? Beyond the traditional realm of ecology, metagenomics is now transforming medical research. For instance, in 2019 an international consortium sequenced the metagenome of human intestinal microbiomes from 11,850 individuals distributed across six continents. The researchers found that individual gut microbiomes show distinctive profiles of species and subspecies. Many studies suggest that an understanding of individual microbiomes will help us design personalized therapies for conditions ranging from metabolic syndromes to neurological disorders. Increasingly, aspects of medicine are becoming microbial ecology.
Thought Question
21.2 When deciding how to study “active” microbiomes, what are the arguments for or against amplifying genomic DNA that encodes rRNA genes versus amplifying rRNA from functional ribosomes? Does cellular rRNA necessarily represent “active” microbes better than DNA sequence?
Note: Chapter 21 presents analysis of specific microbial
communities, the interactions between microbes and partner organisms, and the functional ecology of microbes. Chapter 22 presents the broader role of microbes in global nutrient cycles and climate change and the microbiology of human-built environments.
Finding the Microbes and Their Genes
The first problem of microbial ecology is how to find, identify, and count a habitat’s microorganisms. Finding and counting a habitat’s hippos might be straightforward, with the help of a helicopter. But even a microscope can miss the vast majority of a community’s microbes—such as the “virome” of harmless viruses in your blood plasma or the Candidate Phyla Radiation of numerous river bacteria (discovered by Jill Banfield’s lab) that passed through a 0.2-μm-pore-size filter.
Two kinds of approach are used—and, increasingly, complement each other in a single study: DNA or RNA sequencing of environmental samples. A habitat’s biological communities are processed immediately for DNA or RNA, which is sequenced directly.
Culturing the uncultured. Novel approaches to culture reveal surprising abundance of microbes undetected by direct DNA sequence. Culturing the uncultured is addressed in Section 21.2. Sampling an ecosystem. An ecosystem is too large and complex to analyze all of it. Therefore, we need to take samples. A sample is a small, defined portion of a population or ecosystem that represents the whole. The importance of samples was turned into a meme by the 2009 film Avatar, when the fictional ecologist Grace Augustine demands to “take samples” of mysterious electrogenic cells on the planet Pandora.
To represent the ecosystem, we must define a sample unit under consistent conditions of size, geographic position, temperature, season, and other factors important for the given study. Multiple samples are collected. A major challenge to sampling is the physical handling of samples. How do we contain, preserve, and store the samples while avoiding contaminants? Suppose the microbial community requires concentration or dilution to achieve a number of members capable of analysis (not too large, and not too small). The most common sample treatment is filtration through a sterile plastic membrane with pores smaller than the size of most bacteria (Fig. 21.3). For example, water from the river and hippo fecal samples was filtered through a polysulfone membrane with pore size 0.2 μm. Microbes collected upon the filter were then stored at −20°C (for longer-term storage, −80°C is preferable) for extraction of DNA and RNA. While 0.2 μm is a widely used pore size, it unfortunately fails to retain viruses, some bacterial spores, and a broadly diverse group of ultrasmall bacteria.
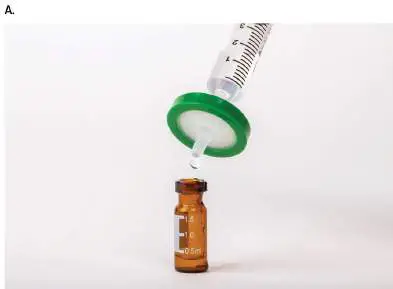
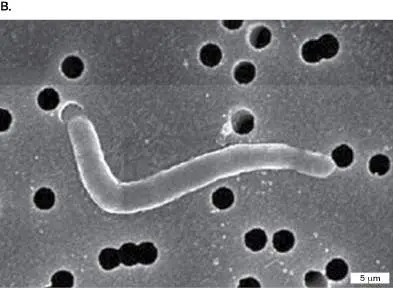
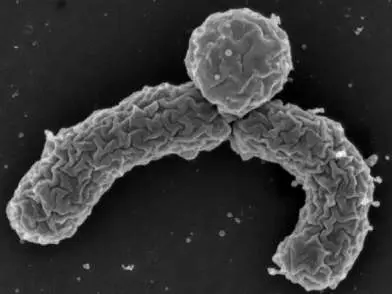
FIGURE 21.3 ■ Filtration concentrates microbes from a dilute environment. A. Sterile filter assembly, 0.2-μm pore size. B. Polycarbonate filter, 0.2-μm pore size, with caught bacterium, Hylemonella gracilis (SEM). Source: Chika Nnadozie et al. 2015. Biotechnol. Prog. 31 :853.
YDOGANAY21/SHUTTERSTOCK
C. F. NNADOZIE ET AL. 2015. BIOTECHNOL PROG. 31 :853–66
Another concern for sampling is that some kinds of cells lose viability when packed on a filter, and their biomolecules may decay before analysis is possible. For such systems, other kinds of filtration may be employed, such as diafiltration (a combination of dialysis and filtration) and flow filtration. Diafiltration and flow filtration were presented in Chapter 16 as tools to concentrate lentiviral vectors for gene therapy (see Fig. 16.38).
Within each microbiome sample, the taxa are identified on the basis of DNA or RNA sequences, and we can estimate overall sample diversity. To estimate diversity, we measure the proportions of taxa present. For example, in the hippo study, ten samples of hippo feces were obtained from separate sites at four different hippo pools. In this case, the ten samples showed statistically similar proportions of taxa. A much larger number of samples can be modeled to estimate the degree of diversity that is missed. Such analysis generates a “rarefaction curve.” An example of a rarefaction curve is the repeated sampling of one species to model its pangenome and core genome (see Fig. 17.31).
The challenges of “representation” in sampling are often underestimated. Representative samples imply some degree of repeatability or uniformity across an ecosystem. Perfect representation is impossible; for instance, every cubic centimeter of soil might possess unique strains of microbe found nowhere else in the soil microbiome. We must estimate the sample diversity —the degree of “difference” across the sample’s microbial taxa—as well as the diversity among samples and throughout the ecosystem.
Even defining the quantity of diversity is not absolute. Alpha diversity is defined as the “species richness”; that is, the average number of different species in samples on a “local” scale. What defines a “local” scale of a project depends on the researcher’s characterization of the project. Another component of diversity is “species evenness”; that is, the degree of uniformity of population number for each species in an ecosystem. Various equations are used to designate a “diversity index” accounting for a balance of species richness and evenness. For example, the Shannon index of diversity sums the proportions of each species in a community, each multiplied by the natural logarithm of the proportion. Various diversity equations have been defined on the basis of different assumptions about the relative importance of factors in a given study.
Thought Question
21.3 How important is the “species evenness” for assessing sample diversity? For example, does it matter if a sample contains ten species at 10% of the sample each, versus a sample that contains 99% of one species plus a 1% mixture of nine species? Answer this question by considering examples of specific habitats and the possibility of environmental change.
Metagenomes. How can we learn the function of microbes that we cannot yet culture? In 1998, Jo Handelsman and colleagues, then at the University of Wisconsin–Madison, first analyzed DNA from a soil microbial community. Such DNA consists of fragments from a mixture of species and was previously thought impossible to interpret. Surprisingly, it proved possible to assemble overlapping sequences, called reads, into genes and partial genomes from some microbial species. Handelsman coined the term metagenome to refer to the DNA sequence obtained directly from a mixture of genomes. Today, metagenomes are sequenced from many kinds of microbiomes using next-generation sequencing (NGS) technologies such as Illumina (discussed in Chapter 7) and long-read sequencing of DNA and RNA. Researchers deploy increasingly sophisticated tools that probe metagenomes, metatranscriptomes, and single-cell genomes, as well as whole-cell protein populations (proteomes) and metabolic capabilities (metabolomes). These tools, and others, are known informally as omics (for the common suffix of genome-based terms). Metagenomic sequencing poses challenges far beyond those of sequencing a single intact genome (see Fig. 7.31). The first decision is to define a target community from which to obtain DNA. The DNA must then be isolated by biochemical extraction methods that, as far as possible, maintain the sample’s original taxa proportions. One approach is to extract in parallel the DNA of a “mock community,” an artificially assembled mixture of known taxa, in order to see whether the known taxa proportions are maintained after sequencing the extraction product.
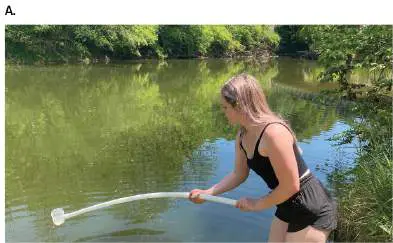
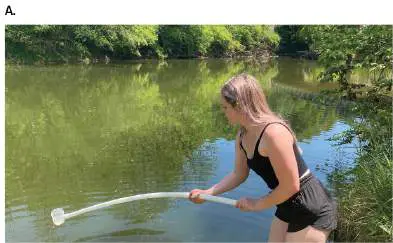
The sequence of a metagenome includes millions of short reads that represent a community of microbial genomes, including genes of all functions. Thus, the reads can be used to answer all kinds of questions about microbial capabilities. For example, undergraduate student April Murphy at Kenyon College asked a question about antibiotic resistance genes (ARGs) in the microbiome of a river in rural Ohio (Fig. 21.4). The presence of ARGs in environmental bacteria is a medical concern of global importance, as it warns us of the potential for humans to acquire drug-resistant bacterial infections in seemingly safe places. Many studies track ARGs in both natural and human-associated microbiomes. Murphy tested the presence of ARGs in metagenomes from river bacteria sampled upstream (“Up,” Fig. 21.4B ) and 6 km downstream (“Down”) of the effluent pipe of a wastewater treatment plant (“Mid”). Water samples were filtered (pore size 0.22 μm), and the microbes retained by the filter were extracted for DNA. The DNA was sequenced via Illumina sequencing by synthesis, generating 150-bp reads (a method presented in eAppendix 3).
FIGURE 21.4 ■ River sampling for antibiotic resistance genes (ARGs). A. April Murphy, undergraduate at Kenyon College, samples river water for metagenomic analysis. B.
Samples were obtained upstream (“Up”), midstream (near wastewater plant effluent; “Mid”), and 6 km downstream of the wastewater plant (“Down”). ARGs were identified from marker sequences found in river DNA reads. Yellow indicates a high
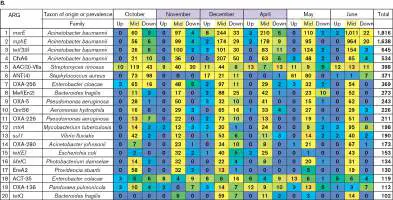
number of ARG read hits; blue indicates a low number. Violet shade indicates sample dates when wastewater effluent entered the river without chlorination. Source: April Murphy et al. 2021. Microbiol. Spectr. 9 :e00941-21.
JOAN SLONCZEWSKI
The read sequences from river bacteria were then aligned to ARG marker sequences by the ShortBRED computational pipeline. The marker sequences were obtained from the Comprehensive Antibiotic Resistance Database. This database compiles genes known to confer antibiotic resistance, encoding proteins such as beta-lactamase (cleaves the beta-lactam ring of penicillins; discussed in Chapter 27). The ShortBRED marker set was derived from Comprehensive Antibiotic Resistance Database sequences by computational translation to peptides, which were then tested against the UniProt database of all publicly available proteins. The only markers kept were those that matched a known ARG but failed to match all the other proteins known in UniProt. This process yielded a marker set of peptides highly specific to antibiotic resistance genes.
The ShortBRED alignment records the number of “hits” of sample reads against each marker in the ARG marker set. Murphy presented the hit numbers in a heat map (Fig. 21.4B ), representing data values as a range of colors to allow a visual grasp of trends. In Murphy’s heat map, yellow indicates high numbers of reads that hit an ARG marker, whereas blue represents lower numbers or zero. The 20 top-ranked total ARG numbers are shown for the three river sites on six different dates. The heat map shows that for each ARG, the highest hit numbers (the most yellow) appear at the “Mid” site, where the wastewater effluent pipe enters the river. These data suggest that the wastewater effluent may be depositing antibiotic-resistant bacteria in the river. The four top-ranked hits are genes associated with Acinetobacter baumannii, an opportunistic pathogen that is commonly found in environmental communities. These genes could be carried by A. baumannii or by other bacteria that received the genes by horizontal transfer (discussed in Chapter 9).
What is less clear is the fate of ARGs downstream. Do the ARGs (or the bacteria carrying these genes) disappear from the river, outcompeted by indigenous microbes, or do they persist in the microbiome? Addressing this question requires a statistical test: We can test whether the hit numbers of given ARGs are greater downstream than they are upstream of the plant.
Nonparametric statistics. Evidence for an environmental relationship requires a statistical test to show significance. However, the question of ARG persistence downstream is complicated by several factors. First, there are multiple ARGs to consider. Some of them may be linked; for example, the top three ARGs— msrE, mphE (macrolide resistance), and tet(39) (tetracycline resistance)— commonly occur together on a multidrug resistance plasmid. And then, for environmental data, there are multiple unknown factors, such as the weather on a given date or the presence of other input sources.
For these reasons, environmental data rarely provide true “replicate” trials, and the results tend not to follow a normal distribution (the bell curve). So, our statistical test must exclude the requirement for normality. Tests that do not require a normal distribution of replicate trials are called nonparametric.
Nonparametric tests are valid even for data distributions that are skewed (asymmetric).
A simple example of a nonparametric test is called the sign test. We can use the sign test to ask whether the top three Acinetobacter ARGs show a significant increase in abundance downstream (“Down”) from the wastewater effluent, as compared to upstream (“Up”). This test does not require any particular distribution of data; rather, it requires only the sign of the difference (“Down” minus “Up”) for each ARG on each sample date. For example, in October, for msrE the “Down” site showed 5 hits minus 0 hits upstream; that is, a difference with positive sign. Of the top three genes [msrE, mphE, tet(39)], which were each tested on six dates, 17 sign tests showed a positive difference and none showed a negative difference. That is equivalent to a coin toss coming up heads 17 times in a binomial distribution. The probability of the null hypothesis (no difference upstream versus downstream) is given by P = 0.000008. This very small P value means we have high confidence that the ARG persistence downstream is greater than that predicted by chance. Further experiments would need to test whether the ARGs downstream actually come from the wastewater.
Computational pipelines and nonparametric statistics are essential aspects of experimental ecology and environmental studies. For this reason, courses in computing and statistics are recommended to students planning to enter these fields. In addition, research teams often employ specialists in these areas.
Thought Question
21.4 In Figure 21.4B , how can we know if the ARGs showing increased abundance downstream actually came from the wastewater plant? What other experiments might strengthen this conclusion? Assembling partial genomes. A different approach to the metagenome is to assemble partial genomes representing individual taxa. Such partial genomes are called metagenome-assembled genomes (MAGs). Partial genomes offer a much more detailed view of community functions, including whole operons and genome-wide combinations of metabolic pathways. As described in Section 7.6, MAG construction requires a computational pipeline that assembles reads of overlapping sequence (contigs) into scaffolds of contigs matched to reference genomes of known bacterial families.
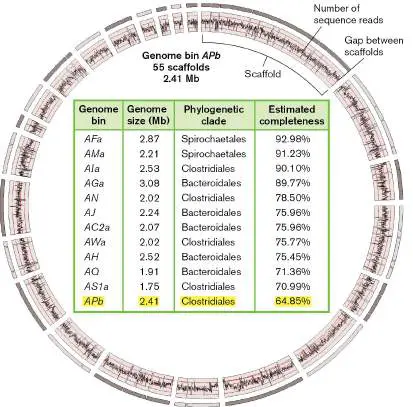
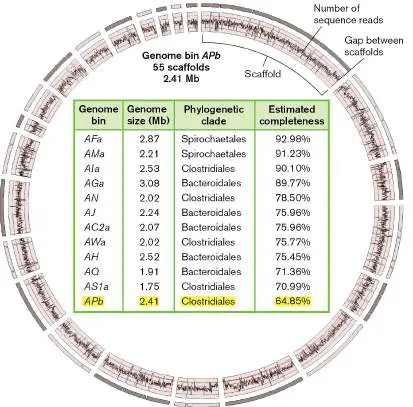
An example of partial genome construction is the rumen microbiome of a cow, a highly diverse community sequenced by Matthias Hess and colleagues at the Joint Genome Institute. Hess’s study yielded 15 partial genomes ranging from 60% to 93% estimated completeness; 12 are listed in Figure 21.5. The completeness of each MAG was estimated from the number of “core genes” identified. Core genes are defined as those genes found in nearly all members of a given taxonomic clade, such as the order Clostridiales for the group of genomes (genome bin) APb (highlighted row in Fig. 21.5). The fraction of the core genes found, divided by those expected for the order, gives an estimate of completeness of the genome sequence.
FIGURE 21.5 ■ Partial genomes assembled from a cow rumen microbiome. Map of genome bin APb (order Clostridiales) showing assembled scaffolds. Inner rings indicate fold coverage (number of sequence reads) backward and forward; red lines indicate 25-fold coverage. Center: Genome bins were matched to clades by comparison with reference sequences.
Source: Modified from Matthias Hess et al. 2011. Science 331 :463. Since 2020, the Oxford Nanopore long-read sequencing technology (see eAppendix 3) has greatly increased the quality of MAGs by eliminating most of the gaps, attaining genomes closer to the quality of single-cell genomes. For example, Ami Bhatt’s lab group at Stanford University obtained single-contig closed circular genomes from human fecal metagenomes.
The MAGs that Hess found, however, account for only a tiny fraction of the species present out of 268 gigabases (billions of base pairs) sequenced. Each partial genome assembled from the rumen community represents a bin; that is, a set of sequence reads that are from closely related members of one taxonomic unit and which show a given level of similarity. Because no two individual organisms possess exactly the same sequence, the investigator must decide how much difference to allow in defining a taxon. Binning, the sorting of sequences into taxonomic bins, requires further computational analysis. Factors for computation may include, for example, similarity of base composition and similarity to reference database sequences. Figure 21.5shows an example of a binned partial genome, APb, as a ring composed of scaffolds matched to a Clostridiales reference genome. Between the scaffolds, there remain unsequenced gaps. In the wheel, the jagged trace represents the degree of coverage; that is, the number of sequence reads that cover a given region. Multiple copies of overlapped sequence represent a reliable assembly; typically, 30-fold coverage is considered good. But the remainder of the rumen sequences are unattached scaffolds and single-copy reads out of thousands of unknown genomes. These unattached sequences encode tens of thousands of novel enzymes for carbohydrate digestion, and they are of great interest to the biofuel industry. Note that metagenome sequencing is limited by the challenge of assigning DNA sequence reads correctly to their shared genomes. An arbitrary maximum of sequence divergence must be specified; in effect, all MAGs are composite genomes representing multiple divergent individuals. All computational pipelines must choose assumptions about binning, sequence gaps, and other sequence characteristics. For this reason, different pipelines often predict different partial genomes.
Thought Question
21.5 Suppose you plan to sequence a marine metagenome for the purpose of understanding carbon dioxide fixation and release, to improve our model for global climate change. Do you focus your resources on assembling as many complete genomes as possible, or do you focus on identifying all the community’s enzymes of carbon metabolism?
Multiple Omics Analysis: The Deepwater Horizon Spill
An ecosystem is complicated enough; but what happens when it changes? An inadvertent “experiment” on microbial community dynamics occurred in 2010 with the Deepwater Horizon oil well blowout, which released 4 million barrels of oil into the Gulf of Mexico (Fig. 21.6A). This event amounted to a giant enrichment culture. In enrichment culture, the addition of a particular class of nutrient favors the growth of microbes that can use that nutrient. (The enrichment in this case was inadvertent.) Over the months that followed, several research groups studied the succession, or change in community structure, of the marine microbes following this amendment (addition of an organic nutrient, petroleum). How would the petroleum affect the distribution of species? Would petroleum-induced succession alter the species diversity? Would petroleum consumers undergo positive selection—enough to help clean up? To address these questions, researchers combined clues from multiple omics, including rRNA amplicons, metagenomes, metatranscriptomes, and single-cell genome sequencing.
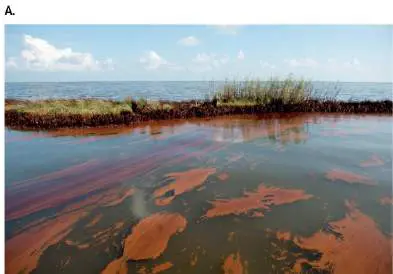
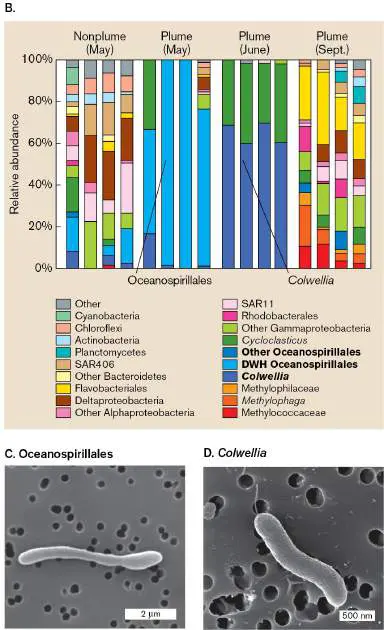
FIGURE 21.6 ■ Succession of bacterial community following the Deepwater Horizon oil spill. A. Petroleum from the Deepwater Horizon oil well blowout in April 2010 contaminated the Louisiana coast. B. Bacterial relative abundance in 16S rRNA genome libraries. C. Oceanospirillales, an order of bacteria whose DNA was found in oil-contaminated water in May (SEM). D. Colwellia bacteria dominated the oil-contaminated water in June (SEM). Samples were obtained from the plume of oil spreading through seawater and from nonplume seawater. During May and June, major taxa shifted to oil-consuming Oceanospirillales and Colwellia. By September, after bacteria had consumed much of the oil, the taxon distribution appeared more similar to that before the oil spill. Source: Part B modified from Molly C. Redmond and David L. Valentine. 2012. PNAS 109:20292–97.
SAUL LOEB/AFP/GETTY IMAGES
Y. CAO ET AL. 2014. APPL. ENVIRON. MICROBIOL. 80 :54–60
J. BAELUM ET AL. 2012. ENVIRON. MICROBIOL. 14 :2405–16
Preliminary assessment of diversity. During several months that followed the Deepwater Horizon spill, Molly Redmond and David Valentine from UC Santa Barbara investigated the bacterial community response to the influx of petroleum from the wellhead. They conducted a preliminary survey of the microbial community, comparing 16S rRNA gene sequences from water contaminated by the plume of oil rising at the site of the leak and from uncontaminated Gulf of Mexico seawater. The rRNA amplicon sequences were assigned taxa by homology.
For different times after the spill, the relative abundance of various marine taxa is shown in Figure 21.6B . A sample of nonplume (uncontaminated) water, taken in May, showed a broad range of diverse taxa, including Proteobacteria, Cyanobacteria, and Bacteroidetes. By contrast, samples of oil-contaminated water taken in May and again in June showed a marked shift to particular taxa, such as the genus Colwellia (Fig. 21.6D ; dark blue bars in Fig. 21.6B ), a benthic gammaproteobacterium named for marine microbiologist Rita Colwell (see Section 21.5). Colwellia is known to catabolize propane and benzene, which are components of petroleum and natural gas. Also found was a novel clade of Oceanospirillales ( Fig. 21.6C ; bright blue bars in Fig. 21.6B ) with unknown metabolic potential.
Where did the oil-metabolizing bacteria come from? They were minority components of the community, present because of the natural seepage of petroleum from marine sediment throughout the Gulf of Mexico. The sudden influx of high levels of petroleum initiated a bloom of microbes capable of catabolizing certain components, particularly those easiest to degrade, such as alkanes (saturated hydrocarbons). By September, when the more rapidly degradable molecules had dissipated, the range of diversity had been partly restored toward that of the uncontaminated Gulf of Mexico seawater.
Thought Question
21.6 Could you design a metagenome experiment analogous to the oil plume experiment to test which kinds of human gut bacteria digest a certain food, such as hamburger meat? What follow-up experiments would be needed?
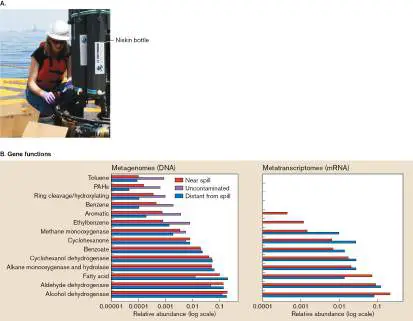
Metagenomes. Which of the marine bacteria in the oil-contaminated community actually possessed the ability to degrade petroleum? The results are expected to be complex, because the community comprises numerous species, and petroleum includes many kinds of molecules, ranging from short-chain and long-chain alkanes to aromatic rings, including polycyclic molecules. The marine metagenomes were analyzed by Olivia Mason and Terry Hazen and their colleagues at the Lawrence Berkeley National Laboratory (LBNL). Mason compared Illumina DNA sequencing reads from marine DNA samples taken from water at three different sites: near the oil well blowout, distant from the blowout but still containing measurable contamination, and untouched by the spill (uncontaminated). Mason’s team performed functional analysis to identify genes encoding enzymes known to participate in hydrocarbon degradation (Fig. 21.7B ).
FIGURE 21.7 ■ Deepwater Horizon: bacteria show hydrocarbon catabolism enzymes. A. Olivia Mason operates a rosette of Niskin bottles for marine water sampling. B.
Metagenomes from the oil-contaminated plume reveal genes associated with hydrocarbon degradation. Metatranscriptomes reveal mRNA transcripts encoding enzymes for hydrocarbon degradation. PAHs = polycyclic aromatic hydrocarbons.
Source: Part B modified from O. U. Mason et al. 2012. ISME J. 6 :1715, figs. 3
and 4.
COURTESY OF OLIVIA MASON
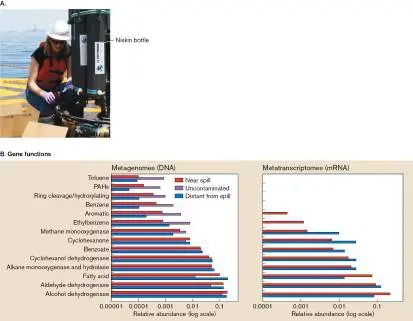
The DNA reads from metagenome sequencing were compared for similarity to sequences from the GeoChip database of proteins involved in hydrocarbon degradation. Of particular interest were enzymes called alkane monooxygenases; that is, enzymes that incorporate oxygen to yield alcohols, which are later degraded to aldehydes and fatty acids. Aromatic-degrading enzymes were also detected in the metagenomes. These enzymes are of interest because they lead to pathways ultimately degrading alkanes and aromatics into acetyl-CoA that enters the tricarboxylic acid (TCA) cycle, ultimately releasing CO 2 (discussed in Chapter 13). Figure 21.7shows that naturally occurring bacteria in the water of the Gulf of Mexico possess DNA encoding enzymes that degrade and remove many petroleum constituents. Note, however, that the aromatic-degrading enzymes showed less enrichment than that for the alkane-degrading enzymes; for example, the enzymes for degradation of toluene and polycyclic aromatic hydrocarbons (PAHs) actually showed lower prevalence in the contaminated samples (red and blue bars in Fig. 21.7B ) than in the samples from uncontaminated water (purple bars). This finding is important because aromatic contaminants are known to decay more slowly than alkanes and to persist for longer times in marine sediment. Functional analysis requires the existence of a database of genes known to encode products of given function in other studied organisms. No single method works best to ensure that we recognize all the actual genes encoding functional products—or that we don’t mistakenly define some noncoding sequences as genes (false positives). Many bioinformatic tools are used to “call” genes, on the basis of gene structure and homology—a process known as annotation (discussed in Section 9.5).
Note that all gene-calling (annotation) approaches are incomplete because they miss truly novel genes for which no homologs or motifs exist in the databases. Furthermore, the presence of a sequence in a genome does not prove that the organism actually performs a given function. How do we know which of the genes present in metagenomes are actually expressed by the target community? Metatranscriptomes. Beyond the DNA, we can sample the RNA pools of a community. Metatranscriptomics is the study of the RNA transcripts (using a high-throughput sequencing method known as RNAseq) obtained from an environmental community. The “metatranscriptome” gives a snapshot of gene expression activity of a community at a given point in time.
For the Deepwater Horizon samples, Mason’s team observed the metatranscriptomes of samples taken near to or distant from the contamination site (Fig. 21.7B ). The metatranscriptomes show the presence of ample RNA-encoding enzymes that degrade alkanes. Yet there is little sign of the monooxygenases needed for degradation of aromatic substrates such as toluene or benzene. This finding is of concern for the marine environment, indicating that, without biodegradation, aromatic contaminants from the oil spill are likely to persist for extended times.
Which kinds of bacteria or archaea are conducting most of the hydrocarbon degradation? Mason’s metagenomes from contaminated water showed a high prevalence of Oceanospirillales, one of the taxa reported also by Redmond and Valentine. The metatranscriptomes also showed a high prevalence of 16S rRNA from Oceanospirillales. So, Mason sought to identify individual cells representing this taxon and investigate whether the organism actually possesses full pathways for hydrocarbon biodegradation.
Single-cell genome sequencing. A modification of metagenomic analysis is that of single-cell genome sequencing (described in Section 7.6). Single-cell analysis was first developed by the Bigelow Laboratory for Ocean Sciences, Maine. For single-cell analysis, we must isolate single cells from a microbial community (Fig. 21.8). This remarkable feat is most commonly performed by fluorescence-activated cell sorting (FACS; see Section 21.2) using a reversible DNA-binding dye such as SYBR Green. The DNA from a single cell is then amplified by a special non-PCR process called multiple displacement amplification (MDA). In MDA, unlike PCR, only the template is amplified, without multiple rounds. Amplification is performed with a highly accurate DNA polymerase that requires no species-specific primer.
FIGURE 21.8 ■ Single-cell sequence of Oceanospirillales allows reconstruction of metabolic map. Gene functions were identified by comparison with annotated functional genes in public databases.
Source: Modified from O. U. Mason et al. 2012. ISME J. 6 :1715, fig. 5. The MDA-amplified genome is then sequenced by Illumina and assembled as a single genome. Thus, in single-cell sequencing, multiple genomes from a community can be isolated and assembled separately, without needing to sort out a polymicrobial mixture of DNA or to obtain a pure culture in the laboratory.
Mason’s team used FACS to isolate two independent cells of the Oceanospirillales clade. The genomes of each cell were assembled, revealing genes known to encode enzymes of metabolic pathways and substrate transporters (Fig. 21.8). For example, a full degradation pathway was found for cyclohexane (a cyclic alkane). Alkanes are ultimately degraded to CO 2 via the TCA cycle (discussed in Chapter 13). Most of the genes found are also present in the metatranscriptome, the collection of all RNA transcripts sequenced from the seawater microbiome. This finding supports the hypothesis
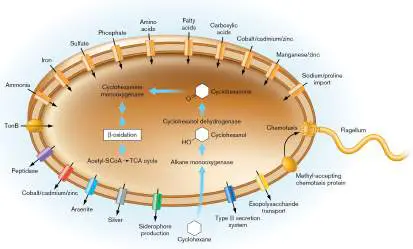
that Oceanospirillales is a dominant clade of bacteria capable of conducting early degradation of petroleum components in the Gulf of Mexico seawater samples.
Note, however, that DNA analysis never shows that the organisms actually perform the metabolism or other functions predicted by their genes. Genomic predictions of a phenotype must be confirmed by physiology and biochemistry; for example, by isotope labeling. Additional examples are discussed in Section 21.2.
Thought Question
21.7 How could you determine whether an organism actually performs the functions predicted by your analysis of its genome and transcriptome, such as metabolizing petroleum components?
To Summarize
A microbial community is the sum of populations of all taxa in a given ecosystem. The community may be any natural or human-made environment or a microbiome (host-associated microbes) of a plant or animal.
Samples are obtained from a target community of a defined environment. Sampling requires separating the microbes from their physical environment, breaking open the cells, and purifying the DNA.
Statistical tests can predict a relationship between microbial samples and their environment. Further experiments can test the prediction.
Species diversity of a community can be assessed by SSU rRNA amplification.
Succession refers to change over time in a community or microbiome.
A metagenome is the sum total of all DNA sequenced from a microbial community. Genes and their functions are predicted by annotation.
Functional gene information is obtained from read hits to marker genes. Functional data offers clues to the ecological contributions of microbes.
Metagenome-assembled genomes (MAGs) may be assembled from short reads. Assembly requires a computational pipeline that incorporates mathematical tools and biological assumptions.
A metatranscriptome is the sum of all RNA transcripts from a microbial community.
Single-cell genome analyses reveal coordinated function of genes within one microorganism.
Glossary
ecosystem A community of species plus their environment (habitat). population A group of individuals of one species living in a common location. community The sum of all populations of organisms interacting within an ecosystem.
microbiota or microbiome The total community of microbes associated with an organism (such as the human body) or with a defined habitat (such as soil or plants).
microbiota or microbiome The total community of microbes associated with an organism (such as the human body) or with a defined habitat (such as soil or plants).
amplicon A specific PCR product in which a small DNA sequence is amplified (many copies are synthesized).
sample In ecology, a small, defined portion of a population or ecosystem that represents the whole.
diversity A measure of the genetic differences across the taxa of a microbial community.
alpha diversity The species richness, as measured by the average number of different species in a number of samples from a specific community.
read A short DNA sequence that is generated by shotgun or next-generation sequencing methods.
metagenome The sum of genomes of all members of a community of organisms.
omics Analytical tools that probe community samples at the molecular level (metagenomes, metatranscriptomes, and single-cell genomes), as well as whole-cell protein populations (proteomes). Examples include genomics, metagenomics, metatranscriptomics, and proteomics.
target community A community whose genomes are sequenced for metagenomic analysis.
marker sequence A short sequence of base pairs or of amino acid residues that is found specifically in one class of genes or proteins but absent from other known genes or proteins.
heat map A graph that represents data values as a range of colors to allow a visual grasp of trends.
nonparametric Describes statistical tests that do not require a normal distribution of replicate trials.
bin A set of sequences composed from metagenomic DNA reads showing a given level of similarity; each bin defines an operational taxonomic unit.
binning The sorting of metagenomic sequences into taxonomic bins. enrichment culture The use of selective growth media to allow only certain microbes to grow.
succession Change of species composition over time in a community or microbiome.
metatranscriptomics The study of all the RNA transcripts expressed by members of a community, known as a metatranscriptome.
Fig. 7.29
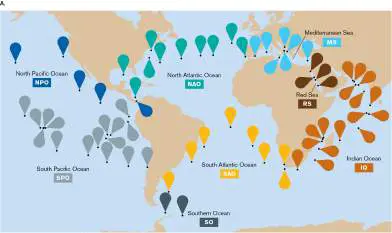
FIGURE 7.29 ■ Metagenome of the ocean’s surface. A. The sampling locations in Shinichi Sunagawa’s study. B. Fractional composition of taxa and functional gene categories for each sample (each column is one sample). Sampling locations are indicated by the color bar above the plots; refer to panel (A) for general location. Source: Modified from Shinichi Sunagawa et al. 2015. Science 348 :6237, figs. 1A (part A) and 8A (part B). Fig. 21.3
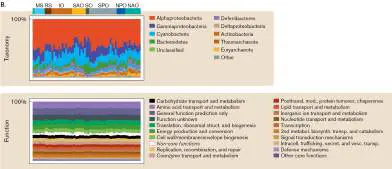
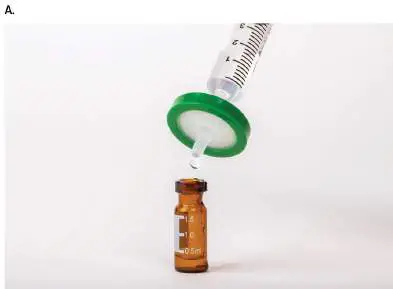
FIGURE 21.3 ■ Filtration concentrates microbes from a dilute environment. A. Sterile filter assembly, 0.2-μm pore size. B. Polycarbonate filter, 0.2-μm pore size, with caught bacterium, Hylemonella gracilis (SEM). Source: Chika Nnadozie et al. 2015. Biotechnol. Prog. 31 :853.
Fig. 16.38
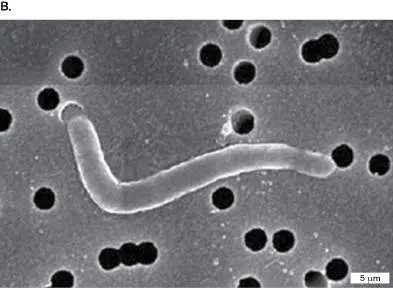
FIGURE 16.38 ■ Commercial production of a CAR-T lentivector. The HEK293T host cells undergo cell expansion (culture growth) for 10 days. The cultured cells are transfected with the four plasmids of CAR-T lentivector (see Fig. 16.38). Media exchange enables harvest of large quantities of lentivector. The lentivector suspension is filtered to remove cell debris. The product is stored at −70°C. Source: Modified from B. L. Levine et al. 2017. Mol. Ther. Methods Clin. Dev.
4 :92–101, fig. 3.
Fig. 21.7
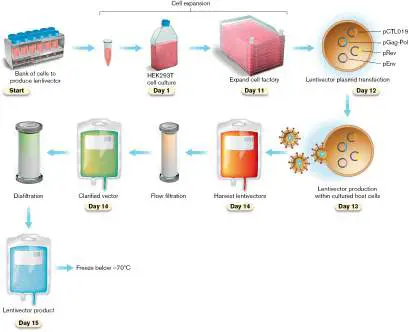
FIGURE 21.7 ■ Deepwater Horizon: bacteria show hydrocarbon catabolism enzymes. A. Olivia Mason operates a rosette of Niskin bottles for marine water sampling. B. Metagenomes from the oil-contaminated plume reveal genes associated with hydrocarbon degradation. Metatranscriptomes reveal mRNA transcripts encoding enzymes for hydrocarbon degradation. PAHs = polycyclic aromatic hydrocarbons.
Source: Part B modified from O. U. Mason et al. 2012. ISME J. 6 :1715,
figs. 3 and 4.
COURTESY OF OLIVIA MASON
Fig. 21.1
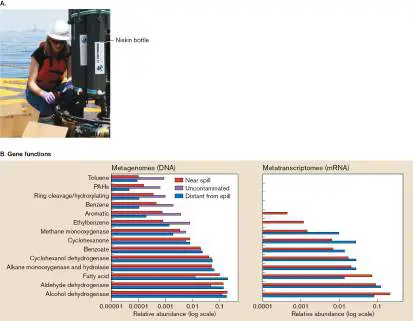
FIGURE 21.1 ■ Every ecosystem includes microbes. A. Hippopotamuses (hippos), the plants and animals they feed on, and the water all contain microbes. Ngorongoro crater, Tanzania. Inset: Hippo feces released into water. B. Gut microbiomes sampled from feces of individual hippos in the Mara River in Tanzania show consistent proportions of
Firmicutes, Bacteroidetes, and Proteobacteria. Data are from 16S ribosomal RNA (rRNA) reverse transcription and polymerase chain reaction (PCR) amplification, representing metabolically active bacteria.
Source: Christopher Dutton et al. 2021. Sci. Rep. 11 :23117.
ANDERS BOESEN/ALAMY STOCK PHOTO
BIGBOOM/SHUTTERSTOCK
Fig. 7.31
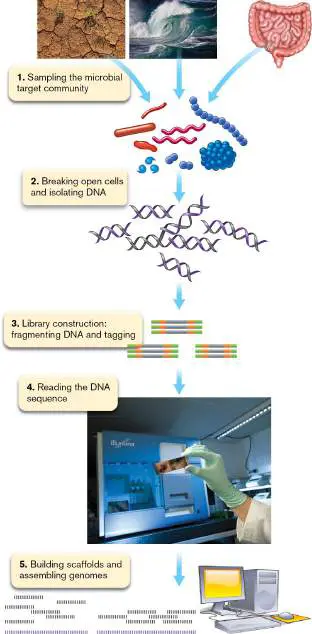
FIGURE 7.31 ■ Sequencing a metagenome. First, select a target community to sample from a habitat such as soil, water, or host plant or animal. Remove the sampled microbes from their environment (step 1) and stabilize the content. Lyse the cells and isolate pure, intact DNA (step 2). Amplify the DNA library by constructing fragments with tagged ends (step 3). Read the DNA sequence using a next-generation sequencing (NGS) sequencer (step 4). Use a computational software pipeline to build scaffolds and assemble genomes (step 5). Source: John Wooley et al. 2010. PLoS Comput. Biol. 6:e1000667.
FLPA/SHUTTERSTOCK
PHOTOBRET 2014/SHUTTERSTOCK
IMAGE BROKER/ALAMY STOCK PHOTO
Fig. 21.4 FIGURE 21.4 ■ River sampling for antibiotic resistance genes (ARGs). A. April Murphy, undergraduate at Kenyon College, samples river water for metagenomic
analysis. B. Samples were obtained upstream (“Up”), midstream (near wastewater plant effluent; “Mid”), and 6 km downstream of the wastewater plant (“Down”). ARGs were identified from marker sequences found in river DNA reads. Yellow indicates a high number of ARG read hits; blue indicates a low number. Violet shade indicates sample dates when wastewater effluent entered the river without chlorination. Source: April Murphy et al. 2021. Microbiol. Spectr. 9 :e00941-21.
Fig. 7.33
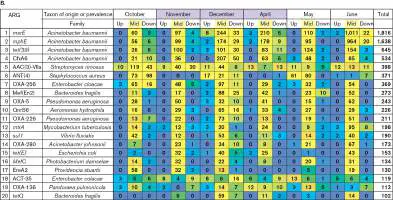
FIGURE 7.33 ■ Assembling reads on the basis of de Bruijn graph computation. A given DNA sequence generates many short fragments of defined length, called k-mers. All k-mers found are linked by their overlapping ends. Repeated k-mers cannot be distinguished, so the de Bruijn graph collapses them with overlapping connections. To reveal the sequence that produced the fragments, find a path that
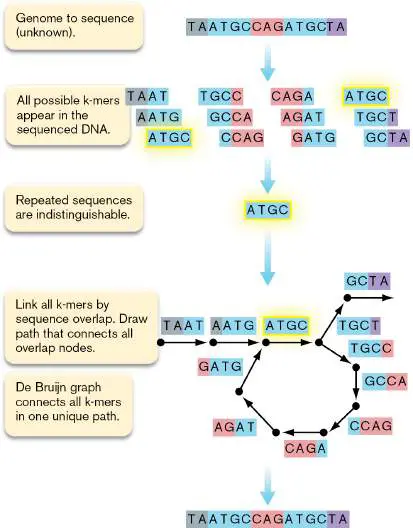
passes through every k-mer exactly once. That path generates the original sequence of base pairs.
Fig. ERA 7.4 FIGURE ERA 7.4 ■ Preparation of a library of single-amplified genomes (SAGs). Random, single cells of the microbial community within the mouse feces were encapsulated into agarose gel droplets. Cells within the beads were lysed, and the trapped genomic DNA (gDNA) was subjected to whole-genome amplification (WGA). Beads with amplified DNA were distinguished by greater fluorescence of a DNA-staining fluorophore (green background) and were sorted by flow cytometry into individual wells of a microtiter plate. Fig. 21.8
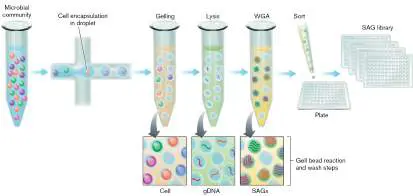
FIGURE 21.8 ■ Single-cell sequence of Oceanospirillales allows reconstruction of metabolic map. Gene functions were identified by comparison with annotated functional genes in public databases.
Source: Modified from O. U. Mason et al. 2012. ISME J. 6 :1715, fig. 5. Fig. 21.7
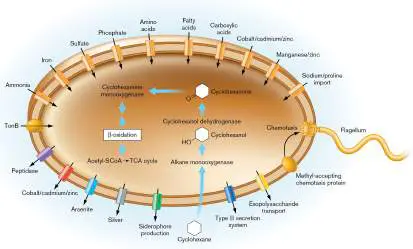
FIGURE 21.7 ■ Deepwater Horizon: bacteria show hydrocarbon catabolism enzymes. A. Olivia Mason operates a rosette of Niskin bottles for marine water sampling. B. Metagenomes from the oil-contaminated plume reveal genes associated with hydrocarbon degradation. Metatranscriptomes reveal mRNA transcripts encoding enzymes for hydrocarbon degradation. PAHs = polycyclic aromatic hydrocarbons.
Source: Part B modified from O. U. Mason et al. 2012. ISME J. 6 :1715,
figs. 3 and 4.
COURTESY OF OLIVIA MASON
21.30
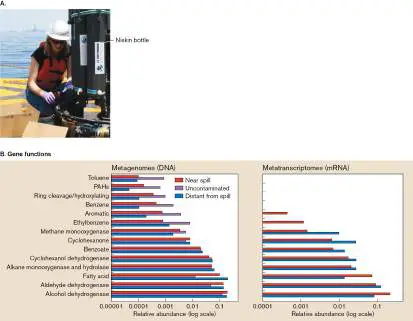
FIGURE 21.30 ■ Genes expressed in a marine microbial community. Expression of each gene is measured as RNA (copied to cDNA), divided by the gene’s relative abundance in the metagenome. The y -axis represents the ratio of cDNA to metagenomic DNA for all expressed genes, plotted in rank order (from highest to lowest). The relative abundance of the DNA sequence within the metagenome is color-coded. The genes most highly expressed tend to be rarest in the genome (colored red).
Source: Jorge Frias-Lopez et al. 2008. PNAS 105 :3805. Fig. 13.30
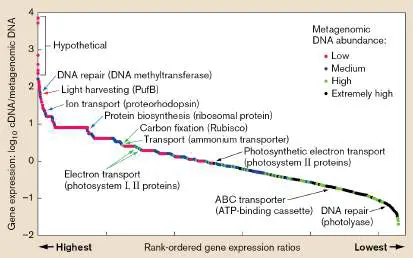
FIGURE 13.30 ■ A metabolomics pipeline for metabolites of gut microorganisms. A. A reference library of metabolites and their spectral data enables identification of microbial products. B. Unknown isolated products are analyzed by tandem mass spectroscopy. The first stage of mass spectroscopy (MS1) reveals the molecular mass of the major ion (most abundant part of the molecule). The second stage (MS/MS) measures the mass of various ions from breakdown of the peak ion in the primary spectrum, and it then compares the breakdown pattern with reference spectra. The proposed molecule is then tested for function in various organisms cultured from the gut.
S. HAN ET AL. 2021. NATURE 595: 415–420
S. HAN ET AL. 2021. NATURE 595: 415–420
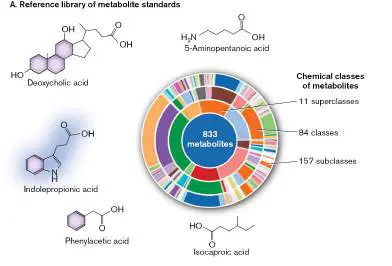
Fig. 8.30
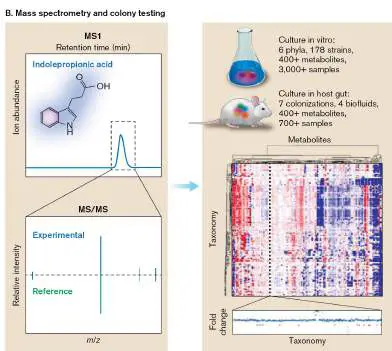
FIGURE 8.30 ■ Identifying proteins directly from whole-cell extracts by mass spectrometry. Proteins extracted from a bacterial culture are digested into peptides with trypsin. The peptides are separated by column chromatography and analyzed by mass spectrometry (here by the Thermo Scientific Q Exactive hybrid quadrupole-Orbitrap mass spectrometer). In tandem mass spectrometry (MS-MS),
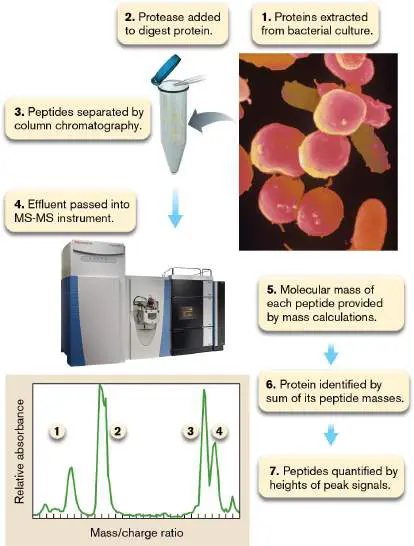
the mass of each peptide is determined first (peaks 1−4 in the graph), and then selected peptides are subjected to additional fragmentation by ion spray (not shown). Each resulting peptide fragment will differ in size by one or more amino acids. Knowing the mass of each amino acid and the masses of the different peptide fragments enables extrapolation of the original peptide’s sequence.
COURTESY OF THERMO FISHER SCIENTIFIC
SIMKO/VISUALS UNLIMITED, INC.
Fig. 21.31 FIGURE 21.31 ■ Marine biofilms on plastic particles, imaged with CLASI-FISH. Polyethylene pieces were incubated for 1 week in the tropical Atlantic Ocean, off Grenada. Colors represent: yellow, Bacteroidetes; red, Alphaproteobacteria; cyan, Rhodobacteraceae; magenta, Gammaproteobacteria; blue, bacteria of unknown phyla. A. Chain of Bacteroidetes with associated Alphaproteobacteria and others. B. Colony of Rhodobacteraceae, with a few Alphaproteobacteria and others.
Source: Cathleen Schlundt et al. 2020. Mol. Ecol. Resour. 20 :620–634.
C. SCHLUNDT ET AL. 2019. MOL ECOL RESOUR. 20 :620–634
C. SCHLUNDT ET AL. 2019. MOL ECOL RESOUR. 20 :620–634
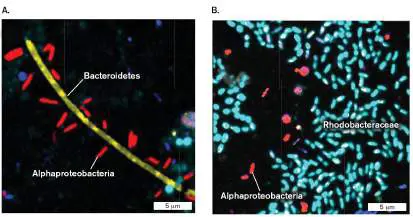
Fig. 4.16 A B
C D
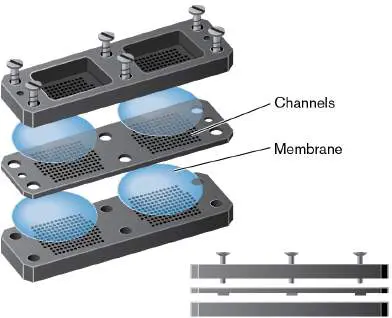
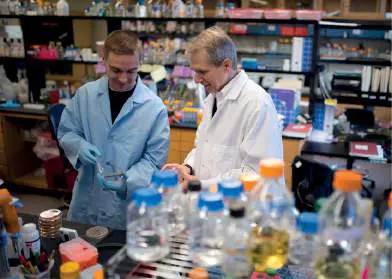
FIGURE 4.16 ■ In situ culturing of the uncultured. A. Kim Lewis (right), with postdoctoral researcher Brian Conlon. B. The recently discovered species Eleftheria terrae produces the novel antibiotic teixobactin. C. Schematic look at the iChip used to culture previously uncultured soil bacteria. D. The iChip being removed from soil.
Fig. 4.26
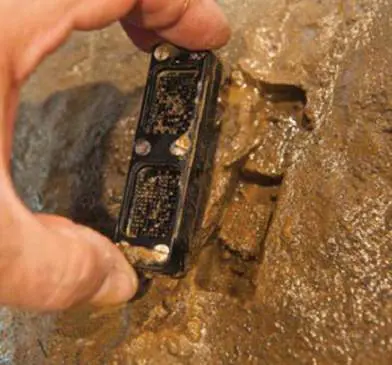
FIGURE 4.26 ■ Chemostats and continuous culture. A. The basic chemostat ensures logarithmic growth by constantly
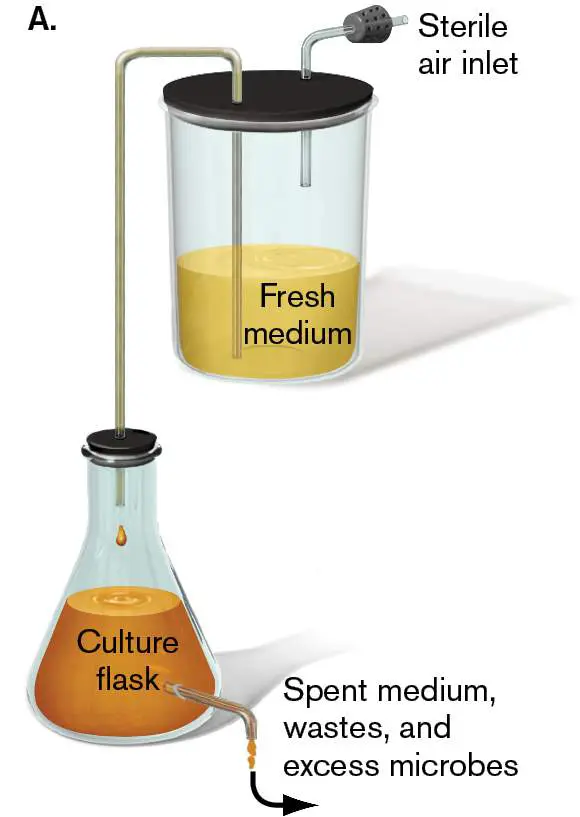
adding and removing equal amounts of culture media. B. A modern chemostat.
SEBASTIAN KOPF, UNIVERSITY OF COLORADO, BOULDER
Fig. 21.11
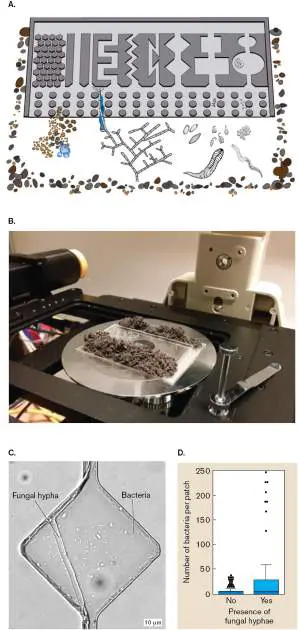
FIGURE 21.11 ■ Microfluidic culture of soil microbes. A. Microengineered soil chip with channels 7 μm high. The chip is buried within soil for colonization by microbes and microscopic invertebrates. B. Microscopic observation of the soil chip culture. C. Diamond-shaped channel shows fungal hypha plus bacteria from soil. D. Bacteria grow in the channel only in the presence of the fungal hypha.
Source: Paola Micaela Mafla-Endara et al. 2021. Commun. Biol. 4 :889.
P. M. MAFLA-ENDARA ET AL. 2021. COMMUN BIOL. 4 :889
P. M. MAFLA-ENDARA ET AL. 2021. COMMUN BIOL. 4 :889
P. M. MAFLA-ENDARA ET AL. 2021. COMMUN BIOL. 4 :889
Fig. 21.25 FIGURE 21.25 ■ Cultivating previously uncultured gut microbes by antibiotic selection. A. Including one or more antibiotics in the culture medium results in isolation of taxa missed by the control. B. An isolate related to Oscillibacter ruminantium forms colonies on media containing erythromycin and sulfonamide. C. Minimum inhibitory concentration (MIC) of various antibiotics for the Oscillibacter isolate. Cipro = ciprofloxacin.
Source: Modified from E. A. Rettedal et al. 2014. Nat. Commun. 5 :4714,
figs. 3a (part A) and 3e (parts B and C).
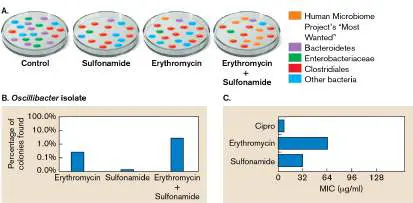
Fig. 17.6
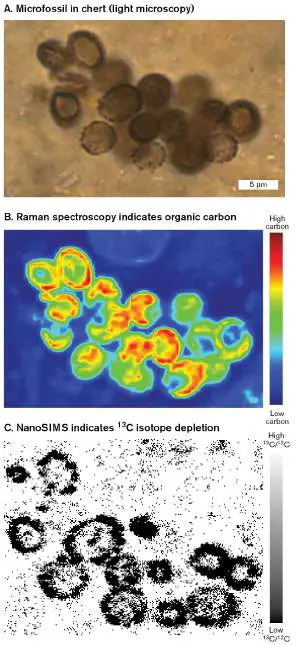
FIGURE 17.6 ■ Microfossil cyanobacteria confirmed by carbon isotope depletion. A. Microfossil cyanobacteria embedded in chert dated to 1.5 Gyr ago in Gaoyuzhuang, China, show size distribution consistent with that of living cells. B. Raman spectroscopy indicates organic carbon content of cells. C. NanoSIMS indicates 13 C isotope depletion levels consistent with cyanobacterial photosynthesis.
Z. GUO ET AL. 2018. PRECAMBRIAN RES. 304 :88–98, FIG. 4B
Z. GUO ET AL. 2018. PRECAMBRIAN RES. 304 :88–98, FIG. 4D
Z. GUO ET AL. 2018. PRECAMBRIAN RES. 304 :88–98, FIG. 4F
Fig. 17.6
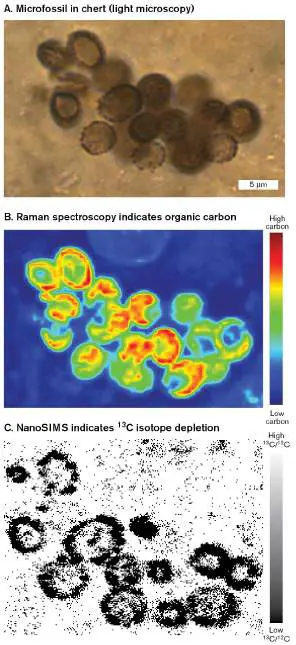
FIGURE 17.6 ■ Microfossil cyanobacteria confirmed by carbon isotope depletion. A. Microfossil cyanobacteria embedded in chert dated to 1.5 Gyr ago in Gaoyuzhuang, China, show size distribution consistent with that of living cells. B. Raman spectroscopy indicates organic carbon content of cells. C. NanoSIMS indicates 13 C isotope depletion levels consistent with cyanobacterial photosynthesis.
Z. GUO ET AL. 2018. PRECAMBRIAN RES. 304 :88–98, FIG. 4B
Z. GUO ET AL. 2018. PRECAMBRIAN RES. 304 :88–98, FIG. 4D
Z. GUO ET AL. 2018. PRECAMBRIAN RES. 304 :88–98, FIG. 4F
Fig. 17.7 FIGURE 17.7 ■ Carbon isotope depletion. A. 13 C isotope depletion (negative δ 13 C) occurs in biomass as a result of the Calvin cycle. Negative δ 13 C is observed at 3.7 Gyr in sedimentary graphite, which may derive from sedimented phototrophs. Little or no isotope depletion is seen in carbonate rock, which has no biological origin. B. Minik Rosing (right), in Greenland, shows the Isua rocks whose carbon isotope ratios indicate photosynthesis at 3.8 Gyr ago.
CHRISTIAN KNUDSEN
Fig. 22.3
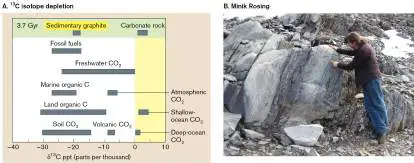
FIGURE 22.3 ■ Measuring flux of elements in the biosphere. A. A U.S. FLUXNET tower at Tonzi Ranch, California, is used for atmospheric CO 2 sampling as part of a global effort to monitor carbon flux. B. Peak CO 2 uptake by forests, recorded across the seasons by FLUXNET towers at Yatir, Israel; El Saler, Spain; Le Bray, France; and Renon, Italy. Source: Part B modified from Kadmiel Maseyk. 2013. FluxLetter 5 :15.
DENNIS BALDOCCHI, BERKELEY
Fig. 22.10
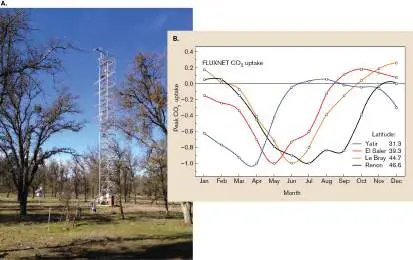
FIGURE 22.10 ■ The hydrologic cycle interacts with the carbon cycle. A. The hydrologic cycle carries bacteria and organic carbon into groundwater and aquatic systems. B. Bottled water samples are measured for dissolved oxygen over time; the rate of decrease of dissolved oxygen indicates biochemical oxygen demand (BOD). The rate of decrease of dissolved oxygen in water samples is approximately proportional to the concentration of organic matter available for respiration. C. A microprocessor-controlled BIOX-1010 BOD analyzer measures rate of respiration. Water samples are mixed with a concentrated microbial biomass, and a dissolved-oxygen (DO) sensor measures small rates of oxygen decrease over time.
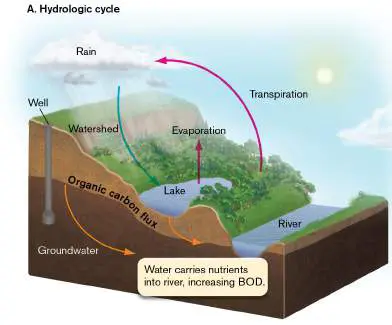
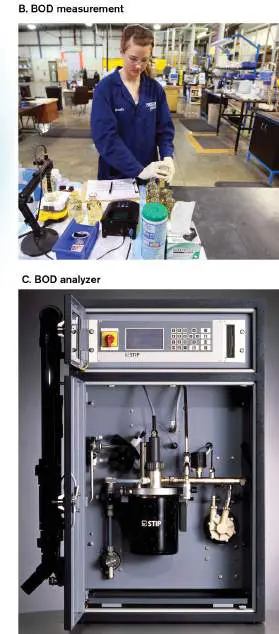
Fig. 17.15 FIGURE 17.15 ■ DNA sequence alignment. A. SSU rDNA sequences from different organisms can be aligned at homologous regions. B. The best alignment is that minimizing mismatches. C. A possible phylogenetic tree of divergence of the four sequences.
Fig. 21.4
Fig. 21.7 FIGURE 21.7 ■ Deepwater Horizon: bacteria show hydrocarbon catabolism enzymes. A. Olivia Mason
operates a rosette of Niskin bottles for marine water sampling. B. Metagenomes from the oil-contaminated plume reveal genes associated with hydrocarbon degradation. Metatranscriptomes reveal mRNA transcripts encoding enzymes for hydrocarbon degradation. PAHs = polycyclic aromatic hydrocarbons.
Source: Part B modified from O. U. Mason et al. 2012. ISME J. 6 :1715,
figs. 3 and 4.
COURTESY OF OLIVIA MASON
Fig. 17.31 FIGURE 17.31 ■ Pangenome and core genome of Clostridioides difficile. The median number of genes found is shown as a function of the number of Clostridioides difficile genomes sequenced. Error bars indicate the range in the number of genes found upon sequencing different combinations of genomes.
Source: Modified from Daniel Knight et al. 2019. mBio 10 :300446.
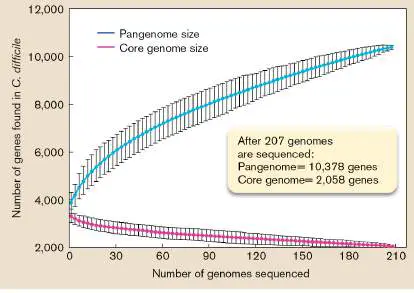
Fig. 17.6
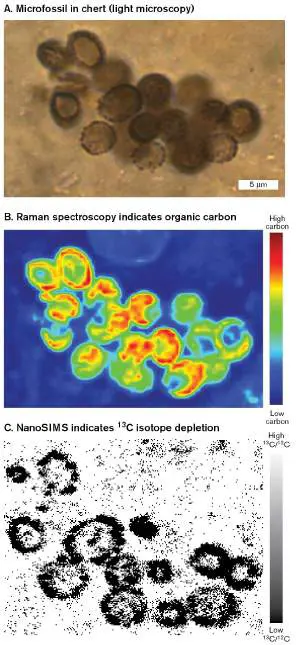
FIGURE 17.6 ■ Microfossil cyanobacteria confirmed by carbon isotope depletion. A. Microfossil cyanobacteria embedded in chert dated to 1.5 Gyr ago in Gaoyuzhuang, China, show size distribution consistent with that of living cells. B. Raman spectroscopy indicates organic carbon content of cells. C. NanoSIMS indicates 13 C isotope depletion levels consistent with cyanobacterial photosynthesis.
Z. GUO ET AL. 2018. PRECAMBRIAN RES. 304 :88–98, FIG. 4B
Z. GUO ET AL. 2018. PRECAMBRIAN RES. 304 :88–98, FIG. 4D
Z. GUO ET AL. 2018. PRECAMBRIAN RES. 304 :88–98, FIG. 4F
Fig. 21.10 FIGURE 21.10 ■ CARD-FISH reveals ethane-oxidizing archaea. A. A 10-year ethane enrichment culture reveals a distinct clade of ethane-oxidizing archaea labeled by 16S rRNA probe (red). Control samples analyzed were a sterile sample
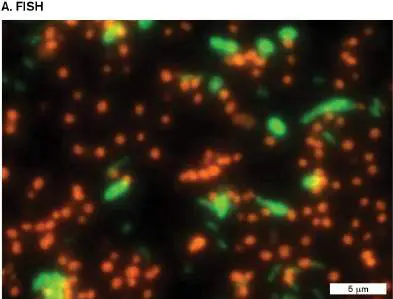
containing the substrate ethane (blue) and a defined ethyl-CoM solution (black). CARD-FISH was performed (fluorescence microscopy). B. Liquid chromatography (LC) followed by tandem mass spectrometry (MS/MS) revealed ethyl-coenzyme M (ethyl-CoM), an intermediate of anaerobic ethane oxidation. Source: Song-Can Chen et al. 2019. Nature 568 :108.
Fig. 21.10
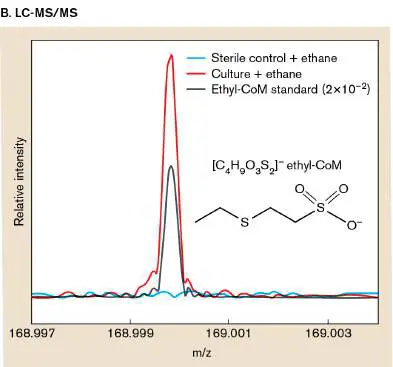
FIGURE 21.10 ■ CARD-FISH reveals ethane-oxidizing archaea. A. A 10-year ethane enrichment culture reveals a distinct clade of ethane-oxidizing archaea labeled by 16S rRNA probe (red). Control samples analyzed were a sterile sample containing the substrate ethane (blue) and a defined ethyl-CoM solution (black). CARD-FISH was performed (fluorescence microscopy). B. Liquid chromatography (LC) followed by tandem mass spectrometry (MS/MS) revealed ethyl-coenzyme M (ethyl-CoM), an intermediate of anaerobic ethane oxidation. Source: Song-Can Chen et al. 2019. Nature 568 :108.
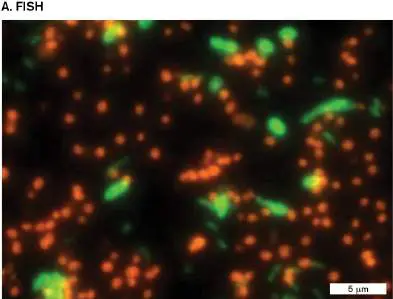
Fig. 21.12
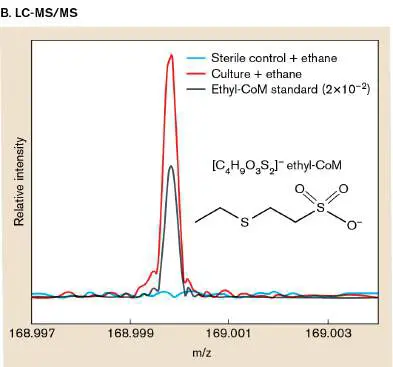
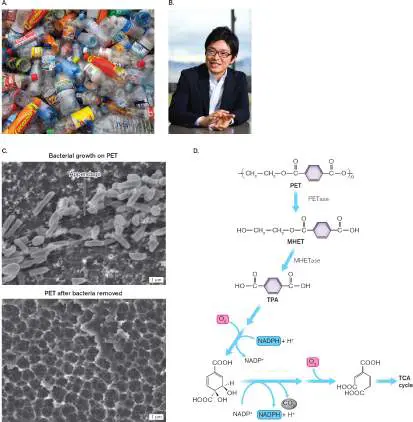
FIGURE 21.12 ■ Soil bacteria degrade plastic. A. Bottles made of polyethylene terephthalate (PET) accumulate in the environment. B. Shosuke Yoshida discovered one of the first known plastic-eating bacteria. C. Ideonella sakaiensis cultured on a film of polyethylene terephthalate. Cell appendages adhere to the film. After removal of bacteria, the film shows degradation. D. The PET degradation pathway includes newly discovered catabolic enzymes: PETase and MHETase. MHET = monoethylene terephthalate; TPA = terephthalic acid.
Source: Part C adapted from S. Yoshida et al. 2016. Science 351 :1199, fig.
3B.
DUNCAN PHILLIPS/ALAMY STOCK PHOTO
COURTESY OF SHOSUKE YOSHIDA
S. YOSHIDA ET AL. 2016. SCIENCE 351 :1199, FIG. 1D. REPRINTED WITH
PERMISSION FROM AAAS
S. YOSHIDA ET AL. 2016. SCIENCE 351 :1199, FIG. 1G. REPRINTED WITH
PERMISSION FROM AAAS
Fig. 21.5 FIGURE 21.5 ■ Partial genomes assembled from a cow rumen microbiome. Map of genome bin APb (order Clostridiales) showing assembled scaffolds. Inner rings indicate fold coverage (number of sequence reads) backward and forward; red lines indicate 25-fold coverage. Center: Genome bins were matched to clades by comparison with reference sequences.
Source: Modified from Matthias Hess et al. 2011. Science 331 :463. Fig. 21.9
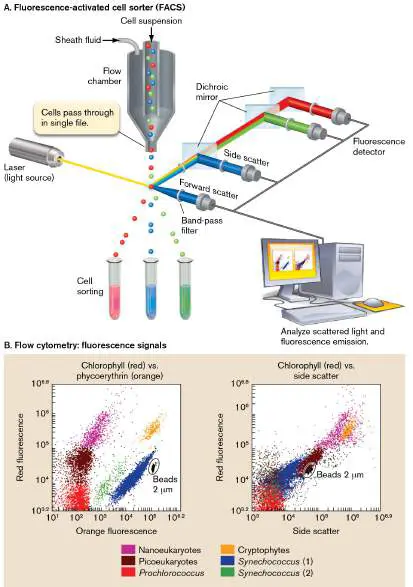
FIGURE 21.9 ■ Flow cytometry and FACS. A. In a fluorescence-activated cell sorter (FACS), a cell suspension is inoculated into flowing sheath fluid, which forms a stream of droplets. Each droplet carries one cell or none. Light from a laser interacts with each cell, generating forward scatter, side scatter, and fluorescence modulated by various filters. The pattern of scatter and fluorescence is analyzed (flow cytometry). A computed “gate” determines a combination of scatter and fluorescence intensities that activates deflection of the droplet into a collection tube (cell sorting). B. Flow cytometry reveals subpopulations of microbes from a sample of Mediterranean seawater off the coast of Toulon, France. Each subpopulation is defined by the intensities of red autofluorescence (chlorophyll) and orange autofluorescence (phycoerythrin; left graph) or of red autofluorescence (chlorophyll) and side scatter (right graph).
Source: Modified from F. Delpy et al. 2018. Estuaries Coast 41 :2039, fig.
3a and 3b.
Fig. 22.8 FIGURE 22.8 ■ Thawing permafrost accelerates methane release by methanogenic archaea. A. Stordalen Mire, Sweden, a model site for study of thawing permafrost. B. Atmospheric CH 4 raises global temperature, which then accelerates thawing and methane release by methanogens, in a positive feedback cycle. C. Palsa, with permafrost; bog, with soil partly melted; fen, fully melted and anoxic. D. Eun-Hae Kim, a student of Virginia Rich, collects samples from Stordalen Mire. E. Phylogeny of metagenome-assembled genomes (MAGs) of methanogenic archaea identified from Stordalen bogs and fens. The scale is based on the mean number of substitutions per nucleotide.
Sources: Parts C and E modified from Ben Woodcroft et al. 2018. Nature
560 :49–54, fig. 1 (C) and extended data fig. 1 (E).
COURTESY OF CARMODY MCCALLEY
COURTESY OF VIRGINIA RICH
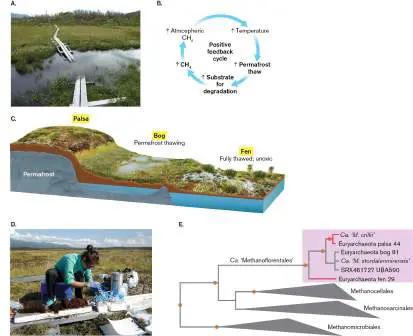
Fig. 22.9 FIGURE 22.9 ■ Decomposition, methanogenesis, and methanotrophy in microbial communities of thawing permafrost (palsa, bog, and fen). Box plots show relative abundance of MAGs that encode the pathway indicated.
Bubble plots contain circles colored by phylum; circle size represents the relative abundance of each MAG.
Source: Modified from Ben Woodcroft et al. 2018. Nature 560 :49–54, fig.
2.
Fig. 2.34
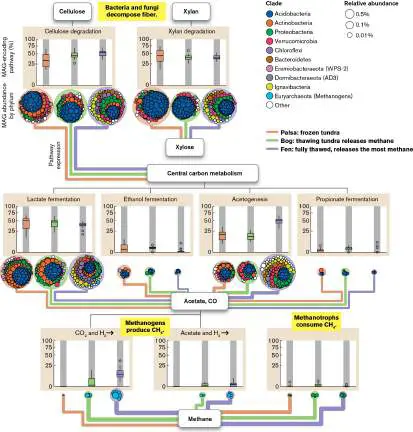
FIGURE 2.34 ■ Fluorescence in situ hybridization (FISH) of bacteria and archaea. A. Fluorophore-labeled DNA oligonucleotide hybridizes to a taxon-specific sequence of rRNA molecules within the cells that are fixed and permeabilized on a microscope slide. B. Syntrophy between anaerobic methane-oxidizing archaea (red FISH) and sulfate-reducing bacteria (green FISH) from a deep-sea cold seep at Guaymas Basin in the Gulf of California.
Source: Part A modified from Rudolf Amann and Bernhard M. Fuchs. 2008. Nat. Rev. Microbiol. 6 :339, fig. 1.
P. CRUAUD & A. VIGNERON, IFREMER
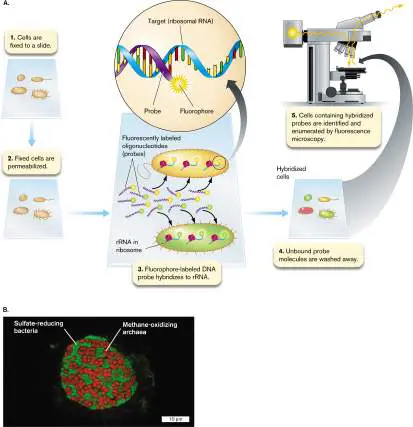
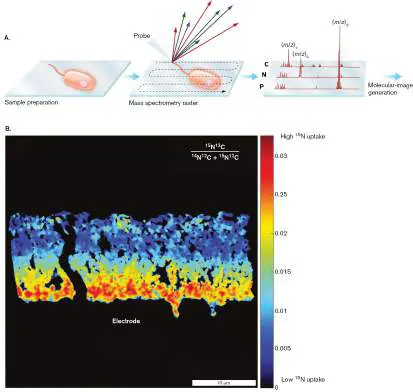
Fig. 2.35 FIGURE 2.35 ■ Imaging mass spectrometry. Mass spectra are obtained from thousands of locations throughout the sample surface. A. Molecular fragments are selected for analysis of mass-to-charge ratio (m / z). Selected isotopes may label specific atoms; for example, C, N, or P. The relative intensities of individual compounds are visualized using false-color gradients. B. NanoSIMS of Geobacter sulfurreducens biofilm upon an electrode, showing atomic percentages of nitrogen (15 N) incorporated into biomass.
Source: Part B modified from Grayson Chadwick et al. 2019. PNAS 116
:20716.
G. L. CHADWICK. 2019. PROC NATL ACAD SCI USA. 116 :20716–20724
Fig. 4.20 FIGURE 4.20 ■ Fluorescence-activated cell sorting. A. Schematic of a fluorescence-activated cell sorter (FACS) counting cells and conducting bidirectional sorting. B. Counting and separation of GFP-producing E. coli and non-GFP-producing E. coli. In the top panel, the low-level fluorescence (blue peak) produced by the cells on the left is baseline fluorescence (autofluorescence). Cells producing high-level fluorescence (red peak) are expressing the GFP protein. The scatterplot in the bottom panel displays the same FACS data, showing the size distribution of cells (x -axis) with
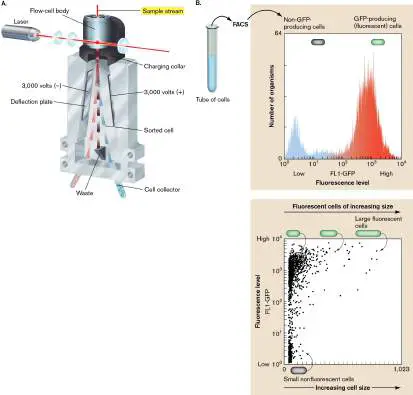
respect to the level of fluorescence (y -axis). The larger cells may be cells that are about to divide.
Fig. 7.32 FIGURE 7.32 ■ Assembly of reads into contigs and scaffolds. Overlapping reads generate a contig. Contigs matched to a reference genome generate a scaffold. Scaffolds may still contain gaps of unknown sequence.
Fig. 7.31
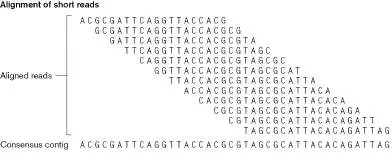
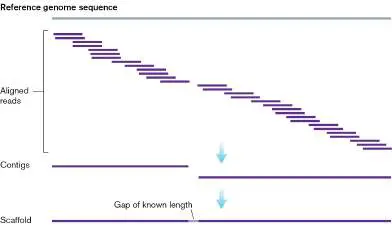
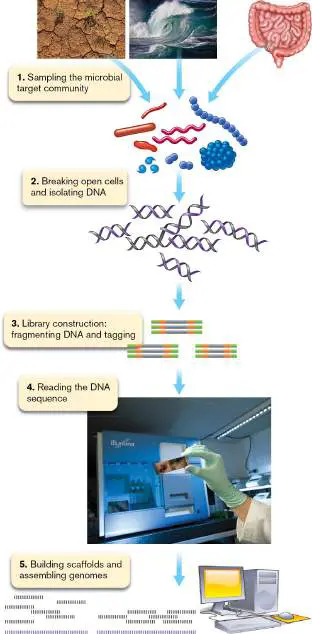
FIGURE 7.31 ■ Sequencing a metagenome. First, select a target community to sample from a habitat such as soil, water, or host plant or animal. Remove the sampled microbes from their environment (step 1) and stabilize the content. Lyse the cells and isolate pure, intact DNA (step 2). Amplify the DNA library by constructing fragments with tagged ends (step 3). Read the DNA sequence using a next-generation sequencing (NGS) sequencer (step 4). Use a computational software pipeline to build scaffolds and assemble genomes (step 5). Source: John Wooley et al. 2010. PLoS Comput. Biol. 6:e1000667.
FLPA/SHUTTERSTOCK
PHOTOBRET 2014/SHUTTERSTOCK
IMAGE BROKER/ALAMY STOCK PHOTO
Fig. 16.38
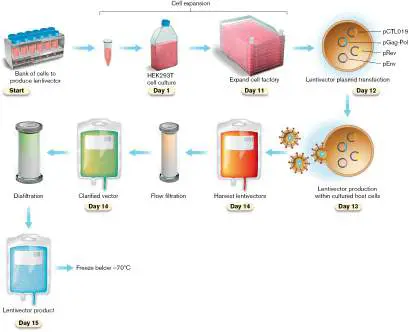
FIGURE 16.38 ■ Commercial production of a CAR-T lentivector. The HEK293T host cells undergo cell expansion (culture growth) for 10 days. The cultured cells are transfected with the four plasmids of CAR-T lentivector (see Fig. 16.38). Media exchange enables harvest of large quantities of lentivector. The lentivector suspension is filtered to remove cell debris. The product is stored at −70°C. Source: Modified from B. L. Levine et al. 2017. Mol. Ther. Methods Clin. Dev.
4 :92–101, fig. 3.
21.2 Functional Ecology: Microbial Culture and Abiotic Factorsnot assigned
All organisms depend, directly or indirectly, on the presence of other organisms. How do microbes contribute to these interactions? Microbes cycle essential nutrients through a food web. They also serve more complex functions that we are just beginning to discover, such as defending host organisms from pathogens, and even modulating animal development and behavior. Cooperation with partner organisms may be incidental, as in the case of hydrogen-oxidizing bacteria using H 2 from fermenters, or it may involve mutualism, a highly developed partnership in which two or more species coevolve to support each other (discussed in Sections 21.3 and 21.4).
The Niche Concept
Within a community, each population of organisms fills a specific niche. The niche is a set of conditions, including an organism’s habitat, resources, and relations with other species of the ecosystem, that enable the organism to grow and reproduce. For example, the niche of Anabaena, a cyanobacterium, is that of a filamentous or mat-forming marine organism that fixes CO 2 into biomass of its vegetative cells while fixing nitrogen via specialized cells called heterocysts (see Chapter 18). Anabaena ’s photosynthesis releases molecular oxygen that is used by swarms of respiring bacteria. The habitat of Anabaena is fresh or brackish water; its biomass provides food for invertebrates and fish. Despite being autotrophic, Anabaena needs the other organisms too. The cyanobacteria grow best in the presence of heterotrophic Proteobacteria, whose respiration depletes oxygen near the Anabaena heterocysts, which need anoxic conditions to fix nitrogen. Thus, organisms do more than fill a niche; they construct niches for other kinds of organisms. Organisms perform niche construction by shaping the biochemical dimensions of their habitat. How can we find the niche—observe a microbe at work in its community?
Separation and sorting. Flow cytometry and fluorescence-activated cell sorting (FACS) enable focus on the contributions of individual microbial strains or species.
Spatial visualization. The spatial organization of microbial community structures enable us to visualize relationships among different species.
Culture. Culturing previously uncultured microbes shows how they share functions within their communities.
Flow Cytometry and Cell Sorting
In the laboratory, FACS enables cell sorting for single-cell genomics ( Fig. 21.9; also see Fig. 4.20). For field samples, cell sorting enables community analysis on the basis of phenotypes—and new possibilities for cell culture. Culturing previously uncultured cells can reveal community members missed by the metagenomes.
FIGURE 21.9 ■ Flow cytometry and FACS. A. In a fluorescence-activated cell sorter (FACS), a cell suspension is
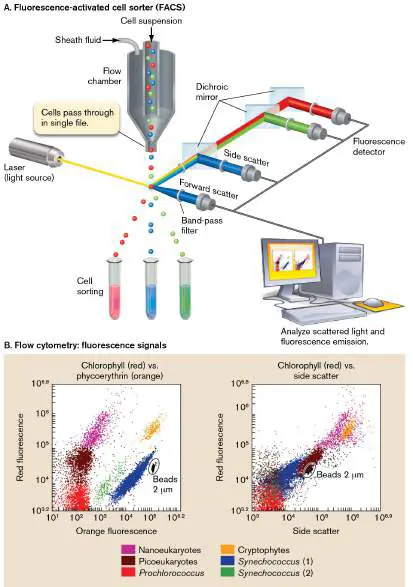
inoculated into flowing sheath fluid, which forms a stream of droplets. Each droplet carries one cell or none. Light from a laser interacts with each cell, generating forward scatter, side scatter, and fluorescence modulated by various filters. The pattern of scatter and fluorescence is analyzed (flow cytometry). A computed “gate” determines a combination of scatter and fluorescence intensities that activates deflection of the droplet into a collection tube (cell sorting). B. Flow cytometry reveals subpopulations of microbes from a sample of Mediterranean seawater off the coast of Toulon, France. Each subpopulation is defined by the intensities of red autofluorescence (chlorophyll) and orange autofluorescence (phycoerythrin; left graph) or of red autofluorescence (chlorophyll) and side scatter (right graph).
Source: Modified from F. Delpy et al. 2018. Estuaries Coast 41 :2039, fig. 3a
and 3b.
Flow cytometry and sorting. In flow cytometry (introduced in Chapter 4), cells of multiple types are detected individually and distinguished using a set of phenotypic traits. The individual cells can further be collected into sorted samples by cell sorting (FACS). Flow cytometry, with or without cell sorting, provides valuable data on marine and freshwater microbes. Figure 21.9Adiagrams the inner workings of a cell sorter, an instrument that conducts both flow cytometry and cell sorting. Within the instrument, a continuous flow of “sheath fluid” under pressure generates a stream of droplets. A cell suspension is inoculated into flowing sheath fluid, at a concentration adjusted such that each droplet carries one cell or none.
Light from a laser interacts with each cell to generate signals of forward scatter, side scatter, and fluorescence modulated by filters. The intensity of forward-scattered light varies with particle size, whereas side scatter varies with the particle’s internal complexity or granularity. For sorting and collection of cells, a computed “gate” determines a combination of scatter and fluorescence intensities that activates deflection of the droplet into a tube or microtiter plate. Figure 21.9B shows an example of flow cytometry: the analysis of community structure in marine phytoplankton from a sample of Mediterranean seawater off the coast of Toulon, France. The phytoplankton (microbial phototrophs) include a wide range of bacterial and eukaryotic microbes that conduct photosynthesis. Their photosynthesis uses various chlorophylls and accessory light-harvesting pigments that are naturally fluorescent—a property called autofluorescence. Each subpopulation of the community can thus be defined by a combination of signals that include the intensity and wavelength of autofluorescence and the intensity of scattered light (a property described in Chapter 2).
The first plot shows the distribution of individual cells with respect to intensity of red autofluorescence (chlorophyll or bacteriochlorophyll) and orange fluorescence (phycoerythrin). Each dot represents a single cell that was excited by a blue laser, with emitted light measured by two different filters (for red and orange). The results distinguish six categories of eukaryotic and bacterial phototrophs. The second plot displays the same sample as a function of red autofluorescence and side scatter. The side scatter indicates internal complexity of a cell, such as the presence of a nucleus. In this plot, the eukaryotes overall show higher side scatter than do the bacteria, which lack nuclei.
Most environmental microbes do not show autofluorescence. But all cells possess unique surface proteins that can be used to generate antibodies attached to a fluorophore. These cell-specific fluorophore tags can be used to define all kinds of cell populations by flow cytometry and FACS. Alternatively, live cells can be tagged with fluorophores attached to 16S rRNA hybridization probes such as those used for FISH (discussed next).
Spatial Organization of Microbes in a Habitat
A question unanswered by genomes is the spatial organization and interaction of microbes within a habitat. However, DNA sequence data can be used to construct probes to address such questions. A key technique that shows the spatial location of microbial taxa is fluorescence in situ hybridization, or FISH (presented in Chapter 2, Fig. 2.34). FISH uses fluorescence microscopy in which fluorophore-tagged DNA probes hybridize to SSU rRNA within microbial ribosomes. For example, FISH was used to detect ethane-oxidizing archaea in a marine microbiome (Fig. 21.10). Ethane is a component of natural gas and petroleum pollution whose biodegradation is not understood. The research team of Florin Musat, at Helmholtz Center for Environmental Research, studies the marine microbial processes that break down such pollutants. They sampled marine sediment from marine hydrocarbon seep regions in the Gulf of Mexico. The researchers established an unusual enrichment procedure in which the microbial community was serially cultured with added substrate (ethane) over a period of 10 years. To mimic the natural habitat, a cold temperature was maintained (12°C), and sulfate was provided for anaerobic oxidation. As expected, growth under these conditions was very slow, but ethane was oxidized by some members of the community.
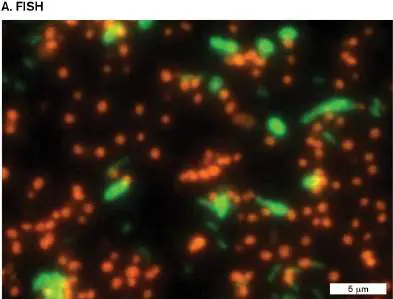
FIGURE 21.10 ■ CARD-FISH reveals ethane-oxidizing archaea. A. A 10-year ethane enrichment culture reveals a distinct clade of ethane-oxidizing archaea labeled by 16S rRNA probe (red). Control samples analyzed were a sterile sample containing the substrate ethane (blue) and a defined ethyl-CoM solution (black). CARD-FISH was performed (fluorescence microscopy). B. Liquid chromatography (LC) followed by tandem mass spectrometry (MS/MS) revealed ethyl-coenzyme M (ethyl-CoM), an intermediate of anaerobic ethane oxidation. Source: Song-Can Chen et al. 2019. Nature 568 :108.
S. C. CHEN ET AL. 2019. NATURE 568 :108–111
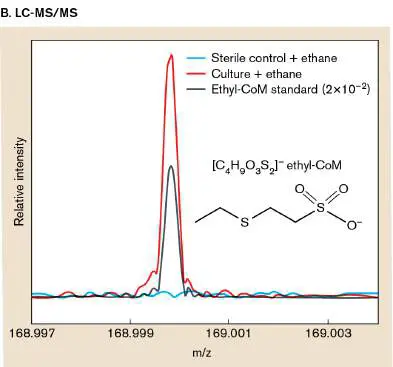
Ultimately, the community yielded a novel archaeon, “ Candidatus Argoarchaeum ethanivorans,” the “slow-growing ethane eater.” The community was visualized by FISH with ca talyzed r eporter d eposition (CARD-FISH), a form of FISH in which the fluorescence signal is amplified by an enzyme reaction. The enzyme hydrogen peroxidase is attached to the initial DNA probe that hybridizes the microbial rRNA. A fluorophore is then applied, with attached tyramide, a molecule that undergoes a radical reaction with hydrogen peroxide. The reaction (catalyzed by the enzyme attached to the DNA) leads to multiple deposition of fluorophores, with fluorescence levels much greater than that of fluorophore-probe FISH.
Musat’s group found that a majority of the cells hybridized a probe for the ethane-eating archaeon (red fluorescence), while other cells hybridized a probe for sulfate-reducing bacteria (green). Together, this consortium was responsible for the oxidation of ethane, including formation of a predicted metabolic intermediate, ethyl-coenzyme M (ethyl-CoM). Coenzyme M is a well-known cofactor for methane metabolism in archaea. The appearance of the intermediate in the culture was observed by liquid chromatography followed by tandem mass spectrometry (LC-MS/MS) (Fig. 21.10B ). In this procedure, the ethyl-CoM and its breakdown products showed the standard mass values predicted for mass spectrometry. Overall, this research yielded the first demonstration of anaerobic ethane oxidation by a marine sediment archaeon.
Still more advanced versions of FISH enable detection of multiple bacterial species within a mixed-species biofilm. A spectacular example of FISH applied to human oral biofilms (dental plaque) is shown in eResearch Activity 21.
Culturing the Uncultured
How much of a microbial community do metagenomes actually catch —and what organisms do they miss? Surprisingly, microbial cultures, and particularly enrichment cultures, yield numerous species not found in the metagenomes. For various reasons, these species have such low abundance in the original habitat that the metagenomic screen does not pick them up. But upon culturing, these rare organisms are favored by the sudden provision of concentrated nutrients or of new conditions that inhibit the more abundant organisms of the microbiome. Novel “out-of-the-box” approaches to enrichment culture reveal organisms previously missed or thought unculturable. Some fruitful approaches: Try harder. Culture an environmental sample with a novel substrate, with antibiotics (discussed in Section 21.4), under stress conditions, or for a very long time (as in Musat’s ethane enrichment) to select for microbes with novel traits.
Coculture with a partner organism. For example, the cyanobacterium Prochlorococcus requires the presence of heterotrophs that catalyze breakdown of hydrogen peroxide formed during oxygenic photosynthesis. Other microbial species may be cultured only within a multispecies biofilm.
Environmental exposure. Culture a sample in a device that permits biochemical exposure to its source environment. An example is the iChip used by Kim Lewis to isolate a novel antibiotic producer (see Fig. 4.16).
Continuous culture with dilution to extinction. A chemostat for continuous culture (see Fig. 4.26) maintains a highly constant level of substrate while avoiding buildup of toxic wastes that might otherwise kill off the microbes of interest.
Microfluidic culture. A microfluidic device confines microbes to a microscale habitat that mimics the microscale structure of habitats such as particles of soil. For unknown reasons, some microbes require microscopic barriers and compartments.
Microfluidic culture is of particular interest because it can reveal unexpected relationships as well as novel organisms. Edith Hammer’s lab at Lund University in Sweden has pioneered the observation of microfluidic culture by use of microengineered chips the size of a microscope slide (Fig. 21.11A). The chips are engineered with a variety of spacings and geometries, all on a scale of a few millimeters, and covered with a glass slide. Each chip is filled with water, culture fluid, or air; then it is buried in soil, either in a field or in a Petri dish, typically for 2 months. After incubation, the chips are harvested and viewed on a light microscope (Fig. 21.11B ).
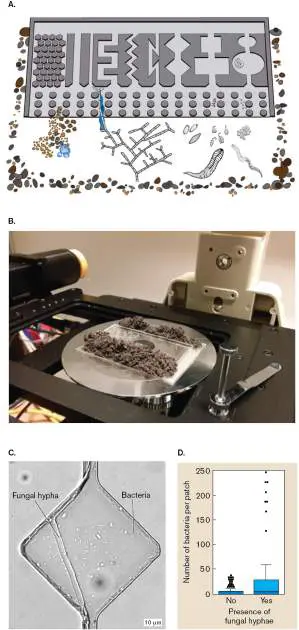
FIGURE 21.11 ■ Microfluidic culture of soil microbes. A. Microengineered soil chip with channels 7 μm high. The chip is buried within soil for colonization by microbes and microscopic invertebrates. B. Microscopic observation of the soil chip culture. C. Diamond-shaped channel shows fungal hypha plus bacteria from soil. D. Bacteria grow in the channel only in the presence of the fungal hypha.
Source: Paola Micaela Mafla-Endara et al. 2021. Commun. Biol. 4 :889.
P. M. MAFLA-ENDARA ET AL. 2021. COMMUN BIOL. 4 :889
P. M. MAFLA-ENDARA ET AL. 2021. COMMUN BIOL. 4 :889
P. M. MAFLA-ENDARA ET AL. 2021. COMMUN BIOL. 4 :889
In one experiment (Fig. 21.11C ), researchers observed the contents of diamond-shaped channels. Half the channels contained a fungal filament that had entered the chip from the side and extended across the channel (for the fungal extension mechanism, see Fig. 20.9 ). The researchers counted the number of bacterial cells in each channel—and found that a channel with a fungal hypha always contained far more bacteria than did a channel lacking fungus (Fig. 21.11D ). This experiment and others show how hyphae act as “fungal highways” for bacteria in soil. The fungi produce exudates (organic molecules) that bacteria can feed on. Whether the bacteria benefit the fungus is unknown. Soil microbiomes are discussed further in Section 21.6.
Can Environmental Microbes Eat Novel Substrates?
The functional role of microorganisms in ecosystems was originally formulated by the Dutch microbiologist Cornelis B. van Niel (1897– 1985). Van Niel discovered several unique forms of microbial metabolism, such as anoxygenic photosynthesis, nitrogen fixation by bacteria and archaea, and the degradation of lignin by bacteria and fungi (discussed in Chapters 13–15). All these special microbial contributions came as a surprise to contemporary biologists. Van Niel extrapolated from his discoveries to propose this hypothesis: Every molecule existing in nature can be used as a source of carbon or energy by a microorganism somewhere. Any molecule found in the environment can participate in some kind of energy-yielding reaction. If an energy-yielding reaction exists, some microbe will evolve to use it.
The van Niel hypothesis implies that a limitless variety of species carry out different energy-yielding reactions, depending on what their environment has to offer. For example, oil-contaminated water from the Deepwater Horizon oil spill region shows enrichment for bacteria that catabolize molecules found in petroleum, small amounts of which seep naturally into Gulf of Mexico sediment. The catabolic enzymes were revealed by functional annotation of metagenomes and metatranscriptomes. The energy gained by microbial metabolism, as well as the elements that microbes assimilate into biomass, eventually circulate throughout the ecosystem.
What about new types of compounds, entirely novel in the environment, for which no catabolic enzymes exist? Compounds such as synthetic plastics were once considered nondegradable “xenobiotic” molecules. But evolution may generate microbes that can digest even the indigestible.
An example is the compound polyethylene terephthalate (PET). This polymer of esterified polyethylene monomers, commonly known as “polyester,” was patented in 1941 and has been used to make bottles for beverages since the 1970s (Fig. 21.12A). Today, the worldwide production of PET is more than 80 million metric tons per year. Much of the material ends up in our environment as fragments of various sizes, including microscopic fragments ingested by small invertebrates and consumed up the food chain. For many years, no decomposition of PET was reported. The material appeared to persist permanently in our environment. In 2016, Shosuke Yoshida (Fig. 21.12B ) and colleagues at the Kyoto Institute of Technology reported the discovery of a bacterium, Ideonella sakaiensis, that degrades PET film (Fig. 21.12C ). Yoshida’s team discovered the bacteria by screening hundreds of soil samples from the PET-contaminated yard of a bottle-recycling factory. They cultured their samples in a lettuce-and-egg medium supplemented with a film of PET. One sample, number 46, had bacteria that colonized the film. The bacteria extended appendages to aid adherence and possibly contribute to breakdown of the material. Figure 21.12C shows the bacteria cultured on a PET film and the pockmarked appearance of the film after the colonizing bacteria were removed.
FIGURE 21.12 ■ Soil bacteria degrade plastic. A. Bottles made of polyethylene terephthalate (PET) accumulate in the environment. B. Shosuke Yoshida discovered one of the first known plastic-eating bacteria. C. Ideonella sakaiensis cultured on a film of polyethylene terephthalate. Cell appendages adhere to
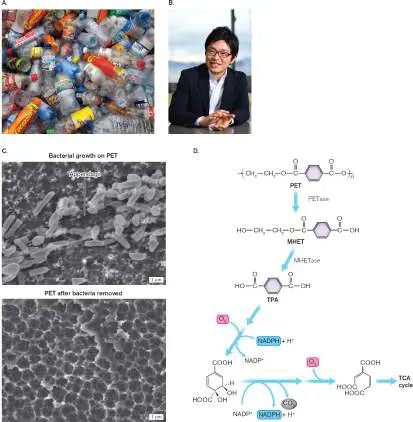
the film. After removal of bacteria, the film shows degradation. D. The PET degradation pathway includes newly discovered catabolic enzymes: PETase and MHETase. MHET = monoethylene terephthalate; TPA = terephthalic acid.
Source: Part C adapted from S. Yoshida et al. 2016. Science 351 :1199, fig. 3B.
DUNCAN PHILLIPS/ALAMY STOCK PHOTO
COURTESY OF SHOSUKE YOSHIDA
S. YOSHIDA ET AL. 2016. SCIENCE 351 :1199, FIG. 1D. REPRINTED WITH
PERMISSION FROM AAAS
S. YOSHIDA ET AL. 2016. SCIENCE 351 :1199, FIG. 1G. REPRINTED WITH
PERMISSION FROM AAAS
How do the bacteria manage to catabolize PET where others fail? Yoshida sequenced the organism’s genome and found a gene showing similarity to the gene that encodes a hydrolase (an enzyme that hydrolyzes polymers). Hydrolases are common in soil microbes and in the human gut biota, where they aid human digestion of complex plant glycans (discussed in Chapter 13). Yoshida ultimately isolated the enzyme PETase and showed that it, indeed, hydrolyzes PET, releasing units of the monomer monoethylene terephthalate (MHET; Fig. 21.12D ). In addition, a second enzyme predicted by the genome, MHETase, was shown to break down the monomer released by PETase. The monomer breakdown leads to a common pathway of aromatic catabolism whose products can enter the TCA cycle, as described in Chapter 13.
Where did this novel PETase come from? Microbiologists hypothesize that it evolved as a mutant form of a hydrolase that degrades some other kind of polymer. Subsequent research on the crystal structure of PETase confirms its evolutionary relationship with other hydrolases that break down cutin (a waxy polymer of plants) and lipids. Altered versions of PETase were made that have even higher activity and show promise for bioremediation of plastic pollutants.
Yoshida’s discovery is consistent with van Niel’s prediction that any organic molecule can be catabolized by a microbe that has the needed enzyme. Given that microbes continually undergo mutation and evolution, the presence of an energetically favorable food source —one whose oxidation or reduction has a negative value of free energy, Δ G —will eventually select for a lineage in which enzymes can perform the metabolism. More recent research reveals numerous plastic-eating microbes in our global oceans, all of which receive increasing amounts of plastic waste. Unfortunately, our rate of plastic waste will outpace the rate of microbial breakdown for the foreseeable future.
Carbon Assimilation and Dissimilation: The Food Web
Overall, our tools of microbial ecology reveal broad recurring patterns in the relationships of microorganisms with one another and with other members of ecosystems. The interactions between microbes and their ecosystems include two common roles of metabolic input and output, often called assimilation and dissimilation, respectively. We discussed most of these metabolic processes in Chapters 13, 14, and 15, but ecology offers a community perspective.
Assimilation refers to processes by which organisms acquire an element, such as carbon from CO 2, to build into cells. When the environment lacks organic compounds containing an element such as nitrogen or phosphorus, microbes may assimilate the element from mineral sources. Common kinds of assimilation include carbon dioxide fixation and nitrogen fixation. Organisms that produce biomass from inorganic carbon (usually CO 2 or bicarbonate ions) are called primary producer. Producers are a key determinant of productivity for other members of the ecosystem.
Dissimilation is the process of breaking down organic nutrients to inorganic minerals such as CO and NO −, usually through
2 3
oxidation. Microbial dissimilation releases minerals for uptake by plants and other microbes, and it provides the basis of wastewater treatment (discussed in Chapter 22). But microbial dissimilation can decrease habitat quality by removing organic nitrogen. When soil bacteria break down amines (RNH) to ammonium ion (NH +),
2 4
nitrifying bacteria such as Nitrosomonas oxidize the ammonium to nitrite (NO −) and nitrate (NO −). These highly soluble anions are
2 3
then washed out of soil into the groundwater.
This chapter covers microbial assimilation and dissimilation of carbon and nitrogen in association with the plants and animals of an ecosystem. The cycles of other key elements, and their effects on the global biosphere, are explored in Chapter 22.
Thought Question
21.8 From Chapters 13–15, give examples of microbial metabolism that fit patterns of assimilation and dissimilation.
The major interactions among organisms in the biosphere are dominated by the production and transformation of biomass, the bodies of living organisms. To obtain energy and materials for biomass, all organisms participate in food webs (Fig. 21.13). A food web describes the ways in which various organisms produce and consume biomass. Levels of consumption are called trophic levels. Organisms at each trophic level consume biomass of organisms from another level. At each trophic level, the fraction of biomass retained by the consumer is small; most is released as CO 2 through respiration to provide energy.
FIGURE 21.13 ■ Microbes within food webs. A. Biomass production and carbon recycling. Percentages indicate the fraction of original CO 2 converted to biomass at each trophic level. B. In marine ecosystems, the primary producers are bacteria, archaea, and algae. Viruses break down both producer and consumer microbes. In a forest, the major producers are trees, while the main decomposers are fungi and bacteria.
Every food web depends on primary producers for two things: Absorbing energy from outside the ecosystem. A key source of energy is sunlight, which drives production by photoautotrophy.
Assimilating minerals into biomass. The biomass of producers is then passed on to subsequent trophic levels.
The majority of carbon in Earth’s biosphere is assimilated by oxygen-producing phototrophs such as cyanobacteria, algae, and plants. Certain important ecosystems are founded on lithoautotrophs; for example, the hydrothermal vent communities, in which bacteria oxidize hydrogen sulfide to fix CO 2, capturing both gases as they well up from Earth’s crust. The vent communities use oxygen generated by phototrophs living in the euphotic zone (see Section 21.5).
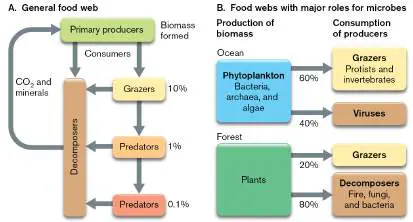
In addition to producers, all ecosystems include consumers, which acquire nutrients from producers and ultimately dissimilate biomass by catabolism, returning carbon back to the atmosphere (Fig. 21.13A). Consumers constitute several trophic levels on the basis of their distance from the primary producers. The first level of consumers, generally called grazers, directly feed on producers. Grazers usually convert 90% of the producer carbon back to CO 2 through respiratory metabolism, yielding energy. The next level of consumers, often called predators, feed on the grazers, again converting 90% back to atmospheric CO 2. In microbial ecosystems, the trophic relationships are often highly complex, because a given species may act as both producer and consumer.
At each trophic level, some of the organisms die, and their bodies are consumed by decomposers, returning carbon and minerals back to the environment for use by producers. All decomposers are microbes (fungi or bacteria). Decomposers have particularly versatile digestive enzymes capable of breaking down complex molecules such as lignin. Without decomposers, carbon and minerals needed by phototrophs would be locked away by ever-increasing mounds of dead biomass. Instead, all biomass is recycled somewhere in the biosphere. As we learned in Chapter 13, the energy gained by ecosystems can be cycled in part, but all is eventually lost as heat.
In the function of ecosystems, phylogenetic distinctions among the domains Bacteria, Archaea, and Eukarya have less importance than the biological and biochemical consequences of an organism’s presence in the community; that is, what the organism produces or consumes. Thus, in this chapter we place greater emphasis on trophic roles than on phylogenetic distinctions.
The relative impact of microbial and multicellular producers and consumers varies considerably among different habitats. A major difference appears between marine and terrestrial ecosystems (Fig. 21.13B ). In the oceans, the smallest inhabitants, cyanobacteria and algae, perform most of the CO 2 fixation and biomass production. The major marine consumers are protists and viruses. Viruses are the most numerous replicating forms in the ocean—and they lyse most marine cells before any multicellular predators have a chance to consume them. In terrestrial ecosystems, by contrast, the major primary producers and fixers of CO 2 are multicellular plants. Plants generate detritus, discarded biomass such as leaves and stems, that requires decomposition by fungi and bacteria. While viruses are important, multicellular consumers such as worms and insects play a greater role in decomposition.
The differences between the food webs of ocean and dry land explain why most of the food we harvest from the ocean consists of predators at the higher trophic levels (fish), whereas most food harvested on land consists of producers and first-level consumers (plants and herbivores). Fish depend on a large number of trophic levels—including a vast base of microbes. Thus, the numbers of fish remain limited, despite the seemingly huge volume of ocean.
Environmental Factors
Besides food and energy sources, a number of physical factors determine the composition of microbial communities. Abiotic factors (factors determined outside the living organism) can profoundly affect the environment for microbes and other members of the food chain, either directly or by affecting other factors. These factors are discussed in Chapter 5 from the standpoint of individual microbes or species. Here, we note how abiotic factors shape the community relationships among taxa.
Oxygen and other electron acceptors. The availability of oxygen (O 2) is the most important factor that determines how nutrients containing carbon, nitrogen, and sulfur are assimilated and dissimilated. Where molecular oxygen is scarce, oxidized forms of minerals as well as organic compounds accept electrons (Table 21.2). These reactions lead to surprising relationships, such as electrogenic networks of bacteria in wetland and aquatic sediments. Species whose cytochromes donate electrons at a higher redox potential may grow higher in the sediment, nearer the source of O 2.
Aerobic and Anaerobic
TABLE 21.2
Metabolism
Oxidized by O Reduced by CHO * 2 or H 2 (anaerobic Element (lithotrophy) electron transport)
Nitrogen NH 3 + O 2 → NO − + CHO → N
3 2
NO −
3
Manganese Mn 2+ + O → Mn 4+ + CHO → Mn
2
4+ 2+
Mn Iron Fe 2+ + O → Fe 3+ + CHO → Fe 2+
2
Fe 3+ Sulfur H 2 S + O 2 → SO 2− + CHO → H
4 2
SO 2− S
4
Carbon CH 4 + O 2 → CO 2 + H 2 → CH 4 CO 2 In aerated environments, microbes use molecular oxygen as an electron acceptor to respire on organic compounds (abbreviated CHO in Table 21.2) produced by other organisms (see Chapters 13 and 14 ). Aerobic respiration on organic compounds is highly dissimilatory in that it tends to break compounds down to CO 2. Microbes also use oxygen to respire on reduced minerals such as NH, H S, and Fe 2+
3 2
(lithotrophy) and to oxidize hydrogen (hydrogenotrophy). In most cases, lithotrophy is coupled to CO 2 fixation and is therefore assimilatory metabolism.
In anoxic environments, microbes use minerals such as Fe 3+ and NO − to oxidize organic compounds supplied by other organisms
2
(anaerobic respiration) or reduced minerals (anaerobic lithotrophy). But the most prevalent forms of anaerobic metabolism are fermentation and methanogenesis. Fermentative bacteria, such as many Proteobacteria and Firmicutes, return electrons to their oxidized food substrates, along with molecules of H 2 and CO 2. These fermentation products are then reduced to methane (CH 4) by methanogenic archaea. The rates of fermentation and methanogenesis are accelerated by rising temperatures. The release of microbial CO 2 and CH 4 by soil communities is accelerated by global temperature rise and is a major factor in human-caused climate change (discussed in Chapter 22).
Temperature. Temperature limits the rate of metabolism (discussed in Chapter 5). Higher temperatures found in hot springs (80°C– 100°C) enable some of the fastest growth rates measured (doubling times as short as 10 minutes for some hyperthermophiles). On the other hand, temperature limits the oxygen concentration in water, so hyperthermophiles such as Thermoproteus and Pyrodictium often use sulfur instead. Extreme cold such as that of polar regions may limit diversity and exclude all but microorganisms and microscopic invertebrates. Extreme high temperature and pressure selects for hyperthermophilic archaea, whose membranes contain ether-linked fatty acids and whose DNA is positively supercoiled by reverse gyrase (see Chapter 19). Bacteria adapted to high temperatures, such as Thermotoga, often have ether-linked membranes and reverse gyrase from genes obtained by horizontal transfer from archaea. (Reverse gyrase is discussed in Sections 7.2 and 19.1.)
Salinity and acidity. High salt concentration limits the growth of microbes adapted to freshwater conditions. By contrast, many microbial species have adapted to high salinity (they are called halophiles). The haloarchaea, for instance, bloom in population as a body of water shrinks and becomes hypersaline. As less halotolerant members decay, their cell components are scavenged by species adapted to the higher salt. Thus, increase in salinity leads to the growth of a hypersaline microbial community dominated by haloarchaea.
Acidity is important geologically because a high concentration of hydronium ions accelerates the release of reduced minerals from exposed rock. Extreme acidity is often produced by lithotrophs, whose oxidation of iron and sulfur release hydrogen ions (see Chapter 14). The acidophiles adapted to the most extreme acidity are archaea such as Sulfolobus and Ferroplasma. Other kinds of habitats, such as soda lakes, show extreme alkalinity resulting from high sodium carbonate. These habitats support extreme alkaliphiles that are often extreme halophiles as well, such as the archaeon Natronococcus. Investigating ecosystems leads to the discovery of other remarkable ways that organisms respond to each other, in some cases by growing in intimate relationships. We explore these intimate relationships in the next section.
To Summarize
Microbial populations fill unique niches in ecosystems. Every chemical reaction that may yield free energy can be utilized by some kind of microbe.
Flow cytometry and cell sorting (FACS) reveal cells at work in microbial communities.
Enrichment culture by innovative methods reveals community members missed by metagenomes.
FISH reveals spatial organization of community partners.
Microbes fix or assimilate essential elements into biomass , which recycles within ecosystems. Important elements, such as nitrogen, are fixed solely by bacteria and archaea.
Microbial enzymes may evolve to consume a newly available energy source.
Consumers and viruses break down the bodies of producers , generating CO 2 and releasing heat energy. Dissimilation is the process of breaking down nutrients to inorganic minerals.
Primary producers fix single-carbon units, usually CO 2. Microbial primary producers include algae, cyanobacteria, and lithotrophs.
Decomposers such as fungi and bacteria release nutrients from dead organisms.
Microbial communities depend on abiotic factors. These include oxygen, temperature, salinity, and pH. The largest portion of our biosphere contains anaerobic bacteria and archaea. Beneath Earth’s surface, most metabolism is anaerobic.
Glossary
niche An organism’s environmental requirements for existence and its relations with other members of the ecosystem.
niche construction The actions of an organism that alter its environmental niche and change its chance of survival in that niche.
cell sorting The separation and collection of classes of cells using fluorescent markers, as detected by flow cytometry.
flow cytometry A tool for analyzing cell populations, in which cells of multiple types are detected individually and distinguished by light scatter and fluorescence emission.
fluorescence in situ hybridization (FISH)
A technique to detect individual microbes in an ecological or clinical sample, using a fluorophore-labeled oligonucleotide probe (usually a short DNA sequence) that hybridizes to microbial DNA or rRNA.
FISH See fluorescence in situ hybridization .
assimilation An organism’s acquisition of an element, such as carbon from CO 2, to build into body parts.
primary producer An organism that produces biomass (reduced carbon) from inorganic carbon sources such as CO 2.
dissimilation An organism’s catabolism or oxidation of nutrients to inorganic minerals that are released into the environment.
biomass The mass found in the bodies of living organisms.
food web A network of interactions in which organisms obtain or provide nutrients for each other; for example, by predation or by mutualism.
trophic level A level of a food web representing the consumption of biomass of organisms from another level, usually closer to producers. consumer An organism that acquires nutrients from producers, either directly or indirectly.
grazer A first-level consumer, feeding directly on producers. predator A consumer that feeds on grazers.
decomposer An organism that consumes dead biomass.
detritus Discarded biomass that can be consumed by decomposers. abiotic Produced without living organisms; occurring in the absence of life.
Fig. 4.20 FIGURE 4.20 ■ Fluorescence-activated cell sorting. A. Schematic of a fluorescence-activated cell sorter (FACS) counting cells and conducting bidirectional sorting. B. Counting and separation of GFP-producing E. coli and non-GFP-producing E. coli. In the top panel, the low-level fluorescence (blue peak) produced by the cells on the left is baseline fluorescence (autofluorescence). Cells producing high-level fluorescence (red peak) are expressing the GFP protein. The scatterplot in the bottom panel displays the same FACS data, showing the size distribution of cells (x -axis) with respect to the level of fluorescence (y -axis). The larger cells may be cells that are about to divide.
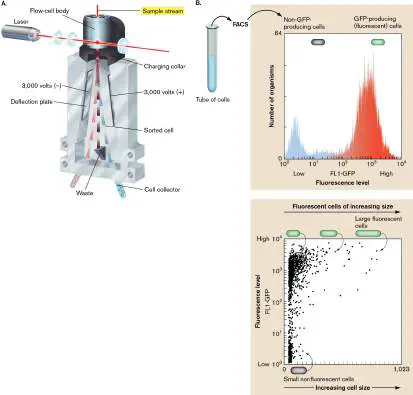
Fig. 2.34 FIGURE 2.34 ■ Fluorescence in situ hybridization (FISH) of bacteria and archaea. A. Fluorophore-labeled DNA oligonucleotide hybridizes to a taxon-specific sequence of rRNA molecules within the cells that are fixed and permeabilized on a microscope slide. B. Syntrophy between anaerobic methane-oxidizing archaea (red FISH) and sulfate-reducing bacteria (green FISH) from a deep-sea cold seep at Guaymas Basin in the Gulf of California.
Source: Part A modified from Rudolf Amann and Bernhard M. Fuchs. 2008. Nat. Rev. Microbiol. 6 :339, fig. 1.
P. CRUAUD & A. VIGNERON, IFREMER
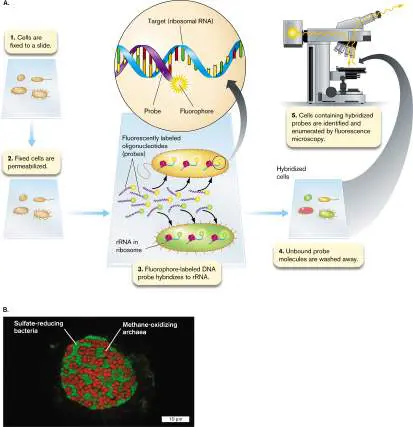
Fig. 4.16 A B
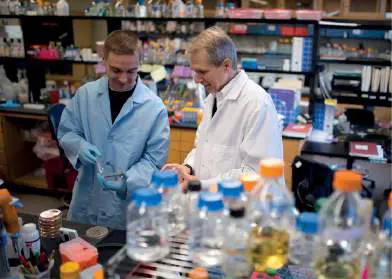
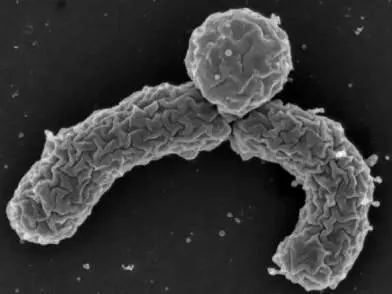
C D
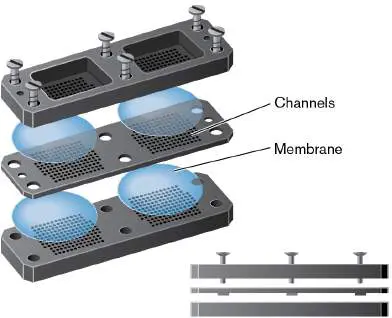
FIGURE 4.16 ■ In situ culturing of the uncultured. A. Kim Lewis (right), with postdoctoral researcher Brian Conlon. B. The recently discovered species Eleftheria terrae produces the novel antibiotic teixobactin. C. Schematic look at the iChip used to culture previously uncultured soil bacteria. D. The iChip being removed from soil.
Fig. 4.26
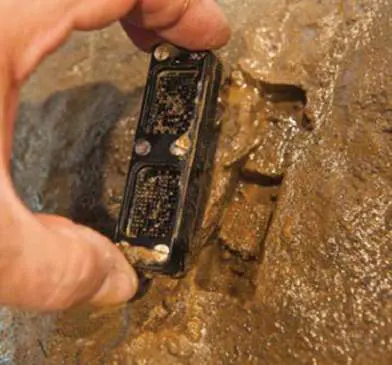
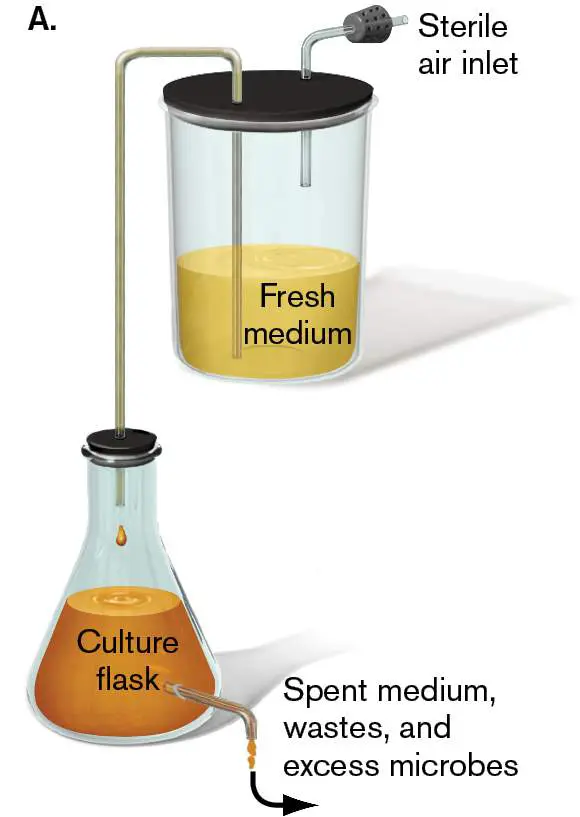
FIGURE 4.26 ■ Chemostats and continuous culture. A. The basic chemostat ensures logarithmic growth by constantly adding and removing equal amounts of culture media. B. A modern chemostat.
SEBASTIAN KOPF, UNIVERSITY OF COLORADO, BOULDER
Fig. 20.9
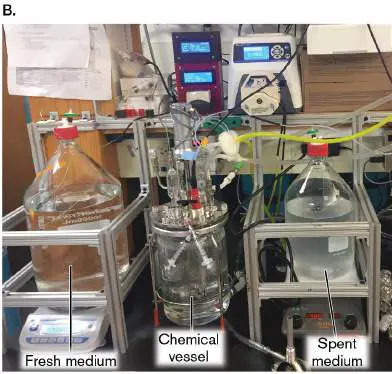
FIGURE 20.9 ■ Cellular basis of hyphal extension. A. Section through the growing tip of a hypha (TEM). Vesicles collect at the tip, where they fuse into the cell membrane, enabling extension. B. The absorption zone takes in nutrients. Cytoplasm moves toward the tip of the apical growth zone, driven by turgor pressure. Turgor pressure is regulated by H + export and K + uptake. Ca 2+ released by the endoplasmic reticulum and mitochondria induces vesicles to fuse and to expand the plasma membrane at the growing tip.
STEPHEN SEILER ET AL. 1997. EMBO J. 16 :3025–3034, FIG. 8A
Endnotes
1. Note *: *CHO = organic material. Return to reference *
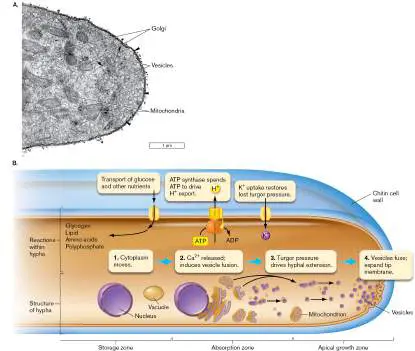
21.3 Symbiosisnot assigned
One of the most fascinating features of evolution is how organisms adapt to the presence of others. Some relationships of microbes occur at a distance; for example, the oxygen gas released by marine cyanobacteria is breathed by organisms around the globe (the focus of Chapter 22). Other relationships require intimate association between two or more specific partners. An intimate association between organisms of different species is called symbiosis (plural, symbioses). Symbiotic associations include a full range of both positive and negative relationships (Table 21.3). Whether the relationship is positive or negative, both partners evolve in response to each other. Symbiosis may involve two or more partner species, even thousands of partners, as in animal digestive communities (see Section 21.4).
Types of Symbiotic
TABLE 21.3 Associations Involving
Microbial Species
Type of Effects of interaction interaction Example Mutualism Two organisms Lichens consist of grow in an fungi and algae intimate species- (in some cases, specific cyanobacteria)
relationship in growing together which both in a complex partner species layered structure. benefit and may Each species fail to grow requires the independently. presence of the other.
Synergism Both species benefit Human colonic through growth, bacteria ferment, but the partners releasing H 2 and are easily CO 2, which separated, and methanogens either partner can convert to grow methane. The independently of methanogens gain the other. energy, and the bacteria benefit energetically from the removal of their fermentation products.
Commensalism One species In wetlands, benefits, while Beggiatoa the partner bacteria oxidize H species neither 2 S for energy. benefits nor is Removal of H 2 S harmed. enables growth of other microbes for whom H 2 S is toxic. The other microbes are not known to benefit Beggiatoa.
Amensalism One species In the soil, benefits by Streptomyces harming another. bacteria secrete The relationship antibiotics that is nonspecific. lyse other species, releasing their cell contents for Streptomyces to consume.
Parasitism One species (the Legionella parasite) benefits pneumophila, the at the expense of cause of the other, a legionellosis, specific host. The parasitizes relationship is amebas in natural usually obligatory aquatic habitats. for the parasite. Within the human lung, L.
pneumophila parasitizes macrophages.
Mutualism Involves Partner Species That Require Each Other
In the most highly evolved forms of symbiosis, partner species evolve specific mechanisms of interdependence, and they may require each other for survival. This coevolved interdependence is called mutualism. A striking case of microbial mutualism is the interdependence of the luminescent bacterium Vibrio fischeri ( Aliivibrio fischeri) and its host squid, Euprymna scolopes (described in Section 10.4). Mutualism can involve two or more microbial partners. It can also involve one or more microbial partners with a plant or animal host. In some cases, both partners absolutely require each other; in other cases, one or the other is incapable of growing alone. The mutually beneficial relationship is maintained by numerous genetic responses that regulate each partner, avoiding damage to the other. Mutualisms such as nitrogen-fixing rhizobia within legumes can have enormous practical applications.
A highly evolved form of mutualism is the lichen (Fig. 21.14). Lichens consist of an intimate symbiosis between a fungus and an alga or cyanobacterium—sometimes both. The symbiosis requires compatible partner species. The alga or bacterium provides photosynthetic nutrition, while the fungus provides minerals and protection. Lichens grow very slowly, but they tolerate extreme desiccation.
FIGURE 21.14 ■ Lichens. A. A tombstone at Kenyon College Cemetery in Ohio, encrusted with lichens (pale green) and mosses (dark green), a nonvascular plant. B. Close-up of the lichens in part A. C. Section through a lichen (Lobaria pulmonaria) shows fungal (cyan) and algal (violet) symbionts (stained LM).
JOAN SLONCZEWSKI
JOAN SLONCZEWSKI
BIODISC/VISUALS UNLIMITED, INC.
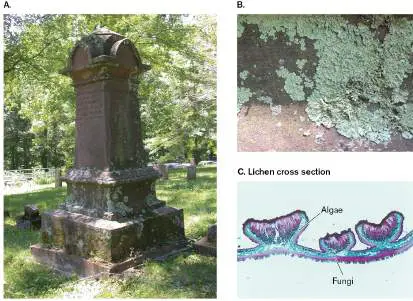
Lichens show a surprising variety of form. Different species may form a flat crust, branched filaments, or leaflike lobes. A cross section of the leaflike lichen Lobaria pulmonaria reveals a layer of algae (cyan) covered by fungal mycelium (stained purple), which protects the algae from ultraviolet light damage (Fig. 21.14C ). In addition to the algae, this lichen includes patches of cyanobacteria, which fix nitrogen. Thus, the fungus, algae, and cyanobacteria form a three-way mutualism. For dispersal, the lichen forms asexual clumps of algae wrapped in fungal mycelium. The clumps flake off and are carried by wind to new locations. In boreal (northern) forests, lichens cover the majority of the ground and provide food for grazing animals. Lichens are a winter food source for caribou, which dig beneath the snow to obtain them.
Note that fungi participate in widespread mutualistic interactions with the roots of plants, especially trees. Most trees are dependent on fungal partners called mycorrhizae. Mycorrhizae are presented in Section 21.6.
How can we tell when a microbe present in a multicellular animal behaves as a mutualistic partner? The mutualism can be documented by several kinds of evidence: Removal of the microbial partner leads to death or decreased growth of the host.
The microbial genome shows extensive degeneration (reduction) of normally essential genes for metabolism and protective structures.
Radioisotope labeling shows incorporation of products synthesized by one partner and used by the other.
Note, however, that genome reduction and partner product transfer also are traits of parasites. It can be surprisingly tricky to distinguish between a parasite and a mutualist.
Rhizobia Fix Nitrogen for Legumes
A plant-bacterial mutualism that is critical for agriculture is that of plants and nitrogen-fixing rhizobia (singular, rhizobium), a group of soil-dwelling Alphaproteobacteria discussed in Chapter 18. Major rhizobial genera include Rhizobium, Bradyrhizobium, and Sinorhizobium. Rhizobia, associated with legumes such as peas and beans, fix more nitrogen than the plants absorb from soil, actually increasing the soil’s nitrogen content. For this reason, farmers often alternate crops such as corn with soybeans to restore nitrogen to the soil. The rhizobial bacteria develop specialized forms within plant cells, called bacteroids. Bacteroids lack cell walls and are unable to reproduce; their function is specialized for nitrogen fixation. The rhizobial infection of root hairs induces the formation of nodules within which the nitrogen-fixing bacteroids are sequestered (see Fig. 18.27).
Thought Question
21.9 How do you think symbiotic rhizobia reproduce? Why do bacteroids develop if they cannot proliferate?
The initiation, development, and maintenance of the rhizobia-legume symbiosis poses intriguing questions of genetic regulation. How does the association begin? How do host plant and bacterium recognize each other as suitable partners? The legume exudes signaling molecules called flavonoids into its rhizosphere. Flavonoids resemble steroid hormones such as estrogen and have similar effects on animals; they are also called phytoestrogens. The flavonoids are detected by rhizobial bacteria, which respond by chemotaxis, swimming toward the root surface. Flavonoids then induce bacterial expression of Nod factors, molecules composed of chitin with lipid attachments. Nod factors communicate with the host plant and help establish species specificity between bacterium and host.
The entry of the bacteria into the host involves a fascinating interplay between bacterial and plant cells (Fig. 21.15). First, a bacterium is attracted by flavonoids to the surface of a root hair extended by a root epidermal cell (Fig. 21.15A, step 1). The bacterial Nod factor induces the root hair to grow in a curl around it and ultimately surround the bacterium with plant cell envelope (steps 2 and 3). The bacterium then induces growth of a tube poking into the plant cell (step 4). The tube growth is directed by the plant nucleus, which migrates toward the plant cortex (step 5). As the tube grows, bacteria proliferate, forming a column of cells that projects down the tube (steps 6 and 7). This column of cells is known as the infection thread. The infection thread can be visualized by light microscopy (Fig. 21.15B ).
FIGURE 21.15 ■ The infection thread. A. Rhizobia are attracted to the legume by chemotaxis toward exuded flavonoids. A bacterium induces an epidermal root hair to curl around it and take it up into the infection thread, a tube of plant cell wall material. The thread eventually penetrates cortical cells, where the bacteria lose their cell walls and become nitrogen-fixing bacteroids. B. Root hair curling around Rhizobium, and the formation of an infection thread (LM). C. Infection threads invading the cortex (fluorescence microscopy). Bacteria express either DsRed (pink) or green fluorescent protein (green).
XAVIER PERRET. 2000. MICROBIOL. MOL. BIOL. REV.
64 :180
D. J. GAGE. 2002. J. BACTERIOL 24 :7042
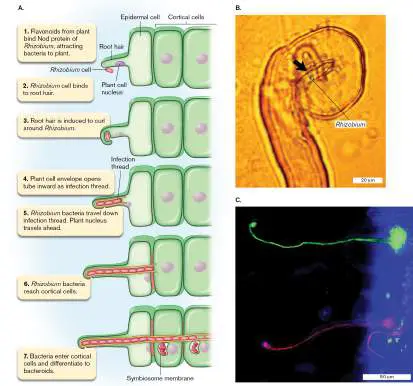
As the infection thread develops, signals from the bacteria induce the cortical cells (below the epidermis) to prepare to receive the bacteria. The bacteria induce further tube formation into the cortical cells and continue penetration as they grow. The penetration of the infection thread into the cortex is shown in fluorescence micrographs (Fig. 21.15C ) in which the bacteria are engineered to express a fluorescent protein.
The cortical cells invaded by bacteria are induced to proliferate in an organized manner, forming nodules. Within the nodules, most of the infecting bacteria differentiate into wall-less bacteroids that will fix nitrogen. A few bacteria fail to differentiate; their fate is unclear. The bacteroids remain sequestered within a sac of plant-derived membrane known as the symbiosome. The symbiosome membrane contains special transporters that mediate the exchange of nutrients between the bacteroid and its host cell, sustaining bacteroid metabolism while preventing harm to the host.
From the plant cytoplasm, the bacteroid receives catabolites such as malate, which enter the TCA cycle and donate electrons for respiration. The oxygen for respiration comes from the plant’s photosynthesis, regulated by plant-derived leghemoglobin to maintain levels low enough that the bacteroids can fix nitrogen ( Fig. 21.16). Bacterial nitrogen fixation consumes about a fifth of the plant’s photosynthetic products. As discussed in Chapter 15, bacteria fix nitrogen gas (N) into ammonium ion (NH +) in a
2 4
reaction catalyzed by the enzyme nitrogenase: FIGURE 21.16 ■ Energy and oxygen regulation during nitrogen fixation. The bacteroid receives photosynthetic products from the plant, such as malate and oxygen, to generate ATP for nitrogen fixation. The amount of oxygen is regulated closely by leghemoglobin. The bacteroid provides nitrogen (fixed as ammonium ion) to the plant cell.
N + 10H + + 8 e − + 16 ATP ⟶
2
2NH + + H + 16 ADP + 16 P
4 2 i
The reaction requires expenditure of 8 NADPH or NADH, plus 16 ATP, which are generated by aerobic respiration. But respiration requires oxygen, which poisons nitrogenase. Thus, oxygen needs to
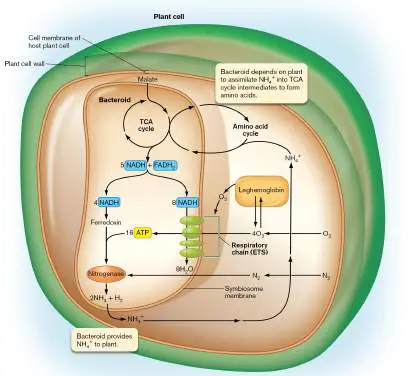
be delivered to the bacteroid only as needed, and in an amount just enough to run respiration. The oxygen is sequestered and brought to the bacteroid by leghemoglobin, an iron-bearing plant protein related to blood hemoglobin.
Overall, the nitrogen fixation symbiosis is kept in balance by several regulatory mechanisms. The presence of ammonium or nitrate ions inhibits symbiosis and nitrogen fixation. The bacteroids cannot synthesize their own amino acids; instead, they must provide ammonium to the plant cytoplasm for assimilation into amino acids, some of which cycle back to the bacteroid. But what is known of regulation is dwarfed by the unanswered questions: How is the infection thread formed? How does the plant allow infection while preventing uncontrolled growth of bacteria? What determines how much of the plant’s photosynthetic products is harvested by the bacteria? Why is hydrogen gas released, and how can this loss of potential energy be prevented? What limits the host specificity of rhizobia to legumes, and can it be extended to other crop plants, such as corn? Research on these questions is critical for agriculture.
Thought Question
21.10 High levels of nitrate or ammonium ion corepress the expression of Nod factors (see Fig. 21.15). What is the biological advantage of Nod regulation?
Photosynthetic Endosymbionts of Animals
Photosynthetic animals were once thought to be the stuff of science fiction. Microbial ecologists, however, have discovered photosynthesis occurring in animals by elaborate mutualisms that involve various kinds of protists, bacteria, and archaea interacting with host invertebrate animals. Many invertebrate animals possess symbiotic bacteria and archaea that provide antimicrobial activity or defense against predation (discussed in Chapters 18, 19, and 20). A mutualism of major importance for marine ecosystems is that of corals and dinoflagellates, which is essential for the growth and sustenance of coral reefs (Fig. 21.17A).
Besides corals, other cnidarians, such as jellyfish, anemones, and hydras, possess endosymbiotic algae. The most common algal partners are dinoflagellates of the genus Symbiodinium (discussed in Chapter 20). The algae receive protection from predators, while the animal receives photosynthetic products. Coral endosymbionts are extremely important to the biosphere because healthy coral is required for reef formation and much of the biological productivity of coastal shelf ecosystems. The unprecedented rise in temperature caused by human-made CO 2 emissions has already led to severe problems with coral bleaching, in which the algal symbionts die or are expelled. The coral turns white and soon dies, unless its symbionts return.
FIGURE 21.17 ■ Animals harbor endosymbiotic algae. A. Coral polyps carry mutualistic dinoflagellates of the genus Symbiodinium. B. Salamander embryo (Ambystoma maculatum ) colonized by green algae (Oophila amblystomatis), which provide oxygen and fixed carbon, accelerating embryonic growth. Inset: Oophila algae prior to colonization.
OXFORD SCIENTIFIC/GETTY IMAGES
RENN TUMLISON, HENDERSON STATE UNIVERSITY
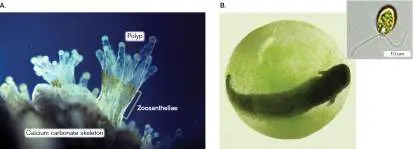
E. KIM ET AL. 2014. PLOS ONE 9 :E108915
A given coral or anemone may harbor several different species of Symbiodinium, which show different preferences for light or shade and different tolerances for temperature change. Studies of coral bleaching due to temperature increase suggest that corals containing diverse species of symbionts are more likely to survive, because one of their species may happen to be resistant to a rise in temperature.
Photosynthetic mutualism was thought to be limited to invertebrates until a vertebrate example was discovered: the colonization of salamander embryos (Ambystoma maculatum) by green algae (Oophila amblystomatis; Fig. 21.17B ). These algae are chlorophytes, primary algae with chloroplasts similar to those of green plants (discussed in Chapter 20). Initially flagellated, they lose their flagella after they have invaded the salamander embryo. Within the embryo, the algae multiply to a limited population, producing oxygen and photosynthetic carbon products that are used by the growing embryo. The algae benefit by receiving CO 2 and a nitrogen source (ammonia) from the embryo. Embryos lacking partner algae grow more slowly and show lower rates of survival.
Insects Possess Intracellular Bacteria
A remarkable form of endosymbiosis is the possession of intracellular bacteria by most species of insects. In most insects the bacteria are inherited from mother to offspring, and their relationship is obligate: Bacteria and insect require specific functions from each other. The bacteria provide essential nutrients, such as amino acids and vitamins, whose biosynthetic pathways the insect cells have lost through evolution. In turn, the insect cell provides numerous functions lost from the bacterial genomes by reductive evolution. Endosymbionts may also defend the host insect from parasites and viruses.
A complex case is that of the tsetse fly, Glossina morsitans, the vector for the trypanosome of sleeping sickness (described in Chapter 20). The tsetse fly carries several kinds of intracellular endosymbionts (Fig. 21.18). Wigglesworthia is a gammaproteobacterium, an obligate endosymbiont with its genome decreased to only 700,000 bp. The bacteria are found in various parts of the fly but are concentrated in a specialized organ around the midgut, called the bacteriome. They produce B vitamins essential for fly larvae to develop. Another bacterium, Wolbachia, is related to the rickettsias, intracellular infectious agents of humans. Wolbachia resides in the fly germ cells, where it enhances the fertility of infected female embryos while decreasing the growth of uninfected embryos. Sodalis enterobacteria are considered secondary endosymbionts with a lesser relationship to the host. These bacteria may increase the tsetse fly’s susceptibility to infection by the trypanosome.
FIGURE 21.18 ■ Intracellular endosymbionts of the tsetse fly. Wolbachia infects germ cells and prevents male development, favoring females. Wigglesworthia provides vitamins and enhances female fertility. Sodalis may increase the tsetse fly’s susceptibility to trypanosomes.
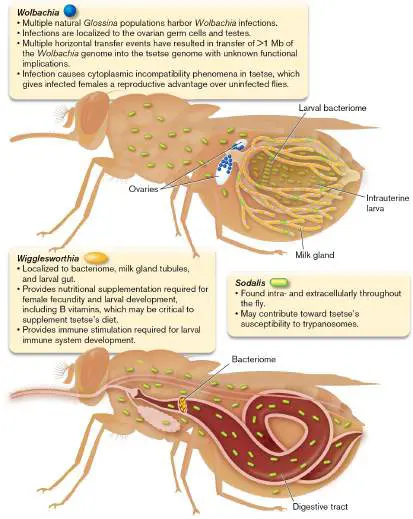
Source: Modified from International Glossina Genome Initiative. 2014. Science 344 :380, fig. 2.
An amazing feature of the tsetse fly’s long evolutionary association with bacterial endosymbionts is the acquisition of a large portion of a Wolbachia genome within the nuclear genome of the fly. In addition, the fly’s genome has acquired portions of genomic DNA of a virus associated with a parasitoid wasp. The functional effect of these genomic acquisitions remains unclear.
Symbiosis Involves Varying Degrees of Cooperation and Parasitism
Symbiosis between organisms involves a range of interdependence, from obligate mutualism (cooperation) to obligate parasitism (Table 21.3). In a gut community, some of the microbial members may enhance each other’s growth, but they can also grow independently. Their optional cooperation is called synergism, in which both species benefit but can grow independently and show less specific cell communication. For example, human colonic bacteria produce fermentation products that colonic methanogens metabolize to methane. The methanogens gain energy, and the fermenting bacteria benefit energetically through the steady-state removal of their end products. The bacteria found within marine sponges may offer an example of synergism. These bacteria fix carbon or secrete defense chemicals that protect the host sponge.
In other cases, one species derives benefit from another without return; for example, some wetland bacteria derive benefit from Beggiatoa because Beggiatoa bacteria oxidize H 2 S, which inhibits growth of other species. An interaction that benefits one partner only is called commensalism. Commensalism is difficult to define in practice, because “commensal” microbes often provide a hidden benefit to their host. Beggiatoa, for example, requires a source of H 2 S, probably produced by other community microbes. In the human gut, bacteria such as Bacteroides species were considered commensals until it was discovered that their metabolism aids our digestion.
An interaction that harms one partner nonspecifically, without an intimate symbiosis, is called amensalism. An example of amensalism is actinomycete production of antimicrobial peptides that kill surrounding bacteria. The dead bacterial components are then catabolized by the actinomycete.
Finally, parasitism is an intimate relationship in which one member (the parasite) benefits while harming a specific host. Many microbes have evolved specialized relationships as parasites, including intracellular parasitic bacteria such as the rickettsias, which cause diseases such as Rocky Mountain spotted fever.
The distinction between mutualist and parasite is often subtle. Lichens consist of a mutualistic association between fungus and algae, but environmental change can convert the fungus to a parasite. On the other hand, parasitic microbes may coevolve with a host to the point that each depends on the other for optimal health. For example, the high incidence of human allergies is proposed to correlate with lack of exposure to parasites that stimulate development of the immune system. Multiple partner species can form a complex web of positive and negative dependence. An example is the leaf-cutter-ant symbiosis with fungi, which includes a fungal mutualist, a fungal parasite, and a bacterial mutualist that counteracts the parasite.
To Summarize
Symbiosis is an intimate association between organisms of different species.
Mutualism is a form of symbiosis in which each partner species benefits from the other. The relationship may be obligatory for growth of one or both partners.
Lichens are a mutualistic community of algae and/or cyanobacteria interacting with fungi. Lichens are essential producers for dry soil habitats.
Rhizobia induce legume roots to nodulate for nitrogen fixation. The bacteria enter the root as infection threads. Some of the bacteria enter root cells and develop into nitrogen-fixing bacteroids, which gain energy from plant cell respiration but must remain anaerobic.
Some animals harbor endosymbiotic algae that provide products of photosynthesis. Corals and other cnidarians harbor mutualistic dinoflagellates. Embryos of one salamander species carry photosynthetic green algae. Insects harbor intracellular obligate endosymbiotic bacteria that have highly degenerate genomes.
Intracellular endosymbionts have evolved ancient relationships with their host, resulting in genome degradation and essential contributions to the host physiology. Parasitism is a form of symbiosis in which one species grows at the expense of another, usually much larger, host organism.
Interactions of multiple species can include both mutualism and parasitism.
Glossary
symbiosis pl. symbioses The intimate association of two different species.
symbiosis pl. symbioses The intimate association of two different species.
mutualism A symbiotic relationship in which both partners benefit. lichen A simple multicellular organism formed by a mutualistic relationship between a fungus and an alga or cyanobacterium. rhizobium pl. rhizobia A bacterial species of the order Rhizobiales that forms highly specific mutualistic associations with plants in which the bacteria develop into intracellular bacteroids that fix nitrogen for the plant.
rhizobium pl. rhizobia A bacterial species of the order Rhizobiales that forms highly specific mutualistic associations with plants in which the bacteria develop into intracellular bacteroids that fix nitrogen for the plant.
bacteroid A cell wall–less, undividing, differentiated rhizobial cell within a plant cell. The bacteroid provides fixed nitrogen for the plant. coral bleaching The death or expulsion of coral algal symbionts. One cause is an increase in temperature.
synergism Cooperation between species in which both species benefit but can grow independently. The cooperation is less intimate than symbiosis.
commensalism An interaction between two different species that benefits only one partner.
amensalism An interaction between species that harms one partner but not the other.
parasitism A symbiotic relationship in which one member benefits and the other is harmed.
Fig. 18.27 FIGURE 18.27 ■ Rhizobia: legume endosymbionts. A. Legume nodules cut open to show pink regions where the plant cells produce leghemoglobin to maintain anaerobic conditions for bacteroid nitrogen fixation. B. Leghemoglobin is the source of beef-like color and flavor of the “Impossible Burger.” C. Clover root hair curls around infecting Sinorhizobium meliloti. The bacteria enter the curl and grow down the root hair as an infection thread that penetrates the legume cells, enabling the bacteria to colonize in the form of bacteroids.
MARIANGELA HUNGRIA
JOHN D. IVANKO/ALAMY STOCK PHOTO
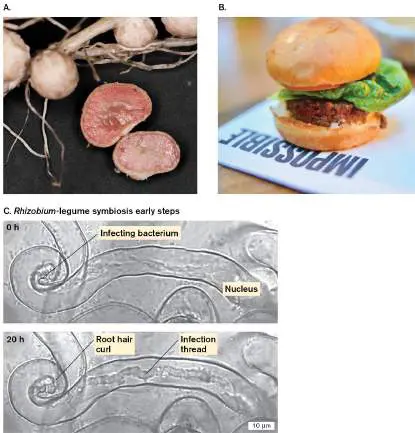
J. FOURNIER ET AL. 2008. PLANT PHYSIOL. 148 :1985-1995. © 2008
AMERICAN SOCIETY OF PLANT BIOLOGISTS
21.4 Animal Digestive Microbiomesnot assigned
All animals have microbial communities on their surfaces or within organs that serve as digestive chambers, such as the bovine rumen or the human intestines. Many host-associated microbes have beneficial effects, such as enhancing digestion or generating protective substances in the skin. The beneficial properties are so essential that an animal is now considered a holobiont, an entity composed of multiple types of organisms, including microbes. By contrast, a relatively small proportion of animal-associated microbes cause disease. Human microbial interactions with the immune system are discussed in Chapter 23. Pathogenesis and disease in humans are discussed in Chapters 25 and 26.
The Termite Wood-Digesting Microbiome
A particularly complex metabolic mutualism is that of termites, whose digestive tract contains bacteria that catabolize wood polysaccharides such as cellulose. The termite feeds on wood and is completely dependent on its symbiotic bacteria and protists.
Wood particles ingested by the termite consist of cellulose and hemicellulose sugar chains entwined with complex aromatic polymers called lignin. Within the termite digestive organ (called the hindgut), its bacteria form highly complex associations with protists such as Mixotricha paradoxa (Fig. 21.19), which can be as long as half a millimeter. Mixotricha and other metamonad protists (see Chapter 20 ) partly break down the lignin component of wood fibers. It is not clear whether Mixotricha gains energy from lignin, but the breakdown of fibers makes cellulose available for bacterial catabolism. FIGURE 21.19 ■ Mixotricha paradoxa: a multispecies symbiotic community. A. Wood lignocellulose is degraded by Mixotricha paradoxa. The flagellated protist possesses attached spirochetes (large and small species), “anchor bacteria,” and two kinds of bacterial endosymbionts. B. Soldier termites, Reticulitermes flavipes, contain Mixotricha (SEM) and other gut endosymbionts that digest wood cellulose. C. TEM section through Mixotricha ’s pellicle, including anchor bacteria and attached spirochetes.
M. WENZEL ET AL. 2003. EUR. J. PROTISTOL. 39 :11.
A. BRUNE. 2013. IN THE PROTISTS. SPRINGER, BERLIN
M. paradoxa is covered with cilia and flagella and possesses several kinds of bacterial symbionts. The protist takes up termite-ingested wood particles by phagocytosis, and then the protist’s intracellular bacteria digest the wood polysaccharides. Mixotricha also has organelles that appear to be vestigial remnants of another
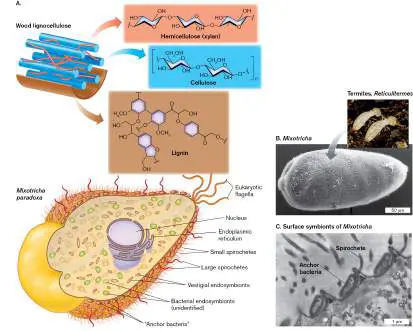
endosymbiont, diminished by reductive evolution. On the protist’s surface, four kinds of bacteria are attached. Two of the attached species are spirochetes, one significantly larger than the other. The spirochetes extend from the protist’s cell membrane; they are flagellated, and their flagellar motility propels the protist cell. Two other species of “anchor bacteria” are Gram-negative rods attached to knobs of the protist surface. All members of the partnership have evolved an obligate relationship.
The relationship among microbial symbionts within the termite gut community generates a complex series of metabolic fluxes (Fig. 21.20). This kind of metabolic cooperation is called syntrophy, which means “feeding together.” For syntrophy, the fluxes within the community must balance energetically with a negative value of Δ G, as they would for a single free-living organism (discussed in Chapter 13). Most commonly, one species produces a substance that is consumed by the second species, which, if left to build up in high concentration, would result in an unfavorable Δ G for its continued production.
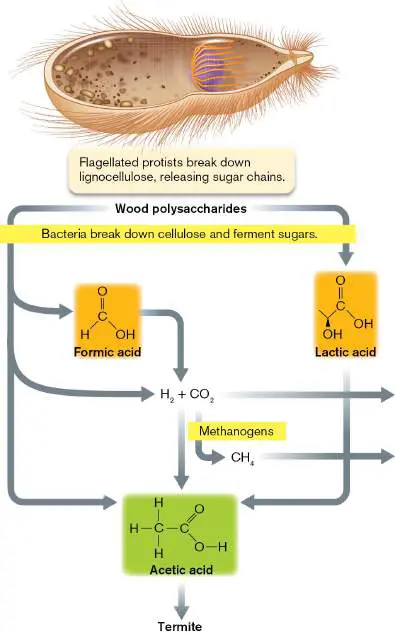
FIGURE 21.20 ■ Metabolic fluxes within the syntrophic community of the termite hindgut. Bacteria and their protist symbionts ferment wood polysaccharides to lactic acid, formic acid, acetic acid, H 2, and CO 2 within the hindgut of a termite, Reticulitermes santonensis. Some hydrogen is lost from the gut, some is converted to methane, and some is converted to acetic acid. Acetic acid is absorbed through the outer lining and feeds the termite.
In the simplified model shown in Figure 21.20, the wood polysaccharides are hydrolyzed by bacteria and fermented to short-chain fatty acids, such as acetic acid, which is absorbed by the termite. (The termite’s metabolism then oxidizes the acetate to CO 2.) Other products of the termite bacterial fermentation include CO 2 and H 2, which can be converted to methane by methanogenic archaea. In some termites, the H 2 builds up to levels as high as 30%. The termite microbial mutualism is being studied as a model system for production of hydrogen biofuel.
The Cockroach: Measuring a Mutualistic Contribution
For complex microbial communities, how do we assess the actual contribution of a gut microbiome to its host? Recall that a symbiosis can include a range of associations, all the way from absolute mutualism to parasitism (Table 21.3). For example, low-prevalence members of the human gut such as Clostridioides difficile can cause severe pathogenesis. In between are commensals that take advantage of their host without harm or benefit.
Microbial ecologists are just beginning to attempt to quantify the contributions of gut microbiomes as a whole and of individual taxa such as Bifidobacterium that produce neurotransmitters and may be associated with brain modulation. Here we present one experiment that provides one measure of microbial contribution to host development: the gut microbiome of a cockroach (Fig. 21.21). In this experiment, Zakee Sabree’s group at the Ohio State University tested whether cockroaches raised without bacteria showed different development of their digestive tracts when compared to insects raised with normally occurring gut microbiomes. For the experiment, one set of insects was raised from sterilized egg cases and fed sterilized food. A subset of those insects was then provided unsterilized food once, while a control set of insects was provided unsterilized food from the start. After all three sets of insects were fed for a week, the digestive tracts were dissected and measured for five aspects of their anatomy. One aspect, the gut tube perimeter, is shown in Figure 21.21B . The perimeter was measured at four sections across different positions of the digestive tube.
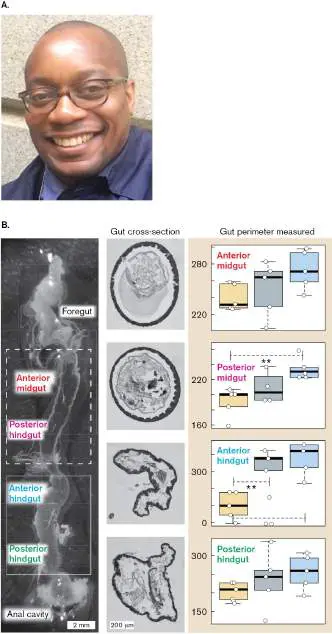
FIGURE 21.21 ■ Developmental contribution of a microbiome. A. Zakee Sabree at the Ohio State University showed that the cockroach digestive tract requires a microbiome for full development. B. The gut perimeter was measured (in units of micrometers) at four sections across the gut, for insects lacking microbes (tan), after one dose of microbes (gray), and possessing a full gut microbiome (blue).
Source: Benjamin Jahnes et al. 2021. J. Insect Physiol. 133 :104274.
COURTESY OF ZAKEE SABREE
B. C. JAHNES ET AL. 2021. J INSECT PHYSIOL. 133 :104274
The results showed that some parts of the gut perimeter were increased for insects exposed once to normally occurring bacteria, and that a larger difference was seen for the control organisms that possessed a typical gut microbiome. Overall, this experiment indicates a substantial influence of microbes on the cockroaches’ gut tube development. Similar experiments in vertebrate animals such as mice indicate various associations between the microbiome and development of the gut and immune system and between the microbiome and the brain and behavior.
The Bovine Rumen Fermenter
All vertebrate animals possess microbiomes that make some contribution to digestion, releasing energy-yielding substrates for the host. From a genomic standpoint, such an arrangement makes evolutionary sense. If the animal had to digest all the diverse polysaccharide chains encountered in nature, its own genome would have to encode a wide array of different enzyme systems. Instead, animals rely on diverse microbial species to conduct various kinds of digestion (discussed in Chapter 13). As we saw for termites, microbes that partly digest a substrate provide short-chain fatty acids (SCFAs) that the host animal can absorb and digest to completion by aerobic respiration.
The best-known digestive microbiomes are those of ruminants, such as cattle, sheep, and caribou. Throughout most of human civilization, ruminants have provided us with protein-rich food, textile fibers, and mechanical work. A historical reference is the biblical prescript for consuming an animal that “is cleft-footed and chews the cud”; that is, “ruminates,” or redigests its food in the fermentation chamber known as the rumen.
The bovine gut system has four chambers (Fig. 21.22A). As the cow ingests feed, the material undergoes partial digestion in the rumen and the reticulum. The reticulum breaks the feed into smaller pieces and traps indigestible objects, such as stones or nails. After initial digestion, feed is regurgitated for rechewing and then returned to the rumen, by far the largest of the chambers. In the rumen, feed is broken down to small particles and fermented slowly by thousands of species of microbes. Rumen inhabitants include Firmicutes genera such as Ruminococcus, Megasphaera, and Clostridium, and chytridiomycete fungi such as Neocallimastix, which break down cellulose and complex plant fibers. Fermentation produces hydrogen and carbon dioxide gases, which support methanogens such as Methanobrevibacter and Methanosarcina. Thus, all three major domains of life are represented by the normal rumen microbiome.
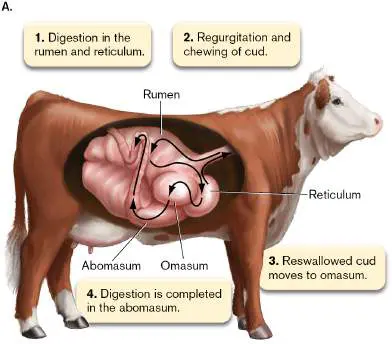
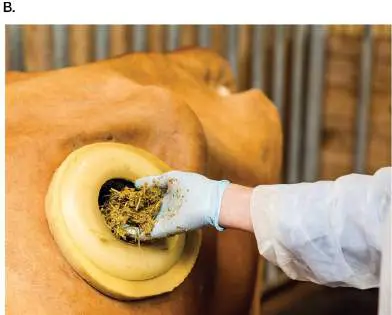
FIGURE 21.22 ■ The bovine rumen. A. The rumen is the largest of four chambers in the bovine stomach. B. A researcher samples rumen contents from a fistulated (cannulated) cow. The closable opening does not harm the animal. C. Ruminococcus albus bacteria digest plant fibers within the rumen of a cow.
PHOTO BY MICHAEL HERTEL/PICTURE-ALLIANCE/DPA/AP IMAGES
A. EZER ET AL. 2008. J. BACTERIOL. 190 :8220
The partially digested feed passes to the omasum, which absorbs water and short-chain acids produced by fermentation. The abomasum then decreases pH and secretes enzymes to digest proteins before sending its contents to the colon for further nutrient absorption and waste excretion.
In the twentieth century, Robert Hungate (1906–2004) at UC Davis pioneered techniques of anaerobic microbiology. One of Hungate’s methods still in use today is that of obtaining anaerobic
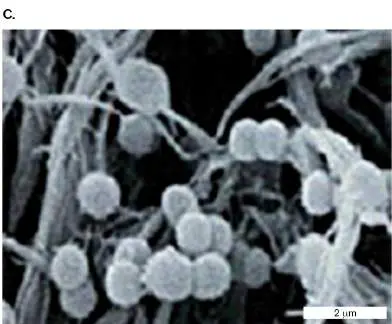
cultures from a fistulated, or cannulated, cow; that is, a cow in which an artificial connection is made between the rumen and the animal’s exterior (Fig. 21.22B ). The cow is unharmed by the fistula and rumen sampling. Unlike other gut microbiomes, rumen sampling thus allows the opportunity to sample an active microbiome within the animal, instead of sampling feces or anatomical dissection. Metagenomics coupled with bioenergetic studies shows how different microbes fill different niches in ruminal metabolism (Fig. 21.23). Cattle grown on relatively poor forage (that is, forage high in complex plant content) show a high proportion of ruminal fungi, the chytridiomycetes (discussed in Chapter 20). Chytridiomycete mycelia appear on ruminal food particles, and their motile zoospores —formerly mistaken for protists—swim through rumen fluid. By contrast, cattle fed a high-cellulose diet, such as hay, grow faster and show cellulolytic bacteria such as Ruminococcus albus and Fibrobacter flavefaciens. The cellulolytic bacterial metabolism also requires the presence of Megasphaera and Peptostreptococcus species, which release small amounts of branched-chain fatty acids. Thus, while bacteria compete for food, they also share in a complex web of syntrophy.
FIGURE 21.23 ■ Ruminal metabolism. Various microbes participate in digesting food, ultimately producing short-chain fatty acids that are absorbed by the bovine gut epithelium.
Source: Modified from J. B. Russell and J. L. Rychlik. 2001. Science 292 :1119–
1122.
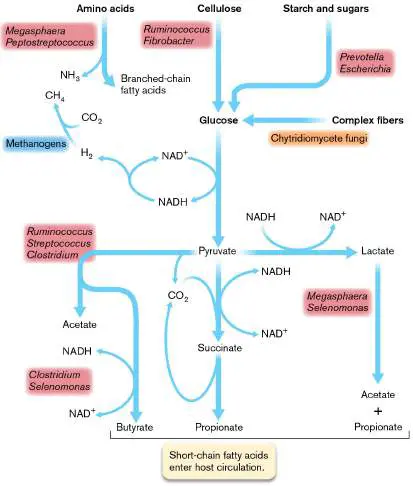
Ruminal fermentation includes production of H 2 and CO 2, which support methanogens. From a farmer’s point of view, methanogenesis wastes valuable carbon from feed and emits the greenhouse gas methane. So much methane forms that a cannula inserted into the rumen liberates enough of the gas to light a flame. Other vertebrate digestive tracts produce less methane than cattle do, but even humans generate some methane from our gut methanogens.
Thought Questions
21.11 How does ruminant microbial fermentation provide food molecules that the animal host can use? How is the animal able to obtain nourishment from waste products that the microbes could not use?
21.12 How do you think cattle feed might be altered or supplemented to decrease methane production?
The Human Colon
In contrast to ruminants, humans (and other vertebrates)
conduct much of their microbial fermentation at a much later stage of digestion, in the colon, which (unlike the rumen)
resides near the end of the digestive tract (Fig. 21.24).
Nonetheless, some prevalent genera of the rumen, such as Ruminococcus and Clostridium, are also represented in the human colon. The genomic coding capacity of human gut microbes may exceed that of the human genome by a factor of 100.
FIGURE 21.24 ■ Human gut microbiome digests our food and influences host development and function. In a “restaurant” mixed-species biofilm, Bacteroides bacteria break down glycans into sugars that Escherichia coli catabolizes, consuming oxygen from the host blood supply. The sugars may also feed pathogens, which stimulate an immune response.
Bacteria release peptides and neurotransmitters that influence brain function. SCFAs = short-chain fatty acids.
Colonic fermentation favors bacteria capable of digesting complex plant materials that pass undigested through the small intestine. For example, Bacteroidetes genera such as Bacteroides and Prevotella ferment mucopolysaccharides, pectin, and arabinogalactan, among many other compounds. Because the colonic oxygen pressure is low, most bacterial digestion is fermentative, releasing acetate and other short-chain fatty acids (SCFAs) that are absorbed by the intestinal
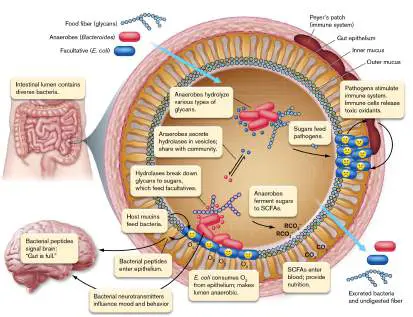
epithelium, thus providing up to 15% of our caloric intake. Amazingly, our bodies also use amino acids synthesized by gut bacteria. Human gut bacterial taxa. Human enteric metagenomes reveal an extraordinary range of bacterial and archaeal taxa, which vary by individual, diet, age, and health conditions. Besides Bacteroides, other major taxa include Firmicutes such as Clostridium and Lactococcus, Actinobacteria such as Bifidobacterium, and Verrucomicrobia such as Akkermansia (bacterial diversity is surveyed in Chapter 18). The ratio of Firmicutes to Bacteroidetes evolves over the human lifetime, with Firmicutes predominating in adults while Bacteroidetes dominate in infants and the elderly.
As in the bovine rumen, diverse colonic bacteria both compete with each other and collaborate through syntrophy. Bacteroides species release outer membrane vesicles of hydrolases that break down various types of glycans (polysaccharides) to release oligosaccharides (short-chain sugar polymers). These oligosaccharides may be picked up by other species of Bacteroides and Bifidobacterium that break them down further, to SCFAs. Some fermentation products support methanogens such as Methanobrevibacter smithii.
In assessing the functional importance of various taxa, a major challenge is the lack of cultured isolates. With novel culture methods, recent studies report culturing as much as 40% of microbes counted by microscopy (see Section 21.2). Culture of various isolates has been obtained by inclusion of specific nutrients in growth media; by replacing agar with a different gelling agent, such as the acetylated polysaccharide gellan (trade name Gelrite); and by culture under strict anoxic conditions.
Another approach that has enabled culture of previously uncultured gut taxa is antibiotic selection (Fig. 21.25). Morten Sommer’s group at the Technical University of Denmark showed that inclusion of broad-spectrum antibiotics in the culture medium inhibits antibiotic-sensitive organisms present in relatively high proportion, such as Bacteroidetes and Enterobacteriaceae, while permitting growth of low-abundance taxa with higher tolerance for the antibiotics. For example, culture of gut community samples with media containing erythromycin and sulfonamide allowed the growth of Oscillibacter, a bacterium previously predicted from metagenome sequences. The graph in Figure 21.25B shows the percentage of colonies from a gut sample that were shown to be Oscillibacter, depending on the antibiotics included in the medium. Oscillibacter is of particular interest as an organism that may be associated with avoidance of Crohn’s disease. Such health-associated organisms are cited on the Human Microbiome Project’s (HMP) “Most Wanted” list; that is, metagenome-predicted organisms most desired for isolation and culture.
FIGURE 21.25 ■ Cultivating previously uncultured gut microbes by antibiotic selection. A. Including one or more antibiotics in the culture medium results in isolation of taxa missed by the control. B. An isolate related to Oscillibacter ruminantium forms colonies on media containing erythromycin and sulfonamide. C. Minimum inhibitory concentration (MIC) of various antibiotics for the Oscillibacter isolate. Cipro = ciprofloxacin.
Source: Modified from E. A. Rettedal et al. 2014. Nat. Commun. 5 :4714, figs.
3a (part A) and 3e (parts B and C).
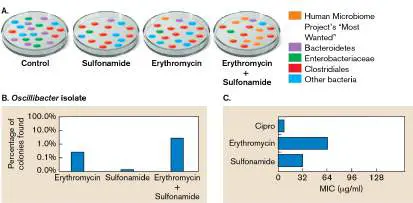
Gut bacteria–host interactions. A problem for the colon is the relatively short retention time of the human digestive tract. To remain in the colon with continual resupply of nutrients, Bacteroides and other anaerobes may form mixed biofilms with Escherichia coli that adhere to the epithelium in the outer mucus layer (Fig. 21.24 ). The mucus layer turns over every 2 hours, but E. coli growth can outpace the rate of shedding. The mixed biofilm benefits both bacterial partners, as E. coli gains access to sugars while reducing oxygen that leaks in from the epithelium, sustaining the anoxic environment for fermenters.
The mixed biofilm has the added benefit of outcompeting pathogens. Most notably, the pathogen Clostridioides difficile is normally outcompeted by the typical human gut community. When the community is perturbed by antibiotic exposure, then C. difficile may grow and take over, causing severe gastrointestinal illness. The cure for “ C. diff,” as it’s called in the hospitals, is fecal bacteriotherapy; that is, restoring a normal gut microbiome by providing fecal samples from a healthy volunteer. Fecal bacteriotherapy is now a US FDA-approved procedure.
Gut microbiomes even help establish circadian rhythms in mammals, and they may influence the human experience of “jet lag.” A study of mice showed that mouse microbial populations vary over the daily cycle, and that restoring normal gut populations can overcome a genetic defect in the molecular clock that governs animal activity. In humans, jet lag induces abnormal fluctuations in the gut microbiome. Perhaps someday we will develop probiotic therapies for jet lag. Other kinds of microbial circadian rhythms are discussed in Chapter 10.
Bacteria have so many astonishing interactions with the human host that the gut microbiome is now considered a human organ. Microbial production of neurotransmitters via amino acid catabolism was discussed in Chapter 13. Researchers are actively investigating the existence of a “gut-brain axis” whereby microbial peptides and neurotransmitters modulate anxiety, hunger, and other brain functions. Gut bacteria participate in development of the immune system, as discussed in Chapter 23.
Health disparities. Like other medical microbial issues raised in this book, human microbiomes are subject to health disparities (see Section 1.1 and Section 28.6). The gut microbiome is involved in several human pathologies for which racial and socioeconomic disparities occur, such as diabetes, inflammatory bowel disease, and colon cancer. Limited studies show that people of differing ethnicities and socioeconomic status have different proportions of major taxa in their microbiomes. For example, in oral microbiomes the taxa proportions determined by 16S rRNA sequencing correlate strongly with ethnicity. The basis of the correlation is unknown. Important questions remain to be addressed about the role of microbiomes in health disparities.
Thought Question
21.13 How could you design an experiment to test the hypothesis that an animal makes use of amino acids synthesized by its gut bacteria?
To Summarize
Animals harbor digestive microbial communities. The microbes possess numerous digestive enzymes absent in the host genome.
Termite gut mutualists include protists that break down lignin, as well as bacteria that catabolize cellulose. A major by-product is hydrogen gas.
Syntrophy is a metabolic association between (at least) two species, requiring both partners in order to complete the metabolism with a negative value of Δ G.
The rumen of ruminant animals is a complex microbial digestive chamber. Rumen microbes, including bacteria, protists, and fungi, digest complex plant materials. The microbial digestion generates short-chain fatty acids that are absorbed by the intestinal epithelium.
The human gut microbiome contributes to our digestion. Anaerobes such as Bacteroides and facultative respirers such as E. coli form mixed biofilms.
Innovative culture methods reveal important members of the gut microbiome.
Commensal members of the gut microbiome normally outcompete pathogens. Antibiotic exposure may allow overgrowth of pathogens; the condition is cured by fecal bacteriotherapy.
Human gut microbes communicate with their host.
Commensal bacteria send chemical signals to our immune tissues and to our brain.
Glossary
holobiont An entity composed of multiple types of organisms, including microbes.
syntrophy Metabolic cooperation between two different species; usually one member releases a product whose removal by the second species enables the pair to metabolize with a negative value of Δ G.
rumen The first chamber of the digestive tract of ruminant animals such as cattle; the main site for microbial digestion of feed. fistulated cow Also called cannulated cow. A cow in which a hole in the skin has been connected surgically to a hole in the rumen and fitted with a cannula, allowing access for experimental analysis of the rumen.
cannulated cow See fistulated cow .
21.5 Marine and Freshwater Microbesnot assigned
What microbial communities inhabit the oceans? Oceans cover more than two-thirds of Earth’s surface, reaching depths of several kilometers and forming an immense habitat. Both oceans and freshwater support huge quantities of bacteria and algae, which drive vast ecosystems. Marine microbes contribute half the planet’s productivity (production of biomass). Marine and freshwater microbes form the base of the food chain for seafood, with enormous impact on humans.
Marine Habitats
Marine water has a salt concentration averaging 3.5% by weight. The major ions are Na + and Cl −, with substantial amounts of sulfate and iodide. The salt concentration is high enough to prevent growth of many aquatic and terrestrial bacteria, such as Escherichia coli. Nevertheless, salt-tolerant organisms such as Vibrio cholerae grow well over a broad range of salt concentrations.
The ocean varies considerably with respect to temperature, pressure, light penetration, and concentration of organic matter. In the open ocean (known as the pelagic zone), the water column is subdivided into distinct regions (Fig. 21.26): FIGURE 21.26 ■ Regions of marine habitat. The marine habitat subdivides into several categories. The coastal shelf region is defined as the water extending from the shoreline out to a depth of 200 meters. The pelagic zone (open ocean) includes several depth regions: the neuston, the microscopic interface between water and air; the euphotic zone of light penetration, where phototrophs can grow, down to 100–200 meters; the aphotic zone, which supports only heterotrophs and lithotrophs; and the benthos, at the ocean floor.
Neuston (about 10 μ m). The neuston is the air-water interface. Although extremely thin, the neuston layer contains the highest concentration of microbes. Many algae and protists have evolved so as to “hang” from the layer of surface tension that forms at the air-water interface.
Euphotic zone (100–200 meters). The euphotic zone, or photic zone, is the upper part of the water column, which receives light for phototrophs. In the open ocean, the euphotic zone extends down a couple hundred meters, whereas at the coastal shelf (<200 meters to the ocean floor), a higher
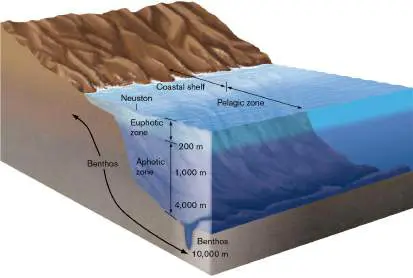
concentration of silt and organisms decreases the photic zone to as shallow as 1 meter.
Aphotic zone. Below the reach of sunlight, in the aphotic zone, only heterotrophs and lithotrophs can grow.
Benthos. The benthos includes the region where the water column meets the ocean floor, as well as sediment below the surface. Organisms that live in the benthos, such as those of thermal vent communities, are called benthic organisms.
Another important determinant of marine habitat is the thermocline, a depth at which temperature decreases steeply and water density increases. A thermocline typically exists in an unmixed region. At the thermocline, a population of heterotrophs will peak, feeding on organic matter that settles from above.
Coastal regions show the highest concentration of nutrients and living organisms and the least light penetration. By contrast, the open ocean is largely oligotrophic (having an extremely low concentration of nutrients and organisms). The concentration of heterotrophic microorganisms determines the biochemical oxygen demand (BOD; also called biological oxygen demand), the amount of oxygen removed from the water by aerobic respiration. Normally, the open ocean has such a low concentration of organisms that the BOD is extremely low; therefore, the dissolved oxygen content is high. This explains why enough oxygen reaches the ocean floor to serve chemolithoautotrophs such as sulfide-oxidizing bacteria. The BOD rises, however, when excess sewage or petroleum is present, such as that spilled by the Deepwater Horizon oil rig in 2010. Microbial consumption of these wastes at first deprives fish of oxygen, but the process is the only way the ocean recovers (see Figs. 21.6 and 21.7). FIGURE 21.27 ■ Submersible Alvin used by WHOI researchers for sampling deep marine organisms.
NOAA/SCIENCE STOCK
Marine Ecosystems: Where Are the Microbes?
To nineteenth-century microbiologists, the oceans appeared virtually free of bacteria. Trained in the tradition of Robert Koch (discussed in Chapter 1), microbiologists attempted to isolate marine bacteria by plate culture, considered the definitive way to study a microbial species. But the colonies that grew on traditional plate media were extremely few. Then, in 1959, the German microbial ecologist Holger
Jannasch (1927–1998) showed that many more bacteria could be seen by light microscopy than could be grown on plates. Later, with colleagues at the Woods Hole Oceanographic Institution (WHOI), Jannasch studied life at the ocean floor, using the famous submersible vessel Alvin (Fig. 21.27).
Today, emerging culture methods enable many uncultured organisms to grow in the laboratory. Often, microbial growth requires hidden synergy or mutualism with other organisms in the natural environment. For example, the tiny cyanobacterium Prochlorococcus is the ocean’s most abundant oxygenic phototroph, accounting for half the ocean’s photosynthesis. The abundance map in Figure 21.28, obtained from marine samples worldwide, shows that in most regions, Prochlorococcus outnumbers its relative Synechococcus by tenfold; the dominance of the tiny phototroph is due in part to its unusual chlorophylls, which absorb more of the blue light from the solar spectrum. Nevertheless, Prochlorococcus species are very difficult to grow in pure culture.
FIGURE 21.28 ■ Global distribution of marine phototrophs at the sea surface. A. Prochlorococcus abundance peaks in warmer water. B. Synechococcus is less abundant overall but reaches colder regions.
Source: Pedro Flombaum et al. 2013. PNAS 110 :9824.
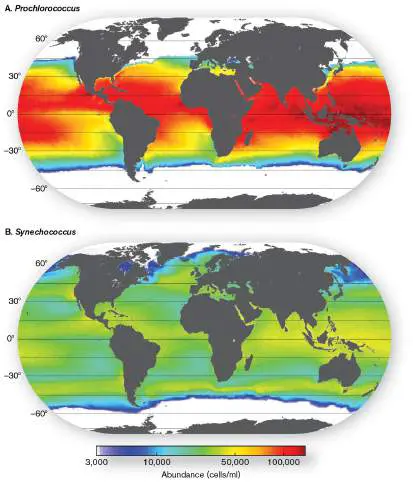
Jeff Morris (now at the University of Alabama at Birmingham) and colleagues at the University of Tennessee, Knoxville, showed that culturing Prochlorococcus in the laboratory requires the presence of a “helper bacterium” that catalyzes the breakdown of hydrogen peroxide, a by-product of oxygenic photosynthesis. The helpers produce catalase, an enzyme that Prochlorococcus has lost through reductive evolution, enabling more efficient growth when heterotrophs are present. Thus, in the ocean—as in gut microbiomes —microbes require surprising synergisms and symbioses in the midst of competition. Synergism, rather than single-species growth, may be the more common condition for microbes in nature.
The complexity of marine microbial ecosystems includes surprising connections with human medicine. A pioneering investigator of marine-medical connections is Rita Colwell at the University of Maryland. Colwell and her Bangladeshi associate Anwar Huq showed that the human cholera pathogen Vibrio cholerae is actually a mutualist of marine copepods (Fig. 21.29).
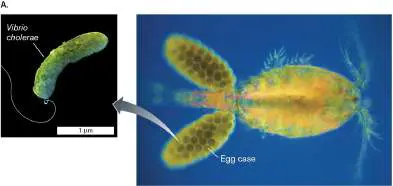
FIGURE 21.29 ■ Vibrio cholerae colonizes copepods. A. Copepod (SEM) with case of eggs to be “hatched” by Vibrio cholerae bacteria (inset; TEM). B. Filtering water through several layers of sari cloth prevents passage of contaminated copepods and thus prevents transmission of cholera. C. Rita Colwell directed pioneering studies of V. cholerae biology and sari cloth filtration.
AMI IMAGES/SCIENCE SOURCE
JAMES M. BELL/SCIENCE SOURCE
NITIN KANOTRA/HINDUSTAN TIMES VIA GETTY IMAGES
COURTESY OF RITA COLWELL
In natural water systems, most V. cholerae cells do not swim freely but colonize the surfaces of copepods (Fig. 21.29A). The copepods actually depend on these bacteria to eat through the chitin of their egg cases, releasing their young. Bacterial mutualists of copepods are virulent pathogens of humans, whose cholera diarrhea returns the bacteria to the water where they recolonize copepods. To decrease the incidence of cholera, Colwell and Huq showed that drinking water contaminated by V. cholerae could be partly decontaminated by filtering out the copepods through several layers of sari cloth (Fig. 21.29B ). Sari cloth filtration is now a common practice in Bangladesh. Thus, the elucidation of this complex microbial partnership reaped benefits for people threatened by cholera.
Marine Metagenomes
Marine microbial communities are now emerging via metagenomes. An example featured in Chapter 7 is Shinichi Sunagawa’s international study that sequenced 7.2 terabases (7.2 × 10 12 bp) of metagenomic data, including samples of all the world’s oceans. Another interesting study, conducted in 2016 by Jessica Bryant, Edward DeLong, and colleagues at the University of Hawaii at Manōa, focused on microbial communities associated with plastic debris in the North Pacific Ocean, known as the “great Pacific garbage patch.” The metagenomes showed a surprisingly consistent presence of Cyanobacteria and Alphaproteobacteria, as well as microscopic eukaryotes such as bryozoan invertebrates. The bacterial genomes showed a high prevalence of genes for chemotaxis, secretion systems, and nitrogen fixation. These findings will help us understand the fate of human wastes that flow into and degrade marine ecosystems.
As discussed in Section 21.2, even metagenomes miss community members that fill important niches. To find rare organisms with functional importance, researchers set out to explore expressed genes—a “metatranscriptome.” Sallie Chisholm and Edward DeLong, then at the Massachusetts Institute of Technology, sequenced the messenger RNAs (mRNAs) expressed by marine bacteria obtained from a Hawaiian research station. The RNA molecules were polyadenylated (a string of adenines was added) using an enzyme that favors mRNA and excludes ribosomal RNAs because of their high degree of secondary structure (intramolecular folding). The resulting RNA pool, enriched for expressed mRNA, was reverse-transcribed to DNA (called cDNA for “complementary DNA”). The cDNA was then amplified and sequenced.
The sequences of the cDNA (representing expressed genes) were compared to those amplified from metagenomic DNA of the same microbial community. The relative abundance of expressed and metagenomic sequences gives a measure of expression levels of all genes, which are plotted in declining rank order in Figure 21.30. The most highly expressed genes included those encoding functional elements of photosynthesis, such as light-harvesting proteins and Rubisco. Genes for DNA repair were also highly expressed, presumably to correct UV damage in the open ocean.
FIGURE 21.30 ■ Genes expressed in a marine microbial community. Expression of each gene is measured as RNA (copied to cDNA), divided by the gene’s relative abundance in the metagenome. The y -axis represents the ratio of cDNA to metagenomic DNA for all expressed genes, plotted in rank order (from highest to lowest). The relative abundance of the DNA sequence within the metagenome is color-coded. The genes most highly expressed tend to be rarest in the genome (colored red). Source: Jorge Frias-Lopez et al. 2008. PNAS 105 :3805.
But the most highly expressed genes were some of the rarest in the metagenomes (colored red in Fig. 21.30). And 40% of all the cDNA (expressed genes) had no counterpart in the genomic DNA (not shown in the figure). Thus, expression analysis does indeed reveal genetic sequences of organisms undetected in the metagenome, presumably too rare for detection by our current sequencing methods.
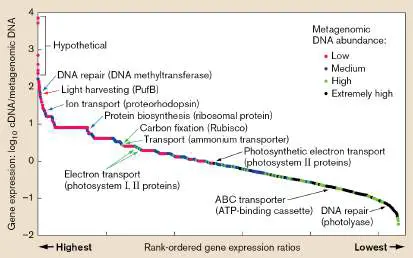
It also suggests that vast ranges of organisms may remain unreached by either genome or transcriptome sequencing.
Beyond DNA, microbial ecology addresses organisms in their relationships with their habitat and with each other. We will now introduce approaches to measuring microbial populations and their interactions within marine communities. These approaches have enormous practical applications, from the management of fisheries to the assessment of greenhouse gas fluxes (a topic pursued in Chapter 22).
Measuring Planktonic Communities
In marine science, the term plankton refers to organisms that float passively in water. Microbiologists use the term loosely, as microbial “plankton” include motile bacteria and protists. Marine phytoplankton (microbial phototrophs) produce a substantial part of the world’s oxygen and consume much of the atmospheric CO 2.
Microbial plankton, or microplankton, include numerous members of the three domains discussed in Chapters 18, 19, and 20: Bacteria, Archaea, and Eukarya, respectively. Nanoplankton (about 2– 20 μm) arbitrarily include smaller algae and flagellated protists, as well as filamentous cyanobacteria. Picoplankton (about 0.2–2 μm) consist of bacteria and the smaller eukaryotes, including the smallest living cells known. Besides these size classes of cells, the term “femtoplankton” may refer to marine viruses, the smallest detectable particles capable of reproduction. Note, however, that the use of these prefixes (“nano-,” “pico-,” “femto-”) is approximate and does not refer to size units such as nanometers.
Despite the definition of “plankton,” not all marine microbes float independently. Many form biofilms on colonial algae such as kelps or on suspended inorganic particles, which become known as marine snow. As many as half of all marine bacteria are associated with particulate substrates from broken-down organisms. Thus, while the ocean as a whole has a low average nutrient concentration, marine waters include a suspension of concentrated tangles of nutrient-rich substrates.
Marine snow now includes particles of plastic from human waste. The plastic takes much longer to degrade, but it quickly acquires biofilm growth. Figure 21.31shows marine mixed-species biofilms grown for 1 week on pieces of polyethylene floating in the tropical Atlantic Ocean, off the island of Grenada. The biofilms were imaged with CLASI-FISH, a procedure of FISH in which fluorophores of different colors are combined to hybridize the bacterial rRNA, generating multiple combinations that indicate specific bacterial taxa. In the samples shown, we distinguish bacteria of the taxa Bacteroidetes, Alphaproteobacteria, and Rhodobacteraceae. The chain of Bacteroidetes appears to attract associated Alphaproteobacteria (Fig. 21.31A). Such biofilm associations are common throughout environments—and those on plastic are more likely to evolve enzymes that break down plastic components (as described in Special Topic 21).
FIGURE 21.31 ■ Marine biofilms on plastic particles, imaged with CLASI-FISH. Polyethylene pieces were incubated for 1 week in the tropical Atlantic Ocean, off Grenada. Colors represent: yellow, Bacteroidetes; red, Alphaproteobacteria; cyan, Rhodobacteraceae; magenta, Gammaproteobacteria; blue, bacteria of unknown phyla. A. Chain of Bacteroidetes with associated Alphaproteobacteria and others. B. Colony of Rhodobacteraceae, with a few Alphaproteobacteria and others.
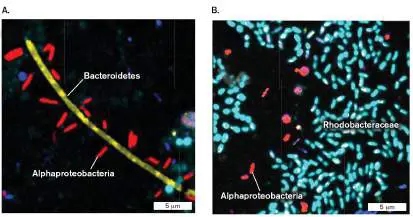
Source: Cathleen Schlundt et al. 2020. Mol. Ecol. Resour. 20 :620–634.
C. SCHLUNDT ET AL. 2019. MOL ECOL RESOUR. 20 :620–634
C. SCHLUNDT ET AL. 2019. MOL ECOL RESOUR. 20 :620–634
Population size can be estimated in different ways: the number of individual reproductive units, the total organic biomass available to consumers, or the rate of productivity or assimilation of key nutrients, such as carbon dioxide. All ways of measuring these quantities present challenges; there is no single right method, but different approaches answer different questions.
Fluorescence microscopy. Marine microbes of all sizes, even viruses, can be detected and counted under the microscope using a DNA-intercalating fluorescent dye. Recall that fluorescence enables detection even of particles whose size is below the resolution limit defined by the wavelength of light (discussed in Chapter 2). Fluorescence microscopy with a DNA-binding fluorophore such as 4′,6-diamidino-2-phenylindole (DAPI) is used for nonspecific detection of all living microbes.
Biomass. The amount of biomass can be determined by standard chemical assays of protein and other forms of organic matter. Net biomass of a population, however, does not indicate productivity within an ecosystem, because it misses the amount of carbon cycled through respiration. Marine microbes have an extremely rapid rate of turnover, but what appears to be a small population may nonetheless conduct tremendous rates of carbon fixation into biomass, which is rapidly consumed by the next trophic level.
Incorporation of radiolabeled substrates. The measured amount of biomass does not indicate the rate of biomass production. The rate of production can be estimated by the cells’ incorporation of a radiolabeled substrate. Uptake of 14 CO indicates the rate of
2
carbon fixation—a highly important property for the study of global warming. Uptake of 14 C-thymidine measures the rate of DNA synthesis, an indicator of the rate of cell division. These properties can be measured in seawater under native conditions, without requiring laboratory cultivation.
A limitation of these methods is that addition of the radiolabeled substrate may raise a nutrient concentration to artificially high levels that distort the naturally occurring rates of activity. In the case of labeled thymidine, another limitation is that not all growing cells incorporate exogenous thymidine into their DNA.
Planktonic Food Webs
Analysis of marine microbial food webs was pioneered by Farooq Azam, at the Scripps Institution of Oceanography at UC San Diego ( Fig. 21.32A). A simplified outline of the food web in the open ocean is shown in Figure 21.32B . The diagram of a food web is often called a “spaghetti diagram” because so many trophic interactions cross each other in various directions.
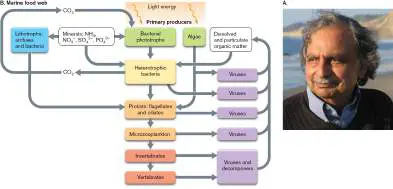
FIGURE 21.32 ■ The pelagic marine food web. A. Farooq Azam was elected to the American Academy of Arts and Sciences in 2016 for his fundamental contributions to the study of marine microbiomes. B. In the marine water column, the vast majority of carbon transfer occurs among microbes. Arrows lead from organisms consumed and point to their consumers. The primary producers are phototrophic bacteria and algae, with a smaller contribution from lithotrophic bacteria and archaea. Grazers include heterotrophic bacteria and protists. Predators include protist flagellates and ciliates. About 50% of bacterial and protist biomass is degraded by viral lysis. Multicellular organisms cycle a relatively small fraction of biomass. C. A more complex view of the marine food web includes mixotrophs (organisms that combine phototrophic and heterotrophic nutrition) and symbiotic associations between protists and phototrophic bacteria or algae.
SCRIPPS INSTITUTION OF OCEANOGRAPHY AT UC SAN DIEGO
The phototrophic producers of the open ocean are known as phytoplankton. The phytoplankton include cyanobacteria such as
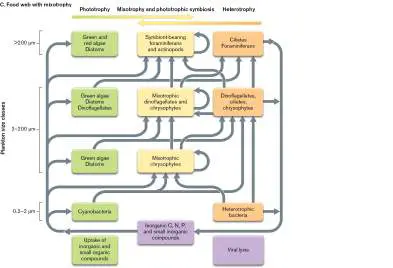
Prochlorococcus, Synechococcus, and Trichodesmium. Some cyanobacteria, such as Trichodesmium, fix nitrogen as well as carbon. The phytoplankton also include microbial eukaryotes such as algae, diatoms, and dinoflagellates. In the food web, bacteria and protists are consumed by larger protists, which feed small invertebrates, which in turn feed larger invertebrates and, ultimately, vertebrates such as fish.
All levels of microbial plankton undergo intense predation by viruses. The degree of viral predation is difficult to measure, but cell lysis by viruses breaks down about half of microbial biomass (discussed in Chapter 6). Virus particles represent a major sink for carbon and nitrogen. They accelerate the return of minerals to producers, a process called the “viral shunt.” The viral shunt necessitates a larger base of producers to sustain the ecosystem. Some marine viruses are highly host specific, infecting only certain species of dinoflagellates or cyanobacteria. Their presence selects for diverse communities containing numerous scattered species. Other viruses attack many hosts—and they can transfer genes from one host to another, such as the genes encoding photosystems. Thus, marine viruses are a dominant force determining community species distribution and genome content.
SPECIAL TOPIC 21 Marine Biofilm Bacteria Eat Plasticizers
Plastic pollution increasingly fills our oceans—including trace components that are far more toxic than the major material of a discarded object. For example, the bottles that contain our beverages are commonly produced with trace components called “plasticizers,” molecules that help shape the bottle structure ( Fig. ST 21.1 ). The plasticizers leach out of the bottles as the bottles decay in the ocean. Unfortunately, these molecules may have toxic effects on humans and may cause endocrine disruption in aquatic wildlife. An important question is: How do these molecules break down in the environment? Do marine bacteria catabolize them?
FIGURE ST 21.1 ■ Marine biofilm bacteria eat toxic plasticizers. Discarded plastic bottles contain plasticizer molecules such as dibutyl phthalate (DBP). Mycobacterium sp. DBP42 was isolated from a DBP enrichment culture of microbes obtained from marine plastic debris.
Source: Robin Wright. 2020. Environ. Sci. Technol. 54 :2244−2256.
RICH CAREY/SHUTTERSTOCK
Joseph Christie-Oleza (Fig. ST 21.2 ), now at the University of the Balearic Islands, Spain, set out to isolate plasticizer-eating bacteria from the ocean environment. Christie-Oleza’s research team reasoned that bacteria with such catabolism would be found in marine biofilms that grow upon particles of plastic
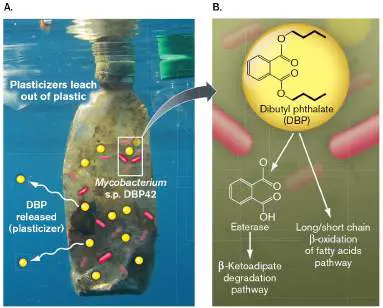
waste, where natural selection would favor microbes that could eat plasticizers. The researchers established a scheme of enrichment culture: First, they collected plastic debris from Atlantic Ocean water off Plymouth Sound, United Kingdom. Samples of debris were vortexed, and the detached material was incubated in a culture medium supplemented with plasticizer. Six different types of plasticizer were tested individually, including phthalic acid (PA) and dibutyl phthalate (DBP; structure shown in Fig. ST 21.1B ). After 3 weeks of incubation, turbid cultures were plated on a marine agar medium. Individual colonies were then restreaked and further cultured in marine medium supplemented with one of the plasticizers. Growth on DBP or related plasticizers involves esterase removal of the dibutyl groups and oxidative catabolism of the fatty acid hydrocarbons. FIGURE ST 21.2 ■ Biofilm isolates cultured on DBP. Two isolates from the DBP enrichment culture were grown on DBP as a carbon source.
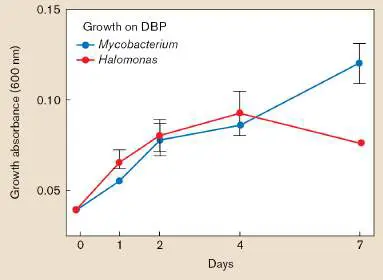
The researchers found ten isolates that grew well in medium containing one or another of the plasticizers. These isolates were then assigned taxa on the basis of 16S rRNA gene sequences. One isolate, designated Mycobacterium sp. DBP42, grew exceptionally well on all six plasticizers. M. DBP42 shares the genus of M. tuberculosis and of human commensals such as M. smegmatis. Another isolate that grew on five of the six plasticizers is Halomonas ATBC28. Figure ST 21.2 shows growth curves for both isolates on medium supplemented with DBP.
Christie-Oleza then asked: What metabolic pathway does M. DBP42 use to degrade DBP? First the M. DBP42 genome was sequenced. The annotated genome revealed a number of genes homologous to esterases and lipases of related bacteria. To determine which of these enzymes were used, the researchers analyzed the bacteria’s metabolome. The metabolome refers to the mixture of all metabolites, small-molecule intermediates produced by an active cell. The metabolites are separated by liquid chromatography, and then individual components are analyzed by two stages of mass spectrometry (MS-MS, as shown in Fig. 13.30). When the researchers cultured M. DBP42 on medium containing DBP, the metabolites found matched intermediates predicted by biochemical analysis of known related pathways for phthalate and lipid catabolism (Fig. ST 21.3A ).
FIGURE ST 21.3 ■ DBP catabolism in the metabolome and proteome. A. Metabolome analysis (see Fig. 13.30)
reveals the intermediate products of DBP catabolism by Mycobacterium sp. DBP42. B. Proteome analysis (see Fig. 8.30) reveals enzymes up-regulated in the presence of DBP or of related plasticizers phthalic acid (PA) or bis(2-ethyl hexyl) phthalate (DEHP).
Which enzymes in the genome perform these catabolic reactions? To identify the enzymes, the researchers tested the bacterial proteome, the group of all proteins synthesized by a cell during growth on a plasticizer. The proteins in a proteome are identified first by digestion with trypsin, an enzyme that cuts only after certain amino acids, producing a mix of defined small peptides (see Fig. 8.30). The small peptides are then identified by tandem mass spectrometry (MS-MS).
The researchers tested M. DBP42 cultured on DBP, as well as the related plasticizer molecules PA and bis(2-ethyl hexyl) phthalate (DEBP). They compared the proteome of each culture with that of a control culture in which glycerol was the carbon source, instead of a plasticizer (Fig. ST 21.3B ). It was predicted that genes of the putative DBP catabolic pathway
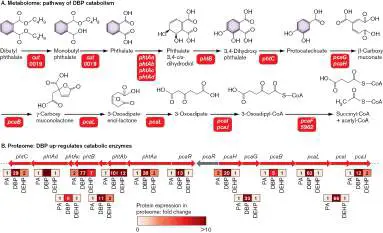
would be up-regulated in the cultures containing DBP, compared to cultures supplemented with glycerol. In fact, most of the genes in the proposed pathway were up-regulated by DBP. Some enzymes were also up-regulated by PA or by DEBP, suggesting that these enzymes participate in shared pathways for catabolism.
Fortunately, environmental microbes possess abundant abilities to evolve to eat new food sources, however slowly. In the laboratory, we might accelerate evolution to obtain bacterial partners for more rapid waste treatment.
RESEARCH QUESTION
Which metabolic steps are limiting for M. DBP42 breakdown of DBP and other toxic molecules? Can we engineer strains that overproduce key enzymes so as to more rapidly convert the molecules into harmless products?
Wright, Robyn J., Rafael Bosch, Matthew I. Gibson, and Joseph A.
Christie-Oleza. 2020. Plasticizer degradation by marine bacterial isolates: a
proteogenomic and metabolomic characterization. Environmental Science & Technology 54 :2244–2256.
Thought Question
21.14 How do viruses select for increased diversity of microbial plankton?
Ocean ecosystems contain a large number of trophic levels, of which the top consumers include fish and humans. Because each trophic level spends 90% of its food intake for energy, ecosystems require a huge lower foundation to sustain the highest-level consumers. This is one reason why fisheries worldwide are now in danger of running out of fish for human consumption: Fish are being harvested faster than the ecosystem can replace them.
Note that actual food webs are far more complex than this simplified model; see Figure 21.32C . One source of complexity is that many algal protists, such as chrysophytes (golden algae) and dinoflagellates, are actually mixotrophs, organisms that both fix CO 2 through photosynthesis and consume microbial prey. Mixotrophy offers the opportunity to grow at night, without light, and to acquire scarce minerals, such as iron, from prey. Mixotrophs include secondary endosymbiont algae (discussed in Chapters 17 and 20), such as kelp and sargassum weed, as well as protists containing cyanobacterial or algal endosymbionts.
Another complicating factor is the vast number of diverse taxa associated with marine animals, particularly actinobacteria that produce antimicrobial molecules (see Chapter 18). The microbiomes of marine animals provide a rich source of novel compounds for therapeutic and biotechnological applications.
The Ocean Floor
The ocean floor (benthos) experiences extreme pressure beneath several kilometers of water. Most organisms that live there are pressure-dependent species, known as piezophiles or barophiles (discussed in Chapter 5). Barophiles require high pressure for growth (200–1,000 atm), failing to grow when cultured at sea level. Cold temperatures (about 2°C) select for psychrophiles (cold-adapted species), whose rate of growth is relatively slow. In the absence of light, heterotrophic bacteria depend on detritus from above as their carbon source, but by the time any material reaches the benthos, much of the organic carbon has been depleted by prior consumers. Metagenomes of the benthos (deep ocean) show primarily Proteobacteria, Bacteroidetes, and Planctomycetes, as well as Archaea. Their genomes encode a large number of heavy-metal transport and resistance proteins, which help cells survive toxic metals upwelling from the ocean floor. These metal resistance genes may have practical applications for bioremediation.
Submersible research vessels continue to discover amazing new forms of benthic bacteria and archaea. Some of these microbes grow in thick biofilms at black smoker thermal vents, or hydrothermal vents, such as those of Guaymas Basin, in the Gulf of California (Fig. 21.33; discussed in Chapter 19). The clouds rising from the thermal vent are minerals precipitating as the superheated solution meets cold seawater. The reduced minerals from the vents support entire ecosystems of lithotrophic bacteria, including mutualists of uniquely evolved giant clams and worms. Many vent-dependent microbes are thermophiles, adapted to high temperatures (discussed in Chapter 5 ). Many are hyperthermophilic archaea such as Pyrodictium occultum, growing at temperatures above 100°C, which are reached only at high pressure (1,000 atm; discussed in Chapter 19).
FIGURE 21.33 ■ The thermal vent ecosystem. At thermal vents A. , volcanic activity causes upwelling of hydrogen sulfide and carbonates. The high concentrations of sulfides have selected for evolution of invertebrates that feed through mutualistic associations with H 2 S-oxidizing bacteria. The H 2 S oxidizers fix carbon from the carbonates, generating organic metabolites that feed their animal hosts. Vent bacteria within the trophosomes of tube worms B. provide energy from oxidation of hydrogen sulfide. Source: Part A from Raina Maier et al. 2000. Environmental Microbiology.
Academic Press. Reprinted by permission of Elsevier, Ltd.
OAR/NATIONAL UNDERSEA RESEARCH PROGRAM (NURP)
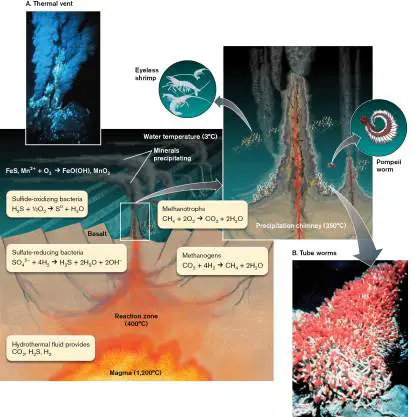
OAR/NATIONAL UNDERSEA RESEARCH PROGRAM (NURP)
The ocean floor provides reduced inorganic minerals, such as iron sulfide (FeS) and manganese (Mn 2+), that can combine with dissolved oxygen to drive chemolithoautotrophy (discussed in Chapter 14). Chemolithoautotrophy by microbes in the sediment generates a permanent voltage potential between the reduced sediment and the oxidizing water. As a result, the entire benthic interface between floor and water acts as a charged battery that can generate electricity. The benthic redox gradient is enhanced dramatically at hydrothermal vents (Fig. 21.33A), where volcanic activity causes upwelling of hydrogen sulfide (H 2 S), H 2, and carbonates. At a hydrothermal vent, these reduced minerals are brought up by seawater that seeps through the sediment until it reaches a magma pool, where it becomes superheated and rises to the surface as steam. Sulfate-reducing bacteria reduce sulfate from seawater with H 2 upwelling from the vent fluids to form H 2 S. As the H 2 S rises, it is oxidized by sulfur-oxidizing bacteria such as Thiomicrospira. Nearby anoxic sediment supports methanogens, and the methane they produce seeps up into the oxygenated water, where it is oxidized by methanotrophs.
The high concentrations of sulfides near thermal vents have selected for a remarkable evolution of invertebrate species that feed through mutualistic associations with H 2 S-oxidizing bacteria, such as the yeti crab. The H 2 S oxidizers fix carbon from the carbonates, generating organic metabolites that feed their animal hosts—species of worms, anemones, and giant clams, all closely related to surface-dwelling species that would be poisoned by H 2 S. The tube worm Riftia is colored bright red by a pigment carrying H 2 S and O 2 in its circulatory fluid (Fig. 21.33B ). The worm has evolved such a complete dependence on its symbionts that it has lost its own digestive tract. This kind of animal dependence on sulfide oxidizers turns out to be more common than we thought, as it also occurs at benthic “cold seeps” where hydrogen and methane seep slowly through cracks in the rock.
Freshwater Microbial Communities
Many features of marine habitats also apply to freshwater systems, such as lakes and rivers. Freshwater habitats, of course, contain much lower concentrations of salt, usually less than 0.1%. Large, undisturbed lakes are usually oligotrophic. Oligotrophic lakes have dilute concentrations of nutrients and microbes. The warm upper water layer above the thermocline supports oxygenic phototrophs such as algae and cyanobacteria. The thermocline is a steep transition zone to colder, denser water below, a region that becomes anoxic.
A lake that receives large concentrations of nutrients, such as runoff from agricultural fertilizer or septic systems, becomes eutrophic. In a eutrophic lake, the nutrients support growth of algae to high densities, causing an algal bloom. The bloom may actually consist of cyanobacteria, Microcystis aeruginosa (Fig. 21.34). Such blooms regularly affect Lake Erie in the summers, where Microcystis produces a liver toxin, microcystin, that contaminates water supplies. In August 2014, microcystin from Lake Erie blooms caused the city of Toledo to issue a “Do Not Drink or Boil” order for its water supply. Boiling does not remove the microcystin.
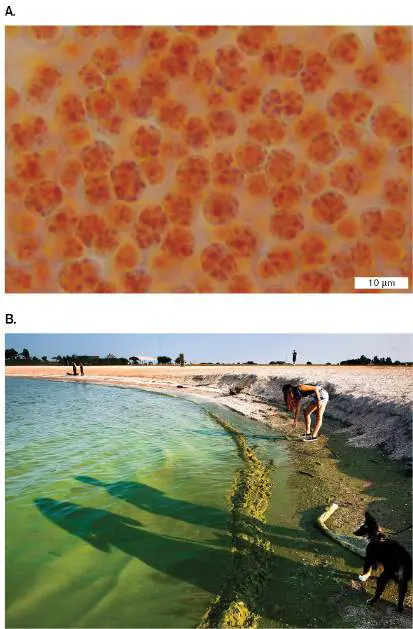
FIGURE 21.34 ■ Microcystis bloom on a freshwater lake kills fish. A. Microcystis aeruginosa cyanobacteria produce the toxin microcystin (stained LM). B. Shore of Lake Erie during a Microcystis bloom.
BIOPHOTO ASSOCIATES/SCIENCE SOURCE
THE WASHINGTON POST/GETTY IMAGES
As the bloom microbes die, they are consumed by heterotrophic bacteria, whose respiration removes all the oxygen. This oxygen loss causes the deep, anoxic region to reach nearly up to the surface of the lake. In a eutrophic lake, fish die off owing to lack of oxygen, which heterotrophic microbes have consumed. Such a region is called a dead zone. With increasing human pollution, dead zones now occur in the oceans as well as in lakes; marine dead zones are discussed in Chapter 22.
Common causes of eutrophication include: Phosphates. Because phosphorus is commonly a limiting nutrient (nutrient in shortest supply) for algae, addition of phosphates from detergents and fertilizers can lead to an algal bloom.
Nitrogen from sewage effluents and agricultural fertilizer runoff can lead to algal blooms by relieving nitrogen limitation.
Organic pollutants from sewage effluents overfeed heterotrophic bacteria, depleting the water of oxygen.
In a eutrophic lake, the lower layers have become depleted of oxygen as a result of overgrowth of microbial producers and consumers. Thermal stratification may break up, and the lake may mix one to several times per year, thus reoxygenating the entire lake. A permanently eutrophic lake typically supports ten times the microbial concentrations of an oligotrophic lake but shows greatly decreased animal life.
Anoxic water supports only anaerobic microbes. These include anaerobic phototrophs that do not produce O 2. Enough light may penetrate to support anaerobic H 2 S-oxidizing phototrophs such as Chlorobium and Rhodopseudomonas. Although H 2 S photolysis provides less energy than oxygenic H 2 O photolysis, these bacteria have evolved to use chlorophylls and accessory pigments whose spectrum extends into the infrared (Fig. 21.35; see also Chapter 14 ). Light in the infrared portions of the spectrum cannot be used for oxygenic photosynthesis, because the photon energy captured by bacteriochlorophylls is insufficient for the complex to split water. The less efficient H 2 S photolysis, however, can harness the energy of red and infrared radiation (discussed in Chapter 14).
FIGURE 21.35 ■ Absorbance spectra of lake phototrophs, including chlorophylls and accessory pigments. A, B. In the upper waters, algae and cyanobacteria absorb primarily blue and red. C. Below, where red has been absorbed by microorganisms above, anaerobic phototrophs such as Blastochloris absorb infrared (wavelengths beyond 750 nm).
H 2 S-oxidizing phototrophs include some cyanobacteria and purple proteobacteria, which overlap metabolically with anaerobic heterotrophs and lithotrophs that reduce oxidized minerals. Some proteobacteria, such as Rhodopseudomonas palustris or Rhodospirillum rubrum, can grow anaerobically with or without light; others grow only by anaerobic metabolism, unassisted by light. These low-oxygen bacteria form a flourishing community, but they cannot support oxygen-breathing consumers such as fish.
At the bottom of the water column, the water meets the sediment (benthos). In the benthic sediment, gradients develop in which successive electron acceptors are reduced by anaerobic respirers and by lithotrophs (Fig. 21.36). Electron acceptors that yield the most
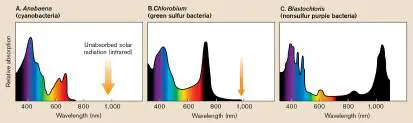
energy are consumed first; as each in turn is depleted, the electron acceptor with the most energy is consumed next. First, molecular oxygen is used to oxidize organic material and reduced minerals such as NH +. Below, as molecular oxygen falls off, bacteria use nitrate
4
(NO −) from oxidized ammonium ion as an electron acceptor to
3
respire on remaining organic material. As the nitrate is used up, still other bacteria use manganese (Mn 4+) as an electron acceptor, followed by iron (Fe 3+) and sulfate (SO 2−). Reduction of sulfate
4
leads to H 2 S, which eventually returns to the upper layers supporting anaerobic photolysis. Reduction of CO 2 by H 2 produces methane (CH 4). Methane collects below and sometimes ignites when it escapes to the surface. Methane from freshwater lakes and streams is emerging as a major contributor to global warming (discussed in Chapter 22). FIGURE 21.36 ■ Redox gradients in the benthic sediment. At the top of the sediment interface with the water column, minerals are first oxidized lithotrophically by O 2; then, as O 2 declines, the oxidized minerals are used as alternative electron acceptors for anaerobic respiration.
Note: Certain minerals and organic molecules occur in equilibrium
between ionized and un-ionized states over the range of pH typical of
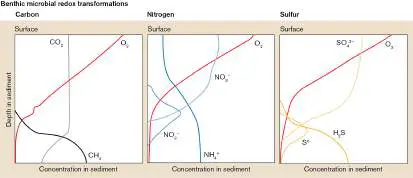
most common habitats (pH 4–9). Examples include ammonia (NH 3), which protonates to ammonium ion (NH +), and organic acids such
4
as acetic acid (CH 3 COOH), which deprotonates to acetate (CH 3 COO −). In this chapter we refer to the form most prevalent at pH 7 unless stated otherwise.
Throughout the water column, protists consume algae and bacteria, while fungi decompose detritus. Protists and fungi also interact with invertebrates and fish as parasites. Other important consumers are the viruses, which lyse about half of microbial populations in lakes, as they do in the ocean. Viruses limit the number of microbes and may keep the water clear enough for light to penetrate.
To Summarize
The euphotic zone of the ocean is the upper part of the water column, the part that receives light for phototrophs. Below, in the aphotic zone, only heterotrophs and lithotrophs can grow. The benthos includes the region where the water column meets the ocean floor, as well as sediment below the surface.
Most marine microbes require special culturing methods. Some can be cultured using conditions that mimic their natural habitat and allow intimate association with other species that provide growth factors such as siderophores. Marine microbes can include human pathogens. Vibrio cholerae colonizes copepods as symbiotic partners, but it causes the disease cholera in humans.
Plankton are small floating organisms, including swimming microbes. Phytoplankton are phototrophs such as cyanobacteria and algae. Microbial consumers include protists and viruses. Many marine protists are mixotrophs (producers and consumers in one).
Picoplankton include bacteria and small microbial eukaryotes. They are measured by fluorescence microscopy. Their biochemical rate of production is estimated by uptake of radiolabeled nutrients.
Marine microbes may grow as biofilms on particles of detritus called marine snow.
Benthic microbes are piezophiles (require high pressure). The seafloor supports psychrophiles, whereas hydrothermal vents support thermophiles. Vents and cold seeps support sulfur-and metal-oxidizing bacteria, sulfur-reducing bacteria, methanogens, and methanotrophs. Bacteria that oxidize H 2 S and methane feed symbiotic animals such as tube worms.
Freshwater lakes have stratified water columns. As depth increases, minerals become increasingly reduced. Anaerobic forms of metabolism predominate, with the more favorable alternative electron acceptors used in turn. Lakes may be oligotrophic or eutrophic. Eutrophic lakes may show such high biochemical oxygen demand (BOD) that the oxygen concentration falls to levels too low to support vertebrate life.
Glossary
pelagic zone The water column of the open ocean, away from the shore and the ocean floor.
euphotic zone Also called photic zone. The region of the ocean that receives sunlight capable of supporting photosynthesis.
photic zone See euphotic zone .
coastal shelf Shallow regions of the ocean, less than 200 meters deep, that are adjacent to land.
benthic organism An organism that lives on the ocean floor or within the sediment. thermocline A region of the ocean where temperature decreases steeply with depth, and water density increases.
biochemical oxygen demand (BOD)
Also called biological oxygen demand. The amount of oxygen removed from an environment by aerobic respiration.
BOD See biochemical oxygen demand .
biological oxygen demand See biochemical oxygen demand .
plankton Organisms that float in water.
microplankton Plankton consisting of microbes approximately 20–1,000 mm in diameter.
marine snow Microbial biofilms on particles suspended in marine water. phytoplankton Phototrophic marine bacteria, algae, and protists, the primary producers in pelagic food webs.
mixotrophy Metabolism that includes CO 2 fixation through photosynthesis and catabolism of organic compounds.
piezophile See barophile .
barophile Also called piezophile. An organism that requires high pressure to grow.
psychrophile An organism with optimal growth at temperatures below 20°C. thermal vent See hydrothermal vent .
hydrothermal vent Also called thermal vent. An opening in the seafloor through which superheated water arises, carrying high concentrations of reduced minerals such as sulfides.
thermophile An organism adapted for optimal growth at high temperatures, usually 50°C or higher.
oligotrophic Having dilute concentrations of nutrients.
eutrophic Describing a lake in which a high concentration of nutrients supports growth of algae to high densities.
algal bloom An overgrowth of algae on the water surface, caused by an increase in a limiting nutrient.
dead zone Also called zone of hypoxia. An anoxic region of an ocean or freshwater system, devoid of most fish and invertebrates. limiting nutrient A nutrient whose depletion generally restricts growth in a given ecosystem.
Fig. 13.30
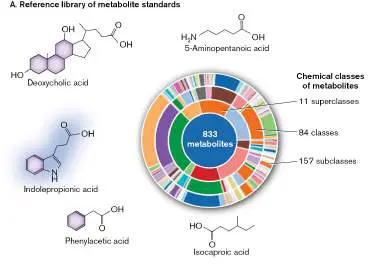
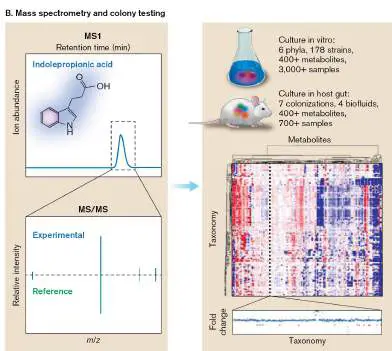
FIGURE 13.30 ■ A metabolomics pipeline for metabolites of gut microorganisms. A. A reference library of metabolites and their spectral data enables identification of microbial products. B. Unknown isolated products are analyzed by tandem mass spectroscopy. The first stage of mass spectroscopy (MS1) reveals the molecular mass of the major ion (most abundant part of the molecule). The second stage (MS/MS) measures the mass of various ions from breakdown of the peak ion in the primary spectrum, and it then compares the breakdown pattern with reference spectra. The proposed molecule is then tested for function in various organisms cultured from the gut.
S. HAN ET AL. 2021. NATURE 595: 415–420
S. HAN ET AL. 2021. NATURE 595: 415–420
Fig. 8.30 FIGURE 8.30 ■ Identifying proteins directly from whole-cell extracts by mass spectrometry. Proteins extracted from a bacterial culture are digested into peptides with trypsin. The peptides are separated by column chromatography and analyzed by mass spectrometry (here by the Thermo Scientific Q Exactive hybrid quadrupole-Orbitrap mass spectrometer). In tandem mass spectrometry (MS-MS),
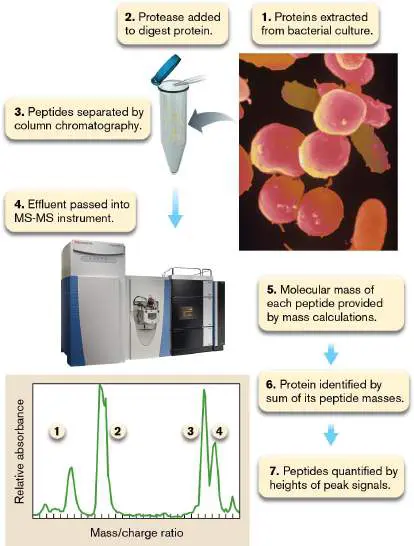
the mass of each peptide is determined first (peaks 1−4 in the graph), and then selected peptides are subjected to additional fragmentation by ion spray (not shown). Each resulting peptide fragment will differ in size by one or more amino acids. Knowing the mass of each amino acid and the masses of the different peptide fragments enables extrapolation of the original peptide’s sequence.
COURTESY OF THERMO FISHER SCIENTIFIC
SIMKO/VISUALS UNLIMITED, INC.
Figs. 21.6
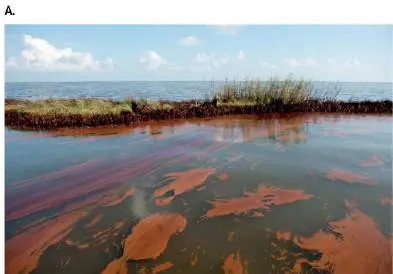
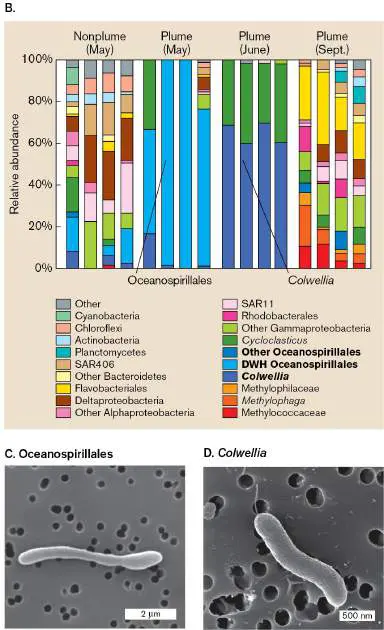
FIGURE 21.6 ■ Succession of bacterial community following the Deepwater Horizon oil spill. A. Petroleum from the Deepwater Horizon oil well blowout in April 2010 contaminated the Louisiana coast. B. Bacterial relative abundance in 16S rRNA genome libraries. C. Oceanospirillales, an order of bacteria whose DNA was found in oil-contaminated water in May (SEM). D. Colwellia bacteria dominated the oil-contaminated water in June (SEM). Samples were obtained from the plume of oil spreading through seawater and from nonplume seawater. During May and June, major taxa shifted to oil-consuming Oceanospirillales and Colwellia. By September, after bacteria had consumed much of the oil, the taxon distribution appeared more similar to that before the oil spill. Source: Part B modified from Molly C. Redmond and David L. Valentine. 2012. PNAS 109 :20292–97.
SAUL LOEB/AFP/GETTY IMAGES
Y. CAO ET AL. 2014. APPL. ENVIRON. MICROBIOL. 80 :54–60
J. BAELUM ET AL. 2012. ENVIRON. MICROBIOL. 14 :2405–16
Fig. 21.7 FIGURE 21.7 ■ Deepwater Horizon: bacteria show hydrocarbon catabolism enzymes. A. Olivia Mason operates a rosette of Niskin bottles for marine water sampling. B. Metagenomes from the oil-contaminated plume reveal genes associated with hydrocarbon degradation. Metatranscriptomes reveal mRNA transcripts encoding enzymes for hydrocarbon degradation. PAHs = polycyclic aromatic hydrocarbons.
Source: Part B modified from O. U. Mason et al. 2012. ISME J. 6 :1715,
figs. 3 and 4.
COURTESY OF OLIVIA MASON
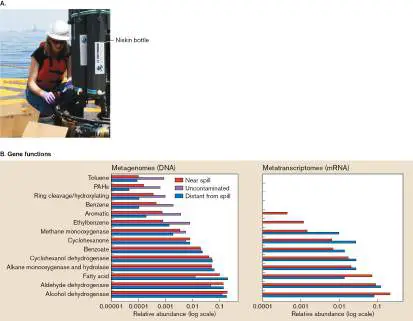
21.6 Soil and Plant Microbial Communitiesnot assigned
Soil is a complex mixture of decaying organic and mineral matter that feeds vast communities of microbes. As such, it is arguably the most complex microbial ecosystem on Earth. And soil-based agriculture is the major source of food for our planet’s human inhabitants. The qualities of a given soil—oxygenated or water saturated, acidic or alkaline, salty or fresh, nutrient-rich or nutrient-poor—define what food can be grown and whether the human community will eat or starve.
In contrast to the ocean, where the photosynthetic producers are almost entirely microbial, the major producers of terrestrial ecosystems are macroscopic plants. But most plants—from mosses and bryophytes to prairie grasses and forest trees—are rooted in soil. And all plants have multiple intimate relationships with microbes.
Soil Microbiology
The large-scale structure of terrestrial soil (Fig. 21.37) includes a series of layers called “horizons” that arise as a result of rainfall, temperature variation, wind, and biological activity. Note that the soils of different habitats, such as prairie, forest, and desert, vary greatly as to the depth and quality of each layer.
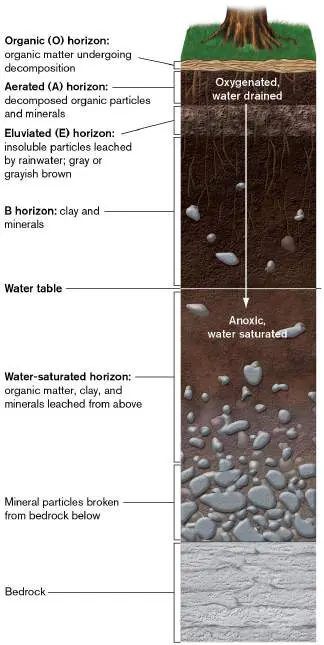
FIGURE 21.37 ■ The soil profile. Soil forms layers in which decomposing organic material predominates at the top, and minerals predominate toward the bottom, at bedrock. The top layers are aerated, providing heterotrophs with access to O 2, whereas the bottom layers are water saturated and anaerobic. The surface layer of soil we see is the organic horizon (O horizon). The organic horizon consists of dark, organic detritus, such as shreds of leaves fallen from plants. The detritus of the organic horizon is in the earliest stages of decomposition by microbes, primarily fungi and bacteria such as actinomycetes. Early-stage decomposition is defined loosely as a state in which the origin of the detritus may be still recognizable.
Beneath the organic horizon lies the darker-colored aerated horizon (A horizon), in which organic particles in more advanced stages of decomposition combine with minerals from rock at lower levels. In the aerated horizon, the source of the organic particles is no longer recognizable, and decomposers have broken down some of the more difficult-to-digest plant structural components, such as lignin (a complex aromatic polymer found in wood, discussed in the next subsection). This partly decomposed material is often sold by garden stores as peat or topsoil.
In well-drained soil, both the organic and aerated horizons are full of oxygen, as well as nutrients liberated by the decomposers and used by plants. Soil consists of a complex assemblage of organic and inorganic particles (Fig. 21.37). Between the soil particles are air spaces that provide access to oxygen, allowing aerobic respiration. Each particle of soil supports miniature colonies, biofilms, and filaments of bacteria and fungi that interact with each other and with the roots of plants (Fig. 21.38). Even within a single soil particle, there may be numerous microhabitats—some aerated, some anoxic enough to support methanogens. One side of a particle may be heavily influenced by a plant root, while the other side is separated by a piece of impenetrable detritus.
FIGURE 21.38 ■ Microbes in soil and rock. Soil particles support the growth of complex assemblages of microbes. A soil particle contains bacterial colonies, biofilm associations, and microbes associated with fungi and plant roots.
Below the aerated horizon, the eluviated horizon (E horizon) experiences periods of water saturation from rain (Fig. 21.37). Rainwater leaches (dissolves and removes) some of the organic and mineral nutrients from the upper layers. Below the eluviated horizon lie increasing proportions of minerals and rock fragments broken off from bedrock below. These lower water-saturated layers form the
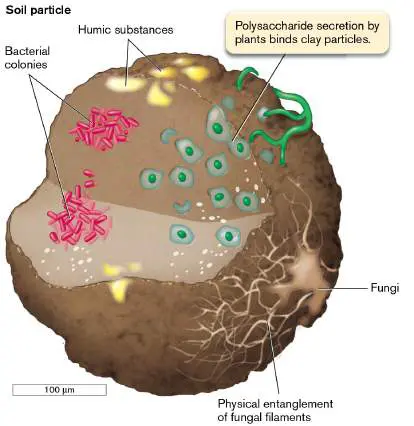
water table. This anoxic, water-saturated region contains mainly lithotrophs and anaerobic heterotrophs.
The soil layers finally end at bedrock, a source of mineral nutrients such as carbonates and iron. Notably, bedrock is permeated with microbes. Core samples show that crustal rock as deep as 3 km down contains endoliths, bacteria growing between crystals of solid rock. What energy source feeds microbes trapped within rock? For some endoliths, a surprising answer may be the radioactive decay of uranium. Uranium-238 decay generates hydrogen radicals that combine to form hydrogen gas. The hydrogen gas combines with CO 2 from carbonate rock, providing an electron donor and a carbon source for methanogens and other endolithic lithotrophs.
The Soil Food Web
The top horizons of soil feature a food web of extraordinary complexity (Fig. 21.39). The major producers are green plants, whose leaves generate detritus and whose root systems feed predators, scavengers, and mutualists. Some carbon is also fixed by lithotrophs oxidizing reduced nitrogen (NH 3), hydrogen sulfide (H 2 S), and iron (Fe 2+). In well-aerated soil, however, the proportion of carbon fixed by lithotrophs is small compared to that fixed by plants. FIGURE 21.39 ■ The soil food web (aerated zone). Plants are the major producers, although some production also occurs from lithotrophs such as ammonia oxidizers. Detritus from plants is decomposed by fungi and bacteria, which feed protists and small invertebrates such as nematodes. Protists and small invertebrates are consumed by larger invertebrates and vertebrate animals.
Which taxa are found in soil? Metagenomes from soil samples reveal the most diverse assemblage of microbes in any known habitat (Fig. 21.40). As in the ocean, the vast majority of soil microbes are uncultured, but recent research reveals methods to culture soil bacteria that require signals from their community. See,
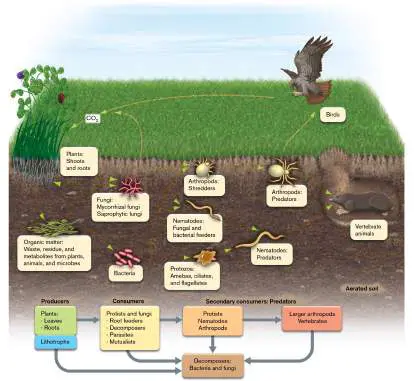
for example, the discovery of a novel antibiotic producer by Kim Lewis (Chapter 4).
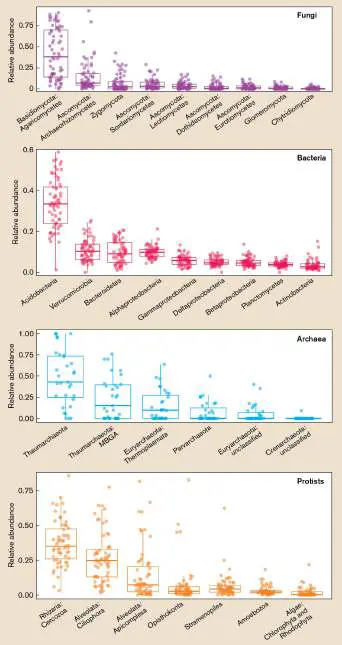
FIGURE 21.40 ■ Microbial community structure of soil. Fungi, bacteria, archaea, and protists of various taxa were identified by SSU rRNA gene sequencing of soil samples from around the world. MBGA = Marine Benthic Group A.
Source: Modified from Noah Fierer. 2017. Nat. Rev. Microbiol. 15 :579–590, fig. 3.
Fungi and bacteria play key roles in decomposition, the process that generates soil. Plant material such as leaf litter (fallen leaves) is decomposed by fungal genera such as Mycena and by bacteria such as the actinomycetes. The actinomycetes include Streptomyces, a genus famous for the production of antibiotics and for generating chemicals whose odors give soil its characteristic smell (Fig. 21.41A). The fungal and bacterial species composition of leaf litter and soil is highly diverse and depends on associated plant species, especially trees. For example, in one forest study the ascomycete fungal taxon Capnodiales (sooty mold fungi) was prevalent in all soil samples, whereas another ascomycete taxon, Jahnulales, was found only associated with basswood trees.
FIGURE 21.41 ■ Soil microbes. A. Actinomycete bacteria, Streptomyces species (SEM). Streptomyces bacteria give the soil its characteristic odor. B. The nematode Heterorhabditis bacteriophora carries luminescent Photorhabdus luminescens
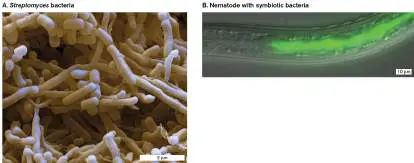
bacteria, which it alternately consumes and transmits to a host insect.
EYE OF SCIENCE/SCIENCE SOURCE
T. CICHE ET AL. 2008. APPL. ENVIRON. MICROBIOL.
74 :2275 Besides leaf litter, another source of organic matter from plants is the rhizosphere, the region of soil surrounding plant roots. The rhizosphere contains proteins and sugars released by roots, as well as sloughed-off plant cells. These materials feed large numbers of bacteria, which then cycle minerals back to the plant. Bacteria in the rhizosphere may also discourage growth of plant pathogens. In the aerated zone, heterotrophic bacteria feed on leaf detritus and root exudates; the various taxa of Proteobacteria are most common. Proteobacteria commonly possess the ability to interact with multiple electron acceptors or donors, both organic and mineral. Bacteria are then consumed by protists and nematodes. The nematode Heterorhabditis bacteriophora (Fig. 21.41B )
carries symbiotic Photorhabdus luminescens bacteria, which it alternately consumes and transmits as a mutualist when it infects an insect. Vampirella protists drill holes in fungal hyphae to suck out their nutrients. Parasitic fungi prey on plants or invertebrates; some actually capture and strangle nematodes.
Mycorrhizal fungi extend the absorptive surface area of plant roots. The nutrient-sharing hyphae of mycorrhizae connect most tree roots in a vast underground “fungal Internet” (discussed later). Microbes ultimately feed invertebrates, which then feed larger invertebrates and vertebrate predators. Some predators, such as earthworms and burrowing animals, enhance the soil quality by turning over the matter, thus aerating the soil particles and helping to mix the organic matter from above with the mineral particles from below.
A critical role of fungal decomposers (also known as saprophytes) is the breakdown of extremely complex structural components of vascular plants such as grasses and trees (Fig. 21.42). Trees, in particular, accumulate vast stores of biomass in forms that are difficult to digest, such as lignin. Lignin is a highly complex and diverse covalent polymer composed of interlinked phenolic groups (benzene rings with OH or related oxygen-bearing side groups; Fig. 21.42A). We saw earlier that termites host protozoa that help degrade the lignin portion of wood particles. In soil, fungal and bacterial decomposers possess enzyme systems to degrade lignin and other complex components of plants. Examples of decomposers include white rot fungi (Fig. 21.42B ) and actinomycete soil bacteria. The prevalence of lignin is one reason that decomposition by fungi plays a much larger role in terrestrial ecosystems than in marine ecosystems.
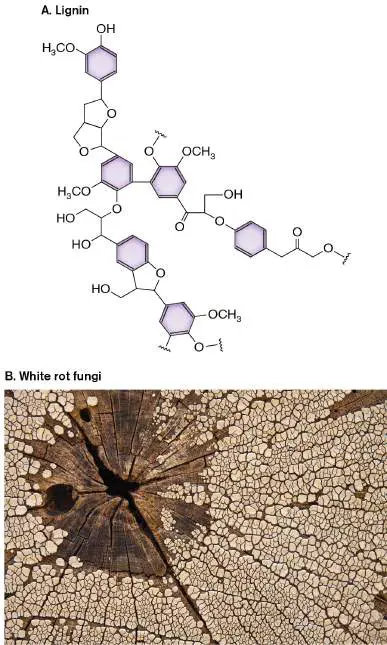
FIGURE 21.42 ■ Microbial degradation of lignin. A. Lignin is a complex organic polymer that is a component of wood and bark. B. Xylobolus frustulatus, a white rot fungus, growing on a willow log. The fungus degrades lignin.
GAIL JANKUS/SCIENCE SOURCE
The first phase of microbial degradation (about 50% of the carbon) is complete within a year of deposition in the soil. The remaining phenolics, however, may be degraded at a rate of less than 5% per year, and some samples dated by 14 C isotope ratios have been shown to last 2,000 years. These phenolic molecules are called humic material or humus. Because of its slow degradation, humic material provides a steady slow-release supply of nutrients for plant growth. But forests whose rate of microbial decomposition is particularly low—for example, the New Jersey Pine Barrens— depend on fire to clear the mounting layers of humus and return its minerals to the ecosystem.
Note that soil microbial communities play essential roles in cycling nitrogen. While the rhizobia-legume mutualism is well known (see Section 21.3), other plants such as mosses and liverworts grow symbiotically with nitrogen-fixing cyanobacteria such as Phormidium and Nostoc. Nitrogen is also fixed by many free-living soil bacteria and archaea, which then release nitrogen in the forms of ammonia, nitrate, and small organic molecules. These various forms of nitrogen can feed plants and fungi. The soil also hosts ammonia-oxidizing archaea, the Thaumarchaeota (described in Chapter 19). Oxidation detoxifies ammonia and contributes to the global nitrogen cycle (to be described in Chapter 22).
Microbes Associated with Roots
The presence of plant roots provides yet another level of complexity to soil communities (Fig. 21.43). Plant roots influence the surrounding soil by taking up nutrients and by secreting organic substances and molecules that modulate their surroundings. The environment adjacent to a plant root can be further subdivided into two categories: the rhizoplane, the root surface; and the rhizosphere, the region of soil outside the root surface but still influenced by plant exudates (materials secreted by the plant). Particular bacterial species are adapted to these environments. For example, in anoxic wetland soil, the rhizoplane and rhizosphere of plant roots provide oxygen for methanotrophs that oxidize methane produced by methanogens.
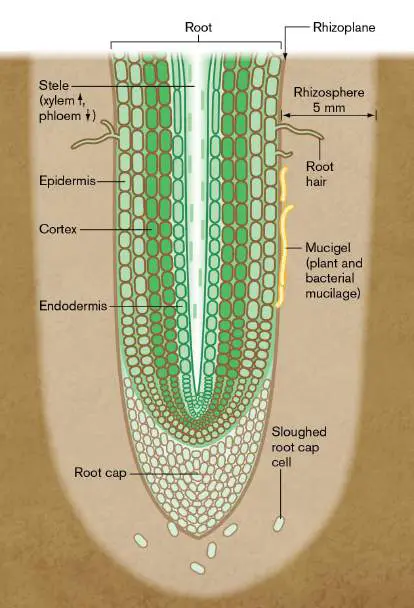
FIGURE 21.43 ■ Plant roots offer special habitats for microbes. The rhizoplane is the region of soil directly contacting the plant root surface. The rhizosphere is the soil outside the rhizoplane that receives substances from the root, such as mucilage, sloughed cells, and exudates.
The rhizoplane and rhizosphere also provide the environment for symbiotic fungi that generate mycorrhizae. At least 80% of plants in nature, including 90% of forest trees, require mycorrhizae for optimal growth.
Mycorrhizae: The Fungal Internet
The function of mycorrhizae for plant growth is just beginning to be understood. Mycorrhizae (singular, mycorrhiza; from myco, “fungal,” and rhiza, “root”) consist of fungal mycelia that associate intimately with the roots of plants, extending access to minerals while obtaining in return the energy-rich products of plant photosynthesis.
Mycorrhizae were first discovered in the 1880s by German truffle hunters who sought to cultivate the prized delicacy, the fruiting body of an ascomycete (for review of fungi, see Chapter 20). The propagation of truffles was investigated by mycologist Albert Frank (1839–1900) at the Agricultural University of Berlin. To his surprise, Frank found that the truffles extended their mycelia far beyond the site of the fruiting body, and that the mycelia formed an impenetrable tangle with plant roots. Frank called the tangled mycelia “fungus-roots” or mycorrhizae. More than a century later, we are beginning to appreciate that these mysterious fungus-root tangles offer a vast interconnected network for exchange of nutrients among fungi and many different plants, like an Internet connecting countless sites. In temperate forests, 40% of the carbon in tree roots may be derived from photosynthesis by other trees of different species, connected by mycorrhizae. The remarkable fungus-connected community of trees is explored by Susan Simard’s book, Finding the Mother Tree: Discovering the Wisdom of the Forest (2021).
Two different kinds of mycorrhizae are observed: ectomycorrhizae and endomycorrhizae. Ectomycorrhizae colonize the rhizoplane, the external surface of plant rootlets (Fig. 21.44). The fungal mycelia never penetrate the root cells. They form a thick mantle surrounding the root and growing between the root cells, and then extend long mycelia away from the root to absorb nutrients. Numerous kinds of fungi form ectomycorrhizae, including ascomycetes (such as truffles) and basidiomycetes, known by their mushrooms (such as stinkhorns). Plants grown with ectomycorrhizae invest less of their body mass in roots and more in the aboveground stems and leaves—an important consideration for agriculture, in which the aboveground plant is usually the part harvested.
FIGURE 21.44 ■ Ectomycorrhizae: fungi colonize the surface of the rootlet. A. Plant root cross section.
Ectomycorrhizae extend hyphae from the root surface. B.
Ectomycorrhizal hyphae from a rootlet (LM).
COURTESY OF PAULA FLYNN
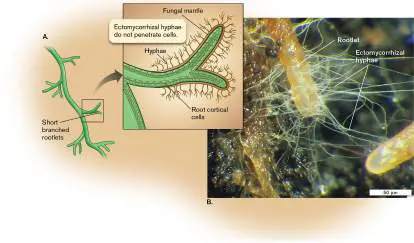
Endomycorrhizae form a more intimate association, in which the fungal hyphae penetrate plant cells deep within the cortex (Fig. 21.45). The penetrating hyphae form knobbed branches that resemble microscopic “trees,” or arbuscules, within the root cells. Some of the hyphae form specialized vesicles within the plant that store nutrients. Another name for this kind of mycorrhizae is vesicular-arbuscular mycorrhizae.
FIGURE 21.45 ■ Endomycorrhizae: fungi invade root cells, forming arbuscules. A. Plant root cross section.
Endomycorrhizal hyphae penetrate cells deep within the root cortex. B. The penetrating hypha forms an arbuscule within a root cell.
© MARK BRUNDRETT
Endomycorrhizae are more specialized than ectomycorrhizae. They comprise a relatively small number of fungal species, such as members of the Glomeromycota genus Glomus, and they show obligate dependence on their host plants. Their presence in nature and their importance in the ecosystem, however, are actually greater. Endomycorrhizal species exist entirely underground (they do not form mushrooms), and they completely lack sexual cycles. They may acquire 25% of the photosynthetic product of their hosts in
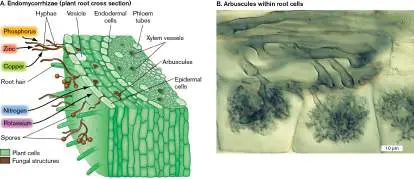
exchange for tremendously expanding the plants’ access to soil resources.
Mycorrhizae greatly enhance a plant’s uptake of water, as well as minerals such as nitrogen and phosphorus. In addition, the hyphae sequester toxins, and they distribute organic substances from one plant to another. Mycorrhizae may join many different plants, even different species, in a vast, nutrient-sharing network.
Thought Question
21.15 Design an experiment to test the hypothesis that the presence of mycorrhizae enhances plant growth in nature.
Wetland Soils
So far, we have considered the interface between ground and water (the benthic sediment beneath oceans and lakes) and the interface between ground and air (aerated soil). An interesting case that combines the two is wetlands (Fig. 21.46A). A wetland is defined as a region of land that undergoes seasonal fluctuations in water level, so that sometimes the land is dry and oxygenated, and at other times, it is water saturated and anoxic. Wetlands provide many crucial functions; for example, the Everglades filter much of the water supply for Florida communities.
FIGURE 21.46 ■ Wetland soil. A. A true wetland experiences periods of water saturation alternating with dry soil. Soil that is water saturated becomes anaerobic because O 2 diffuses slowly through water. B. Alternating periods of water saturation and dryness give the soil a mottled color. The reddish-brown portions around root holes result from oxidized iron (Fe 3+ ), whereas the gray portions (“gley”) indicate that water has washed iron away after reduction (Fe 2+).
COURTESY OF CHIEN-LU PING, UNIV. OF ALASKA, ANCHORAGE
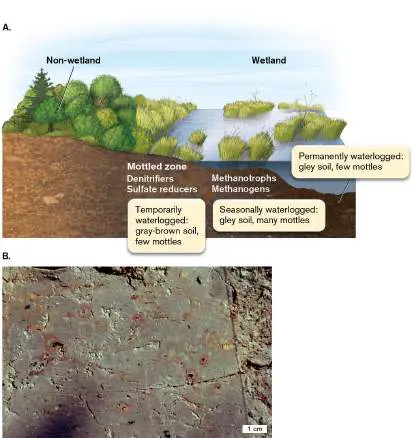
Wetland soil that undergoes such periods of anoxic water saturation is known as hydric soil. Hydric soil is characterized by “mottles,” patterns of color and paleness (Fig. 21.46B ). The reddish-brown portions (for example, surrounding a plant root) result from oxidized iron (Fe 3+). The gray portions indicate loss of iron in its water-soluble reduced form (Fe 2+), generated by anaerobic respiration.
Soil becomes anoxic when the rate of oxygen diffusion is too low to support aerobic metabolism. Anaerobic metabolism allows much lower rates of production than metabolism in the presence of oxygen because anaerobes use oxidants of lower redox potential and limited quantity, such as sulfate and nitrate. Many kinds of anaerobic bacteria inhabit wetlands. For example, denitrifiers (bacteria using nitrate to oxidize organic food) remove nitrate from water before it enters the water table—one of the ways that wetlands protect our water supply.
The alternative oxidants (electron acceptors) are always in limited supply, so further catabolism is carried out by fermentation. Fermentation allows only incomplete breakdown of food molecules, generating a rich and diverse supply of nutrients for a variety of consumers, including aerobic organisms when the water recedes. Thus, despite its lower overall productivity, anoxic soil contributes to the nutritional diversity of wetland ecosystems. The relatively slow rate of decomposition can lead to accumulation of high levels of organic carbon, particularly rich for plant growth.
The anoxic conditions of wetlands also favor methanogenesis. Methanogenesis is performed solely by archaea (discussed in Chapters 14 and 19). Methanogenesis occurs when fermenting bacteria generate H 2, CO 2, and other one-or two-carbon substrates that methanogens convert to methane. Methane is a more potent greenhouse gas than CO 2, and although the current methane concentration in our atmosphere is low, it is rising exponentially.
In water-filled anoxic soils, particularly those of rice fields, substantial quantities of methane escape to the air through air-conducting channels in the roots of the rice plant. The roots of rice plants, like those of other wetland vascular plants, contain channels to carry oxygen. These same channels, however, allow methane to escape from anoxic soil. Fortunately, the rhizosphere of the roots supports methanotrophs that oxidize methane, so research is being done to maximize methanotroph activity and minimize the release of methane. There is some evidence that natural wetlands take in more carbon than they put out, whereas disturbed wetlands (wetlands altered by human activity) generate net efflux of CO 2 and CH 4. The role of wetlands in global cycling is discussed further in Chapter 22.
Plant Endophytic Communities
The plant interior provides a special home for microbes termed endophytes. The plant’s vascular system of phloem tubes conducts photosynthesized sugars down from the leaves, while xylem tubes bring water and minerals up from the roots. Unlike the sterile blood vessels of animals, plant transport vessels are normally colonized by endophytic fungi and bacteria. Thus, when we eat plants, we also consume all their endophytes, or endophytic microbes (Fig. 21.47 ).
FIGURE 21.47 ■ Endophytic bacteria within plants. Communities of bacteria colonize a new root tip of the plant Arabidopsis thaliana. The bacteria (green) and the root cell nuclei (blue) are visualized by FISH with probes hybridized to rRNA, using confocal laser scanning microscopy. Endophytes include species of Actinobacteria and Proteobacteria that may help the plant resist pathogens and survive environmental
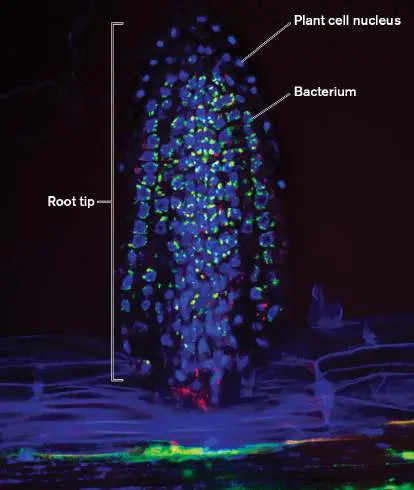
stresses such as high salt or temperature. Distinct clades of bacteria grow on the root surface or within the plant tissues. Source: Derek Lundberg et al. 2012. Nature 488 :86.
SARAH LEBEIS/UNIVERSITY OF NORTH CAROLINA
Some endophytes are obligate (can live only within the plant), whereas others, such as pseudomonads, have alternative lifestyles in the soil. The microbial partners may grow as mutualists, commensals, or parasites. Plants tolerate endophytes because they confer substantial benefits. For example, prairie grasses called fescue, grazed by cattle in the southeastern United States, host fungal epiphytes, organisms that grow on a plant without being parasitic. The fungi, Neotyphodium coenophialum, produce alkaloids that deter insect predators, pathogens, and root-feeding nematodes. Unfortunately, some of the alkaloids poison cattle, but agricultural scientists have engineered fungal strains that still protect the plant from pathogens while allowing cattle to graze. Human pathogens such as Escherichia coli O157:H7 and Salmonella enterica can grow endophytically in crop plants such as spinach and alfalfa. Endophytic pathogens pose a problem for the food industry because the bacteria cannot be “washed off” from raw produce. On the other hand, endophytes such as Stenotrophomonas species have potentially valuable uses. Stenotrophomonas bacteria produce enzymes that deter many plant pathogens. The bacteria also absorb and concentrate toxic metals such as arsenic, suggesting a possible use for bioremediation of metal-contaminated soil. They produce promising antibiotics and proteases for cleansing agents. Other kinds of endophytes protect plants from heat, salt, and drought—contributions of growing importance as our global climate changes.
Plant Pathogens
We have seen many ways in which bacteria and fungi interact positively with plants, but some species act as pathogens. In any environment, pathogens are always outnumbered by the vast community of neutral or helpful microbes. Nevertheless, when a pathogen does colonize a plant, its growth can have effects ranging from minimal to devastating (Fig. 21.48). A relatively harmless plant virus was associated with a famous historical phenomenon: the seventeenth-century tulip craze in the Netherlands. The virus caused streaking of tulip petals (Fig. 21.48A), a pattern much admired by tulip fanciers. Other viruses, however, can cause devastating blights and epidemics. (For more on viruses, see Chapters 6 and 11.)
FIGURE 21.48 ■ Plant diseases range from innocuous to devastating. A. Striped tulips result from a virus. B. Crown gall tumor on rose stem, caused by Agrobacterium tumefaciens. C. Dogwood leaf spotted by anthracnose fungus.
VOLODYMYR KALUSKI/ALAMY STOCK PHOTO
NIGEL CATTLIN/ALAMY STOCK PHOTO
FLPA/ALAMY STOCK PHOTO
A pathogenic relative of rhizobia is Agrobacterium tumefaciens, a bacterium whose DNA transforms plant cells to form crown gall tumors (Fig. 21.48B ). A. tumefaciens has an unusually broad host range, and its natural genetic transformation system has been applied widely for commercial plant engineering (discussed in
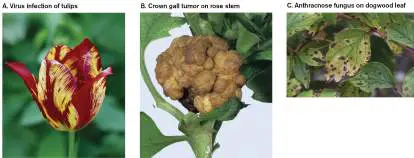
Chapter 16). The tumors remain largely confined and have relatively little effect on plant growth. Other bacterial pathogens, particularly species of Erwinia and Xanthomonas, severely damage plants.
The most common plant pathogens are fungi. Fungal diseases such as anthracnose (Fig. 21.48C ) cause substantial losses in agriculture, affecting cucumbers, tomatoes, and other vegetables. Dutch elm disease, which has wiped out nearly all the native elms of the United States, is caused by the fungus Ophiostoma novo-ulmi. The fungus is carried by bark beetles, which bore into the xylem, damaging the plant’s transport vessels and allowing access for fungal spores.
Some fungal pathogens generate specialized structures to acquire nutrients from plants. As a hypha grows across the plant epidermis, its tip can penetrate the plant cell wall, followed by ingrowth of a bulbous extension called a haustorium (plural, haustoria; Fig. 21.49). The haustorium never penetrates the plant cell membrane, thus avoiding leakage and loss of plant cytoplasm. Instead, it causes the membrane to invaginate, while expanding into the volume of the plant cell. The haustorium takes up nutrients such as sucrose, generated by adjacent chloroplasts. Depending on the species of fungus, haustorial parasitism can lead to mild growth retardation or it can rapidly kill the plant.
FIGURE 21.49 ■ A fungal pathogen inserts haustoria into plant cells. The haustorium is surrounded by an invagination of the plant’s cell membrane. Plant nutrients such as
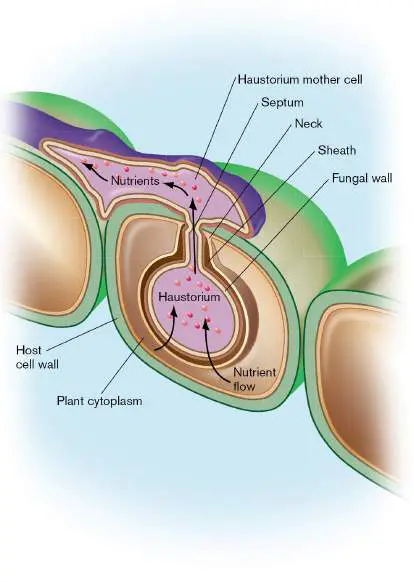
sucrose flow into the haustorium and are transferred out to the fungal mycelia.
This chapter has introduced the challenge of characterizing microbial communities throughout various ecosystems. While we have focused on local relationships, in Chapter 22 we take a global perspective of microbial ecology and its roles in the cycling of Earth’s essential elements, such as nitrogen and iron. We discuss the “built environment” of humans and consider how humans interact with Earth’s biosphere. Finally, we take a look at the evidence for existence of microbial life beyond Earth.
Thought Question
21.16 Compare and contrast the processes of plant infection by rhizobia (see Section 21.3) and by fungal haustoria.
To Summarize
The uppermost horizons of soil consist of detritus and are largely aerated. Below the aerated layers, the eluviated horizon experiences water saturation. Lower layers are anoxic.
Soil bacteria cycle nitrogen. Nitrogen is fixed by bacteria and archaea and is oxidized by other species. Fixed nitrogen becomes available for plants.
The soil food web includes a complex range of microbial producers, consumers, predators, decomposers, and mutualists. Soil particles are multispecies communities of bacteria, fungi, and other microbes.
Fungi decompose lignin , a complex aromatic tree component that is challenging to digest. Lignin decomposition forms humus.
Certain fungi called mycorrhizae form symbiotic associations with plant roots. Mycorrhizae transport soil nutrients among many different kinds of plants.
Wetland soils alternate aerated (dry) with anoxic (water-saturated) conditions. Anoxic wetland soil favors methanogenesis. Wetland soils are among the most productive ecosystems.
Endophytes are bacteria or fungi that grow within plant transport vessels, conferring benefits such as resistance to pathogens.
Plant pathogens include bacteria, fungi, and viruses. Some pathogens only mildly affect the plant, whereas others cause devastation. Some fungi invade plants using haustoria, which grow into the plant cell by penetrating the cell wall and invaginating the cell membrane to avoid leakage of cytoplasm.
Glossary
water table The layer of soil that is permanently saturated with water. endolith A bacterium that grows within the crystals of solid rock. rhizosphere The soil environment surrounding plant roots.
lignin A complex aromatic organic compound that forms the key structural support for trees and woody stems.
humic material Also called humus. Phenolic molecules, derived from lignin, that are resistant to degradation and hence very stable in soil. humus See humic material .
mycorrhizae sing. mycorrhiza Fungi involved in an intimate mutualism with plant roots, in which nutrients are exchanged.
mycorrhizae sing. mycorrhiza Fungi involved in an intimate mutualism with plant roots, in which nutrients are exchanged.
ectomycorrhizae Mycorrhizae that colonize the surface of plant roots. Their mycelia do not penetrate the root cells.
endomycorrhizae Also called arbuscular mycorrhizae or vesicular-arbuscular mycorrhizae. Mycorrhizae whose fungal hyphae penetrate plant root cells.
vesicular-arbuscular mycorrhizae See arbuscular mycorrhizae .
wetland A region of land that undergoes seasonal fluctuations in water level and aeration.
hydric soil Soil that undergoes periods of anoxic water saturation. endophyte An endosymbiont of vascular plants.
haustorium pl. haustoria A bulbous hyphal extension of a fungal plant pathogen into the host cell.
haustorium pl. haustoria A bulbous hyphal extension of a fungal plant pathogen into the host cell.
eResearch Activity 21
What Builds Hedgehogs and Corncobs on Your Teeth?
When you visit the dentist, do you ever wonder what kind of elaborate palaces bacteria build in the plaque on your teeth? Jessica Mark Welch asked this question, and she used fluorescence in situ hybridization (FISH) to find out (Fig. ERA 21.1 ). Her advanced version of FISH used ten different fluorophores with distinct colors to label sequence probes specific to different bacterial taxa. She applied the probes to plaque samples obtained from healthy human volunteers. The results showed striking growth patterns unique to species mixtures, not seen before in isolation.
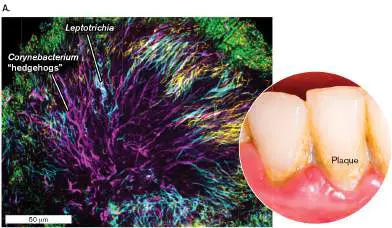
Figure ERA 21.1 ■ Dental plaque may contain “hedgehog” structures. A. Long filaments of Corynebacterium (magenta) point outward like the needles of a hedgehog. In this sample, Leptotrichia (cyan) filaments extend from the outward-pointing ends of Corynebacterium. Patches of Actinomyces (white) fit in among the Corynebacterium. CLASI-FISH imaging used fluorophore probes specific to each bacterial genus. B. Jessica Mark Welch’s group at the Marine Biological Laboratory in Woods Hole studies biofilm structure in oral and marine habitats. From left to right: Tabita Ramirez-Puebla, Cathleen Schlundt, Jessica Mark Welch, Loretha Jack, and Anna Knochel. Inset: Dental

plaque on teeth. Source: Jessica Mark Welch et al. 2016. PNAS 113 :E791–E800.
JESSICA MARCH WELCH
BOTAZSOLTI/SHUTTERSTOCK
JESSICA MARCH WELCH
In many of Mark Welch’s samples, such as the one shown in Figure ERA 21.1A , the biofilm was founded upon a thick brush of Corynebacterium species. Corynebacterium species in the past were better known for aerobic club-shaped organisms that cause diphtheria (C. diphtheriae). Oral Corynebacterium strains are facultative anaerobes that grow into long multicellular filaments. The filaments bristle outward radially, like the needles of a hedgehog. Nestled among the hedgehog needles are filaments of another genus, Leptotrichia. Leptotrichia are aerotolerant Gram-negative bacteria that until recently were rarely reported in humans. The basis for their Corynebacterium association is unclear.
Note the presence of other bacteria in Figure ERA 21.1A , coded by other fluorophores. In fact, plaque structures vary greatly, with many combinations seen. In some biofilms, the Corynebacterium hedgehog needles are capped and coated by “corncobs” of Gram-positive cocci. The corncobs in Figure ERA 21.2 consist of Streptococcus bacteria. One kind of Streptococcus, the species Streptococcus mutans, is known for fermenting sugars to acids that cause tooth decay. But other species, such as Streptococcus cristatus, form the corncobs. Remarkably, some of these corncobs have yet another outer coating of Aggregatibacter bacteria. Their function is unknown, although S. cristatus may discourage the growth of bacteria that cause gum disease. Similar corncob structures appear on hedgehogs in many samples.
FIGURE ERA 21.2 ■ Hedgehogs and corncobs. Corncobs of round cocci (Streptococcus, green) form around the distal ends of Corynebacterium filaments in dental plaque. Inset: Expanded cross section of Streptococcus corncob surrounded by an outer layer of Aggregatibacter (orange).
Source: Jessica Mark Welch et al. 2016. PNAS 113 :E791–E800.
J. L. MARK WELCH ET AL. 2016. PROC NATL ACAD SCI USA. 113 :E791–800
With all the biofilm diversity, Mark Welch and colleagues developed a general model for the structure of plaque biofilms (Fig. ERA 21.3 ). The model attempts to account for recurring themes of bacterial association that may reflect the steep oxygen gradient, from the anoxic tooth surface across the plaque layer to the oxygenated exterior.
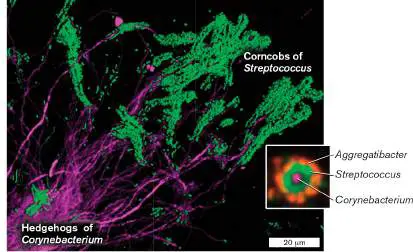
FIGURE ERA 21.3 ■ Model for oral biofilm structure. The Corynebacterium filaments colonize a base of bacteria adherent to the tooth surface, which becomes highly anoxic. Between the distal ends of Corynebacterium, cells of Leptotrichia and Actinomyces insert themselves. The outermost ends of Corynebacterium are colonized by cocci that ferment sugars to acids and use limited oxygen for respiration.
In this model, the biofilm actually starts with a solid base of Streptococcus and other bacteria cemented firmly to the tooth. The Corynebacterium filaments originate at the biofilm base and then grow outward, forming the needle-like structures interdigitated by Leptotrichia and other anaerobic bacteria whose metabolism
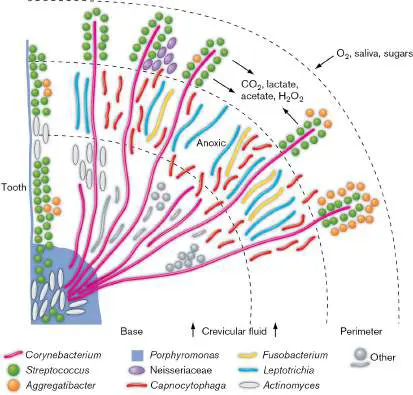
maintains anoxic conditions. Finally, the outermost ends of Corynebacterium are colonized by single-cell-thick coatings of Streptococcus, which are often surrounded by another single-cell-thick layer of Aggregatibacter. The function of all these precise arrangements remains unclear, but as research continues, we may gain clues as to which of the vast array of oral bacteria may improve our dental health—and which ones undermine it.
Further Exploration
How do the Streptococcus bacteria attach to Corynebacterium? Do the two species contribute to each other metabolically? Which different oral bacteria increase caries formation, and which tend to prevent it? How would plaque form if key microbes were removed by antibiotics?
Mark Welch, Jessica L., Blair J. Rossetti, Christopher W. Rieken, Floyd E.
Dewhirst, and Gary G. Borisy. 2016. Biogeography of a human oral microbiome
at the micron scale. Proceedings of the National Academy of Sciences USA 113
:E791–E800.
CHAPTER REVIEW
Review Questions
1. What unique functions do microbes perform in ecosystems?
2. How do we sample a microbial community? What questions go into the experimental design?
3. How do we analyze a metagenome of a microbial community? What are the advantages of 16S rRNA analysis, metagenomes, and metatranscriptomes?
4. Explain the difference between carbon assimilation and dissimilation.
5. What kinds of microbial metabolism are favored in aerated environments? In anoxic environments?
6. Give some examples of microbial producers in ecosystems. Include phototrophs as well as lithotrophs. Can a microbe be both a producer and a consumer?
Explain.
7. Explain the microbial relationships in various forms of symbiosis, including mutualism, commensalism, and parasitism. Outline an example of each, detailing the contributions of each partner.
8. Compare and contrast the digestive communities of the bovine rumen and the human colon with respect to taxa, metabolic pathways, and contributions to the host. 9. Compare and contrast the marine food web with the soil food web. What kinds of organisms are the producers and consumers? How many trophic levels are typically found? 10. Explain how microbes interact with each other in marine and soil habitats. Are these habitats typically uniform? Are the microbes planktonic or do they adhere to a substrate?
11. Compare and contrast the roles of microbes in photic and aphotic marine communities.
12. Compare and contrast the microbial activities in aerated and waterlogged soils.
13. Explain how anaerobic microbial metabolism can enrich soil for plant cultivation.
14. What are mycorrhizae, and how are they important for plant growth?
15. Explain how bacterial mutualists fix nitrogen for plants.
Thought Questions
1. Explain what you can learn about a marine microbial community from a metagenome, as compared with a metatranscriptome. How and why might the two approaches yield different results?
2. Plants need to adapt to a warming climate. Plant adaptation is enhanced by their associated microbiome of bacteria and fungi. Could you devise methods to “culture the uncultured” microbes that might aid adaptation of plants important for agriculture?
3. Explain, with specific examples, what mutualism and parasitism have in common, and how they differ.
Describe an example of a relationship that combines aspects of both.
4. The photic zone and the benthic zone pose challenges and opportunities for marine microbes. What challenges do they have in common, and how do they differ?
Key Terms
abiotic (868)
algal bloom (894)
alpha diversity (854) amensalism (875)
amplicon (851)
assimilation (867)
bacteroid (871)
barophile (892)
benthic organism (884) bin (857)
binning (857)
biochemical oxygen demand (biological oxygen demand) (BOD) (884)
biomass (867)
cell sorting (861)
coastal shelf (884) commensalism (875)
community (850)
consumer (867)
coral bleaching (874) dead zone (894)
decomposer (868)
detritus (868)
dissimilation (867) diversity (854)
ecosystem (850)
ectomycorrhizae (901) endolith (897)
endomycorrhizae (902) endophyte (904)
enrichment culture (857) euphotic zone (photic zone) (884) eutrophic (894)
fistulated (cannulated) cow (880) flow cytometry (861) fluorescence in situ hybridization (FISH) (863) food web (867)
grazer (867)
haustorium (905)
heat map (855)
holobiont (876)
humic material (humus) (900) hydric soil (903)
hydrothermal vent (892) lichen (870)
lignin (900)
limiting nutrient (894) marine snow (887)
marker sequence (854) metagenome (854)
metatranscriptomics (859) microbiome (850)
microbiota (850)
microplankton (887) mixotrophy (892)
mutualism (870)
mycorrhizae (901)
niche (861)
niche construction (861) nonparametric (856) oligotrophic (893)
omics (854)
parasitism (876)
pelagic zone (883)
phytoplankton (888) piezophile (892)
plankton (887)
population (850)
predator (867)
primary producer (867) psychrophile (892)
read (854)
rhizobium (871)
rhizosphere (899)
rumen (879)
sample (853)
succession (857)
symbiosis (869)
synergism (875)
syntrophy (877)
target community (854) thermal vent (892)
thermocline (884)
thermophile (892)
trophic level (867) vesicular-arbuscular mycorrhizae (902) water table (897)
wetland (903)
Recommended Reading
Almeida, Alexandre, Alex L. Mitchell, Miguel Boland, Samuel C. Forster, Gregory B. Gloor, et al. 2019. A new genomic blueprint of the human gut microbiota. Nature 568:499–504. Brune, Andreas. 2014. Symbiotic digestion of lignocellulose in termite guts. Nature Reviews. Microbiology 12 :168–180. Bryant, Jessica A., Tara M. Clemente, Donn A. Viviani, Allison A. Fong, Kimberley A. Thomas, et al. 2016. Diversity and activity of communities inhabiting plastic debris in the North Pacific Gyre. mSystems 1 :e00024-16.
Cavalcanti, Giselle S., Amanda T. Alker, Nathalie Delherbe, Kyle E. Malter, and Nicholas J. Shikuma. 2020. The influence of bacteria on animal metamorphosis. Annual Review of Microbiology 74 :137–158.
Dar, Daniel, Linda S. Thomashow, David M. Weller, and Dianne K. Newman. 2020. Global landscape of phenazine biosynthesis and biodegradation reveals species-specific colonization patterns in agricultural soils and crop microbiomes. eLife 9 :e59726.
Evans, Paul N., Donovan H. Parks, Grayson L. Chadwick, Steven J. Robbins, Victoria J. Orphan, et al. 2015. Methane metabolism in the archaeal phylum Bathyarchaeota revealed by genome-centric metagenomics. Science 350 :434–438.
Fierer, Noah. 2017. Embracing the unknown: Disentangling the complexities of the soil microbiome. Nature Reviews.
Microbiology 15 :579–590.
Gao, Cheng, Liliam Montoya1, Ling Xu1, Mary Madera1, Joy Hollingsworth, et al. 2019. Strong succession in arbuscular mycorrhizal fungal communities. ISME Journal 13 :214–226. Huq, Anwar, Mohammed Yunus, Syed Salahuddin Sohel, Abbas Bhuiya, Michael Emch, et al. 2010. Simple sari filtration is sustainable and continues to protect villagers from cholera in Matlab, Bangladesh. mBio 1 :e00034-10.
Meadow, James, Adam E. Altrichter, Ashley C. Bateman, Jason Stenson, G. Z. Brown, et al. 2015. Humans differ in their personal microbial cloud. PeerJ 3 :e1258.
Moss, Eli L., Dylan G. Maghini, and Ami S. Bhatt. 2020. Complete, closed bacterial genomes from microbiomes using nanopore sequencing. Nature Biotechnology 38:701–707. Murphy, April, Daniel Barich, M. Siobhan Fennessy, and Joan L. Slonczewski. 2021. An Ohio State scenic river shows elevated antibiotic resistance genes, including Acinetobacter tetracycline and macrolide resistance, downstream of wastewater treatment plant effluent. Microbiology Spectrum 9:e00941-21.
Redmond, Molly C., and David L. Valentine. 2012. Natural gas and temperature structured a microbial community response to the Deepwater Horizon oil spill. Proceedings of the National Academy of Sciences USA 109 :20292–20297.
Rodrigues, Jorge L. M., Vivian H. Pellizari, Rebecca Mueller, Kyunghwa Baek, Ederson da C. Jesus, et al. 2013.
Conversion of the Amazon rainforest to agriculture results in biotic homogenization of soil bacterial communities. Proceedings of the National Academy of Sciences USA 110 :988–993.
Slaby, Beate M., Thomas Hack, Hannes Horn, Kristina Bayer, and Ute Hentschel. 2017. Metagenomic binning of a marine sponge microbiome reveals unity in defense but metabolic specialization. ISME Journal 11 :2465–2478.
Sokol, Noah W., Eric Slessarev, Gianna L. Marschmann, Alexa Nicolas, Steven J. Blazewicz, et al. 2022. Life and death in the soil microbiome: How ecological processes influence biogeochemistry. Nature Reviews. Microbiology 20 :1–16. Thaiss, Christoph A., David Zeevi, Maayan Levy, Gili Zilberman-Schapira, Jotham Suez, et al. 2014.
Transkingdom control of microbiota diurnal oscillations promotes metabolic homeostasis. Cell 159 :514–529.
Vigneron, Adrien, Perrine Cruaud, Patricia Pignet, Jean-Claude Caprais, Marie-Anne Cambon-Bonavita, et al.
2013. Archaeal and anaerobic methane oxidizer communities in the Sonora Margin cold seeps, Guaymas Basin (Gulf of California). ISME Journal 7 :1595–1608.
Yoshida, Shosuke, Kazumi Hiraga, Toshihiko Takehana, Ikuo Taniguchi, Hironao Yamaji, et al. 2016. A bacterium that degrades and assimilates poly(ethylene terephthalate). Science 351 :1196–1199.
Zhao, Rui, Zarath M. Summers, Glenn D. Christman, Kristin M. Yoshimura, and Jennifer F. Biddle. 2020. Metagenomic views of microbial dynamics influenced by hydrocarbon seepage in sediments of the Gulf of Mexico. Scientific Reports 10:1–13. Zrimec, Jan, Mariia Kokina, Sara Jonasson, Francisco Zorrilla, and Aleksej Zelezniak. 2021. Plastic-degrading potential across the global microbiome correlates with recent pollution trends. mBio 12 :e02155-21.
Glossary
ecosystem A community of species plus their environment (habitat). population A group of individuals of one species living in a common location.
community The sum of all populations of organisms interacting within an ecosystem.
microbiota or microbiome The total community of microbes associated with an organism (such as the human body) or with a defined habitat (such as soil or plants).
microbiota or microbiome The total community of microbes associated with an organism (such as the human body) or with a defined habitat (such as soil or plants).
amplicon A specific PCR product in which a small DNA sequence is amplified (many copies are synthesized).
sample In ecology, a small, defined portion of a population or ecosystem that represents the whole.
diversity A measure of the genetic differences across the taxa of a microbial community.
alpha diversity The species richness, as measured by the average number of different species in a number of samples from a specific community.
read A short DNA sequence that is generated by shotgun or next-generation sequencing methods.
metagenome The sum of genomes of all members of a community of organisms.
omics Analytical tools that probe community samples at the molecular level (metagenomes, metatranscriptomes, and single-cell genomes), as well as whole-cell protein populations (proteomes). Examples include genomics, metagenomics, metatranscriptomics, and proteomics.
target community A community whose genomes are sequenced for metagenomic analysis.
marker sequence A short sequence of base pairs or of amino acid residues that is found specifically in one class of genes or proteins but absent from other known genes or proteins.
heat map A graph that represents data values as a range of colors to allow a visual grasp of trends.
nonparametric Describes statistical tests that do not require a normal distribution of replicate trials.
bin A set of sequences composed from metagenomic DNA reads showing a given level of similarity; each bin defines an operational taxonomic unit.
binning The sorting of metagenomic sequences into taxonomic bins. enrichment culture The use of selective growth media to allow only certain microbes to grow.
succession Change of species composition over time in a community or microbiome.
metatranscriptomics The study of all the RNA transcripts expressed by members of a community, known as a metatranscriptome.
niche An organism’s environmental requirements for existence and its relations with other members of the ecosystem.
niche construction The actions of an organism that alter its environmental niche and change its chance of survival in that niche.
cell sorting The separation and collection of classes of cells using fluorescent markers, as detected by flow cytometry.
flow cytometry A tool for analyzing cell populations, in which cells of multiple types are detected individually and distinguished by light scatter and fluorescence emission.
fluorescence in situ hybridization (FISH)
A technique to detect individual microbes in an ecological or clinical sample, using a fluorophore-labeled oligonucleotide probe (usually a short DNA sequence) that hybridizes to microbial DNA or rRNA.
assimilation An organism’s acquisition of an element, such as carbon from CO 2, to build into body parts.
primary producer An organism that produces biomass (reduced carbon) from inorganic carbon sources such as CO 2.
dissimilation An organism’s catabolism or oxidation of nutrients to inorganic minerals that are released into the environment.
biomass The mass found in the bodies of living organisms.
food web A network of interactions in which organisms obtain or provide nutrients for each other; for example, by predation or by mutualism.
trophic level A level of a food web representing the consumption of biomass of organisms from another level, usually closer to producers. consumer An organism that acquires nutrients from producers, either directly or indirectly.
grazer A first-level consumer, feeding directly on producers. predator A consumer that feeds on grazers.
decomposer An organism that consumes dead biomass.
detritus Discarded biomass that can be consumed by decomposers. abiotic Produced without living organisms; occurring in the absence of life.
symbiosis pl. symbioses The intimate association of two different species.
mutualism A symbiotic relationship in which both partners benefit. lichen A simple multicellular organism formed by a mutualistic relationship between a fungus and an alga or cyanobacterium. rhizobium pl. rhizobia A bacterial species of the order Rhizobiales that forms highly specific mutualistic associations with plants in which the bacteria develop into intracellular bacteroids that fix nitrogen for the plant.
bacteroid A cell wall–less, undividing, differentiated rhizobial cell within a plant cell. The bacteroid provides fixed nitrogen for the plant. coral bleaching The death or expulsion of coral algal symbionts. One cause is an increase in temperature.
synergism Cooperation between species in which both species benefit but can grow independently. The cooperation is less intimate than symbiosis.
commensalism An interaction between two different species that benefits only one partner.
amensalism An interaction between species that harms one partner but not the other.
parasitism A symbiotic relationship in which one member benefits and the other is harmed.
holobiont An entity composed of multiple types of organisms, including microbes.
syntrophy Metabolic cooperation between two different species; usually one member releases a product whose removal by the second species enables the pair to metabolize with a negative value of Δ G.
rumen The first chamber of the digestive tract of ruminant animals such as cattle; the main site for microbial digestion of feed. fistulated cow Also called cannulated cow. A cow in which a hole in the skin has been connected surgically to a hole in the rumen and fitted with a cannula, allowing access for experimental analysis of the rumen.
pelagic zone The water column of the open ocean, away from the shore and the ocean floor.
euphotic zone Also called photic zone. The region of the ocean that receives sunlight capable of supporting photosynthesis.
coastal shelf Shallow regions of the ocean, less than 200 meters deep, that are adjacent to land.
benthic organism An organism that lives on the ocean floor or within the sediment.
thermocline A region of the ocean where temperature decreases steeply with depth, and water density increases.
biochemical oxygen demand (BOD)
Also called biological oxygen demand. The amount of oxygen removed from an environment by aerobic respiration.
plankton Organisms that float in water.
microplankton Plankton consisting of microbes approximately 20–1,000 mm in diameter.
marine snow Microbial biofilms on particles suspended in marine water. phytoplankton Phototrophic marine bacteria, algae, and protists, the primary producers in pelagic food webs.
mixotrophy Metabolism that includes CO 2 fixation through photosynthesis and catabolism of organic compounds.
piezophile See barophile .
barophile Also called piezophile. An organism that requires high pressure to grow.
psychrophile An organism with optimal growth at temperatures below 20°C. thermal vent See hydrothermal vent .
hydrothermal vent Also called thermal vent. An opening in the seafloor through which superheated water arises, carrying high concentrations of reduced minerals such as sulfides.
thermophile An organism adapted for optimal growth at high temperatures, usually 50°C or higher.
oligotrophic Having dilute concentrations of nutrients.
eutrophic Describing a lake in which a high concentration of nutrients supports growth of algae to high densities.
algal bloom An overgrowth of algae on the water surface, caused by an increase in a limiting nutrient.
dead zone Also called zone of hypoxia. An anoxic region of an ocean or freshwater system, devoid of most fish and invertebrates. limiting nutrient A nutrient whose depletion generally restricts growth in a given ecosystem.
water table The layer of soil that is permanently saturated with water. endolith A bacterium that grows within the crystals of solid rock. rhizosphere The soil environment surrounding plant roots.
lignin A complex aromatic organic compound that forms the key structural support for trees and woody stems.
humic material Also called humus. Phenolic molecules, derived from lignin, that are resistant to degradation and hence very stable in soil. mycorrhizae sing. mycorrhiza Fungi involved in an intimate mutualism with plant roots, in which nutrients are exchanged.
ectomycorrhizae Mycorrhizae that colonize the surface of plant roots. Their mycelia do not penetrate the root cells.
endomycorrhizae Also called arbuscular mycorrhizae or vesicular-arbuscular mycorrhizae. Mycorrhizae whose fungal hyphae penetrate plant root cells.
vesicular-arbuscular mycorrhizae See arbuscular mycorrhizae .
wetland A region of land that undergoes seasonal fluctuations in water level and aeration.
hydric soil Soil that undergoes periods of anoxic water saturation. endophyte An endosymbiont of vascular plants.
haustorium pl. haustoria A bulbous hyphal extension of a fungal plant pathogen into the host cell.