Chapter introduction
Bats: the likely incubators of SARS-CoV-2. Bats, well known for harboring viruses that evolve into human pathogens, are suspected of being the natural source of the COVID-19 coronavirus. For instance, scientists discovered

On January 12, 2010, the small country of Haiti on the Caribbean island of Hispaniola was violently shaken by a magnitude 7.0 earthquake. Over 100,000 people died, thousands of buildings collapsed, and the already fragile sanitation system was severely crippled. Almost immediately, volunteers from around the world poured in to help rescue the living, recover the dead, and rebuild what little infrastructure remained. Then, in October, a cholera epidemic struck. Over the next 5 years, 700,000 cases of severe diarrhea (see Chapter 25) ravaged the populace, and more than 9,000 people died. Haiti had never experienced cholera before. Extensive epidemiological studies relying on clinical laboratory diagnostics and whole-genome sequencing strategies eventually traced the Haitian strain of Vibrio cholerae halfway around the world to a September 2010 cholera outbreak in Nepal. How did this faraway strain make it to Haiti so fast? Unwittingly, the United Nations sent troops infected with the organism from Nepal to Haiti to assist in the earthquake recovery effort. The Nepalese troops set up camp and used a nearby river for sanitation. The river became contaminated with V. cholerae and carried the pathogen through the town of Mirebalais, the site of the first reported cholera case. From methods of laboratory diagnostics and DNA analysis have improved our ability to track disease around the world. These techniques can even uncover new emerging pathogens as they evolve, allowing global health agencies to quickly detect outbreaks and swiftly implement containment measures that limit deaths. An obvious case in point is the COVID-19 pandemic. The world’s response to this disease, while not perfect, has been crucial for saving lives and illustrates the critical roles that diagnostics and epidemiology play in preserving humanity. The global agencies identify and trace outbreaks of known and even unknown infectious agents by monitoring and evaluating data supplied by countless regional clinical microbiology laboratories scattered around the globe. Here, in Chapter 28, we discuss the core principles of clinical microbiology and epidemiology that are used to identify, treat, and contain outbreaks and to predict emerging diseases.
We start by explaining the basic strategies and methodologies used to diagnose infectious diseases, and we end by discussing how epidemiologists track epidemics and identify emerging pathogens. Our goal is not to catalog every infectious disease, but to demonstrate general principles and problem-solving approaches. Recall that basic concepts of infectious disease—such as transmission, vectors, vehicles, and reservoirs—were described in Chapter 25.
28.1 Clinical Specimen Collection and Handlingnot assigned
As in any good detective mystery, the first step in investigating an infectious disease is to
identify the most likely suspects (Fig. 28.1 ) Presented with a patient, a clinician can
develop a list of possible suspects (called the differential) by observing the patient’s
symptoms and then recalling which organisms can produce those symptoms. Awareness of
a similar disease outbreak under way in the community is also helpful. Beyond these clues,
the clinician must rely on biochemical, molecular, serological, or antigen detection
strategies to identify the etiological agent.
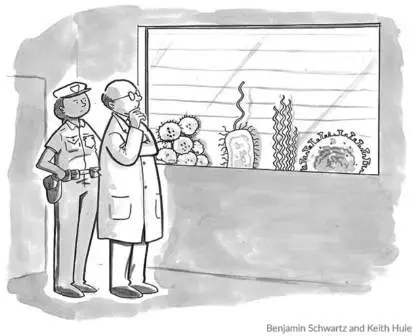
FIGURE 28.1 ■ The diagnostic differential lineup. “Ask number 4 to cough
again, please.”
CARTOONSTOCK
Why Take the Time to Identify an Infectious Agent?
Do we really need to identify the genus and species of an organism causing an infection?
Why not simply treat the patient with an antibiotic and be done with it? This approach may
sound appealing, but there are several compelling reasons to identify an infectious agent.
1. To provide effective treatment and limit antibiotic resistance. “Know your
enemy” is a good rule of war, and of medicine. Knowing the pathogen informs the clinician
how to treat an infection. Recall that different antibiotics affect different microorganisms;
that is, each antibiotic has its own spectrum of activity. Simply being aware of whether a
bacterial pathogen is Gram-positive or Gram-negative influences which antibiotic will be
used. Macrolides, for instance, are effective against most Gram-positive bacteria but
against only a few Gram-negatives. And viruses are not at all susceptible to antibiotics.
Using antibiotics to treat a patient with a viral disease will not effect a cure but can select
for antibiotic resistance in the microbiome.
Identifying any bacterial disease agent usually includes characterizing its antibiotic
resistance profile, which informs the choice of therapy. Antibiotic resistance profiles also
help global health organizations track the spread of antibiotic-resistant strains around the
world. For example, before 1970 most strains of Neisseria gonorrhoeae were susceptible to
penicillin. Today, most strains are resistant to penicillin and to many other antibiotics.
2. To prevent pathogen-specific disease complications. Many diseases have serious
complications that are common to a given organism or strain of organism. For example,
children whose sore throats are caused by certain strains of Streptococcus pyogenes can
develop serious complications long after the infection has resolved. These complications
are called sequelae (singular, sequela ) because they occur after the infection itself is
over. Sequelae are the immunological consequence of bacterial and host antigen cross-
reactivity. Life-threatening sequelae, such as rheumatic fever and acute glomerulonephritis
caused by certain strains of S. pyogenes, produce severe damage to the heart and kidney,
respectively. Knowing early on that S. pyogenes has caused a child’s sore throat enables
the physician to prescribe penicillin or penicillin-like antibiotics that will quickly eradicate
the infection and prevent the development of sequelae.
Note: As we saw in Chapter 27, resistance to antibiotics, especially penicillin, has
evolved in many species of pathogenic bacteria, including other species of streptococci
such as S. pneumoniae. Surprisingly, Streptococcus pyogenes has not evolved to become
penicillin resistant. It is not understood why.
3. To track disease spread through a population. Consider a situation in which ten
infants scattered throughout a city develop bloody diarrhea. The clinical laboratory
identifies Shigella sonnei, a Gram-negative bacillus, as the cause in each case. Are the
cases linked in some way?
Clinical microbiology labs use immunological or nucleic acid amplification tests to
subtype each diarrheal isolate (these methods are discussed later). Finding the same strain
(or subtype) of S. sonnei in all of the cases would suggest that they come from the same
source. Carriers of Shigella shed this organism in their feces, but inadequate handwashing
after defecation can leave bacteria on hands. Contaminated hands can then transfer the
pathogen to foods, utensils, or directly to another person. The challenge is to find the
source.
Informed that all of the infants have the same strain of Shigella, public health officials
question the parents and learn that all of the children attend the same day-care center. By
testing the other children and the workers in that center, officials can confirm the source
and stop the infection from spreading. This investigative process is called epidemiology
(covered in Section 28.4).
Specimen Collection and Processing
To diagnose an infectious disease, health care workers must collect, and the laboratory
must process, a wide variety of clinical specimens. The types of specimens range from
simple cotton swabs of sore throats to urine and fecal samples. Here we describe how
these samples should be collected. Note that, upon receiving and processing these
specimens, the clinical microbiologist must wear protective gloves and use a laminar flow
biosafety hood (see Fig. 5.30) as protection against self-inoculation with potential
infectious agents.
Some body sites should not contain any microorganisms (they are sterile) when
collected from a healthy individual. These include blood, cerebrospinal fluid (CSF), pleural
fluid from the space that lines the outside of the lungs, synovial fluid from joints, and
peritoneal fluid from the abdominal cavity. Because these sites are normally sterile,
specimens can be plated onto nonselective agar media as well as selective media.
Nonselective media, such as blood or chocolate agars, can be used because any organism
found in these specimens is considered significant.
Here is how samples are collected from sterile body sites:
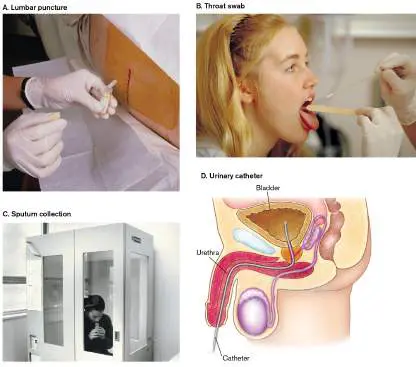
Cerebrospinal fluid (CSF). Lumbar puncture (spinal tap; Fig. 28.2A ) is used to
collect CSF. A long, thin needle is inserted between lumbar vertebrae L3 and L5, which
are safely located below the end of the spinal cord. Spinal fluid that slowly drips out of
the needle is collected in a sterile tube.
FIGURE 28.2 ■ Specimen collection. A. Lumbar puncture to obtain cerebrospinal
fluid. B. Throat swab. C. Sputum collection. A TB patient has coughed up sputum and
is spitting it into a sterile container. The patient is sitting in a special sputum collection
booth that prevents the spread of tubercle bacilli. The booth is decontaminated
between uses. D. Urinary catheter, showing placement in the urethra.
SIMON FRASER/RVI, NEWCASTLE UPON TYNE/SCIENCE SOURCE
WILL & DENI MCINTYRE/SCIENCE SOURCE
TERRY TUMPY/CDC
Blood samples. Blood is generally taken by syringe from two body sites and placed in
liquid media for aerobic and anaerobic culture. An organism isolated from both sites is
considered the likely etiological agent.
Pleural, synovial, and peritoneal fluid. Samples are aspirated by syringe. The fluid can
be viewed microscopically for inflammatory cells and inoculated to agar plates for aerobic
and anaerobic incubation.
Identifying pathogens present at body sites that contain normal microbiota is
more challenging. A stool or fecal sample, for instance, is normally teeming with
microbiota. These specimens are typically plated onto selective media—for
example, MacConkey, Hektoen, or colistin–naladixic acid (CNA) agar (described in Section
28.2)—to eliminate or decrease the number of normal microbiota that might contaminate
the specimen. The following techniques are used to collect specimens from nonsterile body
sites:
Swabs. Throat swabs (Fig. 28.2B ), for example, should be placed in specialized
liquid nutrient transport medium.
Sputum. Deep lung secretions are expectorated for oral collection (Fig. 28.2C ).
Stool samples. Stool is collected by cup or rectal swab, for identifying diarrhea-causing
microbes.
Abscesses. Samples from abscesses are collected by needle aspirations.
Urine samples. Samples for diagnosing urinary tract infections (UTIs) are obtained via
midstream clean catch (which may contain some microbiota from the urethra) or collected
from catheters placed in the bladder (should be sterile).
Urine is a special case. Urine in the bladder of a healthy individual was once considered
sterile. Studies now show that the bladder does, indeed, have normal microbiota (at low
numbers), although their role in human health is unclear (discussed in Section 26.4). Even
though we now know that the bladder contains normal microbiota, for practical purposes
clinical microbiologists still consider urine to be “sterile,” or nearly so. The symptoms of
urinary tract infections (which include increased frequency, painful urination, and
suprapubic or flank pain) occur only when significant numbers of easily grown, aerobic or
facultative microbes are present.
Urine is sampled in several ways. When collected from a catheterized patient, urine
should contain few, if any, aerobically culturable organisms. Catheterization involves
passing thin, sterile tubing through the urethra and directly into the bladder (Fig. 28.2D
). (Catheterization is used primarily to assist urination by immobilized patients, but it also
provides a convenient way to collect urine for bacteriological examination.) Unfortunately,
the simple process of inserting the catheter through the nonsterile urethra can sometimes
introduce organisms into the bladder and precipitate an infection. In addition, urine that
will be cultured from a catheterized patient should be collected from a port in the catheter,
never from the collection bag. Urine may sit for hours in the collection bag, so organisms
initially present at insignificant numbers have time to replicate to high numbers even if the
patient does not have a UTI.
When a catheter is not in place, urine is most commonly collected by what is called the
midstream clean-catch technique, which is performed by the patient. In this procedure, the
external genitals are first cleaned with a sterile wipe containing an antiseptic. The patient
then partially urinates to wash as many organisms as possible out of the urethra and, on
resuming urination, collects 5–15 milliliters of the midstream urine in a sterile cup. This
urine sample will usually not be sterile, because of urethral contamination, but the number
of bacteria will be low. The clinical laboratory determines how many organisms per
milliliter are present in the midstream catch and tells the physician whether an infection is
present. In a symptomatic patient, finding more than 1,000 organisms of a single species
per milliliter of midstream clean-catch urine is now considered indicative of an infection in a
symptomatic patient and is treated. However, finding 100,000 organisms or more per
milliliter in an asymptomatic patient is considered asymptomatic bacteriuria and is usually
not treated unless the patient is pregnant.
Note: The minimum standard for diagnosing a UTI used to be a finding of greater than
100,000 organisms per milliliter of urine. As noted in the text, this is no longer the case.
Once a specimen from any body site has been properly collected, it must be transported
to the clinical laboratory under conditions that will not undermine the viability of the
pathogen or promote the growth of microbiota, which can obscure a pathogen’s presence.
Then, after arriving in the lab, the sample must be processed quickly using protocols that
ensure the growth of likely pathogens. More on UTIs can be found in Section 26.4.
Case History: Abdominal Abscess
A 4-year-old boy was admitted to the hospital for evaluation and treatment of persistent
pain in the rectal area. His problem had begun about a week earlier with ill-defined pain in
that area. He had a white blood cell count of 24,900 per microliter (normal is 4,000–
11,000) with 87% neutrophils (normal is 60%). An abdominal computed tomography (CT)
scan revealed an abscess adjacent to his rectum. A needle aspiration drained 20 milliliters
of yellowish, foul-smelling fluid from the abscess. Aerobic cultures of this specimen plated
on blood and MacConkey agars were negative. Why didn’t the infectious agent grow?
The problem in this instance is related to specimen collection and processing. Internal
abscesses located near the gastrointestinal tract are usually anaerobic infections. In this
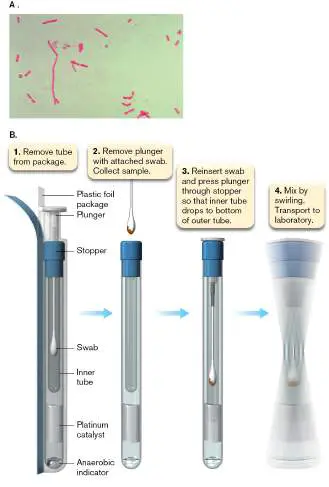
case the infection was caused by the Gram-negative rod Bacteroides fragilis, an obligate
anaerobe (Fig. 28.3A ). Section 5.4 discusses anaerobes, organisms that grow only with
extremely low oxygen. Intestinal microbes, the majority of which are anaerobic, can
sometimes escape the intestine if the organ is damaged in some way. The specimen in this
instance should have been collected under anaerobic conditions by aspiration into a
nitrogen-filled tube before transport to the clinical laboratory. Alternatively, a swab of the
abscess material can be inserted into a special transport tube that has a built-in oxygen
elimination system (Fig. 28.3B ). Because the specimen in the case presented here was
collected aerobically, many anaerobic microbes, including B. fragilis, were probably killed
by the oxygen.
FIGURE 28.3 ■ Anaerobic infection. A. Gram stain of Bacteroides fragilis (1.5–4
μm in length). B. Vacutainer anaerobic specimen collector. Plunging the inner tube to
the bottom will activate a built-in oxygen elimination system. The anaerobic indicator
changes color when anaerobiosis has been achieved.
DON STALONS/CDC
Nevertheless, B. fragilis has a stress response system that permits survival of this
anaerobe for 1 or 2 days in oxygen, so some of the bacteria may have survived transport.
The laboratory still had a chance to find the organism, which raises the second problem in
the case. After receiving the specimen, the lab cultured it only under aerobic conditions.
The laboratory should have also incubated a series of plates anaerobically (see Fig. 5.20).
This case, therefore, illustrates the importance of both proper specimen collection and
proper processing.
Biosafety: Proper Handling of Clinical Specimens
Medical and laboratory personnel are exposed to extremely dangerous pathogens on a
daily basis. When working with dangerous pathogens, clinical microbiologists must protect
themselves from accidental infection and at the same time be certain the pathogen does
not escape from the lab.
Case History: Fatal Meningitis
On July 15, an Alabama microbiologist was taken to the emergency room with acute onset
of generalized malaise, fever, and diffuse myalgias. She was given a prescription for oral
antibiotics and released. On July 16, she became tachycardic and hypotensive and returned
to the hospital. She died 3 hours later. Blood cultures were positive for Neisseria
meningitidis serogroup C. Three days before the onset of symptoms, the microbiologist had
prepared a Gram stain from the blood culture of a patient subsequently shown to have
meningococcal disease; she had also handled agar plates containing cerebrospinal fluid
(CSF) cultures from the same patient. Co-workers reported that fluids were aspirated from
blood culture bottles at the open laboratory bench. No biosafety cabinets, eye protection,
or masks were used for this procedure. Testing at the CDC indicated that the isolates from
both patients were indistinguishable. The laboratory at the hospital infrequently processed
isolates of N. meningitidis and had not processed another meningococcal isolate during the
previous 4 years.
The microbiologist in this case failed to take appropriate measures to protect herself and
ended up with a laboratory-acquired infection leading to meningitis. The CDC has published
a series of regulations designed to protect workers at risk of infection by human pathogens.
Infectious agents are ranked by the severity of disease and ease of transmission. The more
severe the disease or the more easily it is transmitted, the higher the risk category. On the
basis of this ranking, four levels of biological containment are employed (Table 28.1).
TABLE 28.1 Biological Safety Levels and Select Agents a
Biosafety level (BSL)
BSL-1 BSL-2 BSL-3 BSL-4
Class of
disease agent Agents not Agents of Agents may Dangerous
known to moderate cause disease by and exotic
TABLE 28.1 Biological Safety Levels and Select Agents a
cause disease. potential inhalation route. pathogens
hazard; also with high risk
required if of aerosol
personnel may transmission;
have potential only 11 labs
contact with in the United
human blood or States
tissues. handle
these.
Recommended
safety Basic sterile Level 1 Level 2 Level 3
measures technique; no procedures plus procedures plus procedures
mouth limited access to full body plus
pipetting. lab; biohazard wraparound complete
safety cabinets gowns, clothing
used; hepatitis respiratory change, one-
vaccination protection, piece
recommended. ventilation positive-
providing pressure
directional suits; lab
airflow personnel
(ventilation air must shower
into room, before
exhaust air leaving; lab
outdoors); is completely
restricted access isolated from
to lab (no other areas
unauthorized present in
persons). the same
building or is
in a separate
building.
Representative
organisms in Bacillus subtilis Bordetella Bacillus anthracis Ebola virus
class pertussis (anthrax)
E. coli K-12 Guanarito
Campylobacter Brucella spp. virus
Saccharomyces jejuni (brucellosis)
spp. Hantavirus
Chlamydia spp.
TABLE 28.1 Biological Safety Levels and Select Agents a
Clostridioides Burkholderia Junin virus
difficile mallei (glanders)
Kyasanur
Clostridium spp. California Forest
encephalitis virus disease virus
Corynebacterium
diphtheriae Coxiella burnetii Lassa fever
(Q fever) virus
Cryptococcus
neoformans EEE (eastern Machupo
equine virus
Cryptosporidium encephalitis)
parvum virus Marburg
virus
Dengue virus Francisella
tularensis Tick-borne
Diarrheagenic E. (tularemia) encephalitis
coli viruses
Japanese
Entamoeba encephalitis virus
histolytica
La Crosse
Giardia lamblia encephalitis virus
Haemophilus LCM
influenzae (lymphocytic
Helicobacter choriomeningitis)
pylori virus
Hepatitis virus Mycobacterium
tuberculosis
Legionella Rabies virus
pneumophila
Listeria Rickettsia
monocytogenes prowazekii
(typhus fever)
Mycoplasma Rift Valley fever
pneumoniae virus
Neisseria spp. SARS-CoV-1
Salmonella spp. (severe acute
respiratory
Shigella spp. syndrome) virus
TABLE 28.1 Biological Safety Levels and Select Agents a
Staphylococcus and SARS-CoV-2
aureus (COVID-19) virus
Toxoplasma Variola major
(smallpox) and
Pathogenic other poxviruses
Vibrio spp.
VEE (Venezuelan
Yersinia equine
enterocolitic a encephalitis)
virus
West Nile virus
Yellow fever
virus
Yersinia pestis
Biosafety level 1. BSL-1 organisms have little to no pathogenic potential and require
the lowest level of containment. Standard sterile techniques and laboratory practices
are sufficient.
Biosafety level 2. BSL-2 agents have greater pathogenic potential, but vaccines
and/or therapeutic treatments (for example, antibiotics) are readily available. The
pathogen in the case described here, Neisseria meningitidis, is in this risk group.
These agents require more rigorous containment procedures, such as limiting
laboratory access when experiments are in progress and using biological laminar flow
cabinets if aerosolization is possible.
Biosafety level 3. BSL-3 pathogens produce a serious or lethal human disease.
Vaccines or therapeutic agents may be available. To safely handle these organisms,
level 2 procedures are supplemented with wraparound gowns, respiratory protection, a
lab design ensuring that ventilation air flows only into the room and that exhaust air
vents directly to the outside, thus producing negative pressure. Negative pressure will
keep any organism that may aerosolize from escaping into hallways. In addition,
access to the lab is strictly regulated and includes double-door air locks at the
entrance. The SARS-CoV-2 virus is handled under BSL-3 precautions.
Biosafety level 4. BSL-4 is required by law to study extremely dangerous pathogens
for which there is no treatment or vaccine (for instance, the Ebola virus). Practices
here dictate that lab personnel change clothes upon entering and exiting the lab,
shower before exiting, and wear positive-pressure lab suits connected to a separate air
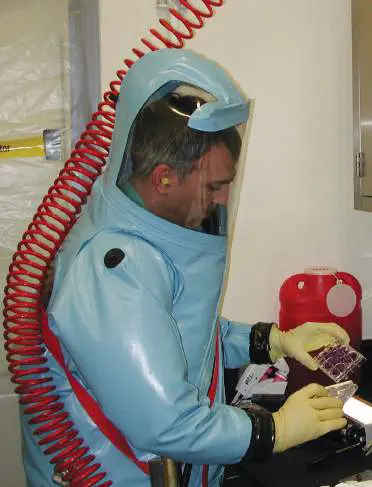
supply (Fig. 28.4 ). The positive pressure ensures that if the suit is penetrated,
organisms will be blown away from the breach and not sucked into the suit.
FIGURE 28.4 ■ Biosafety level 4 containment. Dr. Kevin Karem at the CDC
performs viral plaque assays to determine the neutralization potential of serum from
smallpox vaccination trials. He is protected by a positive-pressure suit while working in
a BSL-4 laboratory. The airflow into his suit is so loud that he must wear earplugs to
protect his hearing. Note that this virus is used under extremely tight security at the
CDC, one of only two places in the world allowed to work with the virus.
COURTESY OF DR. KEVIN KAREM/CDC
As reasonable as these regulations may seem, they were not always in effect. Before
1970, liquid cultures containing live organisms were routinely transferred from one vessel
to another by mouth pipetting (essentially using a glass or plastic pipette as a straw). This
practice is now forbidden, for obvious reasons. As of this writing, there are 11 BSL-4
laboratories operating in the United States.
It is important to note that clinical microbiology laboratories in the United States are
equipped to handle BSL-2 organisms. Patient samples suspected to contain an agent at
level 3 or higher are sent directly to regional reference laboratories or to the CDC for
analysis.
Thought Questions
28.1 Two blood cultures, one from each arm, were taken from a patient with high fever.
One culture grew Staphylococcus epidermidis, but the other blood culture was negative
(no organisms grew out). Is the patient suffering from septicemia caused by S. epidermidis
?
28.2 A 30-year-old woman with abdominal pain went to her physician. After examining
the patient, the doctor asked her to collect a midstream urine sample that would be sent to
the lab across town for analysis. The woman complied and handed the standard urine
collection cup to the nurse. The nurse placed the cup on a table at the nurses’ station.
Three hours later, a courier service picked up the specimen and transported it to the
laboratory. The next day the report came back: “Greater than 200,000 CFUs/ml; multiple
colony types; sample unsuitable for analysis.” Why was this determination made?
To Summarize
Identifying a pathogen enables clinicians to prescribe appropriate antibiotics ,
anticipate possible sequelae , and track the spread of the disease.
Specimen collection is a critical first step in the process of identifying a pathogen.
Common specimens include blood, pus, urine, sputum, throat swabs, stool, and
cerebrospinal fluid.
Specimens from sites containing normal microbiota must be collected, handled,
and processed differently from specimens taken from normally sterile body sites.
Suspecting that anaerobes might be present also affects how specimens are
handled.
A specimen from an abscess or other infection that might contain
anaerobes must be collected and processed under anaerobic conditions.
Various levels of protective measures are used in handling potentially infectious
biological materials. Biosafety level 1 agents are generally not pathogenic and
require the lowest level of containment.
Biosafety level 2 agents are pathogenic but not typically transmitted via the
respiratory tract. Laminar flow hoods are required.
Biosafety level 3 agents are virulent and transmitted by the respiratory route.
They require laboratories with special ventilation and air-lock doors.
Biosafety level 4 agents are highly virulent and require the use of positive-
pressure suits.
Glossary
sequela pl. sequelae
A serious, harmful immunological consequence of bacterial and host antigen cross-
reactivity that occurs after the infection itself is over. An example is rheumatic fever.
epidemiology
The study of factors affecting the health and illness of populations.
Fig. 5.30
FIGURE 5.30 ■ Biological safety cabinet. A. A scientist examines a sample
under the hood. B. Schematic of the safety cabinet. Air from the room enters the
cabinet through the cabinet opening (1) or is pumped in (2) through a HEPA filter
(3). It then passes behind the negative-pressure exhaust plenum (4) and is
passed from the cabinet through another HEPA filter (5). C. Antibacterial activity
of silver-silica coated particles on an air filtration unit. The primary function of this
filter is to kill airborne microorganisms caught on the surface of the filter, thus
protecting against secondary contamination by microorganisms in air filtration
systems. The photo shows that Staphylococcus epidermidis cells attached to the
smaller silver-silica beads on the filter fiber have an altered morphology.
WILL & DENI MCINTYRE/SCIENCE SOURCE
REPUBLISHED WITH PERMISSION OF ROYAL SOCIETY OF CHEMISTRY. Y. KO ET AL. 2014. J. MATER.
CHEM. B, NO. 39
Fig. 5.20
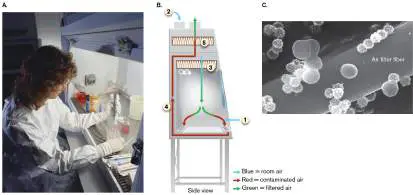
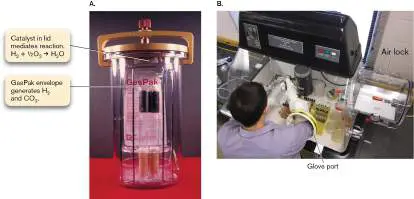
FIGURE 5.20 ■ Anaerobic growth technology. A. An anaerobe jar. B.
Student researcher using an anaerobic chamber with glove ports.
JACK BOSTRACK/VISUALS UNLIMITED
JOAN SLONCZEWSKI
Endnotes
1. Note a: Organisms in blue are on the list of CDC select agents that are considered
possible agents of bioterrorism. Modified from Biosafety in Microbiological and
Biomedical Laboratories, 5th ed. Centers for Disease Control and Prevention. Return
to reference a
28.2 Pathogen Identification by Culture and Phenotypenot assigned
Once a specimen is collected, how are pathogens identified? A variety of techniques can be used, such as staining of clinical specimens to reveal the presence of organisms, nucleic acid assays, serology (testing a patient’s serum for the presence of antibodies reactive against a specific microbe), and detection of biochemical clues left by the pathogen in vivo or in vitro. In this section we focus on the classical methods of identification: staining and metabolic profiles. In Section 28.3 we consider molecular and serological methods of identification.
Staining
Some specimens, such as CSF and sputum, can be directly stained with the Gram stain procedure (described in Section 2.4) or the acid-fast stain. Knowing that an organism is Gram-positive, Gram-negative, or acid-fast guides which additional tests the clinical microbiologist must run. The case that follows illustrates how the acid-fast stain is critical for presumptively identifying mycobacteria.
Case History: Tuberculosis
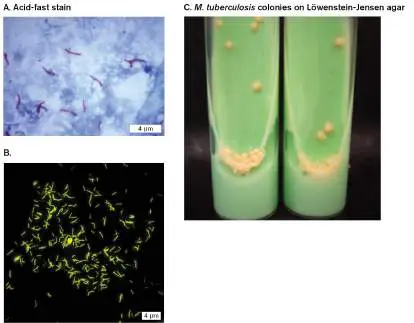
A 31-year-old man presented to an emergency department in New York City after experiencing gross hemoptysis (blood in sputum). He had a 2-month history of productive cough, a 25-pound weight loss, night sweats, and fatigue. A chest X-ray revealed bilateral cavitary infiltrates in his lungs. The initial sputum specimen was negative by Gram stain but positive for acid-fast bacilli (Fig. 28.5A). The specimen was submitted for a nucleic acid amplification test (NAAT) to detect 16S rRNA, as well as for culture and sensitivity. The patient had a history of heavy alcohol and drug use.
FIGURE 28.5 ■ Acid-fast stain and growth of Mycobacterium tuberculosis. A. Acid-fast Ziehl-Neelsen stain of M. tuberculosis. B. Auramine O fluorescent acid-fast bacilli (AFB) stain. C. Löwenstein-Jensen medium enables growth of mycobacterial species, some of which grow extremely slowly. The colonies have a “bread crumb–like” appearance.
CDC
SITTIPONG SREECHAT/© 123RF.COM
AGARWAL, S., ET AL. 2005. ANN CLIN MICROB ANTI 4 (18)
The likely suspect in this case is Mycobacterium tuberculosis, although other mycobacterial species are possible causes. M. tuberculosis is presumptively diagnosed in the clinical laboratory by the acid-fast stain, a technique first described in 1882 (called the
Ziehl-Neelsen stain) that is used to find the tubercle bacillus in a patient’s sputum. The acid-fast stain enables a technician to visualize bacteria such as Mycobacterium species that are not stained by the Gram stain. Mycobacteria have a waxy outer coat composed of mycolic acid that resists penetration by most dyes—an obstacle the acid-fast stain was designed to overcome.
The original Ziehl-Neelsen acid-fast stain used phenol and heat to drive carbolfuchsin (a red dye) into mycobacterial cells on glass slides. Destaining with an acidic alcohol solution removes the stain from all cell types except mycobacteria. The slide is subsequently counterstained with methylene blue, after which the mycobacteria will be seen as curved, red rods (the acid-fast bacilli), while everything else will appear blue (Fig. 28.5A). A more modern version of the acid-fast stain uses the fluorochrome auramine O to stain the mycolic acid (Fig. 28.5B ). This dye also resists removal by an acidic alcohol wash, so the mycobacteria will fluoresce bright yellow-green when observed under a fluorescence microscope. Although the acid-fast stain is very useful, it detects organisms in the sputum of tuberculosis patients only about 60% of the time; and even if they are found, confirmatory tests are needed for a definitive diagnosis. Growth-dependent identification of M. tuberculosis typically starts with inoculating the sputum sample to a blue-green Löwenstein-Jensen medium (selective for mycobacteria) and waiting several weeks for the organism to grow before additional tests can be done (Fig. 28.5C ). While the organism grows, however, a rapid nucleic acid amplification test can be used to quickly detect even small amounts (Section 28.3).
Growth and Biochemical Testing
Once stained samples have been viewed and the Gram reaction of the organisms is known, the conventional laboratory approach used to identify bacterial pathogens requires understanding basic microbial physiology and its many variations. Thousands of bacterial species are capable of causing disease, but no two species have the same biochemical “signature.” The clinical microbiologist can look for reactions, or combinations of reactions, that are unique to a given species, as in the following case history.
Case History: Meningitis
A 4-week-old girl with no significant previous medical history came to the emergency room crying uncontrollably, particularly when the physician tried to move her head. The day before coming to the ER she was vomiting. She was not on any medications, and she lived with her parents and two older brothers, all of whom were well. Cerebrospinal fluid (CSF) was collected from a spinal tap. The CSF appeared cloudy (it should be clear) and contained 871 white blood cells per microliter (normal is 0–10), the glucose level was 1 milligram per deciliter (normal is 50–80), and the total protein level was 417 milligrams per deciliter (normal is less than 45). Gram stain of a CSF smear revealed Gram-negative rods. The CSF sample was sent to the diagnostic laboratory for microbial identification. As discussed in Thought Question 26.11, low glucose and elevated protein levels in CSF are indicators of bacterial (not viral) infection. The increase in white blood cells revealed that the baby’s immune system was trying to fight the disease. The presence of Gram-negative rods in the CSF smear confirmed a diagnosis of bacterial meningitis, since CSF should be sterile. Now it was up to the clinical laboratory to determine the etiological agent.
Algorithms to identify bacteria. Over the years, clinical microbiologists have developed algorithms (step-by-step problem-solving procedures) that expose the most likely cause of a given infectious disease. For instance, only a limited number of microbes are known to cause meningitis. The microbiologist poses a series of binary yes/no questions about the clinical specimen in the form of biochemical or serological tests. This type of tool is called a dichotomous key. Typical questions in this case might include: Is an organism seen in the CSF of a patient with symptoms of meningitis? Is the organism Gram-positive or Gram-negative? Does it stain acid-fast? Answers to a first round of questions will then dictate the next series of tests to be used.
Because speed is of the essence in deciding how to treat the patient, a slew of tests are carried out simultaneously, but the results are interpreted sequentially using the algorithm. In our case history, for instance, consider the most common causes of bacterial meningitis: Neisseria meningitidis, Streptococcus pneumoniae, Haemophilus influenzae, and Escherichia coli.
The CSF sample was Gram-stained and simultaneously plated onto three media: chocolate agar, blood agar, and Hektoen agar. Chocolate agar is an extremely rich medium that looks brown, owing to the presence of heat-lysed sheep red blood cells (Fig. 28.6A and B ). Because it is so nutrient-rich, all four organisms will grow on chocolate agar. However, nutritionally fastidious organisms such as N. meningitidis and H. influenzae will not grow well, if at all, on ordinary blood agar, because these bacteria cannot lyse red blood cells and release required nutrients. Less fastidious organisms, such as S. pneumoniae and E. coli, will grow on blood agar, but of these two, only E. coli can grow on Hektoen agar (Fig. 28.6C–E ), which is a selective and differential medium for enteric Gram-negative rods. Hektoen is selective because bile salts and dyes inhibit the growth of Gram-positives. It is differential because the medium reveals organisms that ferment lactose or sucrose and produce hydrogen sulfide. Differential and selective media are described in Section 4.3.
FIGURE 28.6 ■ Chocolate agar (A and B) and Hektoen agar (C–E), two widely used clinical media. A.
Uninoculated chocolate agar. Its color is due to gently lysed red blood cells that provide a rich source of nutrients for fastidious bacteria. B. Chocolate agar inoculated with Neisseria gonorrhoeae. This organism will not grow well on typical blood agar because important nutrients remain locked within intact red blood cells. C. Uninoculated Hektoen agar, which contains lactose, peptone, bile salts, thiosulfate, an iron salt, and the pH indicators bromothymol blue and acid fuchsin; the bile salts prevent growth of Gram-positive microbes. D. Hektoen agar inoculated with Escherichia coli. This organism ferments lactose to produce acid-fermentation products that give the medium an orange color, owing to the pH indicators acid fuchsin and bromophenol blue. E. Hektoen agar inoculated with Salmonella enterica. This organism does not ferment lactose but grows instead on the peptone amino acids. The resulting amines are alkaline and produce a more intense blue color with bromothymol blue. Salmonella species also produce hydrogen sulfide gas from the thiosulfate. Hydrogen sulfide reacts with the
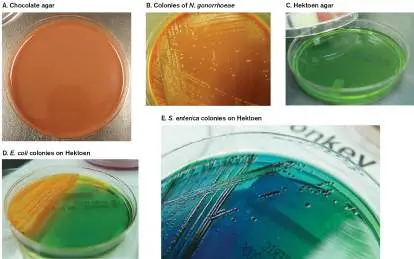
medium’s iron salt to produce an insoluble, black iron sulfide precipitate visible in the center of the colonies.
COURTESY OF DR. JOHN W. FOSTER
COURTESY OF DR. JOHN W. FOSTER
COURTESY OF DR. JOHN W. FOSTER
COURTESY OF DR. JOHN W. FOSTER
COURTESY OF DR. JOHN W. FOSTER
In our case history, the Gram stain of the CSF revealed Gram-negative rods, which ruled out N. meningitidis (a Gram-negative diplococcus) and S. pneumoniae (a Gram-positive diplococcus). The organism in CSF did grow on blood agar, which eliminated H. influenzae (a Gram-negative, nonenteric rod) as a candidate. It also grew on Hektoen, where it produced orange, lactose-fermenting colonies. Thus, the organism was a Gram-negative, enteric rod, and likely E. coli, probably a strain of neonatal meningitis E. coli (NMEC). Additional biochemical tests confirming the identity of the organism had to be carried out, but this simple example shows how simultaneous tests can be interpreted.
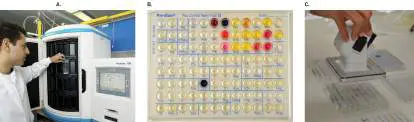
Identifying Gram-negative bacteria. The Gram-negative bacterium in this case was subjected to a battery of 36 biochemical tests in an automated microbial identification instrument (Fig. 28.7A). Most clinical laboratories in the United States and Europe now use these automated identification systems. The organism is inoculated into the wells of a prepared microtiter dish in which each well contains materials that test an organism’s ability to ferment different carbon sources or make different metabolic end products ( Fig. 28.7B and C ). By monitoring the growth or change in color produced in different wells, the instrument can quickly identify the pathogen’s metabolic profile, sometimes within 5–6 hours. For each bacterial species, the system’s software “knows” the probability that a given reaction will be positive or negative for a given species. Known as a probabilistic indicator, the computer program will integrate all the metabolic reaction results for an unknown bacterial isolate and determine whether the overall probabilities for these reactions match those of a specific pathogen.
FIGURE 28.7 ■ Automated microbiology system. A. The BD Phoenix 100 system uses plates with numerous reaction wells and a computerized plate reader to automatically identify pathogenic bacteria. This type of instrument automatically generates and evaluates the numbers. B. Microbial identification plate. C. Loading a multiwall ID plate with a multichannel pipettor. All wells are simultaneously loaded with the same volume and number of bacteria.
TEK IMAGE/SCIENCE SOURCE
JOHN W. FOSTER
JOHN W. FOSTER
A simplified example of the pathogen identification process is shown in Figure 28.8. The analytical profile index (API) 20E strip can test 20 metabolic processes (listed in Table 28.2). An uninoculated control and strips for two organisms are pictured in Figure 28.8. Overnight incubation is needed before the chamber reactions can be read, so the API strip does not deliver results as quickly as the automated systems do. Different-colored reactions in each chamber are scored as positive or negative, depending on the color. For example, in the indole chamber (well 9), a red reaction at the top of the tube is positive and indicates that the organism can produce indole from tryptophan (Fig. 28.8B ). A colorless chamber (Fig. 28.8C ) would be a negative result. The positive and
negative results can also be used to generate a seven-digit number that identifies the bacterium.
FIGURE 28.8 ■ API 20E strip technology for the biochemical identification of Enterobacteriaceae. A.
Uninoculated API strip. Each well contains a different medium that tests for a specific biochemical capability. The well numbers correspond to Table 28.2. The color of each medium after 24-hour incubation indicates a positive or negative reaction (see Table 28.2). B, C . API results for E. coli (B) and Proteus mirabilis (C) . Plus (+) and minus (−) indicate positive and negative reactions, respectively.
© CHRISTIAN GANET
BIOMERIEUX
BIOMERIEUX
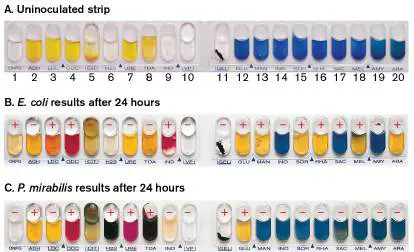
TABLE Reading the API 20E 28.2
Well Test Reaction tested number 1 ONPG a Beta-galactosidase 2 ADH Arginine dihydrolase 3 LDC Lysine decarboxylase 4 ODC Ornithine decarboxylase 5 CIT Citrate utilization 6 H 2 S H 2 S production 7 URE Urea hydrolysis 8 TDA Tryptophan deaminase 9 IND Indole production 10 VP Acetoin production 11 GEL Gelatinase 12 GLU Glucose fermentation/oxidation 13 MAN Mannitol fermentation/oxidation 14 INO Inositol fermentation/oxidation
TABLE Reading the API 20E 28.2
15 SOR Sorbitol fermentation/oxidation 16 RHA Rhamnose fermentation/oxidation 17 SAC Sucrose fermentation/oxidation 18 MEL Melibiose fermentation/oxidation 19 AMY Amygdalin fermentation/oxidation 20 ARA Arabinose fermentation/oxidation We can use the results of the API chambers as a dichotomous key, by making a stepwise interpretation that begins with a key reaction. A simplified dichotomous key using a limited number of enteric Gram-negative species is shown in Figure 28.9. Often, the first reaction examined is lactose fermentation (tagged “ONPG” in Table 28.2). The lactose reaction is read as positive or negative, depending on the color. Then, following a printed flowchart, the technician goes to the next key reaction—say, indole production— and reads it as positive or negative. If the organism is a lactose fermenter and the indole test is positive, then the choices have been narrowed to E. coli or Klebsiella species (the other lactose-positive, indole-positive organisms in the figure do not cause meningitis). Another reaction is read to distinguish between the next two choices. The process continues until a single species is identified.
FIGURE 28.9 ■ Simplified biochemical algorithm to identify Gram-negative rods. The diagram presents a dichotomous key using a limited number of biochemical reactions and selected organisms to illustrate how species identifications can be made using biochemistry. Abbreviations and reactions: ADH: stepwise degradation of arginine to citrulline and ornithine; CIT: citrate utilization as a carbon source; GLU: glucose fermentation to produce acid; H 2 S: production of hydrogen sulfide gas; IND: indole production from tryptophan; LDC: cleavage of lysine to produce CO 2 and cadaverine; ODC: cleavage of ornithine to make CO 2 and putrescine; ONPG: lactose fermentation to produce acid (ortho -nitrophenyl-beta-D -galactoside, cleaved by beta-galactosidase); SOR: sorbitol fermentation to produce acid; URE: production of CO 2 and ammonia from urea; VP: production of acetoin or 2,3-butanediol. (Note: “Neg” for Pseudomonas in terms of glucose indicates an inability to ferment glucose. Pseudomonas can still use glucose as a carbon source.)
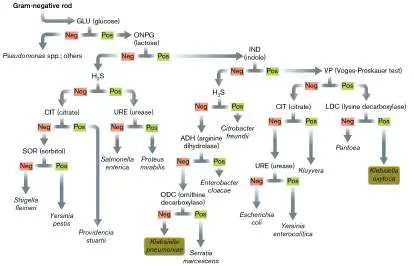
In reality, many more reactions than the 11 shown in Figure 28.9have to be used to make a definitive identification because of species differences with respect to a single reaction. For example, the figure shows that Klebsiella pneumoniae and Klebsiella oxytoca (highlighted in yellow) exhibit opposite indole reactions, even though they are of the same genus. Even within a given species, only a certain percentage of strains might be positive for a given reaction. The inherent danger in using a dichotomous key, as opposed to a probabilistic system, is that one anomalous result can lead to an incorrect identification. Be aware, too, that the phenotypic dichotomous key does not mirror a phylogeny tree, in which the two Klebsiella species would branch from a common ancestor.
Identifying nonenteric Gram-negative bacteria. The procedures we have outlined will accurately identify members of Enterobacteriaceae, but there are pathogenic Gram-negative bacilli found in other, nonenteric, families. For instance, one possibility in the preceding case history is that the Gram-negative bacillus seen in CSF smears would not grow on blood agar or on the other selective media, but would grow as small, glistening colonies on chocolate agar. This result would implicate the Gram-negative rod Haemophilus influenzae.
Meningitis caused by H. influenzae was a major problem prior to 1988, before the introduction of a vaccine containing H. influenzae type b capsular material. Growth of H. influenzae requires hemin (X factor) and NAD (V factor), so confirming the identity of H. influenzae involves growing the organism on agar medium containing hemin and NAD (nicotinamide adenine dinucleotide). Small filter-paper disks containing these compounds are placed onto a nutrient agar surface (not blood agar) that has been covered with the organism. H. influenzae will grow only around a strip containing both X and V factors. Alternatively, X and V factors can be incorporated into Mueller-Hinton agar, as shown in Figure 28.10A. The organism grows on chocolate medium because the lysed red blood cells release these factors. Although the XV growth phenotype is still used today for identification, fluorescent antibody staining (discussed in Section 28.3) is more specific.
FIGURE 28.10 ■ Haemophilus influenzae growth factors and Neisseria meningitidis oxidase reaction. A. H.
influenzae will grow on an agar plate (here, Mueller-Hinton agar) only when the medium has been fortified with both X factor (hemin) and V factor (NAD), but neither one alone. Nor will the organism grow on blood agar. B. Oxidase-positive reaction for N. meningitidis. Oxidase reagent (which is colorless) was dropped onto colonies of N. meningitidis grown on chocolate agar (arrow indicates oxidase-positive colonies). The test is called the cytochrome oxidase test, but it really tests for cytochrome c.
BRENDA MILLER AND JOHN FOSTER, UNIVERSITY OF SOUTH ALABAMA
COURTESY OF DR. JOHN W. FOSTER
A completely different identification scheme would have been used in the preceding meningitis case if the laboratory had discovered the organism to be a Gram-negative diplococcus (rather than a Gram-negative rod). A Gram-negative diplococcus would suggest Neisseria meningitidis. N. gonorrhoeae is also possible, but it is less likely because the gonococcus lacks the protective capsule that N. meningitidis uses to protect itself from complement in the bloodstream. Without this capsule, N. gonorrhoeae cannot disseminate to the meninges.
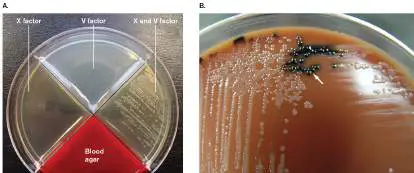
The first test to determine whether the organism is a species of Neisseria is the cytochrome oxidase test (Fig. 28.10B ).
Cytochrome oxidase is the terminal oxidoreductase for O 2 (discussed in Chapter 14). In this test, a few drops of the colorless reagent N, N, N´, N´ -tetramethyl-p -phenylenediamine dihydrochloride are applied to the suspect colonies. The reaction takes place only if the organism possesses both cytochrome oxidase and cytochrome c. The combined action of the cytochromes will turn the p -phenylenediamine reagent (and the colony) a deep purple/black. Many bacteria possess cytochrome oxidase, but only a few genera, such as Neisseria, also contain cytochrome c in their membranes. Oxidase-positive organisms use cytochrome oxidase to oxidize cytochrome c, which then oxidizes p -phenylenediamine. Other oxidase-positive bacteria include Pseudomonas, Haemophilus, Bordetella, Brucella, and Campylobacter species—all of them Gram-negative rods. None of the Enterobacteriaceae, however, are oxidase-positive, because they lack cytochrome c.
An oxidase-positive, Gram-negative diplococcus is very likely a member of Neisseria. Differentiation between species of Neisseria is based on their ability to grow on certain carbohydrates, or it can be determined using immunofluorescent antibody staining tests that test for the presence of different capsule antigens in N. meningitidis. Fluorescent antibody tests are discussed in Section 28.3. Identifying Gram-positive pyogenic cocci. Recall from Section 26.1 the case of the woman with necrotizing fasciitis. How did the laboratory determine that the etiological agent was Streptococcus pyogenes? A sample algorithm, or flowchart (Fig. 28.11), shows how this is done. The physician sends a cotton swab containing a sample from a lesion to the clinical laboratory. The laboratory technician streaks the material onto several media: (1) plain blood agar (which will grow both Gram-positive and Gram-negative organisms); (2) blood agar containing the inhibitors colistin and naladixic acid (called a CNA plate, this agar will grow only Gram-positives); and (3) MacConkey agar (which will grow only Gram-negative organisms; see Section 4.3). The suspect organism in this case grows on the CNA and blood plates. Because it grows in the presence of the Gram-negative inhibitory compounds in CNA, one would immediately suspect the organism to be Gram-positive—an assumption borne out by the Gram stain.
FIGURE 28.11 ■ Algorithm for identifying Gram-positive pathogenic cocci. The red arrows follow the identification of Streptococcus pyogenes. The bacitracin and optochin results are designated “positive” if the organism is susceptible and “negative” if the organism is resistant to the agent.
Source: All photos courtesy of Dr. John W. Foster.
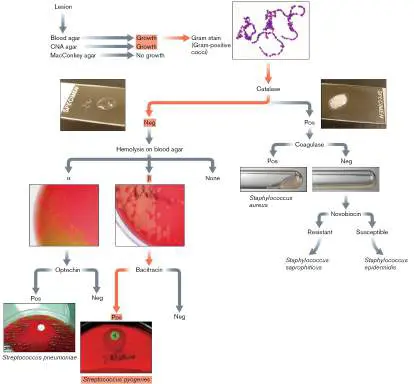
Note: Though the skin, as in the necrotizing fasciitis case, is
normally populated by many different microorganisms, samples from an infected lesion are overwhelmingly populated by the etiological agent. The pathogen predominates because it outgrows normal microbiota. Using selective media (CNA) to isolate the infectious agent will further simplify diagnosis by decreasing the growth of any normal microbiota that may still be present.
The algorithm tells the laboratory technician that since the organism is a Gram-positive coccus, the next step is to test for catalase production. Remember, Gram stain morphology alone is not enough to definitively differentiate the two genera. Catalase, which converts hydrogen peroxide (H 2 O 2) to O 2 and H 2 O, clearly distinguishes staphylococci (catalase-positive) from streptococci (catalase-negative). In the catalase test, a colony is mixed with a drop of H 2 O 2 on a glass slide. Effusive bubbling due to the release of oxygen indicates catalase activity (see Fig. 28.11). Note that many other organisms possess catalase activity, including the Gram-negative rod E. coli. According to the algorithm, however, E. coli would not be considered, because it does not grow on CNA agar and is not Gram-positive.
Note: When performing a catalase test from colonies grown on
blood agar, be sure not to transfer any of the agar, since red blood cells also contain catalase.
Having established that the organism is catalase-negative, the technician examines the blood plate for evidence of hemolysis. Three types of colonies are possible: nonhemolytic, alpha-hemolytic, and beta-hemolytic. Nonhemolytic streptococci do not produce any lytic zone. Alpha-hemolytic strains produce large amounts of hydrogen peroxide that oxidize the heme iron within intact red blood cells to generate a green product. As a result, alpha-hemolytic streptococci produce a green zone around their colonies called alpha “hemolysis”—even though the red blood cells remain intact. (For example, Streptococcus mutans, a cause of dental caries and subacute bacterial endocarditis, is alpha-hemolytic.) Still other streptococci produce a completely clear zone of true hemolysis surrounding their colony. This is called beta hemolysis. Red blood cells are hemolyzed completely by exported enzymes, called hemolysins, that lyse red-cell membranes. The flowchart in Figure 28.11indicates that the organism from the case history was beta-hemolytic.
The final relevant test in this flowchart is susceptibility to the antibiotic bacitracin, which identifies the most pathogenic group of beta-hemolytic streptococci, called group A streptococci, or GAS. The beta-hemolytic streptococci are subdivided into immunologically distinct Lancefield groups (A–U), based on the carbohydrate antigen anchored to peptidoglycan. Rebecca Lancefield (Fig. 28.12), for whom the classification scheme is named, was the first to use immunoprecipitation to group the streptococci (immunoprecipitation is described in eAppendix 3). The vast majority of streptococcal diseases are caused by g roup A beta-hemolytic s treptococci (also called GAS), defined as the species Streptococcus pyogenes. FIGURE 28.12 ■ Rebecca Lancefield. In 1918, Dr. Lancefield joined the Rockefeller Institute for Medical Research in New York City, where she studied the hemolytic streptococci, known then as Streptococcus haemolyticus. She was the first to use serum precipitation methods to classify S. haemolyticus into

groups according to differences in cell wall carbohydrate antigens. The basic technique is still used today and, in her honor, is known as the Lancefield classification scheme.
PF- (BYGONE 1)/ALAMY STOCK PHOTO
Unfortunately, the lengthy Lancefield classification procedure is unsuitable as a rapid identification method. However, GAS are uniformly susceptible to the antibiotic bacitracin, whereas other groups of Streptococcus are resistant. Thus, a simple antibiotic disk susceptibility test can be used to indicate GAS (that is, S. pyogenes ). But beware—many bacteria are bacitracin sensitive, so, like the catalase test, to be useful for identification the bacitracin test must be used in conjunction with an algorithm. The technician must follow the appropriate algorithm before assigning importance to this or any other test result. It is irrelevant, for instance, if an alpha-hemolytic organism is bacitracin susceptible. Some of these may exist, but they are not associated with disease. The organism in our case of necrotizing fasciitis, however, was beta-hemolytic, so bacitracin susceptibility indicated that the organism was S. pyogenes.
The other tests named in Figure 28.11are equally important for identifying Gram-positive infectious agents. For example, Streptococcus pneumoniae is an important cause of pneumonia. Like S. pyogenes, S. pneumoniae is a catalase-negative, Gram-positive coccus; but unlike S. pyogenes, it is alpha-hemolytic. Optochin susceptibility is a property closely associated with S. pneumoniae, while other alpha-hemolytic strains of streptococci are resistant to this compound. Thus, an optochin susceptibility disk test is a useful tool for identifying S. pneumoniae.
Another important part of the Gram-positive algorithm is a test for the enzyme coagulase. Coagulase catalyzes a key reaction used to distinguish the pathogen Staphylococcus aureus —a cause of many types of infections, but especially boils—from other staphylococci, such as the normal skin species Staphylococcus epidermidis. To test for coagulase, a tube of plasma is inoculated with the suspect organism. If the organism is S. aureus, it will secrete the enzyme coagulase to convert fibrinogen to fibrin, which produces a clotted, or coagulated, tube of plasma (a coagulase-positive reaction; Fig. 28.11). Coagulase-negative staphylococci can still be medically important, however. Staphylococcus saprophyticus, for instance, is an important cause of urinary tract infections. Resistance to novobiocin distinguishes S. saprophyticus from S. epidermidis.
Thought Question
28.3 Use Figure 28.11to identify the organism from the following case: A sample was taken from a boil located on the arm of a 62-year-old man. Bacteriological examination revealed the presence of Gram-positive cocci that were also catalase-positive, coagulase-positive, and novobiocin resistant.
To Summarize
Direct Gram or acid-fast stains are appropriate procedures to perform on some specimens. The results guide the direction of subsequent testing.
Specimens can be cultured on selective media to prevent growth of some bacteria while permitting growth of others (such as Gram-positive bacteria versus Gram-negative bacteria). Plating on differential media can expose unique biochemical properties that distinguish a pathogen from similar-looking nonpathogens.
Growth-dependent pathogen identification uses numerous, simultaneously run biochemical tests. An algorithm or a dichotomous key is applied to the results to identify the species. Different algorithms (or decision trees) are applied to Gram-positive and Gram-negative bacteria.
Glossary
probabilistic indicator A method used to identify an unknown strain of bacteria. The results of a battery of biochemical tests performed on the unknown strain are compared to the probabilities that a known species will have the same results.
Endnotes
1. Note a: ONPG = ortho -nitrophenyl-beta-D -galactoside. Return to reference a
28.3 Molecular and Serological Identification of Pathogensnot assigned
Conventional, Media-dependent methods used to identify pathogens can take a minimum of 3
days to complete and may take several weeks, depending on the pathogen. Brucella species,
for instance, can take 14–21 days to grow in blood culture bottles. (Blood culture bottles are
not called “negative for growth” until after 21 days of incubation.) Any delay, however long, is
annoying for the physician and agonizing for the patient awaiting a cure. Today, technologies
that offer more rapid identification, sometimes within minutes, have been introduced into the
clinical laboratory.
Identification by Mass Spectrometry
Section 8.4 describes how mass spectrometry works and its use in identifying proteins
extracted from cells. This technology has now been applied to the rapid identification of
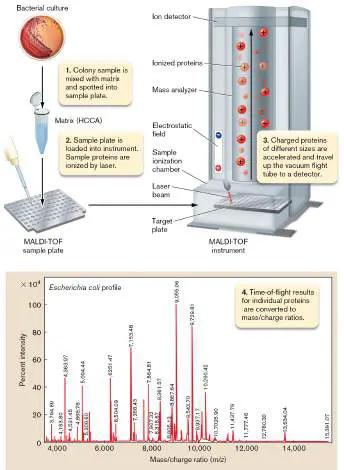
bacterial pathogens in a clinical laboratory. The specific technique, shown in Figure 28.13 , is
called matrix-assisted laser desorption/ionization time-of-flight (MALDI-TOF) mass
spectrometry and is based on the fact that each pathogen has its own unique protein
signature. Bacterial cells from a colony are fixed in a matrix (Fig. 28.13 , step 1) and
irradiated by a laser beam (step 2) that releases proteins from the fixed cells and places a
charge on them (ionizes them). The intact but ionized proteins enter a vacuum where they are
accelerated by an electrostatic field (step 3). The ionized proteins then race toward a detector
at different speeds that depend on each ion’s charge and mass. Large (heavy) proteins with a
high mass-to-charge ratio take longer to reach the detector than do smaller (lighter) proteins
having a low mass-to-charge ratio. The resulting pattern of peaks, called the protein
signature, is compared against a growing database derived from different species of
microorganisms previously subjected to the procedure (step 4).
FIGURE 28.13 ■ MALDI-TOF MS identification of bacterial pathogens. Step 1:
Bacterial colony is spotted into a well of the sample plate. Step 2: Laser ionizes proteins.
Step 3: Charged proteins of different sizes travel at different speeds to the detector.
Step 4: Mass/charge peaks form a signature used to identify the organism.
Source: E. coli profile modified from “Identification of Microorganisms” (Shimadzu), fig. 1,
https://www.shimadzu.com/an/industry/pharmaceuticallifescience/proteome0207005.htm.
JOHN FOSTER, UNIVERSITY OF SOUTH ALABAMA
Many hospital laboratories have invested in MALDI-TOF equipment because it offers
significant advantages over classic methods of identification. As noted earlier, it typically takes
2–3 days to identify a pathogen using classic biochemical methods. With mass spectrometry, it
takes only 1 day to culture a specimen and find a suspicious colony, then 5 minutes more for
MALDI-TOF to identify the culprit. MALDI-TOF can also determine whether an organism has
antibiotic resistance determinants. The procedure can be used on positive blood cultures
(sepsis) or directly on urine samples (cystitis) and cerebrospinal fluid (meningitis).
Nucleic Acid–Based Detection
Most diagnostic laboratories today use rapid DNA-based methods in addition to conventional
Petri dish microbiology. The DNA-based methods can take less than an hour to detect and
identify bacteria and viruses. DNA/RNA detection methods are especially useful for viruses,
which otherwise require elaborate electron microscopy to view morphology, or serology to
detect an increased presence of antiviral antibodies. The problem with serology is that by the
time these antibodies become detectable in blood, the patient is either acutely ill (IgM
elevated) or already recovering from the disease (IgG elevated).
Nucleic acid amplification tests (NAATs). NAAT assays are the most widely used
molecular tools in the diagnostic toolbox. These tests include the polymerase chain reaction
(PCR), which uses a heat-resistant DNA polymerase and thermocycling to amplify DNA (see
eAppendix 3), and several isothermal amplification techniques that require neither. One
isothermal amplification technique, called recombinase polymerase amplification (RPA), is
described later. In general, NAAT assays use oligonucleotide primers to bind and amplify
species-specific genes in a pathogen’s DNA or RNA genome. Successful amplification is
visualized as an appropriately sized DNA fragment (amplicon) in agarose gels following
electrophoresis or is revealed by accumulation of a fluorescence signal, as in real-time PCR (
eAppendix 3) or FRET (fluorescence resonance energy transfer) analysis (see Section 25.6).
Why is NAAT needed to detect the presence of these nucleic acids? Without the
amplification steps, clinical samples usually provide too little nucleic acid from infecting
microorganisms to be detected. For example, sputum samples containing Mycobacterium
tuberculosis, the cause of tuberculosis, yield minuscule amounts of bacterial DNA. Amplifying
M. tuberculosis nucleic acid by PCR, however, will turn one copy of a species-specific gene into
billions of copies.
NAAT assays are also very quick compared to classic cultural methods (but they take more
effort to run than does pathogen identification by mass spectrometry). Extracting the DNA or
RNA from a clinical specimen for PCR usually takes an hour. Amplification itself is completed in
1–2 hours or less if thermocycling is not required. Detection of amplified DNA by DNA gel
electrophoresis takes an additional 1–2 hours. But fluorescence detection is immediate. So,
what might take 2–3 days (or sometimes weeks) using biochemical algorithms may take only
an hour or two using NAAT, if the required primer set is on hand.
PCR and other NAAT assays can detect the presence of many viral and bacterial pathogens
in a wide array of samples. For instance, these techniques can detect SARS-CoV-2 in patient
samples or in wastewater, and they can identify Borrelia burgdorferi (the cause of Lyme
disease) within its tick vector. Obligate intracellular bacterial pathogens that cannot grow in
artificial media are easily identified by NAAT in patient samples. A single PCR test can quickly
screen vaginal secretions for the presence of Chlamydia trachomatis (an obligate intracellular
pathogen) and the Gram-negative pathogen Neisseria gonorrhoeae. Figure 28.14 illustrates
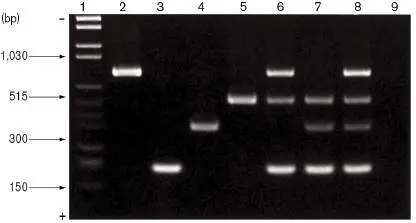
how PCR is used to distinguish different strains of the anaerobic pathogen Clostridium
botulinum, the cause of food-borne botulism. Unlike Streptococcus pneumoniae, strains of C.
botulinum are not typed serologically; they are divided into different types based on the
neurotoxin genes they possess. In this example, multiplex PCR was used to simultaneously
search for these toxin genes.
FIGURE 28.14 ■ Multiplex PCR identification of Clostridium botulinum . C.
botulinum cells are typed by which toxin genes a strain possesses, not on the basis of
surface antigens. Isolates can be typed in a single PCR reaction that includes primer pairs
specific for each of the four major toxin genes: types A, B, E, and F. Because multiple PCR
products are sought in a single reaction, this technique is called multiplex PCR. Each lane
in the agarose gel was loaded with a multiplex reaction made from different isolates of C.
botulinum and subjected to electrophoresis. The slower-moving fragments (toward the
top of the gel) are larger than those moving farther down the gel toward the positive
pole. Lane 1 shows DNA size markers.
LINDSTRÖM, M., ET AL. 2001. APPL AND ENVIRON MICROBIO 67: 5694.
Multiplex PCR uses multiple sets of primers, one pair for each gene, combined in a single
tube with a specimen. Care must be taken to be sure that the primers chosen make different-
sized products, do not interfere with each other, and do not produce artifactual (biologically
false) products that can confuse interpretation. Multiplex PCR can help identify sets of specific
genes present in a single species or can screen for the presence of multiple pathogens in a
clinical sample. In the latter, primer sets are designed to amplify genes unique to each
pathogen. More on multiplex PCR can be found in eAppendix 3.
Rapid, next-generation DNA sequencing. How can you identify a pathogen in a seriously
sick patient if you do not know what you are looking for? In 2014, a 14-year-old boy with
severe combined immunodeficiency (SCID) was in a medically induced coma at a Wisconsin
hospital. His brain had swollen with fluid as a result of encephalitis, but its cause was
unknown. Diagnostic tests (including PCR) for the usual causes of encephalitis failed to find
answers, and empiric antibiotic treatments did not provide relief. In a last attempt to discover
the infection’s cause, the boy’s physicians contacted Joseph DeRisi and Charles Chiu at UC San
Francisco, who are renowned for their use of next-generation DNA sequencing (see eAppendix
3) to identify pathogens. The scientists used this technology to perform an unbiased
metagenomic analysis of all the DNA contained in the boy’s cerebrospinal fluid.
After 3 million DNA fragments were sequenced, the answer was apparent. There, staring
out from among the sequences of the boy’s genome, were DNA sequences of the spirochete
Leptospira santarosai, an easily treatable organism. After being given intravenous high-dose
penicillin for 7 days, the boy eventually recovered.
Leptospirosis is a zoonotic disease. The organism is excreted in the urine of infected
animals, usually into nearby bodies of freshwater. The child probably contracted the disease
during a trip to Puerto Rico, where he swam in freshwater. This metagenomic strategy to
detect pathogens is not widely used yet because of its complexity and cost, but soon it could
be used in regional laboratories to diagnose any infection.
Thought Question
28.4 Why didn’t immunological tests initially identify antibodies to Leptospira in the
comatose boy?
As you’ve seen, NAAT assays can quickly identify microbial DNA in clinical samples, but
what about RNA? The answer is yes: NAAT assays that detect RNA are very important for
diagnosing certain viral infections. In fact, you may have already been tested by PCR for the
SARS-CoV-2 virus that causes COVID-19 (see Section 26.2). The following case describes a
different viral disease diagnosed by NAAT whose epidemiology is distinct from COVID-19.
Case History: West Nile Virus
A 55-year-old man complaining of headache, high fever, and neck stiffness was admitted to a
local hospital. The man appeared confused and disoriented. He also complained of muscle
weakness. History indicated he had received several mosquito bites approximately 2 weeks
previously. A blood specimen was sent to the laboratory. The report the following day
indicated that the patient was suffering from West Nile disease.
West Nile virus (WNV) is a positive-sense, RNA-containing virus that infects primarily birds and
culicine mosquitoes (a group of mosquitoes that can transmit human diseases). Humans and
horses serve only as incidental, dead-end hosts for the virus. A dead-end host does not
develop high titers of a given virus in its blood and so cannot pass that virus to other biting
mosquitoes. Replication of WNV in the bird-mosquito-bird cycle begins when adult mosquitoes
emerge in early spring and continues until fall. Among humans, the incidence of disease peaks
in late summer and early fall. Birds provide an efficient means of geographic spread of the
virus. As a result, the virus has spread throughout much of the United States since the first
U.S. cases were detected in 1999.
Isolating and culturing a disease-causing virus is extremely challenging. Most laboratories
are not equipped for the special tissue culture techniques required. Consequently, the means
of diagnosing many viral infections, including human WNV infections, has been to measure the
antibody response of the patient (described shortly). For instance, the presence of West Nile
virus–specific IgM in cerebrospinal fluid is a good indicator of current WNV infection, but it is
indirect and inconclusive. Real-time PCR is a molecular test that can quickly reveal the
presence of the viral RNA.
Thought Question
28.5 Why does finding IgM to West Nile virus indicate a current infection? Why wouldn’t
finding IgG indicate the same?
Quantitative reverse-transcription PCR (qRT-PCR). The qRT-PCR technique is used
routinely for the high-throughput diagnosis of many viral pathogens, including the West Nile
virus and the cause of COVID-19, the SARS-CoV-2 virus (see Section 26.2). Because both
West Nile virus (Flaviviridae family) and SARS-CoV-2 virus (Coronaviridae family) contain
single-stranded RNA, their RNA genomes must be converted to DNA using reverse
transcriptase before PCR can be attempted. The quantitative advantage of qRT-PCR is that the
number of viral RNA molecules present in a sample is an indicator of how many virus particles
are there.
The basic technique is this: RNA is first extracted from the sample, and a DNA primer
specific to a viral RNA sequence is added. Once annealed, the primer enables reverse
transcriptase to synthesize the first strand of a complementary DNA (cDNA; Fig. 28.15 ).
Reverse transcriptase then digests the initial RNA while synthesizing the opposite DNA strand.
The more virus particles there are in the sample (that is, the greater the viral load), the more
viral RNA will be present and the more cDNA product will be made. The cDNA is then amplified
by PCR using two specific primers and a heat-stable DNA polymerase such as Taq polymerase
(see eAppendix 3).
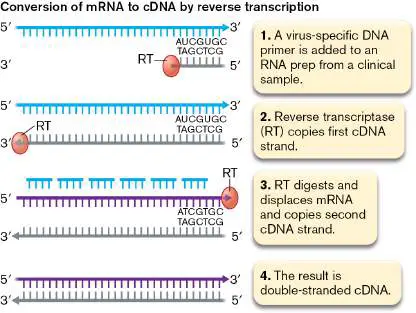
FIGURE 28.15 ■ Identifying viruses by reverse-transcription PCR. Reverse
transcriptase uses viral RNA as a template to make DNA. The DNA can then be amplified
by standard PCR methods.
In one method, a third, fluorescent oligonucleotide (called the probe) is added to the PCR
reaction (see eAppendix 3, Fig A3.10). The probe contains a fluorescent dye at the 5′ end
and a chemical dye at the 3′ end that quenches (absorbs) energy emitted from the fluorescent
dye. As long as the two chemicals are kept in close proximity by the intact probe, no light is
emitted. The probe is designed to anneal to a sequence between the binding sites of the two
other oligonucleotide primers (modifications on the ends of the probe prevent it from being
used as a primer). So, in a successful amplification, Taq polymerase will synthesize DNA from
the two outside primers and degrade the probe oligonucleotide as it passes through that area.
This cleavage separates the dye from the quencher, and the dye begins to fluoresce. The more
viral RNA there is in a sample, the fewer cycles it takes for cDNA to accumulate and register a
fluorescence increase over background (Fig. 28.16 ). The amount of fluorescence emitted is
proportional to the amount of cDNA and, thus, viral RNA present in the sample.
FIGURE 28.16 ■ Results of quantitative (real-time) PCR. A. The exponential
increase in PCR products after each cycle of hybridization and polymerization. The switch
to yellow indicates the point where the increase in product plateaus because the primers
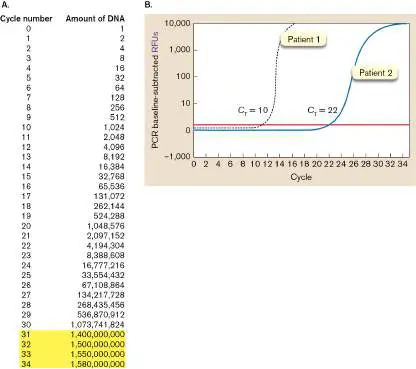
have been exhausted. B. There is an increase in relative fluorescence units (RFUs) as the
fluorescent dye is released from the dual-labeled probe during quantitative PCR. The red
line indicates background fluorescence threshold. The cycle at which fluorescence rises
above background is the cycle threshold (C T). In patient 1, the dashed curve shows that
the fluorescent PCR product remained flat for the first ten cycles because the amount of
DNA made and, therefore, the level of fluorescent dye released remained below
background. After cycle 10, fluorescence increased logarithmically: C T = 10. For patient
2, the solid blue curve representing PCR product remained below detection for 22 cycles
and then increased: C T = 22. The more starting DNA there is, the sooner RFU values will
increase over background (that is, the fewer cycles will be needed to see the increase
over background). The slope eventually decreases because the fluorescent probe has
become limiting.
Thought Question
28.6 If the results in Figure 28.16 came from testing for HIV RNA, then which patient
would have the higher viral load in their blood?
Programmable RNA sensors. Zika virus is an insect-borne pathogen that causes serious
developmental defects, such as microcephaly in infected fetal brains (see Section 28.5). The
virus was considered a public health emergency in 2016. Keith Pardee (University of Toronto)
and Alexander Green (Arizona State University), shown in Figure 28.17A and B , with a
team of scientists led by James Collins, designed a quick and easy diagnostic test for Zika virus
using synthetic-biology approaches (see Section 12.4). The test takes only 3 hours to
complete. In short, an RNA molecule (called a “trigger”) is synthetically made from any Zika
virus that may be present in a host sample. The trigger RNA is added to a toehold riboswitch
sensor that normally prevents translation of the LacZ message (beta-galactosidase). If the
trigger RNA anneals to the sensor RNA, it releases the toehold and LacZ is made. This cell-free
test and others like it are currently being evaluated as biomolecule sensors that can be
incorporated into wearable materials.
FIGURE 28.17 ■ Diagnostic riboswitch sensor (toehold switch sensor) for
detecting Zika virus. A and B. Keith Pardee and Alexander Green designed the new
rapid test for Zika virus. C. Method to generate trigger RNA from Zika virus particles
present in a clinical sample. D. Toehold switch sensor. Binding of trigger RNA to the
toehold sensor releases the sequestered ribosome-binding site (RBS) and start codon and
enables translation of the LacZ message. Insets: Negative (left) and positive (right) tests
for Zika virus.
Source: Parts C and D modified from Pardee et al. 2016. Cell 165 :1255–1266.
COURTESY OF ARIZONA STATE UNIVERSITY
BIODESIGN INSTITUTE AT ARIZONA STATE UNIVERSITY
PARDEE ET AL. 2016. CELL 165:1255–1266.
Details of the test are illustrated in Figure 28.17C . First, a trigger RNA is generated from
Zika virus present in a serum sample using the recombinase polymerase amplification (RPA)
technique. An oligonucleotide trigger primer is added to the serum sample extract (Fig.
28.17C , step 1). The trigger primer binds to a unique Zika virus RNA sequence. Reverse
transcriptase then generates a cDNA template using the primer. The cDNA is made double-
stranded by a second primer, whose 3′ end binds to the cDNA and whose 5′ end includes a T7
phage promoter sequence (step 2). T7 RNA polymerase is then added to the new double-
stranded cDNA to generate multiple copies of Zika trigger RNA (step 3). Recombinase
polymerase amplification is a type of isothermal DNA amplification, because thermocycling, as
used by PCR, is not needed. The trigger RNA (evidence that the sample contained Zika virus)
will then trip the riboswitch, called a “toehold” switch, in the next phase of the test (step 4).
The synthetically constructed toehold riboswitch sensor is shown in Figure
28.17D . The RNA switch contains a hairpin structure that blocks translation of
downstream LacZ RNA by sequestering the LacZ ribosome-binding site (RBS) and start
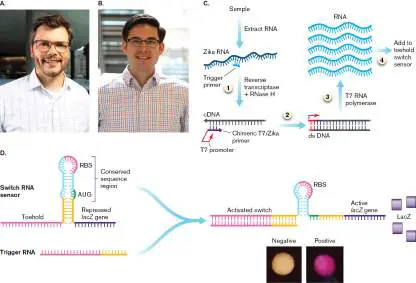
codon. When Zika trigger RNA (made previously) is added, the trigger RNA binds to the
toehold switch and releases the LacZ RBS and start codon. Translation of the mRNA produces
LacZ protein that will convert a yellow substrate to a purple product (a positive test). Once the
trigger RNA is added to the switch, the mixture is placed on paper disks containing protein
synthesis components, which, after an hour, are analyzed by an electronic reader. This paper-
based, rapid-test product underwent patient and field trials in Brazil, Ecuador, and Colombia.
In the trials, it proved as accurate as qRT-PCR tests in identifying patients with Zika virus. Its
development provides a glimpse of what synthetic biology can bring to the field of rapid
diagnostics. Special Topic 28 explores another exciting and novel approach in diagnostics that
uses CRISPR technology to detect a pathogen’s nucleic acid signature and metaphorically
sends out a fluorescent “signal flare.”
SPECIAL TOPIC 28 Next-Generation Diagnostics: CRISPR Launches a “Flare”
CRISPR technology, described in Chapter 12, has made precision in vivo editing of DNA
possible. The workhorse enzyme for editing, Cas9, is an RNA-guided endonuclease that
targets and cleaves DNA with high sequence specificity. Using different bioengineered
guide RNAs, Cas9 can recognize any DNA molecule from any source, including pathogens.
This capability would be great for diagnostics, but how do we know when the
endonuclease finds its target in a clinical sample?
Jennifer Doudna, one of the discoverers of CRISPR editing technology, and her
colleagues (Fig. ST 28.1 ) found an answer using a different Cas enzyme, Cas12a, from
Lachnospiraceae, a family of gut microbes in the Clostridiales order of Firmicutes. As
Figure ST 28.2 shows, Cas12a also uses a guide CRISPR RNA (crRNA) to target a
specific DNA sequence for cleavage by the enzyme’s RuvC endonuclease region. However,
when a CRISPR-Cas12a protein cleaves double-stranded DNA in a sequence-specific
manner, a robust nonspecific ssDNA nuclease activity is also activated. The researchers
predicted that if Cas12a was guided to cleave a specific pathogen’s DNA—say, HPV
(human papillomavirus)—it would activate the nonspecific endonuclease activity, which
could then cleave a separate, reporter ssDNA called a DETECTR (DNA endonuclease–
targeted CRISPR trans reporter).
FIGURE ST 28.1 ■ Members and cofounders of Mammoth Biosciences, a
company that develops commercial pathogen detection kits based on
DETECTR technology. Janice Chen, Trevor Martin, and Lucas Harrington were
principal cofounders of Mammoth Biosciences. Pictured from left to right are Lucas
Harrington, James Broughton, Ashley Tehranchi (now CEO at Stealth), Andy Lane
(now at Square), Janice Chen, Pedro Galarza (now at Immunai), and Trevor Martin.
Jennifer Doudna is not shown.
COURTESY OF LUCAS HARRINGTON/MAMMOTH BIOSCIENCES
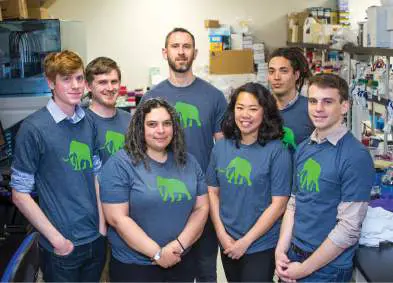
FIGURE ST 28.2 ■ Functions of sequence-specific endonuclease and
nonspecific nuclease of Cas12a. crRNA is the guide RNA that directs Cas12a to
the DNA target. Pathogen target DNA is prepared from patient samples using RPA
isothermal amplification. The RuvC region of Cas12a contains the endonuclease
activity that generates a 5′ overhang staggered cut in the target strand (TS) and the
nontarget strand (NTS). Activation of the RuvC site also activates a nonspecific
endonuclease that cleaves the ssDNA FQ reporter, which releases a fluorescent
signal. PAM = protospacer adjacent motif.
Source: Modified from Chen et al. 2018. Science 360 :436–439, figs. 1A and 4C.
The DETECTR ssDNA has a fluorescent tag (F) at one end and a quenching tag (Q) at
the other end. The quenching tag absorbs energy released from the fluorescent tag.
Consequently, there is no fluorescence when the ssDNA reporter is intact. If Cas12a
becomes activated by a specific dsDNA target (pathogen DNA), the nonspecific
endonuclease of Cas12a will degrade the ssDNA FQ reporter and release the fluorescent
tag. Fluorescence means the pathogen was present in the patient sample. Thus, having
detected the pathogen, CRISPR launches a kind of fluorescent “flare.” Figure ST 28.3
shows the specificity by which Cas12a loaded with crRNA targeting HPV16 (panel A) or
HPV18 (panel B) differentiates between the two viruses. A single DETECTR probe can be
used for any pathogen, but different guide RNAs must be used depending on the
pathogen. Unleashing the ssDNase activity of Cas12a provides a new strategy to improve
the speed, sensitivity, and specificity of molecular diagnostics.
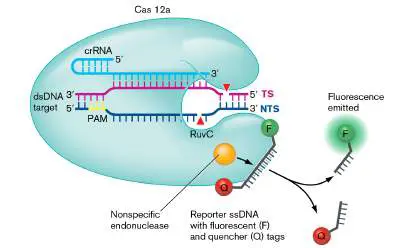
FIGURE ST 28.3 ■ DETECTR distinguishes between two different HPV
sequences. Cas12a was assembled with guide RNA targeting either HPV16 (A) or
HPV18 (B) .
Source: Modified from Chen et al. 2018. Science 360:436–439, fig. S10D and E.
RESEARCH QUESTION
How might you turn a system like this into a multiplex assay—that is, design a single
reaction mix that can detect several different target pathogens at the same time. Hint:
Cas13 enzymes are similar to Cas12a, except that different Cas13 enzymes taken from
different species will collaterally cleave different FQ dinucleotide reporters.
Janice S. Chen, Enbo Ma, Lucas B. Harrington, Maria Da Costa, Xinran Tian, et al. 2018. CRISPR-
Cas12a target binding unleashes indiscriminate single-stranded DNase activity. Science 360 :436–439.
Diagnosis by profiling gut microbiota. As noted in Chapter 23, the proper balance
between Firmicutes, Proteobacteria, and Bacteroidetes within the gut microbiome is important
to human health. Dysbiosis of the gut microbiome has been linked to several serious diseases,
including Crohn’s, ulcerative colitis, irritable bowel syndrome (IBS), inflammatory bowel
disease (IBD), diabetes, and obesity. Consequently, finding ways to identify and correct
microbiome imbalances before a patient develops chronic disease has been an important goal
of gastroenterologists.
Several companies have been formed to achieve this goal. For example, Christina Casén
and colleagues at Genetic Analysis AS devised a diagnostic test for gut dysbiosis. The test uses
54 DNA probes that target taxon-specific variable regions within 16S ribosomal DNA (labeled
V3–V7 in Fig. 28.18A ). Probes that bind to a region are fluorescently labeled by PCR and
mixed with bar-coded magnetic pull-down beads containing complementary probes. The level
of fluorescence associated with each bar-coded probe reflects the prevalence of a particular
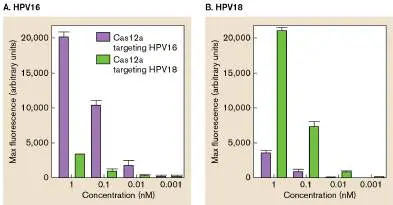
taxonomic group. Figure 28.18B shows a profile of a healthy microbiome compared to IBS
and IBD patient profiles. The data indicate, for instance, that the IBS patient harbors more
Firmicutes than a healthy subject does; in contrast, the IBD patient has fewer Firmicutes.
FIGURE 28.18 ■ Profiling the gut microbiome in healthy and dysbiotic
individuals. A. The DNA region encoding bacterial 16S ribosomal RNA. Areas labeled
V1–V7 mark the variable regions that differ between species and phyla. B. The specific
region encompassing V3–V7 was PCR-amplified from the bacterial DNA extracted from
fecal samples of healthy individuals, people with irritable bowel syndrome (IBS), and
individuals with inflammatory bowel disease (IBD). Different oligonucleotide probes
hybridize to V regions specific to different species. Probes that hybridize were
fluorescently labeled by a DNA polymerase and fished out of the mix by bar-coded
complementary oligonucleotides attached to magnetic beads. In the two bar graphs, the
amount of fluorescence for a specific probe reflects the abundance of the corresponding
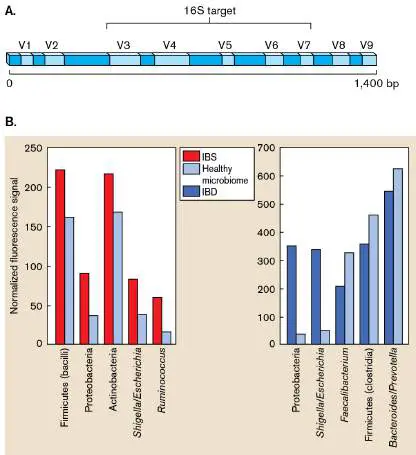
bacterial species or phylum. Modified from Casen et al. 2015. Aliment. Pharmacol. Ther.
42 :71–83.
How might profiling gut microbiota contribute to patient care? IBS, for instance, is currently
diagnosed in broad subgroups based on clinical symptoms (diarrhea, chronic constipation, or a
mix). Patients within subgroups, however, harbor very different microbiota. So, profiling
patient microbiota can lead to more specific diagnoses. Profiling microbiota can also indicate
how a patient might respond to treatments such as anti–tumor necrosis factor. Fecal
bacteriotherapy (fecal transplant) might then convert a nonresponder profile into a responder.
Finally, monitoring the profile of a recovered patient could signal a coming relapse. Preventive
medication could shorten the period to remission.
Immunology-Based Pathogen Detection
In addition to directly identifying a pathogen by culture isolation or by NAAT detection, clinical
laboratories can use immunological techniques to find evidence of a pathogen in patient
tissues or in serum, as seen in the following case history.
Case History: Ebola Outbreak
On December 26, 2013, an 18-month-old West African boy in the town of Meliandou, Guinea,
fell ill with a mysterious disease of high fever, black stools, and vomiting. He died 2 days later.
By January 2014, several members of the boy’s family, as well as staff at the nearby
Guéckédou hospital, had developed similar symptoms that included severe bloody diarrhea. All
died. Then, in February, a member of the boy’s family traveled to the capital city, Conakry,
where he, too, fell ill and died. The cause remained unknown, and no precautions were taken.
Consequently, over the next month the illness spread to four other prefectures in Guinea,
killing at least half of those infected. In March, a World Health Organization (WHO) laboratory
at the Pasteur Institute in France finally identified the agent as the Zaire strain of Ebola virus,
the most deadly form of this filovirus. Laboratory confirmation tests included qRT-PCR, viral
antigen detection, and antibody ELISA tests. Unfortunately, identification of the virus came too
late to stop the horrific Ebola epidemic that swept through western Africa in 2014–2015, killing
thousands.
Ebola is another RNA virus, but one far more deadly than the West Nile virus identified in the
earlier case history. Pathogenesis of Ebola was discussed in Section 26.5 (see Fig. 26.35). This
case history includes many elements of epidemiology (discussed later), all of which rely on an
ability to identify the presence of the virus. Note that another series of Ebola outbreaks
developed during 2018 in the war-torn Democratic Republic of the Congo, but those infections
appear to be unrelated to the 2014 epidemic. A recombinant Ebola vaccine (rVSV-ZEBOV) was
approved by the FDA in 2019 and was used during the outbreak.
Diagnosis of Ebola involves three techniques. We already discussed qRT-PCR, but what
serological tests were used?
The ELISA test. Enzyme-linked immunosorbent assay (ELISA) is an immunological technique
that can detect antigens or antibodies present in picogram quantities. (A picogram is one one-
thousandth of a nanogram.) One form of ELISA detects serum antibodies. It is carried out in a
96-well microtiter plate, which allows multiple patient serum samples to be tested
simultaneously. An antigen from the virus (Ebola in this case) is attached (adsorbed) to the
plastic of the wells (Fig. 28.19 ). Albumin or powdered milk is used to block the remaining
sites on the plastic that could result in false positives. Patient serum is then added.
FIGURE 28.19 ■ Enzyme-linked immunosorbent assay (ELISA). ELISA is used to
detect anti-Ebola antibodies circulating in patient serum. The 96-well plate can be used to
make dilutions of a single patient’s serum to more precisely determine the amount of
anti-Ebola antibody, or it can be used to test samples from multiple patients.
Ebola-specific antibodies present in the serum will react with the antigen attached to the
microtiter plate. The antigen-antibody complex is then reacted with rabbit antihuman IgG to
which an enzyme has been attached, or conjugated (for example, horseradish peroxidase).
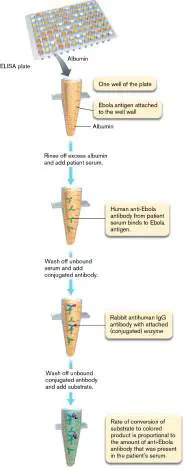
The result is a chain of viral antigen connected to patient antibody connected to rabbit
antibody-enzyme conjugate. The chain links the enzyme to the well. The chromogenic
substrate for the enzyme is added next (for example, tetramethylbenzidine). If enzyme-
conjugated antibody has bound to human IgG captured by the antigen in the well, the enzyme
will convert the substrate to a colored product (blue for tetramethylbenzidine). Enzyme activity
can be measured with a microplate reader. The amount of colored product formed, detected
as absorbance with a spectrophotometer, will indicate the amount of anti-Ebola antibody
present in the patient sample.
Thought Question
28.7 Why does adding albumin or powdered milk prevent false positives in ELISA?
Antigen capture is another ELISA technique, but in this instance, anti-Ebola antibody, not
viral antigen, is adsorbed to the wells of a microtiter plate (Fig. 28.20 ). Patient serum is
then added to the wells. If the serum contains Ebola antigen, the antigen will be captured by
the antibody attached to the well. Then a second, enzyme-conjugated, antibody against the
Ebola antigen is added. The more antigen there is in the serum, the more enzyme-linked
antibody will affix to the well. Addition of the appropriate chromogenic substrate will produce
a colored product that can be measured. The more antigen there is present in the serum, the
more colored product will form.
FIGURE 28.20 ■ Antigen-capture ELISA. This ELISA technique captures Ebola
antigens circulating in patient serum.
Antibody against Ebola, or any other viral pathogen, may be easier to detect than viral
antigen because antibodies will be present at higher levels than is the virus itself. But since
there is a delay between the time when the virus is first present in serum and when the body
manages to make antibody, directly detecting viral antigen enables earlier diagnosis.
Thought Question
28.8 Specific IgG antibodies against an infectious agent can persist for years in the
bloodstream, long after the infection resolves. How is it possible, then, that IgG antibody titers
can be used to diagnose recently acquired diseases such as infectious mononucleosis? Couldn’t
the antibody be from an old infection?
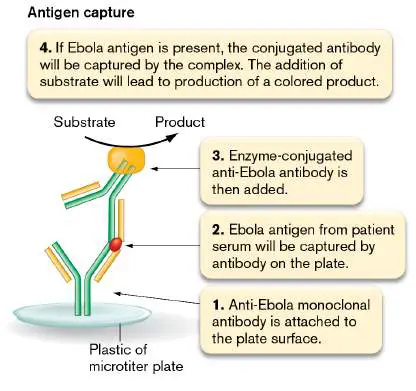
Fluorescent antibody staining. Section 26.2 presents a case history involving an 80-year-
old nursing-home resident who contracted pneumonia caused by Streptococcus pneumoniae.
The laboratory diagnosis was probably made using the biochemical algorithm previously
described. However, there are over 80 serological types of S. pneumoniae, each one
containing a different capsular antigen. How can the lab identify which antigenic type has
caused the infection? One way is to stain the organism with antibodies.
Figure 28.21A illustrates the result of staining a smear of the isolated streptococcus with
fluorescently tagged antibodies directed against a specific antigenic type of capsule. Viewed
under a fluorescence microscope, the organism is “painted” green when the right antibody
binds to the capsule. In the case of pneumonia, this knowledge probably will not help in
treating the patient, but its broader value is in determining whether a single type of organism
is the cause of an outbreak of pneumonia—information that is of epidemiological value for
identifying the source of the bacterium.
FIGURE 28.21 ■ Fluorescent antibody stain. A. Streptococcus pneumoniae
capsules (cells approx. 0.8 μm; fluorescence microscopy). The capsule is the green halo.
The center of the halo is the cell. B. Legionella pneumophila (cells approx. 1 μm in
length) from a respiratory tract specimen.
DR. M. S. MITCHELL/CDC
GADO IMAGES/ALAMY STOCK PHOTO
On the other hand, fluorescent antibody staining techniques are critically important for
rapidly identifying organisms that are difficult to grow. Infected tissues can be subjected to
direct fluorescent antibody staining. Figure 28.21B , for example, shows a direct fluorescent
antibody stain of pleural fluid from a patient with Legionnaires’ disease.
Other Pathogens Identified by Conventional or Rapid Diagnostics
Table 28.3 presents some additional examples of procedures used to identify pathogens. In
general, bacteria that are easily cultured are grown in the laboratory, after which biochemical
tests are performed or MALDI-TOF mass spectrometry analysis is conducted. Bacterial, viral,
and fungal species that are difficult to grow are typically identified by immunological
techniques that either identify a microbial antigen present in infected tissues or measure a rise
in antibody titer. Nucleic acid–based methodologies are also used to identify organisms that
are difficult to grow. Eukaryotic microbial parasites such as Plasmodium species (the cause of
malaria), Giardia lamblia (which causes giardiasis, a diarrheal disease), and Entamoeba
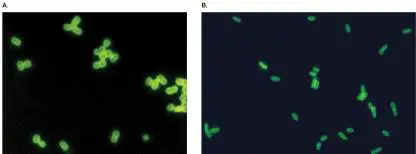
histolytica (the cause of amebic dysentery) can be identified via their telltale morphologies
under the microscope, making biochemical tests unnecessary.
Identification Procedures for Selected TABLE 28.3 Diseases
Agent Disease Means of identification a
Bacteria
Corynebacterium Diphtheria Material from nose and throat cultured on a
diphtheriae special medium; in vivo or in vitro tests for
toxin; NAAT screening for toxin gene
Bordetella Pertussis ELISA for toxin in respiratory secretions; PCR;
pertussis (whooping cough) culture on special media: MALDI (fluorescent
antibody staining of nasopharyngeal
secretions no longer recommended)
Legionella Legionellosis Culture on special medium is preferred
pneumophila (Legionnaires’ method; urine antigen detection by ELISA;
disease), Pontiac direct fluorescent antibody staining of clinical
fever material; NAAT screening of clinical material;
MALDI
Campylobacter Campylobacteriosis Isolation of bacteria on selective media
spp. incubated at 42°C in atmosphere of nitrogen
containing 5% oxygen and 10% carbon
dioxide; then biochemical testing performed;
direct PCR of stool; MALDI
Leptospira Leptospirosis IgM detected by ELISA; NAAT screening of
interrogans urine; serology early in the illness and after
2–3 weeks to detect 4× rise in antibody titer
Identification Procedures for Selected TABLE 28.3 Diseases
Listeria Listeriosis Culture of blood and spinal fluid; selective
monocytogenes and enrichment cultures performed on food
samples to grow potential pathogens; DNA
probe for rapid identification of colonies;
MALDI
Chlamydia Chlamydial genital NAAT tests; identification of C. trachomatis
trachomatis infections antigen in urine or pus using monoclonal
antibody
Treponema Syphilis Direct fluorescent antibody staining;
pallidum serological tests
Francisella Tularemia Cultures using cysteine-containing media;
tularensis fluorescent antibody stain of pus; detection of
rise in antibody titer
Yersinia pestis Plague Identification of capsular antigen using
fluorescent antibody or ELISA
Viruses
Rhinovirus Common cold Strain identification requires use of specific
antibodies (not usually done)
Influenza virus Flu NAAT assay; influenza antibody levels in
acute and convalescent stages of illness
Hantavirus Hantavirus NAAT assay; antigen detection in tissues
pulmonary using electron microscopy or monoclonal
Identification Procedures for Selected TABLE 28.3 Diseases
syndrome antibody; ELISA and western blot tests for
IgG and IgM antibodies in victim’s blood
Herpes simplex Different strains NAAT assay; identifying the viral antigen in
virus cause cold sores, clinical material using fluorescent antibody
ocular lesions, and
genital lesions
Mumps virus Mumps NAAT; rise in antibody titer, or presence of
IgM antibody to mumps virus in patient’s
blood
Rotavirus Diarrhea Electron microscopy or ELISA of diarrheal
stool for virus
HIV AIDS NAAT assay; detection of antibody to HIV-1 in
patient’s blood
SARS-CoV-2 COVID-19 NAAT assay (RNA genome);
immunochromatography (antigen); ELISA
(antibody)
Fungi
Coccidioides Coccidioidomycosis, NAAT tests; observation of large, thick-
immitis infection of lung; walled, round spherules from clinical
can disseminate to specimens; MALDI
almost any tissue
Histoplasma Histoplasmosis, Stained material from pus, sputum, tissue,
capsulatum intracellular etc., examined for intracellular H. capsulatum
Identification Procedures for Selected TABLE 28.3 Diseases
infection of lung; yeast phase; blood tests for antibody to the
sometimes organism; MALDI
disseminates
Point-of-Care Rapid Diagnostics
Conventional diagnosis of an infection often requires sending a clinical specimen to a faraway
laboratory, followed by a considerable delay in obtaining results. Inevitably, some patients lose
patience and fail to attend follow-up appointments. Point-of-care (POC) laboratory tests, by
contrast, are used directly at the site of patient care, such as physicians’ offices, outpatient
clinics, intensive care units, emergency departments, hospital laboratories, and even patients’
homes. Most patients are happy to wait 15–30 minutes for a rapid POC test result in order to
receive immediate treatment or reassurance.
The rapid home antigen test for COVID-19 is an immunochromatography assay, a method
used in many POC tests. Figure 28.22A explains how the technology works to detect
Streptococcus pneumoniae capsular antigen, which aids in the diagnosis of streptococcal
pneumonia. In this particular immunochromatographic test, called a “red colloidal gold” test,
the relevant antigen (in this case, capsule antigen) is extracted from a clinical specimen, and a
few drops of the extract are placed on a test strip containing rabbit antibodies to the antigen.
The antibodies have red colloidal gold particles attached to them. The antigen-antibody
complexes, if present, move by capillary action to the upper level of the strip, where they are
captured by a line of more anti-antigen antibodies embedded in the strip, forming an antibody-
antigen-antibody sandwich. The colloidal gold particles accumulate and eventually produce a
red test line, indicating the presence of the antigen. In contrast, rabbit antibodies that are not
bound to the antigen pass through the test line but are captured by goat antirabbit IgG
antibodies on a control line, once again forming a red line that indicates the strip components
are working. Figure 28.22B shows results of the Thermo Scientific™ Xpect™ Legionella Test
for Legionella antibodies.
FIGURE 28.22 ■ Principle of immunochromatographic rapid diagnostic tests.
A. The example is a test for the presence of Streptococcus pneumoniae in sputum. An
extract of sputum is placed onto one end of the strip where S. pneumoniae capsular
antigen (C-ps) will bind antipneumococcal C-ps polyclonal antibodies. The resulting
immunoconjugates move by capillary action to the upper membrane and are captured by
the antipneumococcal C-ps solid-phase polyclonal antibodies, thereby forming sandwich
conjugates in the sample. A positive test result is indicated by the presence of both a test
and a control line, whereas a negative result is indicated by the appearance of only a
single control line. B. Immunochromatography test for anti- Legionella antibodies. Serum
placed on strip 1 contained antibodies to Legionella. (Photo used by permission of
Thermo Fisher Scientific.)
USED BY PERMISSION OF THERMO FISHER SCIENTIFIC; COPYRIGHT PROHIBITED
Two properties that are critical to any POC test are sensitivity and specificity. Sensitivity
measures how often a test will be positive if a patient has the disease. Sensitivity reflects how
small a concentration of antigen the test can detect. A highly sensitive test will detect lower
concentrations of an antigen than a less sensitive test will detect. In contrast to sensitivity,
specificity measures how often a test will be negative if a patient does not have the disease.
Specificity reflects how well a test can distinguish between two closely related antigens (for
example, Streptococcus strains carrying group A versus group B capsular antigens). Assays
with high specificity and sensitivity are valuable diagnostic tools.
Commercial POC tests are widely available for the diagnosis of bacterial and viral infections
and of parasitic diseases, including malaria (Table 28.4). However, as convenient as these
tests are, sensitivity may be compromised in the quest for a speedy result. Some tests exhibit
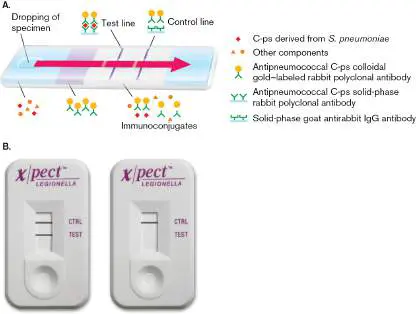
insufficient sensitivity and should therefore be coupled with confirmatory tests when the
results are negative (one test that can produce false negatives is the Streptococcus pyogenes
rapid antigen detection test, often used to diagnose strep throat). Other POC tests need to be
confirmed when positive; for instance, a rapid malaria POC test can produce false positives.
Examples of Point-of-Care Rapid-Test Kits for TABLE 28.4 a Infectious Diseases
Type
Disease of Performance
(pathogen) test Sample Indication b Notes
Bacterial pathogens
Chlamydia (PCR Vaginal swab, Screening, Sensitivity:
Chlamydia urine suspicion of 98.7%
trachomatis) PID Specificity:
99.4%
Gonorrhea (PCR Urine Screening, Sensitivity:
Neisseria suspicion of 98%
gonorrhoeae) PID Specificity:
99%
Syphilis (ICT Blood Screening Sensitivity:
Treponema 90%–95%
pallidum) Specificity:
90%–95%
Strep throat (EIA Pharyngeal Sore throat Sensitivity: Confirm
Streptococcus swab 92% negative
pyogenes) Specificity: swabs
100%
Legionellosis (ICT Urine Severe Sensitivity: Only
Legionella spp.) pneumonia; 97.7% serotype 1
risk factors
Examples of Point-of-Care Rapid-Test Kits for TABLE 28.4 a Infectious Diseases
for Specificity: reliably
legionellosis 100% detected
Pneumococcal ICT Urine; also Severe Sensitivity: Detects
pneumonia (pleural fluid or pneumonia; 86% capsule
Streptococcus CSF also Specificity: antigens
pneumoniae) empyema, 94%
meningitis
Pseudomembranous ICT Stool Antibiotic- Sensitivity: Notably less
enterocolitis (associated 92.8% sensitive
Clostridioides diarrhea Specificity: than
difficile) 92.6% cultures or
PCR
Neonatal PCR Vaginal swab Peripartum Sensitivity:
septicemia (detection of 92%
Streptococcus colonization Specificity:
agalactiae) 96%
Protozoan pathogens
Malaria (ICT Blood Fever in Sensitivity: Sensitivity
Plasmodium returning 99.7% better for P.
falciparum) traveler Specificity: falciparum
94.2% (pan-
malarial
tests)
Trichomoniasis (ICT Vaginal swab Symptoms Sensitivity:
Trichomonas spp.) of vaginitis 92%
Specificity:
100%
Examples of Point-of-Care Rapid-Test Kits for TABLE 28.4 a Infectious Diseases
Viral pathogens
Influenza (influenza ICT Nasopharyngeal Flu-like Sensitivity: Low
virus) swab symptoms 20%–55% sensitivity;
Specificity: probably
99% not helpful
during
outbreaks;
lower in
adults
RSV disease (RSV) ICT Nasopharyngeal Viral Sensitivity:
swab symptoms, 93%
especially Specificity:
during 93%
winter
AIDS (HIV) ICT Blood; also oral Screening, Sensitivity:
fluid prevention 99.6%
of vertical Specificity:
transmission 99.3%
COVID-19 (SARS- ICT Nasal swab Viral Sensitivity: Detects
CoV-2) symptoms, 94.3% viral N
contact Specificity: antigen
tracing 98.1%
Dengue fever ICT Blood Screening in Sensitivity:
(dengue virus) endemic 90%
regions Specificity:
100%
Examples of Point-of-Care Rapid-Test Kits for TABLE 28.4 a Infectious Diseases
Mononucleosis ICT Blood Screening Sensitivity: Detects IgM
(Epstein-Barr virus) 90% “heterophile
Specificity: antibodies”
100% c
Diarrheal disease ICT Stool Diarrhea Sensitivity:
(rotavirus) 88%
Specificity:
99%
Hepatitis B (HBV) ICT Blood Prenatal or Sensitivity: Detects HBs
transfusion 95% antigen d
screening; Specificity:
or suspicion 100%
of acute or
chronic
carriage of
HBV
Rubella (rubella ICT Blood Pregnancy Sensitivity:
virus) 99%
Specificity:
99%
There are several advantages and some disadvantages to POC rapid tests. The advantages
are:
Culturing is not required.
If the test indicates a specific bacterial infection, the clinician can immediately initiate
targeted antibiotic therapy.
If the test indicates a viral infection, the consumption of antibiotics can be avoided, and
antiviral therapy can be initiated if possible.
Infection chains among patients with similar symptoms are revealed (contact tracing).
Compliance is improved among patients who are difficult to reach.
The disadvantages include:
The tests provide no data on a pathogen’s antibiotic sensitivity.
There is a higher risk of the technician becoming infected.
Coinfections with other pathogens are more likely to be overlooked than in culture.
The levels of false positive or false negative results can vary for different POC tests.
The newer nucleic acid–based tests described earlier exhibit better sensitivity and
specificity than do most immunochromatographic assays, but they require more expensive
instrumentation and training. In the coming years, further evolution of POC tests may lead to
new diagnostic approaches, such as panel testing that targets all possible pathogens
suspected in a specific clinical setting. The development of next-generation serology-based
and/or molecular-based multiplex tests will certainly facilitate quicker diagnosis and improved
patient care.
To Summarize
Pathogens can be identified by molecular techniques such as MALDI-TOF mass
spectrometry (useful for bacteria), nucleic acid amplification tests (useful for bacteria or
viruses), and/or immunological methods (for example, ELISA; useful for bacteria or
viruses).
Fluorescent antibody staining performed directly on a tissue can rapidly identify
organisms or antigens present.
Point-of-care (POC) diagnostic tests can rapidly identify or rule out the cause of an
infectious disease. Therapy can be initiated rapidly following a positive result.
Sensitivity (the ability to detect small amounts of the pathogen) and specificity (the
ability to distinguish one pathogen from another) for any point-of-care test are factors
used to evaluate how accurate the test is at eliminating false negative and false
positive reactions, respectively.
Immunochromatography is the primary platform for POC testing.
A drawback to POC tests is that simultaneous multiple infections may be missed.
Glossary
amplicon
A specific PCR product in which a small DNA sequence is amplified (many copies are
synthesized).
multiplex PCR
A polymerase chain reaction that uses multiple pairs of oligonucleotide primers to amplify
several different DNA sequences simultaneously.
sensitivity
In diagnostic testing, a measure of how often a test will be positive if a patient has a
particular disease, reflecting how small a concentration of antigen the test can detect.
specificity
In diagnostic testing, a measure of how often a test will be negative if a patient does not
have a particular disease, reflecting how well a test can distinguish between two closely
related antigens.
Fig A3.10
FIGURE A3.10 ■ Quantitative (real-time) PCR. A. The Taq DNA polymerase,
extending an upstream primer, reaches the downstream reporter probe and degrades
the probe, releasing the fluorescent dye from the vicinity of the quencher. B.
Amplification plot of Rhodococcus with primer BPH4. Different numbers of DNA copies
were used for each reaction mixture.
Fig. 26.35
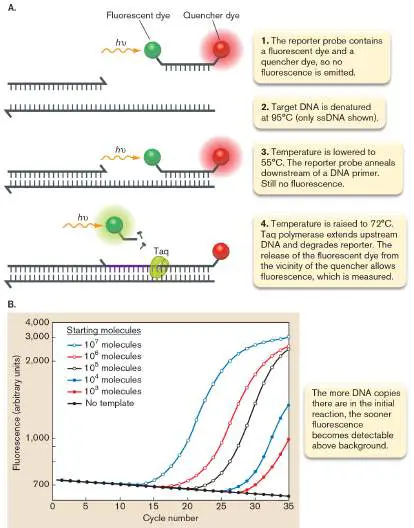
FIGURE 26.35 ■ Ebola virion. A. Composition of the virus. The ribonucleoprotein
complex consists of the nucleoprotein (NP), the structural proteins VP30 and VP35,
and the virion-associated RNA-dependent RNA polymerase (L proteins). The
glycoprotein (GP-sGP) is an integral membrane protein that can be secreted. B.
Threadlike Ebola virions budding from a cell (center). C. Progression of the disease.
Source: Part C modified from http://themindbodyshift.com/index.php/2014/10/16/when-the-threat-of-
ebola-hits-home.
KALETSKY, R. L., ET AL. 2009. PNAS 106 :2886.
Endnotes
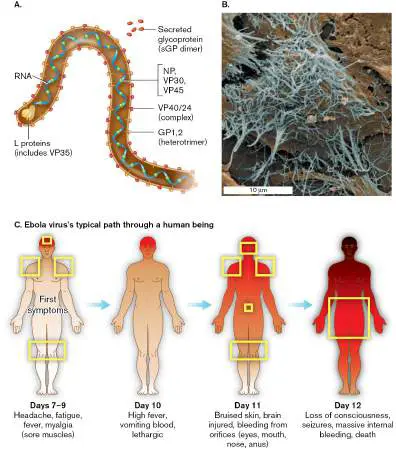
1. Note a: Abbreviations: AIDS = acquired immunodeficiency syndrome; CSF = cerebrospinal
fluid; EIA = enzyme immunoassay; HBV = hepatitis B virus; HIV = human
immunodeficiency virus; ICT = immunochromatographic test; PCR = polymerase chain
reaction; PID = pelvic inflammatory disease; RSV = respiratory syncytial virus. Return to
reference a
2. Note b: Sensitivity = proportion of actual positives correctly identified. Specificity =
proportion of actual negatives correctly identified. Return to reference b
3. Note c: Epstein-Barr virus randomly infects B cells and causes them to secrete antibodies.
Because many thousands of different antibodies are made, they are referred to
collectively as “heterophile antibodies.” Return to reference c
4. Note d: HBs is a type of hepatitis B antigen that is soluble. Return to reference d
5. Note a: MALDI = organism is part of the VITEK MS v3 database developed by bioMérieux.
Return to reference a
28.4 Epidemiologynot assigned
In Section 25.1 we discussed basic epidemiological concepts— vectors, transmission cycles, vehicles, reservoirs, and others—as well as how a new infectious disease can be identified using a version of Koch’s postulates. But how do scientists track the spread of a new disease, or find and identify new variants of influenza virus that develop thousands of miles away, and then predict, many months in advance, when that virus will arrive on our doorstep? These questions are addressed using the tools of epidemiology. The word “epidemiology” is derived from the Greek meaning “that which befalls a populace.” In scientific parlance, epidemiology examines the distribution and determinants of disease frequency in human populations. Put more simply, epidemiologists determine the source of a disease outbreak and the factors that influence how many individuals will succumb to the disease. Epidemiological principles are also used to determine the effectiveness of therapeutic measures and to identify new diseases or syndromes, such as those caused by SARS-CoV-2 virus, SFTS virus (severe fever and thrombocytopenia syndrome), Candida auris (invasive fungal infections), and emerging influenza animal viruses. We covered the basic concepts of epidemiology in Chapter 25; now we explore how those principles are used to track disease.
Epidemiological early-warning systems require an extensive organization that coordinates information from many sources. In the United States, that duty falls to the Centers for Disease Control and Prevention (CDC). On the world stage, the World Health Organization (WHO) bears this responsibility. Any disease considered highly dangerous or infectious is first reported to local public health centers, usually within 48 hours of diagnosis. The local centers forward that information to their regional agencies, which then report to the CDC in Atlanta and/or the WHO in Geneva. This is how authorities in 2020 recognized that the COVID-19 pandemic was under way. But how did the science of epidemiology come about?
John Snow, Father of Modern Epidemiology
The science of epidemiology can be traced back to Hippocrates (ca. 460–375 BCE), who noted, for example, that malaria and yellow fever commonly occurred in swampy areas (it took another 2,000 years to make the connection to mosquitoes). Many others after Hippocrates made epidemiological observations about infectious diseases. However, the first case in which the source of a disease outbreak was methodically investigated arose in the mid-nineteenth century.
A serious outbreak of cholera had developed in the Soho district of London in 1854. The source of the infection was unknown. A London physician named John Snow (Fig. 28.23A) thought that if the cases of cholera clustered geographically, he might gain a clue as to its source. He visited the addresses of all the diarrheal cases he learned about and drew a map marking each case (Fig. 28.23B ). The answer jumped out at him. Water in that part of London was pumped from separate wells located in the various neighborhoods. Snow realized there was a close association between the density of cholera cases and a single well located on Broad Street. Simply removing the pump handle of the Broad Street well put an end to the epidemic, proving that the well water was the source of infection (known as the “point source,” since all infections originated from that point). Snow stopped the cholera outbreak 50 years before the agent of the disease, Vibrio cholerae, was discovered (1905). In the process, he laid the groundwork for descriptive and analytical epidemiological approaches.
FIGURE 28.23 ■ Early epidemiology. A. John Snow (1813–1858). B. A map of London commissioned by Snow in 1855 shows the location of cholera victims of the 1854 outbreak. The map illustrates that each victim within the marked area lived closer to the Broad Street pump than to other nearby pumps. The Broad Street well is found within the red circle. Each black bar represents a death from cholera.
THE JOHN SNOW ARCHIVE AND RESEARCH COMPANION
THE JOHN SNOW ARCHIVE AND RESEARCH COMPANION
Note: Outbreaks of disease that originate from a common source,
as in the London cholera outbreak, are called common-source outbreaks. In contrast, a propagated outbreak involves person-to-person transmission (with SARS-CoV-2, for instance) or transmission by insect vectors (such as in West Nile disease).
Endemic, Epidemic, or Pandemic?
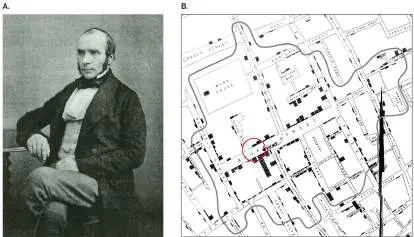
The terms “endemic” and “epidemic” are often used when referring to disease outbreaks. A disease is endemic if it is always present at a low frequency in a population. For example, Lyme disease, caused by the spirochete Borrelia burgdorferi, is endemic to the northeastern United States because the organism has found a reservoir in deer and ticks. Recall that a reservoir is any bird, insect, mammal, or other animal that harbors the infectious agent and is indigenous to a geographic area. Humans become infected only when they come in contact with the reservoir. Thus, the disease incidence is low but relatively constant. A disease is epidemic, on the other hand, when larger-than-normal numbers of individuals in a population become infected over a short time. Epidemics arise, in part, because of rapid and direct human-to-human transmission. Food-source or food-contamination epidemics, for instance, are discussed in Chapter 16.
Figure 28.24Aillustrates the difference in the frequency of cases observed between endemic and epidemic disease. An endemic disease can become epidemic if the population of the reservoir increases, allowing for more frequent human contact; or if the infectious agent evolves to spread directly from person to person, bypassing the need for a reservoir. This is the concern with the H5N1 avian flu virus, which is endemic in some mammals and birds in Asia. A pandemic is an epidemic that occurs over a wide geographic area, usually the world. An example of a person-to-person epidemic turned pandemic is the COVID-19 pandemic, caused by the initial SARS-CoV-2 virus that emerged in 2019 (see Section 28.5). Pandemics may be long-lived, such as the bubonic plague pandemic in the fourteenth century and the AIDS pandemic in the late twentieth and early twenty-first centuries; or they may be short-lived, as with the 1918 flu pandemic and, hopefully, our current COVID-19 pandemic.
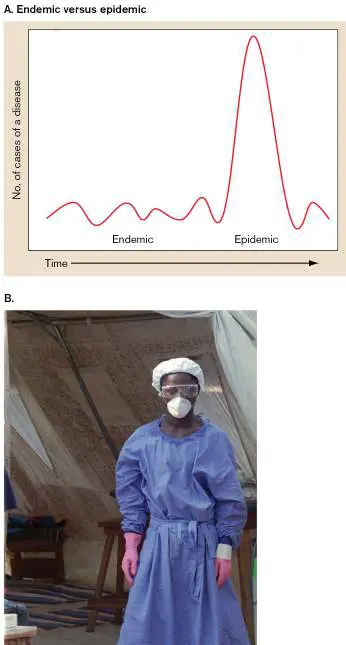
FIGURE 28.24 ■ The difference between endemic and epidemic disease. A. An endemic disease is continually present at a low frequency in a population. A sudden rise in disease frequency constitutes an epidemic. B. A health care worker stands outside a quarantined area housing Ebola patients in the Ivory Coast. Epidemics can be minimized if infected persons are kept segregated from the general population (quarantined) to avoid spread of the infectious agent.
AP PHOTO/JEAN-MARC BOUJU
When discussing a disease, epidemiologists distinguish between the incidence and prevalence of active cases. Incidence refers to the number of new cases of a disease in a location over a specified time, and it reflects the risk a person has of acquiring the disease. Incidence rates can provide insight into whether efforts to limit a disease are working. Take a city of 100,000 people. If the incidence of new cases of a disease rises from 10 cases per 100,000 population in one year to 30 cases per 100,000 population the next year, then efforts to prevent the disease are failing. Prevalence, however, describes the total number of active cases of a disease in a given location at a given time, regardless of when a case first developed (it includes old but still active cases, plus new cases). Thus, the duration of a disease’s symptoms (acute or chronic) will impact disease prevalence. Prevalence can increase or decrease over time, depending on whether more people are cured or perhaps die. Endemic diseases maintain relatively constant prevalence and incidence rates. A disease outbreak, in contrast, is typically marked by an increase in both parameters.
Finding Patient Zero
When trying to contain the spread of an epidemic, it is vital to track down the first case of the disease (known as the index case or patient zero) and then identify everyone who has had contact with that individual (a process called contact tracing) so that they can be treated or separated from the general population (quarantined; Fig. 28.24B ). When a new disease arises, the epidemiological search for the index case starts only after a number of patients have been diagnosed and a new disease syndrome declared. This is what happened in 2015 and 2018 with Ebola, in 2003 with the original SARS outbreak (described next), and in 2020 when the SARS-CoV-2 pandemic threatened the world (discussed in Section 28.5).
Severe acute respiratory syndrome (SARS) was a coronavirus disease that emerged in 2003. Like COVID-19, SARS was marked by fever and lower respiratory tract symptoms (pneumonia). Although SARS as a disease was more lethal than COVID-19, the causative agent (SARS-CoV-1) was less transmissible, which made finding index cases easier. The SARS index case in Singapore was a 23-year-old woman who had stayed on the ninth floor of a hotel in Hong Kong while on vacation. A physician from southern China who stayed on the same floor of the hotel during that period is believed to have been the source of her infection, as well as that of the index patients who precipitated subsequent outbreaks in Vietnam and Canada.
When the woman returned from Hong Kong to Singapore, she developed a fever of unknown origin, a headache, and a dry cough serious enough to warrant admission to the hospital. Tests for the usual suspects, including Legionella, Chlamydia, and Mycoplasma, were negative, but electron microscopy of nasopharyngeal aspirations showed virus particles with widely spaced club-like projections, suggesting this was a coronavirus (Fig. 28.25A). At the time of her admission, SARS was unknown, so she remained in a general ward without barrier infection-control measures. During this period, the index patient infected at least 20 other individuals, including hospital staff, nearby patients, and visitors. Within weeks, the viral genome was sequenced. WHO named the disease in China “SARS” and issued travel alerts (Fig. 28.25B ). These alerts, along with eventual ELISA tests for antibodies, enabled Singapore health officials to rapidly identify the index patient and her contacts. As a result, they were able to limit spread of the illness, thereby preventing an epidemic and possible pandemic. No known cases of SARS have been reported since 2004.
FIGURE 28.25 ■ Severe acute respiratory syndrome (SARS). A. The coronavirus that causes SARS (TEM). B. Citizens
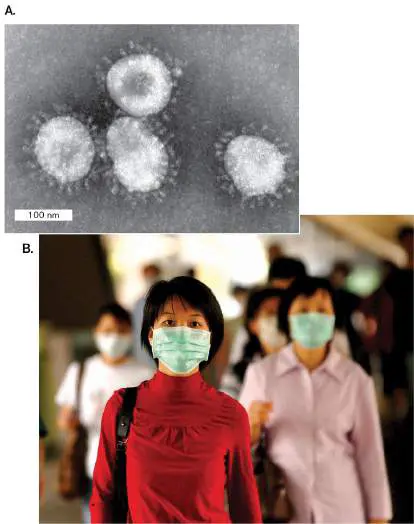
of China, including the military, donned surgical masks in 2003 to slow the spread of SARS.
DR. FRED MURPHY/CDC
AP PHOTO/ANAT GIVON
Identifying Disease Trends
How do epidemiologists first recognize that an epidemic is under way, and then identify the agent and its source? Certain diseases, because of their severity and transmissibility, are called reportable, or notifiable, diseases (Table 28.5). In a process known as systematic surveillance or syndromic surveillance, physicians are required to report instances of these diseases to a central health organization, such as the CDC in the United States and the WHO in Switzerland. This reporting enables the incidences of certain diseases within a population to be tracked and upsurges noted.
Examples of Notifiable
TABLE 28.5 a
Infectious Diseases
Bacterial Anthrax Hansen’s disease Salmonellosis (leprosy) (non–typhoid fever types)
Botulism Legionellosis Shigellosis Brucellosis Leptospirosis Staphylococcal or streptococcal
Examples of Notifiable
TABLE 28.5 a
Infectious Diseases
toxic shock syndrome Campylobacter Listeriosis Streptococcal infection invasive disease Chlamydia infection Lyme disease Streptococcus pneumoniae, invasive disease Cholera Meningitis, Syphilis infectious Diphtheria Pertussis Tuberculosis Ehrlichiosis Plague Tularemia E. coli O157:H7 Psittacosis Typhoid fever infection Gonorrhea Q fever Vancomycin-resistant Staphylococcus aureus (VRSA)
Haemophilus Rocky Mountain influenzae, spotted fever invasive disease Viral
Examples of Notifiable
TABLE 28.5 a
Infectious Diseases
COVID-19 Measles SARS Dengue fever Mumps Smallpox Hantavirus infection Poliomyelitis Varicella (chickenpox)
Hepatitis, viral Rabies Yellow fever HIV infection Rubella and congenital rubella syndrome Fungal Coccidioidomycosis Candida auris Histoplasmosis infection Parasitic Amebiasis Cyclosporiasis Malaria Cryptosporidiosis Giardiasis Trichinosis An emerging disease can be detected as a cluster of patients with unusual symptoms or combinations of symptoms. Such detection is possible because diseases of unknown etiology are also reported to health authorities. A new disease could manifest with common symptoms (for example, the cough and fever of SARS-CoV-2) that cannot be linked to a known disease agent by clinical tests. An upsurge in cases, of either a reportable disease or an emerging disease, will set off institutional “alarms” that mobilize epidemiologists to determine the source and cause of the outbreak.
Thought Questions
28.9 Methicillin, a beta-lactam antibiotic, is very useful in treating staphylococcal infections (actually, an antibiotic closely related to methicillin, oxacillin, is used clinically). The emergence of methicillin-resistant strains of Staphylococcus aureus (MRSA) is a very serious development because few antibiotics can kill these strains. Imagine a large metropolitan hospital in which there have been eight serious nosocomial infections with MRSA and you are responsible for determining the source of infection within the hospital so that it can be eliminated. How would you accomplish this task using common bacteriological and molecular techniques?
28.10 What are some reasons why certain diseases spread quickly through a population while others take a long time?
Molecular Approaches for Disease Surveillance
COVID-19 is not our only pandemic today. A worldwide pandemic of tuberculosis (active and latent forms) is estimated to affect over 2 billion people. Many of the Mycobacterium tuberculosis infections are caused by multidrug-resistant strains that are difficult, if not impossible, to kill with existing antibiotics (see Section 26.2). This problem is especially serious among refugee populations attempting to flee war-torn countries. As a result, it is important to screen these refugees as they enter neighboring countries that have low incidences of tuberculosis. Although chest X-rays are mandatory in many cases, a positive image will be obtained only if the disease is at a relatively advanced stage. Actively infected individuals who have not developed the characteristic lung tubercles seen on X-ray will not be identified.
Unfortunately, the acid-fast staining of sputum samples (discussed in Section 28.2) also fails to detect individuals at an early stage of active infection. Studies have shown, however, that PCR techniques are much more sensitive for detecting individuals with active tuberculosis. As time progresses, more PCR and other nucleic acid surveillance strategies will be used to track the worldwide ebb and flow of microbial diseases.
PCR and restriction fragment length polymorphism (RFLP)
strategies are already used for epidemiological purposes to type (that is, determine the relatedness of) different microbial isolates by generating a complex DNA profile that is specific for a particular strain (see Section 28.3). For example, DNA profiles were used to link an outbreak of over 2,000 cases of salmonellosis in 2010 to a single strain of Salmonella enterica serovar Enteritidis. The results, conducted by a national network of public health agencies (PulseNet), led to the recall of over a half billion eggs. More recently, in 2021 and 2022, whole-genome sequencing was used to track a multistate outbreak (1,040 cases) of salmonellosis caused by a strain called Salmonella Oranienburg. The organism was found in raw onions and in onion-containing products. The suppliers of the contaminated onions were traced to Chihuahua, Mexico. Reports of people infected came from 39 states; 260 people were hospitalized, but no one died.
Bioterrorism
“A wide-scale bioterrorism attack would create mass panic and overwhelm most existing state and local systems within a few days,” said Michael T. Osterholm, director of the Center for Infectious Disease Research & Policy at the University of Minnesota, in October 2001. “We know this from simulation exercises.” The following is an example of what Dr. Osterholm foretold: an incredible case in which scientists had to trace a heinous bioterrorist criminal act back to its source.
Case History: The Disease Came in the Mail
On October 16, 2001, a 56-year-old man working for the U.S. Postal Service developed a low-grade fever, chills, sore throat, headache, and malaise. Within a day he had a dry cough, shortness of breath, night sweats, and nausea, and he was vomiting. On October 19, the man presented to an emergency department. He had decreased breath sounds and rhonchi (dry sounds in lungs due to congestion), but he was not in acute distress. His white blood cell count was normal, but there was a left shift in the differential—that is, more precursor polymorphonuclear leukocytes were present (PMNs; see Section 26.2). A chest X-ray showed fluid accumulating in his lungs. Within 11 hours, blood cultures taken upon admission grew Bacillus anthracis. The man had inhalational anthrax, the most deadly kind of anthrax. Doctors immediately started treatment with ciprofloxacin, rifampin, and clindamycin antibiotics. Fortunately, the patient recovered. His job at the post office was simply to sort mail. From October 4 to November 2, 2001, the CDC and various state and local public health authorities reported 11 confirmed cases of inhalational anthrax (7 were postal workers; 5 died), 11 cases of cutaneous anthrax, and 21 others who tested positive. Letters containing dried spores had been mailed to people living or working in the District of Columbia, Florida, New Jersey, Connecticut, and New York. It was clear that a biological attack was in progress. Even though very few people were affected, the impact of these attacks was enormous. Over 10,000 people took a 2-month course of antibiotics after possible exposure, and mail delivery throughout the country was affected. The simple act of opening an envelope suddenly became risky business. Painstaking detective work by federal agents and epidemiology scientists proved that the strain of Bacillus anthracis used in the 2001 anthrax attack had the same genetic signature as a strain used by a scientist working at the army’s Fort Detrick biodefense laboratory. Unfortunately, the scientist took his own life before his connection could be proved. As a result of this attack and other events, the CDC and the National Institutes of Health (NIH) assembled a list of select agents (marked in blue in Table 28.1) that could potentially be used as bioweapons. A bioweapon is considered to be any infectious agent or toxin that has a high virulence and/or mortality rate.
Microorganisms considered bioweapons could be used to conduct either biowarfare, with the intent of inflicting massive casualties, or bioterrorism, which may result in only a few casualties but cause widespread psychological trauma.
Although the branding of select agents is recent, biowarfare is not new. In the Middle Ages, victims of the Black Death (plague caused by Yersinia pestis) were flung over castle walls via catapults. During the French and Indian War in the eighteenth century, British field marshal Jeffrey Amherst distributed smallpox-infected blankets to Native Americans. The Imperial Japanese Army during World War II experimented with infectious disease weapons, using Chinese prisoners as guinea pigs. Even the United States participated by developing weapons-grade anthrax spores after World War II. That project was discontinued in the 1970s.
The 2001 anthrax attack was not the first instance of bioterrorism in the United States. The first documented act occurred in 1984, when followers of the cult leader Bhagwan Shree Rajneesh tried to control a local election in The Dalles, Oregon, by infecting salad bars with Salmonella. Over 700 people became ill. Rajneesh was given a 10-year suspended sentence, fined $400,000, and deported.
How effective are bioweapons? The method by which a biological agent is dispersed plays a large role in its effectiveness as a weapon. Fortunately, few people became ill during the 2001 anthrax attack; partly because of the epidemiological surveillance, but also because anthrax is inherently difficult to disperse. A person has to inhale thousands of anthrax spores to contract the disease, which means that effective dispersal of the spores is critical. Once spores hit the ground, the threat of infection is limited. Weapons-grade spores are very finely ground so that they stay airborne longer. Even though few people were infected, the potential threat of weapons-grade anthrax on the battlefield led the U.S. military in 2006 to resume vaccinating all soldiers serving in Iraq, Afghanistan, and South Korea.
An effective bioweapon would capitalize on person-to-person transmission. In an easily transmitted disease, one infected person could disseminate disease to scores of others within 1 or 2 days. So, in terms of generating massive numbers of deaths, anthrax was a poor choice. The goal of most terrorists, however, is not to kill large numbers of people, but to terrorize them. In that regard, the anthrax attack succeeded (Fig. 28.26A).
FIGURE 28.26 ■ Dealing with bioterrorism. A. Members of a hazardous-materials team near Capitol Hill during the anthrax attacks in 2001. B. An Illinois man suffering from smallpox in 1912.
AP PHOTO/KENNETH LAMBERT
ILLINOIS DEPARTMENT OF PUBLIC HEALTH
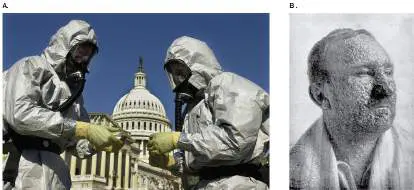
The most effective bioweapon in terms of inflicting death (biowarfare) would have a low infectious dose, would be easily transmitted between people, and would be a potential threat to a large percentage of the population. Smallpox fits these criteria ( Fig. 28.26B ). Fortunately, however, smallpox has been eradicated (almost) from the planet. Two laboratories, however, still harbor the virus—one in the United States and one in Russia. It is believed that the virus has been destroyed in all other laboratories. Since smallpox is the perfect biowarfare agent, it is imperative that the last two smallpox repositories remain secure.
The good news is that smallpox disease has been eradicated through vaccination. The bad news is that no individual born in the United States after 1970 has been vaccinated against smallpox, with the exception of some military and laboratory personnel (and even that program has since ended). As a result, anyone under 50 years of age is susceptible to smallpox. Even those of us who received the smallpox vaccination over 50 years ago are at risk, since our protective antibody titers have diminished. A terrorist attack with smallpox would cause terrible numbers of deaths. A new, safer vaccine does exist, however, and has been stockpiled. Were a smallpox attack to be launched, the vaccine would be rapidly administered to limit the spread of disease. Nevertheless, the economic and psychological impact of a smallpox epidemic would be devastating.
Interestingly, the smallpox vaccine can also protect people from monkeypox, a disease similar to smallpox but usually much milder. Symptoms include fever, headache, muscle aches, swollen lymph nodes, and a papular rash (small, raised, painful, fluid-filled lesions that crust) on the hands, feet, and face lasting 1–2 weeks. Cases of monkeypox were, until recently, limited mainly to central and western Africa. But that changed in 2022, when over 25,000 cases of monkeypox were identified in other countries, including the United States, Canada, and parts of Europe. The United States alone had over 5,000 cases by August 2022. Although monkeypox disease (caused by Orthopoxvirus) is typically mild, its similarity to smallpox and transmission by respiratory droplets elevate concern.
Consequently, the virus is considered by the CDC and NIH to be a select agent, a pathogen that could potentially be used as a bioweapon (see Table 28.1).
In the United States, research with select agents is tightly regulated. Because Yersinia pestis, for instance, is a select agent, laboratory personnel working with it must now possess security clearance with the Department of Justice (the organism must be handled under biosafety level 3 conditions; see Table 28.1). The laboratory must also register with the CDC to legally possess this pathogen, and access to the lab and the organism must be tightly controlled.
Much has improved since Michael Osterholm offered his dire assessment of a wide-scale bioterrorism attack. Education and surveillance procedures have been bolstered, and new detection technologies are being developed. We will probably never be fully protected from attack, biological or otherwise, but recent efforts have improved the situation.
To Summarize
John Snow founded the discipline of epidemiology. Epidemiology examines factors that determine the distribution and source of disease.
Endemic, epidemic, and pandemic are terms for different frequencies of disease in different geographic areas. Finding patient zero (the index case) is important for containing the spread of disease.
Molecular approaches using PCR and nucleic acid hybridization are used to identify nonculturable pathogens and to track disease movements.
Bioweapons , when they have been used, typically kill few people but incite great fear.
The CDC has assembled a list of select agents with bioweapon potential.
Glossary
epidemiology The study of factors affecting the health and illness of populations.
endemic Describing a disease that is always present in a population, although the frequency of infection may be low.
reservoir 1. The major part of the biosphere that contains a significant amount of an element needed for life. 2. An organism that maintains a virus or bacterial pathogen in an area by serving as a high-titer host.
epidemic A disease outbreak in which large numbers of individuals in a population become infected over a short time.
pandemic An epidemic that occurs over a wide geographic area.
incidence The number of new cases of a disease in a given location over a specified time.
prevalence The total number of active cases of a disease in a given location regardless of when the case first developed.
index case Also called patient zero. The first case of an infectious disease, and an important piece of data for helping to contain the spread of disease.
patient zero See index case .
quarantine The separation of infectious individuals from the general population to limit the spread of infection.
systemic surveillance Also called syndromic surveillance. The policy, established by central health organizations such as the U.S. Centers for Disease Control and Prevention or the World Health Organization, whereby physicians are required to report instances of diseases that have particularly high levels of severity and transmissibility, and thus are known as notifiable diseases.
syndromic surveillance See systemic surveillance .
Endnotes
1. Note a: For the latest list of notifiable agents, search “CDC notifiable diseases” online. Return to reference a
28.5 Detecting Emerging Microbial Diseasesnot assigned
News, whether obtained from traditional sources or social media, almost always carries stories of new infectious diseases cropping up in the world. An emerging disease is defined as an infectious disease that has recently appeared in a population. A reemerging disease, in contrast, is a known disease that was controlled but whose incidence or geographic range is increasing or is threatening to increase in the near future. In this section we discuss the concept of emerging diseases, how they develop, and how health organizations detect and track them. We open by reviewing the start of the COVID-19 pandemic.
Case History: It Began in Wuhan City (But Didn’t Stay There)
Peng Yinhua was a 29-year-old respiratory and critical illness doctor at First People’s Hospital in the city of Wuhan, China. One morning, near the end of December 2019, Peng was heading to work, daydreaming about his upcoming wedding. He could not anticipate what awaited. Later, the patients started arriving. Only a few at first, but the few grew to nearly 20 that day. All of them had a high fever and a persistent cough, and they struggled desperately to breathe. Radiographs showed that most had bilateral lung infiltrates characteristic of pneumonia. The next day, more patients arrived, and even more the day after that. Peng found himself on the front lines of what would come to be called the COVID-19 pandemic, caused by an emerging coronavirus named SARS-CoV-2. The sheer numbers of patients made him realize he would have to postpone his wedding. He was needed here. Unfortunately, despite taking precautions while treating his patients, Peng himself became infected. By January 25, 2020, nearly 700 patients with COVID-19 had been admitted to Wuhan hospitals. Peng was one of them. Five days later, the selfless doctor died from respiratory failure. His wedding invitations, never mailed, were still in his desk.
The global pandemic known as COVID-19 (coronavirus disease 2019) continues to unfold as we write in June 2022, more than 2 years later. The first official case appears to have been a vendor working at a Wuhan animal market around December 11, 2019. From there, the SARS-CoV-2 virus quickly spread to every country in the world, including the United States. By April 2020, the world had suffered over 1.5 million cases of COVID-19 and nearly 85,000 deaths. That number of cases, just a few months into the pandemic, was already 150 times the 10,000 cases produced during the combined epidemics of SARS (severe acute respiratory syndrome, 2004) and MERS (Middle East respiratory syndrome, 2012).
Previous chapters touched on many aspects of COVID-19, such as its molecular biology, disease process, treatment, and diagnosis, and we will soon talk about its epidemiology. But here we recall, lest we forget, the sense of panic we experienced as the disease raced across the globe, disrupting everything we thought normal.
By March 2020, global trade was in disarray, air travel was nearly nonexistent, supply lines were decimated, and the stock markets had crashed. The Dow Jones Industrial Average alone lost about 35% of its value by mid-March 2020. We learned to wear masks, to keep our distance (6 feet at least), to work and shop from home, and to avoid contact with anyone outside our household for fear someone might die. We discovered the true value of toilet paper as it quickly disappeared from store shelves. And we realized that the truly essential workers in our society were the people who stocked shelves, delivered mail, drove trucks, policed our streets, worked behind cash registers—that is, anyone, really, who gave us some sense of normalcy or who, at their own peril, helped other people. Then there were the teachers trying to instruct small children remotely through Zoom, and the health care workers who faced this virus head on, day after horrifying day. We can never really repay them for risking, and sometimes losing, their lives caring for patients on ventilators or for the mental anguish they still carry from seeing so many of their charges succumb to the virus. All the while, our hospitals filled beyond capacity with people clinging to life, struggling to breathe.
It was bad, but there was still hope even in those dark days—a hope driven by a collective will to persevere and sustained by how quickly scientists learned so much about this virus. We now describe the early epidemiological efforts to contain and identify the agent and the slow realization that the future pandemic many scientists had warned us about for decades was actually here.
Containment efforts. In an early attempt to stop the disease from spreading beyond Wuhan City, Chinese authorities took the drastic step of placing Wuhan, a city of 11 million people, under quarantine— that is, no one in, no one out, and no cars on the roads. By the end of January 2020, the city appeared as a ghost town. Markets were stripped of food as fast as they could be restocked (Fig. 28.27). These steps were the equivalent of what the French called “ le cordon sanitaire ” used by Duke le Richelieu in 1821 along the Pyrenees Mountains in an attempt to stop yellow fever (and liberal ideas) from Spain spreading into France. But as drastic and as well-meaning as the Chinese effort was, people still managed to leave the city. As a result, the virus made its way to other parts of China, Hong Kong, South Korea, and Japan. As the outbreaks continued to expand to more and more countries, all large public events such as the 2020 Tokyo Olympics were canceled or postponed to curb transmission. FIGURE 28.27 ■ Pandemic panic strains food supplies from China to Texas. A. A supermarket in Wuhan, China, on


January 23, 2020. B. A supermarket in Austin, Texas, on March 13, 2020.
STRINGER/GETTY IMAGES
SIPA USA/ALAMY STOCK PHOTO
In the United States, the first case was identified in Washington State on January 19, 2020. But by March, New York had become the epicenter of COVID-19, seeded by infected people arriving from Europe and China. Between March 1 and April 8, in an onslaught of disease that overwhelmed the capacities of many hospitals, New York State handled 150,000 COVID-19 cases resulting in over 6,000 deaths. Protective masks, gloves, gowns, and ventilators were running low, and hospital staff themselves were falling ill. In an effort to break the link of transmission, nearly every American was asked to shelter in their home—no restaurants, no malls, no movie theaters, no family gatherings, no school, and no work (except from home). We avoided anything involving person-to-person social contact. It looked like it was working; new cases started to fall. Then the variants started arriving. By June 2022, the United States alone suffered a total of 85 million cases resulting in more than 1 million deaths, and those numbers continued to rise.
Identifying the cause. Efforts to understand and control this emerging disease were rapid. On December 31, 2019, the WHO was first informed of a cluster of pneumonia cases of unknown cause detected in Wuhan City. Within three weeks (January 20, 2020), genome sequence analysis of samples taken from the first cases revealed the cause was a novel coronavirus similar to the SARS and MERS viruses. On February 11, 2020, the disease was officially named COVID-19 and the virus dubbed SARS-CoV-2. Note that having separate names for a virus and its disease is not new. Think of the HIV virus and the disease AIDS.
The sequence data quickly led to a diagnostic PCR test specific for the virus’s RNA genome. The test is used around the world to confirm cases of COVID-19 disease. Rapid antibody tests to identify everyone who is or was previously infected have since been developed. Scrutiny of viral genome sequences also revealed a potential vaccine candidate. The coat spike protein of SARS-CoV-2, which binds to host receptors, was found to be unique among coronaviruses. Scientists realized that an mRNA vaccine encoding those sequences could be made and injected into a host. Host ribosomes would then translate the mRNA into spike protein antigens that would stimulate the immune system (discussed in Chapter 16 and in Section 24.6). By March 2020, two potential mRNA vaccines had been designed. Those vaccines, manufactured by Pfizer-BioNTech and Moderna, were approved for emergency use in December 2020, merely one year after the pandemic began. The speed was astounding—an effective vaccine, which usually takes years or decades, had never before been produced this quickly. The mRNA vaccines have saved countless lives. Where did the virus come from? Genome analysis also suggested that the SARS-CoV-2 virus originated in bats, a common incubator for emerging viral diseases. Scientists think the virus most likely passed from bats through an unknown intermediate animal host before it underwent an animal-to-human spillover event linked to seafood and live-animal Asian markets. One potential scenario, an accidental release from a Wuhan virus lab, is highly unlikely. The connection between animals and humans in the evolution of new infectious organisms cannot be overstated. Bacteria and viruses that only infect animals can evolve to “jump” from animal to human hosts and, in so doing, emerge as a new human infectious disease. Areas of the world such as China and Southeast Asia, where a diversity of wild and domestic animals live near humans (sometimes in the same room), are often where these new diseases first erupt. Crowded Asian animal markets, for instance, are opportune places for the transmission of pathogens from animals to humans (Fig. 28.28 ).
FIGURE 28.28 ■ Live animal market in Vietnam.
HOANG DINH NAM/AFP/GETTY IMAGES
Epidemiology. Epidemiologists, using the techniques described earlier, quickly learned much about the disease, its transmission, and its potential victims. As noted in Chapter 26, the primary symptoms of COVID-19 are fever, cough, and shortness of breath that can evolve into pneumonia. In severe cases, patients can also experience diarrhea and vomiting. The patients most affected were found to be older people and people with compromised immune systems. Most, but not all, patients who have died from this infection are in these groups. Children seem less susceptible to the virus and typically develop only mild symptoms. Why children are generally spared may have to do with their efficient production of antiviral interferons (see Section 23.5).
Antigen or nucleic acid testing of nasopharyngeal swabs taken from symptomatic people and their contacts revealed that the epidemic was spreading at a frighteningly fast pace. We learned early on that transmission is primarily person-to-person via respiratory droplets. The spread was driven by symptomatic patients, of course,

but also by infected yet asymptomatic people who unknowingly shed the virus. As for mortality, approximately 1.5% (the case fatality rate) of people known to be infected worldwide have died, compared to 0.1% mortality for seasonal flu and 10% mortality for the original SARS. But we don’t yet know how many asymptomatic infected individuals there are, so the actual mortality rate for COVID-19 might be lower than 1.5%. Case fatality rates, expressed as a percentage, are calculated as 100 times the number of confirmed deaths divided by the number of confirmed cases.
An important number used by epidemiologists to evaluate control over an epidemic or pandemic is the basic reproduction number R 0, defined as the average number of infections produced by a single infected person in a population with no immunity. For the original strain of the SARS-CoV-2 virus, R 0 is 2 to 3; for the Omicron variant, R 0 is 3 to 7 or more. A value related to R 0, called the effective reproduction number R, reflects the average number of infections produced by a single infected person in a population with partial immunity. If R is less than 1, the epidemic or pandemic will eventually die out because each infected person (on average) generates less than one infection. When R is greater than 1, the epidemic or pandemic will continue to grow. Simple public health measures such as masking, social distancing, and handwashing can lower R and slow or reverse the spread of a disease.
The WHO declared COVID-19 a pandemic on March 11, 2020, as it had met the three criteria needed for that declaration: The virus spreads person-to-person, it kills, and it had traveled worldwide. Out of 195 countries in the world, 97 had developed cases of this disease by early March 2020. By April, every country was infected. A graph comparing the increase in cases from various countries early in the pandemic reveals that the rate of increase was greatest in the United States (Fig. 28.29).
FIGURE 28.29 ■ Early progression (March 30, 2020) of the COVID-19 pandemic in countries around the world. To normalize the stages of disease outbreak, each country’s curve starts the day after the first 100 cases were reported. The number of reported cases in the United States rose faster than in other countries at similar stages. Within 6 months (September 23, 2020), the number of cases (and deaths) had risen in the United States to 6.97 million (202,000); in Spain to 704,000 (31,118); in Italy to 304,000 (35,781); in China to 85,314 (4,634); in Iran to 436,000 (25,015); in South Korea to 23,341 (393); in the United Kingdom to 416,000 (41,902); in Japan to 80,041 (1,520); and in Singapore to 57,654 (27).
The trend observed in February 2022 was good: The infection curves were again starting to fall off (see Fig. 26.13), which meant that fewer new cases per day were being reported. Indications that the disease was starting to fade actually came from health officials monitoring for the virus in municipal wastewater (see Chapter 22). Infected people shed the virus in stool, so fluctuating levels of SARS-
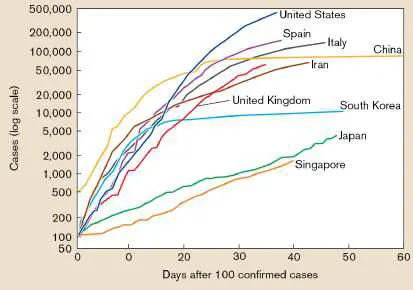
CoV-2 in wastewater will reflect increasing or decreasing infection numbers. However, in May 2022, the numbers of infections again started to rise, tripling from the level in March 2022. Several factors contributed to the increase, including new virus subvariants, more frequent gatherings in crowds, and the waning of protective antibody levels.
When will it stop? Perhaps never. Early estimates in 2020 predicted that at least 70% of the world’s adult population could ultimately be infected with this virus. Statistical analyses published early in 2022 indicated that almost 50% of the world’s population had already been infected at least once. With each variant of SARS-CoV-2 becoming more infectious than the last, it seems that the original 70% prediction was too low. Many experts now predict that COVID-19 will become an endemic disease, much like the flu. Periodic outbreaks will take place, hopefully kept in check by vaccinations and effective antivirals. Meanwhile, we all hold our breath waiting for the next virus variant to challenge our immune systems (eResearch Activity 28).
To Catch a Pathogen
How are the microscopic agents of infectious disease discovered? The revelation that Bacillus anthracis causes anthrax led Koch to propose a set of steps, or postulates (discussed in Section 1.3), needed to prove that a specific microbe causes a specific disease. Koch’s postulates state that the organism must be present in every case of a disease, must be propagated in pure culture, must cause the same disease when inoculated into a naive host, and must be recovered from the newly diseased host.
Viruses, however, cannot grow in pure culture. Thus, viruses causing disease cannot satisfy Koch’s postulates. To accommodate viral diseases, Koch’s criteria were modified by Thomas Rivers in 1937 to include cultivating the agent in host cells (rather than in pure culture), proving that the agent passes through a 0.2-μm filter (known bacteria did not), and demonstrating an immune response to the virus in patients. These steps were used in 2003 to rapidly discover the virus (SARS-CoV-1) causing SARS, again in 2013 to discover the related virus (MERS-CoV) causing MERS, and most recently in 2020 to identify SARS-CoV-2, the COVID-19 agent. The SARS-CoV-1 and MERS-CoV viruses were originally grown in a macaque monkey animal model, whereas SARS-CoV-2 was first grown in an African green monkey animal model, fulfilling Rivers’s postulates.
Fulfilling Koch’s and Rivers’s postulates remains the most persuasive evidence of causation, but there are some problems with this standard. Many agents cannot be cultured, and there may be no suitable animal model in which disease can be reproduced. In these situations we must resort to a statistical association between organism and disease based on the presence of the agent or its footprints (nucleic acid, antigen, and preferably, an immune response). Statistical association was used to link Zika virus and newborn microcephaly, first observed in South America in 2015 (described later). This link was strengthened by the discovery of Zika virus in the tissues of stillborn infants.
Emerging and Reemerging Pathogens
As recent history has made clear, we need to be better prepared to detect and respond to the growing threat of pandemics. The rate at which pandemics or potential pandemics appear has accelerated over the last 150 years, with one pandemic in the first half of the twentieth century (the 1918 influenza pandemic), three in the second half (Asian flu, Hong Kong flu, and AIDS), and now four in the first 20 years of the twenty-first century (SARS, H1N1 “porcine” flu, Zika, and now SARS-CoV-2). There will be more, which is why we must keep close watch on emerging and reemerging pathogens.
A world map showing the general locations of emerging and reemerging diseases is shown in Figure 28.30. As described in Chapter 26, tuberculosis is considered a reemerging infection. Once a worldwide scourge, tuberculosis was thought to be conquered by effective antimicrobial treatments. As evidence, the incidence rate of tuberculosis in the United States dropped sharply starting in the 1950s, falling from 52 per 100,000 population in 1953 to 10 per 100,000 in 1983. During the 30 years since 1983, the rate of decline slowed to 3 per 100,000 (2013). Meanwhile, the worldwide incidence is still about 150 per 100,000 population. So, while the incidence of tuberculosis is nowhere near the level it was in the 1950s, we are far from eliminating it completely. How it reemerged is a valuable lesson in epidemiology and a cautionary tale.
FIGURE 28.30 ■ Locations of some emerging and reemerging infectious diseases and pathogens. The examples given represent extreme increases in the reported cases over the last 20 years. Many of these diseases, such as HIV/AIDS and cholera, are widespread but show alarming increases in the areas indicated. COVID-19 is not shown anywhere because it is present everywhere.
What happened? The reemergence of tuberculosis is linked to two events: the AIDS pandemic and the development of drug-resistant strains. Because of their highly immunocompromised state, many AIDS patients during the 1980s and 1990s developed tuberculosis, which too often became a death sentence.
The second event, drug resistance, developed in Mycobacterium tuberculosis largely because many patients were noncompliant in
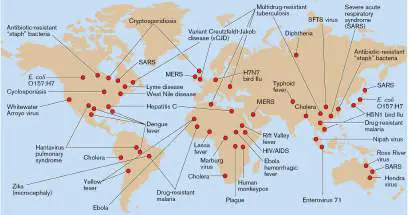
completing their full courses of antibiotic treatment. Treatment usually involves three or more antibiotics to reduce the risk that resistance will develop to any one drug. Noncompliant patients, however, failed to take all three drugs simultaneously, thereby enabling the organism to develop resistance to one drug at a time, until it became resistant to all of them. These multidrug-resistant (MDR) and extensively drug-resistant (XDR) strains are almost impossible to kill, and they are the reason M. tuberculosis has also reemerged among non-AIDS patients. The link between noncompliance and the development of drug resistance is the primary reason for the current requirement that tuberculosis patients be in the presence of a medical staff member when taking the multiple antibiotics prescribed.
As described in Section 28.4, highly infectious diseases, like tuberculosis, are identified using aggressive epidemiological surveillance. Communication among local, national, and world health organizations is critical and helped expose the rise in tuberculosis. To see for yourself how emerging diseases are monitored, search the Internet for a website called ProMED-mail. There you will find daily reports posted from around the world that describe new outbreaks of infectious diseases. It was where the first signs of COVID-19 were posted in 2019.
More recently, a posting on January 23, 2022, told of increasing cases of Lassa fever in Nigeria, with 29 confirmed and 48 new suspected cases recorded in the second week of 2022. In 2019 there had been a total of 581 confirmed cases—the largest outbreak of this deadly disease in that country. Lassa fever is an acute hemorrhagic disease caused by the Lassa virus (an arenavirus; single-stranded RNA genome). Humans contract the disease following contact with urine or feces of Mastomys rats (the reservoir) or with body fluids of infected humans. Symptoms begin slowly (fever, weakness) and progress to chest pain, cough, vomiting, diarrhea, abdominal pain, and, in severe cases, bleeding from the mouth, nose, vagina, or GI tract. Death can occur within 14 days. The mortality rate is about 25% for those who develop the disease. Lassa fever is endemic in West Africa because infected rats are unaffected and do not die. Unfortunately, there is no vaccine. Officials there hope that an aggressive public information campaign will help the local population learn how to prevent reservoir rodents from entering their homes. ProMED also posted a report on January 3, 2022, from South Sudan about a mysterious illness that killed 97 people over the previous month in Fangak County, an area beset by heavy flooding. The symptoms of the mysterious illness include cough, diarrhea, fever, headaches, joint pain, loss of appetite, body weakness, and chest pain. Prolonged flooding increases the incidence of endemic diseases common to Africa such as malaria and acute watery diarrhea, and it severely hampers efforts to provide medical assistance. Officials suspect malaria but still lack definitive evidence.
Thought Question
28.11 On the ProMED-mail web page (https://promedmail.org), click on the interactive world map to view outbreaks recorded by the WHO. Other than COVID-19, what outbreaks happened throughout the world during the current year?
Tracking an Emerging Disease
Sometimes world and national health organizations quickly and efficiently identify and contain outbreaks of emerging infectious diseases, as was the case in 2003 with SARS and in 2020 with COVID-19. In other instances, outbreaks take more time to contain, such as the 2014 Ebola epidemic in West Africa, described earlier. Agencies can also face difficulties in clearly identifying the causative agent of an outbreak, as in the 2015–2016 Zika virus outbreak in Brazil. The Zika virus story provides another instructive example of how new diseases are identified.
In August 2015, Dr. Vanessa van der Linden, a neurologist in Recife, Brazil, started noticing an increasing number of newborns with an abnormally small head and incomplete brain development—a condition called microcephaly (Fig. 28.31). Normally, months would pass without her seeing a single case. Now there were three or four in a single day. Using serological tests, she ruled out the usual suspects, such as rubella (German measles) and toxoplasmosis. Imaging studies, however, revealed unusual patterns of calcification in the affected brains (a possible sign of virus-induced necrosis). Vanessa knew something odd was going on. Then her mother called. FIGURE 28.31 ■ A child born with microcephaly in Brazil.
AP PHOTO/FELIPE DANA, FILE
Vanessa’s mother, Dr. Ana van der Linden, a neuropediatrician in another Recife hospital, told her daughter that she had seen seven babies with microcephaly in just one day and that some of the mothers remembered having a rash early during pregnancy. Could there be an infectious cause to these birth defects? In October, Vanessa alerted the state health secretary about the spike in
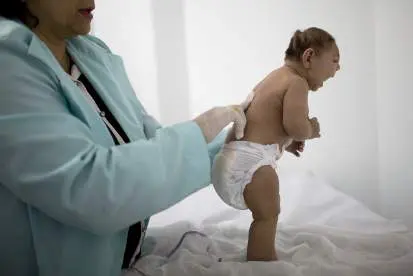
microcephaly cases. This was the first step in the epidemiological journey linking Zika virus, the cause of a normally benign, mosquito-transmitted disease in adults, to the development of microcephaly in Zika virus–infected fetal brains.
As the number of microcephaly cases grew, suspicion by public health officials initially fell on dengue virus, in part because the symptoms of Zika fever resemble those of dengue fever and because, prior to 2014, Zika virus infections were rare in Brazil. Both Zika and dengue viruses have positive-sense RNA genomes and are members of the Flaviviridae family of viruses. West Nile virus, mentioned earlier, is also a member of this family. Zika, dengue, and West Nile viruses are all transmitted to humans by Aedes mosquito vectors in person-to-person or animal-to-human transmission cycles. West Nile virus uses birds as natural reservoirs, whereas Zika and dengue viruses infect primarily human and nonhuman primates.
Because Zika infections seemed rare in Brazil, individuals who actually had Zika fever were not screened for Zika virus; they were screened for anti–dengue virus antibodies. Unfortunately, patient antibodies to Zika virus can cross-react with dengue virus antigen, so a person infected with Zika can appear to test positive for dengue (see the discussion of test specificity in Section 28.3). This technical problem slowed efforts to link Zika to the rise in cases of newborn microcephaly. Today, there are more specific qRT-PCR tests and better virus isolation procedures to confirm Zika virus diagnoses.
So, have Koch’s and Rivers’s postulates been fulfilled for Zika? Evidence of the virus has been found in the blood of mothers who delivered babies with microcephaly, and the virus itself has been isolated from the microcephalic brains of stillborn fetuses. Other studies indicate that Zika interferes with neurogenesis during human brain development and that monkey fetuses infected with Zika virus show signs of slow brain growth. In sum, the evidence of a link is convincing.
Fortunately, Zika virus infections have dropped significantly in Brazil because of mosquito control measures and personal protection strategies such as using mosquito repellent, although the risk still exists. And Zika virus has not become endemic in the United States, despite the presence of the Aedes mosquito, because there are no free-ranging nonhuman primate reservoirs. Meanwhile, the WHO and the CDC continue to carefully monitor the spread of Zika virus throughout the Americas by intensively screening mosquitoes. Epidemiological studies were extremely helpful in solving the 2015 epidemic of microcephaly caused by Zika virus. But that’s not always the case with new syndromes. Acute flaccid myelitis (AFM) is a case in point. AFM is a serious disease that has yielded few epidemiological insights about its cause. The syndrome, which suddenly appeared in 2014 and is still with us, is a paralysis resembling polio that is suffered by previously healthy children following certain respiratory virus infections usually caused by non-polio enteroviruses (for instance, enterovirus D68). The number of cases in the United States per year ranges from about 40 to 500; most AFM patients are hospitalized and require respiratory ventilation. The standard case definition of AFM is simply the presence of illness with fever prior to an acute onset of limb paralysis. Laboratory criteria include an MRI image showing a spinal cord lesion restricted to gray matter that spans one or more vertebral segments, plus CSF containing more than five white blood cells per microliter (indicating infection). Why this disease suddenly appeared is still a mystery. Health organizations continue to track the incidence of the disease by collecting fecal samples (enteroviruses are shed in feces), CSF samples, and respiratory secretions of patients fitting the case definition.
Technology Helps New Infectious Agents Emerge and Spread
Despite everything we know of microbes and despite the many ways we have to combat microbial diseases, our species, for all its cleverness, still lives at the mercy of the microbe. Lyme disease, MRSA, SARS-CoV-1, SARS-CoV-2, MERS-CoV, Ebola, E. coli O157:H7, HIV, “flesh-eating” streptococci, hantavirus, swine flu—all of these and many other new diseases and pathogens have emerged over the last 50 years. Worse yet, forgotten scourges, such as tuberculosis, have reappeared. Yet in the 1970s, medical science was claiming victory over infectious disease. What happened?
Part of the equation has been progress itself. Travel by jet, the use of blood banks, and suburban sprawl have all opened new avenues of infection. The speed with which SARS-CoV-2 virus spread throughout the world, starting from China, is a striking example. People unwittingly infected by a new disease in Asia or anywhere else can, traveling by jet, take the pathogen to any other country in the world within hours. A person may not even show symptoms until days or weeks after the trip, all the while transmitting the disease to others. This means that diseases can spread faster and farther than ever before. In addition, newly emerged blood-borne pathogens can spread by transfusion. This was a major problem with HIV before an accurate blood test was developed to screen all donated blood. Although human encroachments into the tropical rain forests have often been blamed for the emergence of new pathogens, one need go no farther than the Connecticut woodlands to find such developments. Borrelia burgdorferi, the spirochete that causes Lyme disease, lives on deer and white-footed mice and is passed between these hosts by the deer tick (see Fig. 26.34) in an infection cycle that has been going on for years. Humans crossed paths with these animals long before the disease erupted in our communities. Why have we suddenly become susceptible? The answer appears to be suburban development. In the wild, foxes and bobcats hunt the mice that carry the Lyme agent. These predators disappear when developers clear land and build roads and houses, leaving the infected mice and ticks to proliferate. Humans in these developed areas are more likely to be bitten by an infected tick and contract the disease than in prior decades. Luckily, many diseases that successfully leap from animals to humans find the new host to be a dead end, unable to spread the disease to others.
There are numerous examples in which technology and progress have had the unintended consequence of breeding disease. Here are just a few: Mad cow disease. Modern farming practices (in North America and Europe) of feeding livestock the remains of other animals help spread transmissible spongiform encephalopathies, similar to Creutzfeldt-Jakob disease, that are associated with prions. Because the prion is infectious, the brain matter from one case of mad cow disease could end up infecting hundreds of other cattle, thereby increasing the chance that the disease could spread to humans.
Lyme disease. Suburban development in the northeastern United States destroys predators of the mice that carry Borrelia burgdorferi.
Hepatitis C. Transfusions and transplants spread this blood-borne disease.
Influenza and COVID-19. Live poultry markets in Asia serve as breeding grounds for avian flu viruses and coronaviruses that can jump to humans.
Enterohemorrhagic E. coli (for example, E. coli O157:H7). Modern meat-processing plants can accidentally grind trace amounts of these acid-resistant, fecal organisms into beef while making hamburger.
Climate Change Influences Emerging Diseases
The world’s climate has been changing slowly but significantly over the last 50 years—largely as a result of humans pumping enormous amounts of greenhouse gases, such as carbon dioxide and methane, into the atmosphere. Greenhouse gases trapping heat in the atmosphere have caused the world’s average yearly temperature to rise by about 1.5°F since 1970. Effects of these warming temperatures are evident as disappearing glaciers, rising sea levels, mounting ferocity of hurricanes and tornadoes, extended droughts, increased rainfall (floods), dust storms, and heat waves. These climate changes can also affect the epidemiology of infectious disease.
Rising air temperatures, for example, can extend the habitat of mosquito and tick vectors to higher mountain elevations and wider latitudes. The result is that Zika virus, dengue virus, and Plasmodium (the protozoan cause of malaria), among other infectious agents, have increased their geographic range. Mathematical simulations predict that the area populated by Anopheles mosquito vectors that carry malaria will increase 16%–49% by 2030, depending on the vector. Extending a pathogen’s range can bring it into contact with novel groups of hosts, possibly establishing new vector-pathogen transmission cycles or a situation that promotes pathogen evolution (such as influenza or coronaviruses). Warmer temperatures can also accelerate host-parasite cycles that will further increase the incidence and prevalence of infections.
A warming climate has also been implicated in the emergence of a dangerous, drug-resistant fungal pathogen, Candida auris. Humans are protected from fungal infections, in part, because of something called the thermal restriction zone, which is the difference between human body temperature (37°C) and optimal fungal growth temperature (25°C). To adapt to a warming climate, C. auris has evolved an increased tolerance to heat as compared to closely related species. The proposal is that this thermal adaptation has reduced the thermal restriction barrier for infection.
Increased rain and flooding will promote the breeding of mosquito vectors that transmit disease—a situation that will worsen with climate change. Floods can also accelerate the spread of diarrheal diseases such as cholera when sanitation systems fail. As these events increase, so, too, will infectious disease.
The Arctic is particularly sensitive to climate change. It is home to diverse populations of plants, animals, and people. Approximately 10 million people live within the Arctic Circle, a geographic area that encompasses parts of nine countries, including Canada and the United States. The Arctic has warmed twice as much as the global average of other parts of the world and is becoming increasingly fragile. The associated health risks for humans and animals include potential changes in pathogen and vector demographics that can affect disease patterns, degradation in the quality and availability of both drinking water and food, and changes in animal and plant species health.
Climate change will continue to provide opportunities for some pathogens to expand their geographic footprint and may even limit the transmission of others. To stay ahead of these evolving infections, surveillance programs capable of detecting pathogen or disease emergence are essential. Make no mistake: The effect of climate change on infectious diseases and the rise in antibiotic-resistant microbes pose serious threats to the living world.
The One Health Initiative
We have provided many examples of how the natural environment can harbor pathogens and foster the emergence of new ones.
Knowledge that pathogens have reservoirs in animals, arthropods, and plants has given rise to a new collaborative effort among clinicians, scientists, veterinarians, and ecologists that is called the One Health Initiative. The goal of the One Health Initiative is to control human health through animal health, and vice versa. For example, vaccinating wild rodents could decrease Lyme disease in humans. The initiative includes plant pathology because some bacteria are pathogens of both plants and humans (for example, Pantoea agglomerans, formerly Enterobacter agglomerans). In addition, some enteric bacteria can live within a plant vascular system (for example, E. coli, Klebsiella, and Salmonella).
Solving a mystery. An excellent example of how multidisciplinary collaboration resulted in better understanding of an infectious outbreak occurred in 2006 when approximately 200 people in 26 states were diagnosed with a particularly virulent case of E. coli O157:H7. Nearly half of the cases were hospitalized, and many suffered from hemolytic uremic syndrome (HUS, kidney failure described in Section 26.4). The source of the infection was contaminated spinach traced to the Salinas Valley of California. It turned out the organisms were contained within the vascular system of the spinach, so washing the spinach would not remove the pathogen. Had this outbreak been viewed through only the narrow lens of human health, efforts would have focused on morbidity, mortality, outbreak investigation, laboratory diagnosis, and clinical treatment. The origin of the disease would have remained a mystery. Working together, epidemiologists and veterinarians found a genetically identical E. coli strain in cattle close to where the spinach was produced and in wild hogs that ran through the same fields. Ecologists and hydrologists understood that the groundwater and surface water in this region were being mixed because of a drought followed by heavy rains, and that irrigation systems were strained in the effort to keep up with intensified agricultural production. Eventually, the same E. coli strain that was causing disease was found in one of the water ditches close to the spinach fields in the area. Scientists pondering these facts within the One Health framework deduced that cattle harboring the E. coli had defecated in a field, thereby contaminating wild hogs. The wild hogs, by running through the spinach fields, had contaminated those fields with their feces, and the irrigation water had then swept the pathogen into the plant vasculature.
Only by integrating our knowledge of the environment and ecology could this investigation be completely understood and appropriate intervention and prevention strategies implemented. This outbreak exemplifies the fact that human health and animal health are inextricably linked and that a holistic approach is needed to understand, protect, and promote the health of all species. Stopping zoonotic diseases. A more recent example of the One Health approach has been carried out in the Ruaha region of Tanzania, Africa—a sprawling, wild area with scattered small villages and a rich wildlife. Thousands of children and adults in underdeveloped countries such as Tanzania die every day from diseases arising from the human-animal-environment interface. People in these areas often live in close contact with wild and domestic animals and are brought even closer as water becomes scarcer. Sharing the same water sources for drinking, washing, and swimming facilitates zoonotic disease transmission to humans (Fig. 28.32).
FIGURE 28.32 ■ An opportunity for the transmission of zoonotic diseases to humans. Two African boys collect water from a river shared with numerous other animals. The water they collect will contain a variety of fecal microbes and be populated by mosquitoes that can transmit zoonotic diseases.
SPEEDSHUTTER PHOTOGRAPHY/SHUTTERSTOCK
The One Health Initiative simultaneously addresses multiple and interacting causes of poor human health to try to stop or limit these zoonotic diseases. One underdiagnosed zoonotic disease that the collaborative has addressed is bovine tuberculosis (BTB), a disease that normally affects animals but also infects humans. Tanzania suffers 40,000 new cases of tuberculosis per year caused by human, bovine, or atypical strains of mycobacteria. A majority of these TB patients are also infected with HIV. BTB in humans often progresses to extrapulmonary TB, making BTB a major focus of the initiative. The approach in Tanzania, called the Health for Animals and Livelihood Improvement (HALI) Project, included the testing of wildlife, livestock, and their water sources for zoonotic pathogens and

disease. Water quality, availability, and use were monitored, as well as the impact of livestock and human disease on farming households. New diagnostic techniques for disease detection were introduced, and Tanzanians of all educational levels were taught about zoonotic diseases. Finally, new health and environmental policies were developed to mitigate the impacts of zoonotic diseases.
The HALI Project identified bovine tuberculosis and brucellosis in livestock and wildlife in the Ruaha ecosystem and also identified geographic areas where water availability increases the risk of transmission among wildlife, livestock, and people. In addition, Salmonella, Escherichia coli, Cryptosporidium, and Giardia species that cause disease in humans and animals have been isolated from multiple water sources used by people and frequented by livestock and wildlife. A major lesson of the HALI Project is that the causes and consequences of zoonotic diseases, as well as the interventions to mitigate them, span many sectors of human organization. Effective surveillance, assessments, and interventions are possible only if communication and cooperation improve among institutions that study and manage wildlife, livestock, water, and public health.
To Summarize
Koch’s and Rivers’s postulates are important for identifying the microbial cause of a new disease, but they must be supplemented with molecular or disease-tracking tools if one of the postulates cannot be satisfied.
Emerging diseases can spread quickly around the world as a result of air travel.
Modern technology and urban growth have provided opportunities for new diseases to emerge.
Climate change has significantly affected the epidemiology of infectious disease and the emergence of new pathogens. Multidisciplinary collaboration among ecologists, veterinarians, clinicians, and other scientists is necessary for devising appropriate strategies aimed at disease intervention and epidemic prevention.
Glossary
emerging disease A new infectious disease that has recently appeared in a population.
basic reproduction number R 0 The average number of infections resulting from a single infected person in a population with no immunity.
effective reproduction number R The average number of infections resulting from a single infected person in a population with partial immunity.
Fig. 26.13 FIGURE 26.13 ■ COVID-19 pandemic cases in the United States. Data show positive tests on each day.
Fig. 26.34
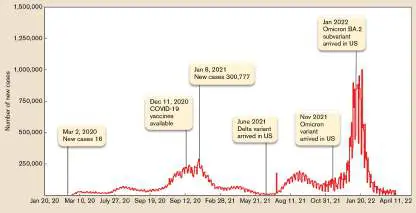
FIGURE 26.34 ■ Lyme disease. A. Erythema migrans rash. B. Borrelia burgdorferi, the agent of Lyme disease (cell length 5–30 μm; colorized SEM microscopy). C. Ixodes vector (SEM). D. Host associations of Ixodes scapularis. The life cycle of the tick from egg to adult takes two years to complete. As the ticks develop, they are attracted to the barberry bush, from which females can transfer to a variety of animals for a blood meal.
CDC
EYE OF SCIENCE/SCIENCE SOURCE
DAVID M. PHILLIPS/SCIENCE SOURCE
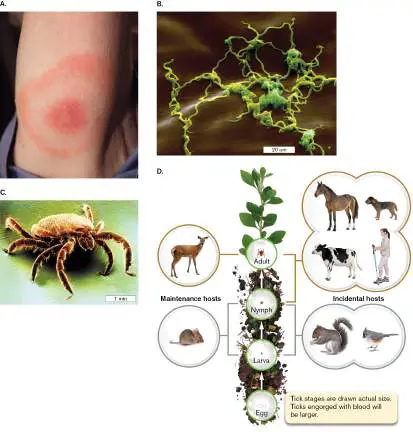
28.6 Infectious Disease and Health Disparitiesnot assigned
Case History: Bias or Biology?
In June 2020, two men entered a New York City hospital with symptoms of COVID-19. Both were admitted to intensive care. They were of equal age, had loving families, and were reasonably healthy before contracting this disease. A conspicuous difference, however, was that one man was Black and the other was White. After 10 days of treatment, the White man recovered and was wheeled down a hospital hallway lined with doctors and nurses cheering him on as he passed by. The Black man was not as lucky. He died without ceremony and, because of pandemic restrictions, was unable to see or even say goodbye to his family. Why were the outcomes of these two men so drastically different? You would not be wrong to wonder whether racial disparities in disease susceptibility, or perhaps in health care, played a role. (The details of this case have been fictionalized, but they reflect real events that took place in hospitals across America.)
The United States was brought to its knees in 2020 by the COVID-19 pandemic caused by the SARS-CoV-2 virus. As of June 2022, 85 million people had been infected and over 1 million had died. Figure 28.33illustrates the crowded conditions of COVID wards during this time and the extreme precautions taken to protect hospital workers from infection. The disease not only revealed an embarrassing lack of pandemic preparedness on our part, but it also exposed an awful truth about social inequities in the country—a truth that many Americans were either unaware of or indifferent to. Examining these inequities and their impact on disease is another part of epidemiology.
FIGURE 28.33 ■ A ward for coronavirus patients in Brooklyn, New York.
VICTOR J. BLUE/THE NEW YORK TIMES/REDUX
Fifty years ago, when epidemiologists first examined the incidence of diseases among different racial and ethnic groups in the United States, they discovered something disturbing. Black Americans and Latino Americans were consistently more prone to many diseases, including infectious diseases, than were White European Americans. The COVID-19 pandemic is the most recent and striking example of these disparities. The CDC, for instance, found that age-adjusted COVID-19 hospitalization rates for Black and Latino patients in May 2020 were, respectively, 4.5 and 3.3 times higher than that of White patients and they died at twice the rate of White patients. So, even though there are twice as many White people living in the United States as there are Black and Latino people combined, the latter groups were at greater risk of contracting disease. (However, in large part due to increased
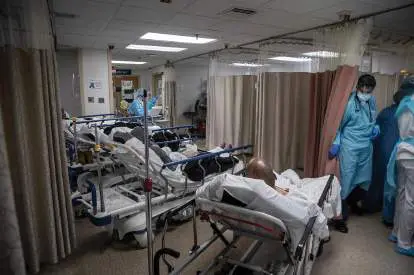
vaccination rates among these groups, these discrepancies narrowed in the later stages of the pandemic in 2022.)
Health disparities are defined as differences in the incidence, prevalence, mortality, and social burden of diseases that exist among specific populations. Black and Latino people, as well as indigenous people and LGBTQ people, are all subject to health inequities. Figure 28.34Aillustrates some of these disparities with regard to COVID-19 mortality. Many other infectious diseases, such as chlamydia (Fig. 28.34B ) and hepatitis B (Fig. 28.34C ), also show disparities in incidence, prevalence, and health outcomes. FIGURE 28.34 ■ Infectious disease health disparities among minority populations. A. COVID-19 deaths per 100,000 people in the United States as of July 2020 (from https://covidtracking.com/race/dashboard, The COVID Tracking Project at The Atlantic, https://creativecommons.org/licenses/by/4.0/). B. Chlamydia infections per 100,000 people (incidence) in the United States in 2018. “Indigenous” includes American Indians/Alaska Natives; “Pacific Islander” includes Native Hawaiians and other Pacific Islanders (from www.cdc.gov/std/stats18/minorities.htm). C. Prevalence of past or present hepatitis B infection from 2015 to 2018 by sex, race, and U.S. birth status. Past or present infection is indicated by finding antibody to hepatitis B core antigen, which is not part of the hepatitis B vaccine. (HepB vaccine contains the hepatitis B surface antigen, not the core antigen.) Therefore, people immunized with the HepB vaccine are not counted as
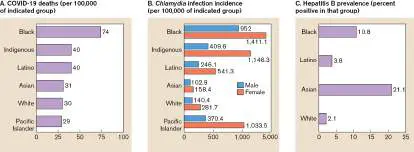
having been infected. Percent value for each group is based on the group examined (from ww.cdc.gov/nchs/products/databriefs/db361.htm).
Socioeconomics and Health Disparities
There is a difference between “health disparities” and “health care disparities.” Health disparities, as described earlier, reflect the unequal burden of illness suffered by racial minorities, ethnic minorities, and other marginalized groups. Health care disparities, however, refer to differences in the access to, use of, and quality of care given to different groups of people. Health care disparities are caused by systemic racism, which is defined as cultural or institutional policies that block people of color from fully participating in society and the economy. The social and economic pressures imposed by systemic racism have a tremendous impact on the availability of health care. Limited health care, in turn, drives health disparities for many diseases, including infectious diseases. Unfortunately, people of color are disproportionately stressed by many socioeconomic issues. Infectious outbreaks and global pandemics such as COVID-19 intensify these pressures and worsen racial and ethnic health disparities. The socioeconomic pressures linked to systemic racism include the following factors: Education. For several reasons, members of racial and ethnic minority groups often face barriers to educational opportunity. Educational inequality can lead to lower literacy levels, lower high school completion rates, limited access to higher education, and, consequently, narrowed job opportunities.
Income. Many members of racial and ethnic minority groups face discrimination in the workforce and are segregated into low-wage jobs. Consequently, they earn lower average incomes than White people do. They also carry greater debt. These two factors limit access to health care and degrade other socioeconomic elements.
Occupation. Members of racial and ethnic minority groups are disproportionately employed as workers in health care facilities, factories, food production plants, and public transportation. Because their jobs require close contact with the public, essential workers are more frequently exposed to, and infected with, various infectious agents. Many essential workers lack health care benefits, which is another obstacle to preventing infections and receiving treatment.
Physical environment. Economic stresses suffered by members of racial and ethnic minority groups, combined with structural factors in real estate and public policy, can make finding adequate and affordable housing difficult. Consequently, many people of color are forced to live in crowded areas with unreliable transportation systems, limited access to nutritious foods (so-called “food deserts”), and few primary care physicians. These neighborhoods are often located near industrial regions that can pollute soil and air, further increasing a community’s susceptibility to infectious diseases.
Improving any one socioeconomic factor can improve other factors in the list. For instance, broadening educational opportunities can lead to better-paying jobs. A better-paying job can improve a person’s living conditions, make medical care more affordable, and enable better health care through medical insurance.
Comorbidities and health care. A comorbidity is a medical condition that is present simultaneously with another disease in a single patient. Members of racial and ethnic minority groups subjected to the socioeconomic pressures mentioned previously are more likely to develop comorbidities such as hypertension, diabetes mellitus, obesity, and others, all of which undermine a patient’s immunity. A less effective immune system will, of course, increase that person’s vulnerability to infectious diseases, including COVID-19. The situation for these individuals can become even more desperate because, as noted earlier, disadvantaged people may face limited access to health care, inadequate health insurance, and communication (linguistic) barriers when they do seek health care.
The Roles of Implicit and Institutional Biases
The degree of socioeconomic disparity encountered by members of racial and ethnic minority groups is driven by various forms of racism. Sometimes it’s conscious or systemic racism, like purposely being kept from moving into a neighborhood because of skin color. More often the form is unconscious (or implicit) racism exhibited by otherwise well-meaning people who do not realize they are being racist. One example is unknowingly treating a person of color with less courtesy or respect than other people. As a result, patients of color may be kept waiting longer for assessment or treatment in medical facilities than their White counterparts. White providers with conscious or unconscious biases may spend less time with patients of color or may harbor misperceptions about their pain tolerance, behavioral tendencies, and even intelligence. Sometimes physicians talk about racial or ethnic identity itself as a “risk factor” for disease instead of acknowledging that there are structural factors in our society and within the medical field that drive health inequities. Subtle, intrinsic biases can also manifest in a dominant and condescending tone that makes patients of color feel unheard and less valued by their providers. Most importantly, intrinsic biases might lead hospital staff to perform unnecessary or less thorough diagnostic work and to recommend different treatments for patients of color based on misguided assumptions about their ability to comply with physician orders.
The COVID-19 pandemic exposed a surprising but dangerous form of intrinsic racial bias in the use of oximeters to evaluate blood oxygen level in hospitalized patients. Oximeters, which look like clothespins, fit over a fingertip and noninvasively estimate a patient’s blood oxygen level. Two diodes in the device emit two different wavelengths of light that are differentially absorbed by oxygenated and deoxygenated hemoglobin. An algorithm uses this data to estimate the patient’s arterial oxygen saturation, a parameter used to determine whether or not a patient needs mechanical ventilation. Most physicians were unaware that measurements taken through darker skin will often overestimate arterial oxygen saturation. Thus, a Black man with an oximeter reading of >92% oxygen saturation (considered normal range) may actually have an arterial oxygen saturation that is less than 88%, which is considered dangerous arterial hypoxemia. An uninformed health professional relying on the faulty reading from the pulse oximeter might therefore withhold ventilation assistance, increasing the risk that the patient could die. Studies have shown that hospitalized Black patients experience a nearly threefold increase in the odds of developing arterial hypoxemia despite normal pulse oximetry readings. Solving this form of racial bias will require studies to gather data from racially diverse individuals as a way to derive more accurate reference values.
Ultimately, the implicit biases and discriminatory actions of people in decision-making roles—including hospital staff, administrators, and designers of medical equipment—may lead to entrenched institutional biases (systemic racism) that hinder care and yield poor disease outcomes. It is important to realize that even physicians of color who train under conditions of institutional bias can develop unconscious biases of their own.
Is There a Genetic Component to Racial and Ethnic Health Disparities?
Small sequence differences in human DNA account for the minor physical distinctions we tend to associate with race—distinctions like light versus dark skin or thick versus thin hair. When we realize that we all evolved fairly recently from hominids that migrated out of Africa, we can appreciate that we are all Homo sapiens. The sequence differences between what we call “races” are merely random mutations that persisted because they provided some evolutionary advantage to humans migrating to and through certain environments. One example is darker skin that provides protection from dangerous UV light, which is more prevalent around the equator.
Modern genome sequencing studies reveal a considerable blending of DNA among the different so-called races throughout our history. For instance, most people who identify as Black Americans have some European ancestry, and most White Americans have DNA sequences traceable to West African and Native American ancestors. Genealogical DNA tests (such as those performed at Ancestry.com) use a variety of DNA markers to trace a person’s geographical heritage, not ethnicity. Because there is a complex relationship between ancestry, genetics, and phenotype, there is no specific gene that can be used to determine a person’s race. In fact, the concept of “race” is actually an invention of the eighteenth century used to justify the slave trade. The bottom line is that racial categories are based on subjective evaluations of traits, not science. You might as well argue that red-haired people are a race different from blond(e) people.
It is true that some DNA sequences (alleles) can predispose individuals to develop certain disease states such as cystic fibrosis, diabetes, or even obesity, to name a few. It is also true that these gene alleles can be present less often in some races than in others. The recessive allele for cystic fibrosis, for instance is carried by 1 in 29 White Americans but only 1 in 65 Black Americans. But those disease-associated alleles are present in all races, just at different frequencies. These forms of health disparity are not tightly linked to or the result of “race” per se. They simply arise from the uneven distribution of certain alleles within different populations. Could racial differences in immune responses play a role in health disparities? No study suggests that Black Americans have immune systems less effective than White Americans. In fact, several studies have shown that Black Americans and members of other minority groups produce antibodies as well as or marginally better than White Americans in response to several vaccines (for example, influenza, measles, H. influenzae, and B. pertussis). It turns out that the well-documented high incidence of influenza among racial and ethnic minority groups is not caused by genetics, but by lower vaccination rates, and is exacerbated by socioeconomic inequities.
Epigenetics and genomic medicine. While there is no evidence that gene sequences can account for racial disparities in infection rates, social inequities experienced by members of racial and ethnic minority groups can make epigenetic modifications to DNA that alter the expression of genes in ways that may contribute to health disparity.
Epigenetics (from the Greek “epi,” meaning “added to”) is the study of heritable changes in gene expression (transcription) that do no t involve changes in DNA sequence. It’s like bolding a word in a sentence. The order of letters in the sentence does not change, but one of the words is emphasized. Epigenetic mechanisms include the enzymatic addition of methyl groups to preexisting DNA bases, modification of histone proteins, and silencing of genes by noncoding small RNA molecules (Fig. 28.35). All of these mechanisms affect human gene expression without changing a person’s DNA sequence. Ample evidence indicates that these epigenetic programs can influence the strength of our immune systems. Thus, it is conceivable that childhood adversity and social inequities (racism) experienced by members of racial and ethnic minority groups can trigger epigenetic changes to an individual’s genome that might weaken immunity and increase susceptibility to infectious diseases.
FIGURE 28.35 ■ Epigenetic mechanisms affect gene expression but do not alter DNA sequence. Various cellular enzymes can perform DNA methylations (adding methyl groups to bases in a DNA sequence, usually a cytosine–phosphate– guanine sequence) or histone modifications (adding or removing acetyl, methyl, and other groups to histone proteins to alter chromatin structure). A third mechanism involves tiny microRNA molecules that can base pair with messenger RNA sequences to limit translation or initiate mRNA degradation. Stress can influence which genes become affected by epigenetic mechanisms. DNMTs = DNA methyltransferases; HAT = histone acetyltransferase; HDAC = histone deacetylase; mi-RNA = microRNA.
There is one new trend that threatens to increase health disparities. It is the advent of a promising new field called genomic medicine. Genomic medicine uses an individual’s DNA sequence to predict the most effective treatment for a given condition. We now know that small genetic differences among individuals are associated with varied responses to specific medications. Take colorectal cancer, for example. Some people with a particular gene
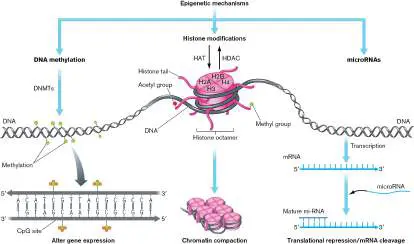
mutation have better survival rates when treated with aspirin than people without this mutation.
Genomic medicine starts by sequencing genomes of many people with and without a given disease. The results enable scientists to determine which sequences individually or in combination will forecast a greater risk for developing that disease. That information, known as the polygenic risk score (PRS), is matched with how different patients respond to different treatments. With enough data, doctors can predict which specific treatment is best for future patients having similar genetic markers.
Unfortunately, the data for PRS scores come primarily from populations of recent European descent. This means that future health advances based on genetic data will increasingly leave behind much of the world’s population. Without more inclusive databases, the current PRS strategy will miss linking effective treatments for certain diseases to unusual combinations of genetic markers that may be seen more frequently, but not exclusively, among patients of color. Health disparities, then, will arise from societal choices about which ethnic groups to study. In addition, disparities will result from unaffordable out-of-pocket costs to patients of color who want to avail themselves of the technology and the reluctance by some to even participate in those studies. To understand why some Black patients might hesitate, consider the Tuskegee experiment (see Section 26.4).
How Do We Eliminate Health and Health Care Disparities?
Everyone agrees that we need strategies to eliminate health disparities, including those involving infectious disease. To paraphrase a quote by Martin Luther King, Jr., injustice in health care is the most shocking and inhumane form of inequality. Society and science must find ways to lessen the disease burden of historically marginalized populations. But in addition to addressing racial injustice, it is also important to realize that even if you are not part of a group that is subject to health disparities, you are still indirectly affected by them. When more people within any single social group become ill with infection, medical care costs and insurance rates will increase for everyone. When large numbers of people in the workforce become ill, goods and services can become scarce, and the consequent supply chain disruptions will affect many other businesses. In addition, the very individuals who are more vulnerable to health care inequities are also the most likely to be frontline employees in customer service or elder care, a scenario that will increase disease transmission not only among people of color but across the whole of society.
So how do we fix these inequities? Approaches most likely to reduce disparities in health and health care include efforts to improve educational opportunities, increase vaccination rates, reduce income inequality, promote dietary and exercise initiatives, and ensure universal access to primary care. Increasing diversity among hospital personnel, including clinicians, nurses, and technicians, also will help mitigate intrinsic and systemic biases. Efforts to increase hospital diversity will lessen the stress felt by patients of color and help them become more receptive to health care. But the real key will be honest introspection among all Americans, regardless of our color, our race, or our ethnicity, to recognize intrinsic biases in ourselves and to engage in open discussions about race at national, local, and personal levels. Recognizing and reducing conscious and unconscious racist behaviors will help remove the fuel that drives health disparities.
Glossary
health disparities Differences in the incidence, prevalence, mortality, and social burden of diseases that exist between white and minority populations, or between populations of different socioeconomic status.
health care disparities Differences in the access to and quality of care given to white and minority populations, or to populations of different socioeconomic status.
eResearch Activity 28
How Does SARS-CoV-2 Evolve in the Human Host?
SARS-CoV-2 virus, the cause of COVID-19 disease, has a large genome for an RNA virus and, unlike smaller RNA viruses, uses a 3′- to-5′ exonuclease proofreading system to enhance the fidelity of replication. Yet the virus has still acquired mutations over the course of the pandemic that have either enhanced infectivity or altered immunogenicity. The latter enabled some variants to partially escape vaccine-dependent immunity and cause breakthrough infections. Considerable attention has been directed at the disease-causing variants spreading throughout the population, but little is known about how SARS-CoV-2 evolves within the host. An in-depth analysis of SARS-CoV-2 variants as they appear within an infected person is pivotal for a thorough understanding of the virus’s evolution and the shifting epidemiology of this disease.
Yotam Bar-On from the Technion-Israel Institute of Technology and colleagues recently addressed this issue by identifying and sequencing batches of single SARS-CoV-2 RNA genomes collected from the individual respiratory tracks of nine COVID-19 patients ( Table ERA 28.1 ). The process they used is called single genome sequencing (SGS). To carry out SGS, viral RNA was isolated from the nasopharyngeal swab of a patient, and that RNA was then converted to the first strand of a complementary DNA (cDNA) using a reverse transcriptase. Samples from each patient were processed separately throughout the study. The cDNA product from each patient sample was diluted into a series of microtiter wells such that only three out of ten wells received a single cDNA template molecule. The S (spike protein) and N (nucleocapsid protein) genes were then amplified by PCR (Fig. ERA 28.1 ). These genes were chosen because the spike protein mediates host cell attachment, and the nucleocapsid protein is highly immunogenic and most likely subject to immune selective pressure. Our focus in this feature is the spike protein gene.
SARS-CoV-2–Infected
TABLE ERA 28.1 a
Study Participants
Patient Gender Age Estimated place of ID infection 3120 Female 74 Spain/Switzerland 3804 Female 35 Spain 3807 Female 34 Austria 3953 Male 43 Germany/Greece 4000 Female 11 Spain 3380 Male 40 Germany/Greece 4065 Male 31 United States/Russia 48552 Female 73 Israel 48559 Male 51 Israel FIGURE ERA 28.1 ■ SARS-CoV-2 genome. The top panel shows a schematic of the virus and the location of key proteins. The bottom panel illustrates the location of genes on the virus genome. Sequences determined in this study include the spike (S) gene (amplified by black arrow primers) and the nucleocapsid (N) gene (amplified by blue arrow primers).
Purified S and N amplicons were subjected to Illumina DNA sequencing, and the sequences were compared to the standard SARS-CoV-2 sequence (Wuhan-Hu-1 isolate). SGS accurately revealed the in vivo frequency of mutant strains that develop during an infection without introducing an in vitro culturing bias; that is, SGS identifies mutant viruses without requiring the virus to replicate in tissue culture cells. Figure ERA 28.2 presents the results of S gene analysis. Most of the mutations identified were not previously documented in other databases, but some of the same mutations arose in different individuals. For example, individuals 4000 and 48559 had a virus genome with the same C968T mutation. In this instance, the number 968 is a nucleotide position on the standard Wuhan-Hu-1 genome; the first letter, C, is the nucleotide found at that position in cDNA made from the Wuhan strain; the second
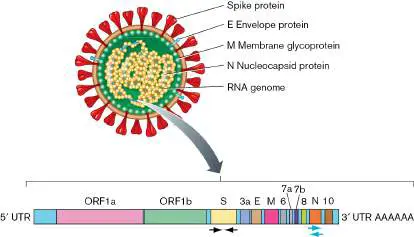
letter, T, indicates the nucleotide change in cDNA of the patient variant. (Mutations can also be named in a similar fashion by using the single-letter amino acid codes for the affected codon’s original and substituting amino acids, as we see next.)
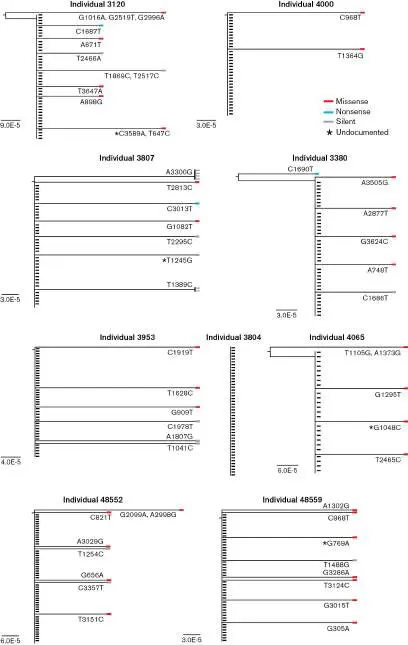
FIGURE ERA 28.2 ■ Single genome sequencing analysis reveals SARS-CoV-2 spike diversity. Phylogenetic trees showing the S gene diversity of viruses isolated from single patients. Each rectangle represents a separate virus from an individual. Nucleotide substitutions were marked relative to the Wuhan-Hu-1 strain sequence. Black rectangles indicate the dominant S gene sequence found in an individual. Red rectangles indicate missense mutations; gray rectangles indicate silent mutations; blue rectangles depict nonsense mutations. Asterisks indicate mutations not found in previous SARS-CoV-2 databases. None of the S genes in individual 3804 exhibited mutations (Table ERA 28.1).
The intra-host variants within each patient, marked by colored rectangles in Figure ERA 28.2 , were present at lower frequencies relative to the more abundant SARS-CoV-2 inter-host variant (black rectangles) found in that patient. Note that sequences of the dominant inter-host variant within one person can be different from sequences of the dominant virus from a different person. The authors predicted that the intra-host variants would, because they are rare, show reduced infectivity and replication capacity. To test this, they selected ten spike variants and used them to generate ten SARS-CoV-2 pseudoviruses in a lentivirus background (Fig. ERA 28.3A ). Each pseudovirus expressed a SARS-CoV-2 mutant spike protein needed for attachment and entry (amino acid substitutions are shown) and a NanoLuc luciferase reporter gene that is expressed if the pseudovirus infects and replicates. These pseudoviruses were used to infect ACE2-expressing host cells. The results, shown in Figure ERA 28.3B , confirmed that the infectivity of each pseudovirus containing a rare variant spike protein was reduced relative to a pseudovirus expressing a wild-type spike protein.
FIGURE ERA 28.3 ■ Infectivity of SARS-CoV-2 pseudoviruses expressing mutated spikes. A. Locations of amino acid substitutions in the S protein conferred by the spike gene mutations. Variant #5 contains two mutations: G339D and G999T. NTD = N-terminal domain; RBD = receptor binding
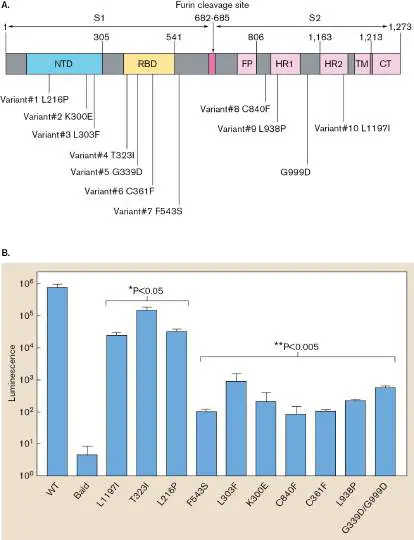
domain; FP = fusion peptide; HR1 = heptad repeat 1; HR2 = heptad repeat 2; TM = transmembrane domain; CT = cytoplasmic domain. B. Infectivity of 293T-ACE2 cells by the pseudoviruses compared to wild type (“WT,” a pseudovirus that expresses an unmutated Wuhan-Hu-1 spike) and to a bald lentivirus (“Bald”) lacking the spike protein. The x -axis shows the amino acid substitutions in the spike protein; the y -axis shows the relative luminescence levels after 48 hours of infection.
The scientists next examined how the inter-host variants coped with neutralizing antibodies generated by the Pfizer mRNA vaccine or by natural COVID-19 infection. Seven volunteers were selected for vaccination. Two weeks after receiving the second dose of the vaccine, blood was drawn from each volunteer. Blood plasma prepared from all of the vaccinated subjects had high levels of anti-spike IgG antibodies capable of neutralizing wild-type virus. Dilutions of plasma from the vaccinated volunteers and of convalescent plasma from two COVID-19 patients were tested for their abilities to neutralize the infectivity of pseudoviruses containing the wild type or one of three mutant S proteins (L1197I, T323I, L216P). Half-maximal inhibitory concentrations of plasma samples (called the neutralization titer, NT 50) were determined statistically. The NT 50 values of plasma samples tested on the L1197I pseudovirus revealed this variant S protein to be more resistant to four of the seven vaccine-related plasma samples (indicated by name in Fig. ERA 28.4 ). Plasma susceptibility of the other two S variant pseudoviruses was equivalent to that of wild-type S protein.
FIGURE ERA 28.4 ■ SARS-CoV-2 pseudovirus neutralization assay. Neutralization assays were performed to compare the sensitivity of pseudoviruses with wild-type spike protein (WT) or indicated mutant spike proteins to plasma from vaccinated volunteers (Vac) and convalescent plasma (COV). Plasma dilutions were mixed with viruses and the mix then added to ACE2-expressing tissue culture cells. Relative luminescence reflected virus replication and was used to determine 50% neutralization titers of plasma from vaccinated individuals or convalescent plasma. Statistically significant differences in NT 50 values are indicated (Student’s t test, P < 0.05). NS = not significant.
The mRNA-based vaccines have been effective at controlling the COVID-19 pandemic in regions with high vaccination rates. The fear is that a vaccine-resistant SARS-CoV-2 variant could emerge and impede control of the pandemic. Studies by others have shown that specific mutations in the spike protein can, indeed, impair antibody binding and enable some degree of viral escape. However, the mutations in the S protein that impart antibody resistance are rarely found in naturally circulating variants. This suggests that spike mutations imparting antibody resistance may also produce a viral fitness defect. Results in this paper with intra-host variant L1197I support that theory.
Previous studies had examined SARS-CoV-2 mutations in variants that frequently circulate between individuals. This report used single genome sequencing to expose and analyze variants that arise
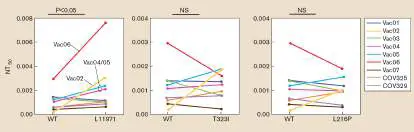
during an infection but ultimately fail to compete with the dominant variant causing the infection. Bulk sequencing is unlikely to find these rare variants. Over the long term, using the SGS method to locate rare mutations that impair infectivity, coupled with studying the effect of those mutations on spike protein structure, could expose new vulnerabilities of the virus. The results of this study are also important for emphasizing the randomness of virus evolution and the selective pressures (infectivity and immunity) that drive the evolution and shifting epidemiology of this disease.
Further Exploration
The Omicron variant of SARS-CoV-2 shows increased transmissibility and partial resistance to vaccine-based immunity. The virus contains 50 mutations, 30 of which occur in the S gene. Focusing on the S gene, how would you go about determining which mutations affect transmissibility and which affect vaccine resistance?
Source: Khateeb, Dina, Tslil Gabrieli, Bar Sofer, Adi Hattar, Sapir Cordela, et al. 2022. SARS-CoV-2 variants with reduced infectivity and varied sensitivity to the BNT162b2 vaccine are developed during the course of infection. PLOS Pathogens 18 :e1010242. https://doi.org/10.1371/journal.ppat.1010242
Endnotes
1. Note a: All participants were patients admitted to Sheba Medical Center. Nasopharyngeal swabs were obtained from each patient. Return to reference a CHAPTER REVIEW
Review Questions
1. Why is it important to identify the genus and species of a pathogen?
2. What is an API strip, and how is it used in clinical microbiology?
3. Describe three examples of selective media.
4. If a colony on a nutrient agar plate is catalase-positive, does this mean it is made up of Gram-positive microorganisms? Why or why not?
5. Describe the types of hemolysis visualized on blood agar. 6. What is the clinical significance of a group A, beta-hemolytic streptococcus?
7. How does one distinguish Staphylococcus aureus from Staphylococcus epidermidis?
8. Why are PCR identification tests preferable to biochemical approaches?
9. How is qRT-PCR performed?
10. Describe an ELISA.
11. Name some sterile and nonsterile body sites.
12. List seven common types of clinical specimens collected for bacteriological examination.
13. Describe key features of the four levels of biological containment.
14. How is a pandemic different from an epidemic?
15. How can genomics help identify nonculturable pathogens?
16. List and briefly describe four emerging diseases. 17. Name four select agents and the diseases they cause. 18. Explain the difference between health disparities and health care disparities, and discuss factors that lead to both.
Thought Questions
1. Consider the following hypothetical case: Five small outbreaks of Ebola occurred within days of one another in five different cities in the United States and Canada. Patient histories revealed that one person from each city had been in the Atlanta airport at the same time 2 days prior to becoming seriously ill. None had left the country recently; none flew on the same jet or even crossed paths while in the airport. Imagining yourself to be an epidemiologist who is aware that another outbreak occurred recently in the Congo, conjure up a scenario, excluding bioterrorism, that could account for this scattered outbreak.
2. A patient is brought to the hospital with an intra-abdominal abscess. Aspirates are sent to the laboratory for aerobic and anaerobic culture. What is wrong with this order?
Thought Questions 3–6 are based on the following case history: An infectious disease physician in Florida telephoned the CDC to report two possible cases of botulism. The two male patients presented with drooping eyelids, double vision, difficulty swallowing, and respiratory problems. The physician had drawn sera and collected stool specimens from the men to test for botulinum toxin, but no results were available.
3. What are the major concerns raised by these two possible cases of botulism?
4. How might you go about swiftly determining whether there is a link between the two cases and whether there are other cases of botulism?
5. The two patients ate only one food item in common: a cured and fermented fish called “moloha.” How would you determine whether the men are indeed suffering from botulism and whether the fermented fish is the source of disease?
6. How could this anaerobic pathogen grow and make toxin in this fish product? Propose rational theories for what has hindered development of a vaccine against botulism.
Key Terms
amplicon (1232)
basic reproduction number R 0 (1253) effective reproduction number R (1253) emerging disease (1251)
endemic (1245)
epidemic (1245)
epidemiology (1217, 1244)
health care disparities (1261) health disparities (1260)
incidence (1246)
index case (1246)
multiplex PCR (1232)
pandemic (1245)
patient zero (1246)
prevalence (1246)
probabilistic indicator (1224) quarantine (1246)
reservoir (1245)
sensitivity (1242)
sequela (1217)
specificity (1242)
syndromic surveillance (1247) systemic surveillance (1247)
Recommended Reading
Baker, Rachel E., Ayesha S. Mahmud, Ian F. Miller, Malavika Rajeev, Fidisoa Rasambainarivo, et al. 2021. Infectious disease in an era of global change. Nature Reviews Microbiology. https://doi.org/10.1038/s41579-021-00639-z.
Brook, Cara E., Mike Boots, Kartik Chandran, Andrew P. Dobson, Christian Drosten, et al. 2020. Accelerated viral dynamics in bat cell lines, with implications for zoonotic emergence. eLife 9 : e48401.
https://doi.org/10.7554/eLife.48401.
Casen, Christina, Heidi C. Vebø, Monika Sekelja, Finn T. Hegge, Magdalena K. Karlsson, et al. 2015. Deviations in human gut microbiota: A novel diagnostic test for determining dysbiosis in patients with IBS or IBD. Alimentary Pharmacology and Therapeutics 42 :71–83.
Cloeckaert, Axel, and Karl Kuchler. 2020. Grand challenges in infectious diseases: Are we prepared for worst-case scenarios? Frontiers in Microbiology 11 :613383.
https://doi.org/10.3389/fmicb.2020.613383.
Evans, Michele K. 2020. COVID’s color line—infectious disease, inequity, and racial justice. New England Journal of Medicine 383 :408–410. https://doi.org/10.1056/NEJMp2019445.
Fairfax, Marilynn Ransom, Martin H. Bluth, and Hossein Salimnia. 2018. Diagnostic molecular microbiology: A 2018 snapshot. Clinical Laboratory Medicine 38 :253–276.
Green, Manfred S., James LeDuc, Daniel Cohen, and David R. Franz. 2018. Confronting the threat of bioterrorism: Realities, challenges, and defensive strategies. Lancet Infectious Diseases 19 :E2–E13. https://doi.org/10.1016/S1473-3099(18)30298-6.
Guo, Yifan, Henan Lib, Hongbin Chen, Zhenzhong Li, Wenchao Ding, et al. 2021. Metagenomic next-generation sequencing to identify pathogens and cancer in lung biopsy tissue. EBioMedicine 73 :103639.
https://doi.org/10.1016/j.ebiom.2021.103639.
He, Wan-Ting, Xin Hou, Zin Zhou, Jiumeng Sun, Haijian He, et. al. 2022. Virome characterization of game animals in China reveals a spectrum of emerging pathogens. Cell 185 :1117– 1129. https://doi.org/10.1016/j.cell.2022.02.014.
McClymont, Hannah, Hilary Bambrick, Xiaohan Si, Sotiris Vardoulakis, and Wenbiao Hu. 2022. Future perspectives of emerging infectious diseases control: A One Health approach. One Health 14 :100371.
https://doi.org/10.1016/j.onehlt.2022.100371.
Muñoz-Price, L. Silvia, Ann B. Nattinger, Frida Rivera, Ryan Hanson, Cameron G. Gmehlin, et al. 2020. Racial disparities in incidence and outcomes among patients with COVID-19. JAMA Network Open 3 (9):e2021892.
https://doi.org/10.1001/jamanetworkopen.2020.21892.
Nguyen, Peter Q., Luis R. Soenksen, Nina M. Donghia, Nicolaas M. Angenent-Mari, Helena de Puig, et al. 2021. Wearable materials with embedded synthetic biology sensors for biomolecule detection. Nature Biotechnology 39 :1366–1374. https://doi.org/10.1038/s41587-021-00950-3.
Nnadi, Nnaemeka Emmanuel and Dee A. Carte. 2021. Climate change and the emergence of fungal pathogens. PLOS Pathogens 17 :e1009503.
https://doi.org/10.1371/journal.ppat.1009503.
Nuismer, Scott L., Ryan May, Andrew Basinski, and Christopher H. Remien. 2018. Controlling epidemics with transmissible vaccines. PloS One 13 :e0196978.
Pardee, Keith, Alexander A. Green, Mellisa K. Takahashi, Dana Braff, Guillaume Lambert, et al. 2016. Rapid, low cost detection of Zika virus using programmable biomolecular components. Cell 165 :1255–1266.
Rezaei, Meysam, Sajad Razavi Bazaz, Sareh Zhand, Nima Sayyadi, Dayong Jin, et al. 2021. Point of care diagnostics in the age of COVID-19. Diagnostics 11 .
https://doi.org/10.3390/diagnostics11010009.
Roberts, David L., Jeremy S. Rossman, and Ivan Jarić. 2021. Dating first cases of COVID-19. PLOS Pathogens 17 :e1009620. https://doi.org/10.1371/journal.ppat.1009620.
Varo, Rosauro, Xavier Rodó, and Quique Bassat. 2019.
Climate change, cyclones and cholera—Implications for travel medicine and infectious diseases. Travel Medicine and Infectious Disease 29 :6–7.
Waits, Audrey, Anastasia Emelyanova, Antti Oksanen, Khaled Abassa, and Arja Rautio. 2018. Human infectious diseases and the changing climate in the Arctic. Environment International 121 :703–713.
Wilson, Michael R., Samia N. Naccache, Erik Samayoa, Mark Biagtan, Hiba Bashir, et al. 2014. Actionable diagnosis of neuroleptospirosis by next-generation sequencing. New England Journal of Medicine 370 :2408–2417.
Glossary
sequela pl. sequelae A serious, harmful immunological consequence of bacterial and host antigen cross-reactivity that occurs after the infection itself is over. An example is rheumatic fever.
epidemiology The study of factors affecting the health and illness of populations.
probabilistic indicator A method used to identify an unknown strain of bacteria. The results of a battery of biochemical tests performed on the unknown strain are compared to the probabilities that a known species will have the same results.
amplicon A specific PCR product in which a small DNA sequence is amplified (many copies are synthesized).
multiplex PCR A polymerase chain reaction that uses multiple pairs of oligonucleotide primers to amplify several different DNA sequences simultaneously.
sensitivity In diagnostic testing, a measure of how often a test will be positive if a patient has a particular disease, reflecting how small a concentration of antigen the test can detect. specificity In diagnostic testing, a measure of how often a test will be negative if a patient does not have a particular disease, reflecting how well a test can distinguish between two closely related antigens.
endemic Describing a disease that is always present in a population, although the frequency of infection may be low.
reservoir 1. The major part of the biosphere that contains a significant amount of an element needed for life. 2. An organism that maintains a virus or bacterial pathogen in an area by serving as a high-titer host.
epidemic A disease outbreak in which large numbers of individuals in a population become infected over a short time.
pandemic An epidemic that occurs over a wide geographic area.
incidence The number of new cases of a disease in a given location over a specified time.
prevalence The total number of active cases of a disease in a given location regardless of when the case first developed. index case Also called patient zero. The first case of an infectious disease, and an important piece of data for helping to contain the spread of disease.
patient zero See index case .
quarantine The separation of infectious individuals from the general population to limit the spread of infection.
systemic surveillance Also called syndromic surveillance. The policy, established by central health organizations such as the U.S. Centers for Disease Control and Prevention or the World Health Organization, whereby physicians are required to report instances of diseases that have particularly high levels of severity and transmissibility, and thus are known as notifiable diseases.
syndromic surveillance See systemic surveillance .
emerging disease A new infectious disease that has recently appeared in a population.
basic reproduction number R 0 The average number of infections resulting from a single infected person in a population with no immunity.
effective reproduction number R The average number of infections resulting from a single infected person in a population with partial immunity. health disparities Differences in the incidence, prevalence, mortality, and social burden of diseases that exist between white and minority populations, or between populations of different socioeconomic status.
health care disparities Differences in the access to and quality of care given to white and minority populations, or to populations of different socioeconomic status.