Chapter introduction
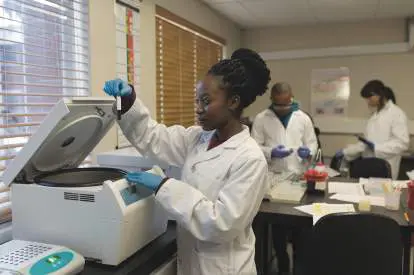
Centrifuge for cell analysis. Centrifugation is a powerful way to isolate cells (such as white blood cells from the blood) or components of cells (such as ribosomes from the cytoplasm). A centrifuge subjects a sample to centrifugal forces associated with rapid rotation. The instrument can be designed to separate components by their mass or by their density.
Wavebreakmedia Ltd UC83/Alamy Stock Photo
Appendix Sections
A3.1 Ultracentrifugation to Isolate Parts of Cells A3.2 Agarose-Gel Electrophoresis A3.3 Protein Identification on 2D Gels with Mass Spectr.bor-botometr.bor-boty A3.4 Northern and Southern Blots to Identify RNA and DNA A3.5 DNA Isolation and PCR Amplification A3.6 DNA Sequencing by Sanger, Illumina, and Nanopore Methods A3.7 Gene Cloning and Gibson Assembly A3.8 Primer Extension to Identify Transcriptional Start Sites A3.9 DNA Microarray A3.10 Protein Binding to DNA (ChIP-seq) and Protein-Protein Binding (Yeast Two-Hybrid Assay)
A3.11 Confocal Microscopy A3.12 Immunoprecipitation and Western Blot A3.13 ICNP Phylum Nomenclature Here in eAppendix 3 we present a number of experimental methods and technologies that researchers use in the study of microbiology. These methods are discussed in chapters throughout our book. This eAppendix also includes a table of nomenclature changes by the International Committee on Systematics of Prokaryotes.
A3.1 Ultracentrifugation to Isolate Parts of Cellsnot assigned
Cellular components, such as ribosomes and flagellar motors, can be isolated readily from cells. The cells must be broken open by techniques that allow subcellular components to remain intact. Examples of such techniques include: Mild detergent lysis. Cells can be lysed with a detergent capable of dissolving membranes but not denaturing proteins. Sonication. Cells can be lysed by intense ultrasonic vibrations above the range of human hearing.
Enzymes. Enzymes such as lysozyme can break the cell wall, allowing the cell to be lysed by mild osmotic shock.
Mechanical disruption. Cells can be broken open by the application of high pressure (with a French press) or through beating with microscopic beads (0.1–0.5 mm) using a bead beater.
The Ultracentrifuge
Once cells have been broken open, different parts of the cell can be isolated by cell fractionation. A key tool of cell fractionation is the ultracentrifuge (Fig. A3.1A), a device in which solutions containing cell components are rotated in tubes at high speed. The high rotation rate generates centrifugal forces strong enough to separate subcellular particles. The ultracentrifuge was invented by the Swedish chemist Theodor Svedberg (1884–1971), who won the 1926 Nobel Prize in Chemistry for the use of ultracentrifugation to separate proteins.
FIGURE A3.1 ■ Cell fractionation by ultracentrifugation. A. An ultracentrifuge is used to fractionate cell components. B. Salmonella ribosomes (TEM) isolated from the cytoplasm by ultracentrifugation through a linear sucrose density gradient. A polysome consists of two or more ribosomes attached to mRNA. C. High-speed rotation generates high centrifugal forces, measured in units of gravity (g). The Svedberg unit (S) offers a measure of particle size that is based on the particle’s rate of travel in a tube subjected to high g force. The Svedberg coefficient (number of S units; for example, 30S) is defined in terms of the velocity of the particle in the tube (v), the radius
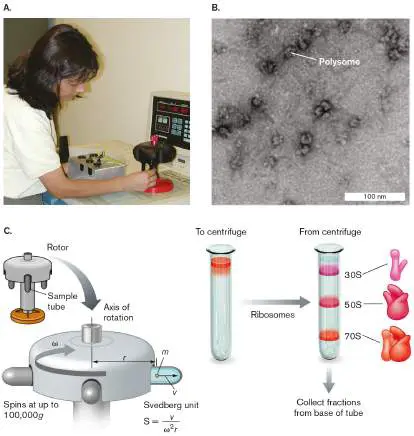
of the rotor (r), and the rotational velocity (ω). The coefficient of S for a given particle depends on its mass (m) and its shape. After centrifugation, fractions are collected from the base of the centrifuge tube. The fractions contain radiolabeled ribosomes. The largest particles (whole ribosomes) sediment near the bottom of the tube, and the smaller particles (separate 50S and 30S subunits) appear in upper fractions.
ERIC KAUFMANN, USDA-ARS-CMAVE
P. L. CLARK AND J. KING. 2001. J. BIOL. CHEM. 276 :25411
Modern ultracentrifuges have titanium rotors that spin in a vacuum to avoid frictional heating, generating forces up to 100,000 times gravity (100,000 g). For fractionation, cells are first lysed by one of the methods previously described to obtain a cell “lysate,” a general term for the contents of a broken cell. The cell lysate is placed in tubes containing a high-density solution, such as sucrose or cesium chloride solution, in which suspended particles sediment slowly. Under a high g force, however, particles sediment at different rates, depending on their size and density.
The sedimentation rate is the rate at which particles of a given size and shape travel to the bottom of the tube under centrifugal force. The sedimentation rate is measured by the Svedberg unit, S, which is given by the particle’s rate of sedimentation (v), the radius at which the tube rotates (r), and the rotational velocity (ω): S = v /(ω 2 r)
For a given type of particle in suspension, the sedimentation rate also depends on the particle’s mass and shape. The contribution of particle mass and shape is defined as its Svedberg coefficient; for example, the coefficient of the small subunit of the ribosome is 30, for a sedimentation value of 30S. The value of the Svedberg coefficient increases with the average cross-sectional area of the particle. For bacterial ribosomes, ultracentrifugation yields intact ribosomes (70S), as well as separated ribosomal subunits: the large subunit (50S) and the small subunit (30S). (The subunit S-values are not additive because sedimentation rate is a complex function of particle size and shape.) Within cells, ribosomes normally exist as a mixture of joined and separate subunits.
To isolate the ribosomes, a cell lysate is layered onto a tube of sucrose solution, whose density decreases the sedimentation rate and increases the separation of particles of different size (Fig. A3.1C ). The fractions shown in Figure A3.1C were drained sequentially from the base of the tube after centrifugation. The heaviest particle, the 70S ribosome, appears in the fractions nearest the bottom of the tube because it travels fastest under the centrifugal force.
The ribosomes can be seen in collected fractions by electron microscopy (Fig. A3.1B ). In some cases, two or more ribosomes are connected by a strand of messenger RNA (mRNA). This multiple-ribosome structure is called a polysome. Ribosomes isolated by centrifugation can translate messenger RNA in cell-free systems. Experiments in cell-free systems provide the basis of much of our knowledge of protein synthesis (see Chapter 8).
Limitations of Cell Fractionation
Cell fractionation yields clues about internal structure but provides little information about processes that require overall integrity of the cell. For example, the role of the transmembrane electrochemical potential, or proton potential, in ATP synthesis was obscured for many years because biochemists were unable to isolate a cytoplasmic complex that generates it. Transmembrane ion gradients were, in fact, observed within membrane vesicles— spheres of membrane isolated by cell disintegration and centrifugation. But it was harder to demonstrate that the entire cell membrane of an intact cell supports a proton potential.
Glossary
cell fractionation A procedure to separate cell components that often includes ultracentrifugation.
sedimentation rate The rate at which particles of a given size and shape travel to the bottom of a tube under centrifugal force. The rate depends on the particle’s mass and crosssectional area.
Svedberg coefficient A measure of particle size that is based on the particle’s sedimentation rate in a tube subjected to a high g force. polysome A cell structure consisting of multiple ribosomes performing translation on the same mRNA molecule.
A3.2 Agarose-Gel Electrophoresisnot assigned
separates macromolecules as they migrate through a gel under a voltage gradient. The rate of migration is based on the size and charge of the migrating molecules (Fig. A3.2). DNA molecules have a relatively uniform negative charge, one unprotonated phosphoryl group per nucleotide. So, within a gel, DNA molecules will separate according to size: the smaller fragments migrate faster.
FIGURE A3.2 ■ Agarose-gel electrophoresis separation of DNA fragments. A. (1) DNA samples are loaded into slots at the end of an agarose gel. When a voltage is applied (2), the DNA fragments (which have negative charge) are attracted toward the positive electrode (3). The fragments move according to size; the smaller fragments move fastest. When the fragments have run far enough to separate, they can be visualized by fluorescence when exposed to UV light (4). B. Apparatus for agarose-gel electrophoresis. C. DNA fragments in a gel visualized
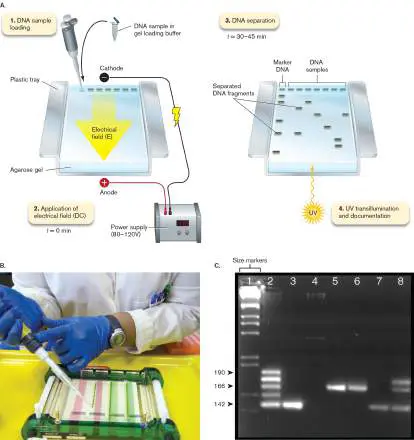
by UV. The fragments are PCR-amplified sequences from Bacillus anthracis isolated from victims of anthrax exposure.
SIMON FRASER/SCIENCE SOURCE
PAUL J. JACKSON ET AL. 1998. PNAS 95 :1224
The gel for DNA separation is formed from agarose, a long-chain polysaccharide that is soluble in water above 50°C but forms a rigid gel at room temperature. The agarose-gel matrix actually consists of widely separated links, like chicken wire; a water solution can flow through the microscopic holes in the matrix. The concentration of agarose in the gel determines the density of the matrix and the average size of holes through which DNA molecules may penetrate. Agarose concentration determines the size range of DNA that can be separated in a given gel: The higher the agarose concentration, the smaller the sizes of molecules that can be separated.
First a gel is formed by pouring agarose solution into a tray within an electrophoresis chamber that leads to a voltage source ( Fig. A3.2A and B ). The gel tray includes a “comb,” a piece of plastic with prongs that form wells within the gel. Once the gel has cooled and solidified, the comb is removed, and DNA samples are added. The DNA must be dissolved within a sample buffer that contains a dense substance such as glycerol to settle the sample deep within the well. The sample buffer also contains dyes, such as bromophenol blue, that can be visualized as they run through the gel under voltage potential.
After the dye has run through the gel, the voltage is turned off, and the gel is removed. The gel is stained with a fluorescent dye to visualize the DNA bands. A typical stain is SYBR green, an aromatic molecule that intercalates between DNA nucleotides and fluoresces under UV irradiation. Figure A3.2C shows an example of electrophoresis results. Bacterial DNA was obtained from anthrax patients in an outbreak in Sverdlovsk, Russia, in 1979, suspected to be caused by the accidental release of Bacillus anthracis. DNA samples (lanes 2–8) were amplified by the polymerase chain reaction (PCR) using primers specific to different strains of B. anthracis. The size of the PCR products confirmed the presence of anthrax bacteria.
Note that in electrophoresis, the size range of the fragments is nonlinear; thus the migration distances between large fragments are smaller than the migration distances between smaller fragments. In order to measure DNA sizes accurately, a control sample is run (lane 1 in Fig. A3.2C ) in which DNA fragments of known size appear. The pattern of these DNA fragments is called a “ladder.”
Glossary
electrophoresis A technique to separate charged proteins and nucleic acids that is based on how rapidly they migrate in an electrical field through a gel.
A3.3 Protein Identification on 2D Gels with Mass Spectrometrynot assigned
Separating and visualizing the proteins in a cell extract is a daunting challenge but can be accomplished by a process known as two-dimensional (2D) gel electrophoresis. The first step in the process is isoelectric focusing (IEF), whereby proteins in a cell extract are sorted according to their individual charges. Every protein has ionizable side groups (amino and carboxyl) that can impart charge ( Fig. A3.3A). The degree of ionization of each group is affected by pH and by the dissociation constant (p K) of the group. Generally, an ionizable group will be protonated at pH values below its p K. At pH values below their intrinsic p K, amino groups become positively charged (R-NH +), whereas carboxyl groups are neutral (R-
3
COOH). When the pH rises above a group’s p K, the amino groups will be neutral (NH 2), and the carboxyl groups will become negatively charged (COO −).
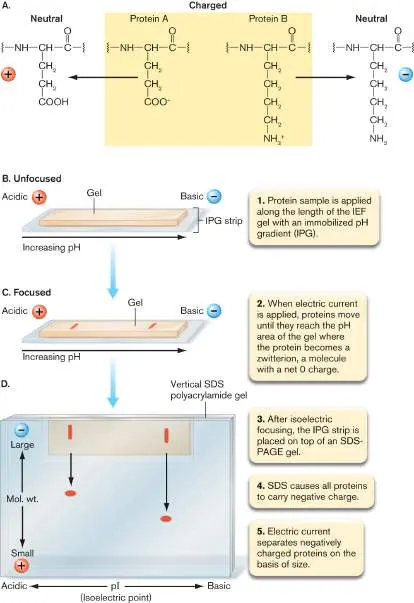
FIGURE A3.3 ■ 2D analysis of cell proteins. A. General movement of negatively and positively charged proteins in an electric current applied to an immobilized pH gradient (IPG) strip. Once a protein reaches a position corresponding to its isoelectric point, movement stops and the protein focuses in the area. B. Sample applied to an IPG strip. C. The IPG strip after focusing. D. The focused IPG strip is layered onto a standard SDS polyacrylamide gel, and the proteins are separated by size. The result is separation of the proteins in a 2D pattern.
Source: Modified from Albert Moat et al. 2002. Microbial Physiology, 4th ed. Proteins have numerous amino and carboxyl groups in different ratios, so for each protein there will be a specific pH, called the isoelectric point, where the plus and minus charges cancel out; that is, where the net charge on the protein is zero. In an electrical field, proteins set in a pH gradient gel will migrate through the gel until they reach a gel pH where the charges cancel out. In isoelectric focusing, cell proteins are applied to a gel containing an immobilized pH gradient, called an IPG strip, and are subjected to an electrical field (Fig. A3.3B ). Negatively charged proteins move toward the positive pole until they reach the pH of their isoelectric point, where the proteins no longer have charge (Fig. A3.3C ). Without a charge, the protein does not move under the influence of the electrical field. Positively charged proteins behave similarly but move toward the negative pole.
Proteins with very different molecular weights can share the same isoelectric point. As a result, one band on an IEF gel could contain ten proteins. The goal of the second dimension, therefore, is to further separate proteins by their molecular weights. To accomplish this, the IEF gel is transferred to the top of a sodium dodecyl sulfate (SDS) polyacrylamide gel (Fig. A3.3D ). SDS is a detergent that forms positive and negative ions in solution and denatures the protein. The negatively charged ion (dodecyl sulfate) has a hydrophobic end that coats proteins, giving all of them a negative charge.
Polyacrylamide is a porous gel whose pore size varies in relationship to the acrylamide concentration and the amount of cross-linking used to make it a gel. In SDS polyacrylamide gel electrophoresis (SDS-PAGE), the proteins (which are all negatively charged by SDS) are placed in an electrical field and are pulled toward the positive pole, located at the bottom of the gel. Small proteins easily slip through the tiny polyacrylamide pores and race to the positive electrode. The larger proteins find it more difficult to squeeze through the pores and are slow to move. The result is a gradient of proteins ranging from the largest at the top of the gel to the smallest at the bottom.
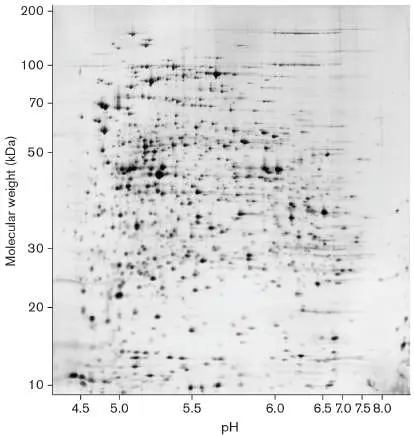
When combined, isoelectric focusing and SDS-PAGE display all of the cell’s proteins in a 2D array, as shown in Figure A3.4. If the proteins are radioactively labeled before analysis, they can be visualized by autoradiography. Alternatively, the proteins can be stained with fluorescent dyes after separation and read by a laser scanner. Subsequent computer analysis of the proteome patterns obtained from cells grown under two different conditions will reveal proteins whose levels increase or decrease in response to the changing environment.
FIGURE A3.4 ■ Proteome of Escherichia coli. Each spot represents a different protein.
Source: © Swiss Institute of Bioinformatics, Geneva, Switzerland. 2001. Proteomics 1 :409.
SWISS INSTITUTE OF BIOINFORMATICS. GENEVA, SWITZERLAND. 2001.
PROTEOMICS 1 :409
Figure A3.5shows a dual-channel image analysis that compares Bacillus subtilis proteomes from cultures grown in a minimal glucose medium to those from cultures grown in the same
medium but supplemented with a rich assortment of amino acids. The different colors indicate whether the level of a protein is higher, lower, or the same in the two cultures.
FIGURE A3.5 ■ Proteomic profile of Bacillus subtilis cells grown in minimal media with and without mixed amino acid supplementation (casamino acids). The IEF gradient used in the first dimension was pH 4.5–5.5; this represents only a part of the entire proteome. The image is the result of dual-channel analysis of silver-stained gels. A computer assigns the color red to proteins expressed in minimal media and green to proteins expressed in amino acid-supplemented media.
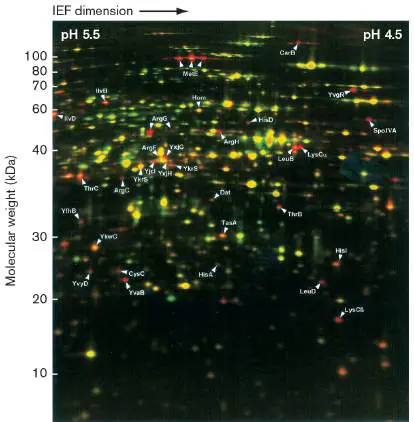
If the proteins are expressed under both conditions, the red and green colors combine to form yellow or orange.
Source: Ulrike Mäder et al. 2002. J. Bacteriol. 184 :4288.
ULRIKE MÄDER ET AL. 2002. J. BACTERIOL. 184 :4288
The power of proteomics becomes evident when it is linked to genomics. Knowing the complete sequence of an organism’s chromosome makes it easier to identify proteins following growth under any experimental condition. For example, levels of certain proteins increase when a bioremediating microbe is grown on benzene instead of glucose. How do we determine which proteins are induced? Those proteins, and the genes encoding them, can be identified from a 2D gel if the organism’s genome is sequenced. The procedure for proteomic identification of proteins in a 2D gel is shown schematically in Figure A3.6. The protein spot of interest is excised from the gel and digested into peptide fragments with a protease. The peptide fragment mixture is then analyzed by mass spectrometry, which determines the precise molecular weight of each fragment. In tandem mass spectrometry, each proteolytic fragment is then subfragmented by ionization. Ionization generates progressively smaller secondary fragments missing one or more amino acids. Because the weight of each amino acid is distinct, tandem mass spectrometry analysis will determine the amino acid sequence of the initial proteolytic fragment. Computer programs compare the amino acid sequence of each protein fragment with the predicted sequences of proteolytic fragments from all open reading frames (ORFs) in a genome. Assigning a spot on a 2D gel to a specific protein comes from finding several peptides that match different regions of that protein.
FIGURE A3.6 ■ Proteomic identification of proteins in a 2D gel. Proteins are extracted from a bacterial culture and subjected to 2D electrophoresis. Spots of interest can be cut out of the gel and digested with trypsin. The resulting peptides are analyzed by mass spectrometry. In a process called tandem mass
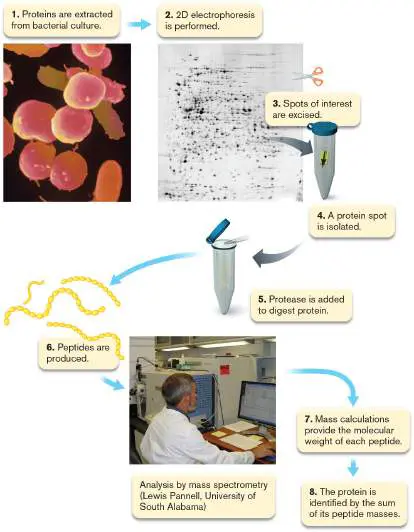
spectrometry (MS-MS), the mass of each peptide is determined, and then selected peptides are subjected to additional fragmentation by ionization. Each resulting peptide fragment will differ in size by one or more amino acids. Knowing the mass of each amino acid and the masses of the different peptide fragments allows one to extrapolate the sequence of the original peptide. Then the MS-MS sequences obtained for all of the tryptic peptides are compared by computer to all the predicted open reading frames (ORFs) in a microbial genome. If one ORF contains all the peptides, a match is declared and the protein is identified.
SIMKO/VISUALS UNLIMITED
SWISS INSTITUTE OF BIOINFORMATICS, GENEVA, SWITZERLAND. 2001.
PROTEOMICS 1 :409
COURTESY OF JOHN W. FOSTER
Protein mass spectrometry linked to 2D gel electrophoresis is a foundational method in the field of proteomics, which looks at the entire set of proteins being expressed in a cell or tissue under specific conditions. A newer technology for proteomics is mass spectrometry, which can identify proteins by determining their exact molecular weights (see Chapter 8).
Glossary
isoelectric focusing (IEF)
A technique that separates proteins according to their charge, via the migration of proteins to their isoelectric point in a pH gradient.
isoelectric point The pH at which there is no net charge on an amino acid or a protein.
A3.4 Northern and Southern Blots to Identify RNA and DNAnot assigned
In the 1970s, Edwin M. Southern invented a method, now called the Southern blot, for identifying a particular sequence of DNA in a complex mixture of DNA fragments. Scientists later used a similar technique to examine RNA fragments and named their method the “northern blot” in counterpoint to “Southern blot.”
Northern Blots Help Visualize Specific mRNA Messages
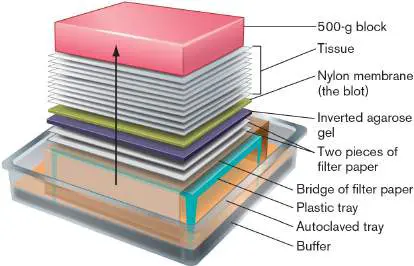
Northern blots are used to analyze the presence, size, and processing of a specific RNA molecule in a cell extract. In the northern blot technique, RNA is extracted from the cell. Special precautions must be taken to avoid contaminating these preparations with RNases, which are ubiquitous in the laboratory environment. The RNA is then fractionated by electrophoresis on an agarose-formaldehyde gel. Formaldehyde helps keep the RNA denatured and unkinked by preventing base pairing, so the molecules can be separated by size. The separated fragments are transferred by simple capillary action onto a nylon or nitrocellulose membrane, forming the blot. Alternatively, RNA transfer can be accomplished by “electroblotting,” the application of an electric field to draw all RNA molecules out of the gel onto the membrane. The apparatus pictured in Figure A3.7draws buffer up through the agarose gel and then through the facing membrane. RNA (or DNA) travels with the buffer out of the gel and is deposited on the membrane in exactly the same pattern as it was displayed in the gel. Once transferred, the RNA is fixed to the membrane by UV cross-linking.
FIGURE A3.7 ■ Northern blot to view mRNA levels. Northern blots can be used to monitor the quantity and breakdown of RNA. Shown here is the apparatus used to perform the northern blot. Capillary action (arrow) draws buffer through the gel and carries the RNA upward to the membrane, which binds the RNA.
After the RNA has been transferred, the membrane undergoes hybridization with a small DNA fragment called a “probe” that base-pairs with a specific mRNA. The probe is first heated to separate its strands. The temperature is then decreased to allow annealing between the DNA probe and matching RNA fragment in the process of hybridization. The probe can be labeled with radioactivity, a fluorescent dye, or biotin. The biotin is detected later by a chemiluminescent enzyme assay. RNA fragments to which a radiolabeled probe has bound are visualized by exposing the membrane to X-ray film, followed by photographic development of the film, otherwise known as autoradiography. Alternatively, the membrane is subjected to phosphorimaging. (A phosphorimager is
a machine that records the energy emanated as light or radioactivity from gels or membranes.)
The molecular weights of bands visualized by autoradiography or phosphorimaging can be determined by comparing their locations on the gel with the locations of standard RNA molecular weight markers run in a parallel lane (Fig. A3.8). This technique can be used to determine the presence of any given mRNA. By estimating the size of the transcript, which will be larger if multiple genes are transcribed as one, the method can also be used to evaluate whether two adjacent genes are transcribed as an operon or whether an RNA is processed into smaller forms (Fig. A3.8).
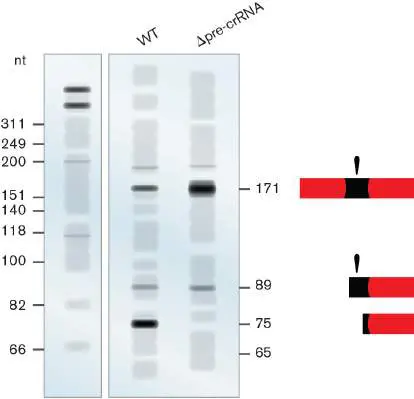
FIGURE A3.8 ■ Northern blot analysis of Streptococcus pyogenes total RNA. This blot of total mRNA was probed for a specific RNA called tracrRNA (for â trans -activating crRNAâ ) that affects the maturation of a second RNA, called CRISPR RNA. The processing of tracrRNA into an approximately 75-nt form (wild-type, WT, lane) is abolished in the Δpre-CRISPR RNA (Δpre-crRNA) strain. The data indicate that tracrRNA and pre-crRNA interact and are processed together by an RNase. The bars on the right represent the changing sizes of tracrRNA as it is processed. Numbers on the left indicate sizes (nucleotides, nt) of molecular weight markers.
Source: Elitza Deltcheva et al. 2011. Nature 471 :602–607.
Southern Blots Help Visualize Specific DNA Sequences
The Southern blot technique for DNA uses a probing strategy similar to that of northern blots to detect the presence of specific bands of RNA. (The term “Southern” is capitalized because the technique was named for British biologist Edwin M. Southern.) The basic difference between the Southern and northern blot techniques is the starting material. Southern blots begin with restriction endonuclease digestion of genomic DNA to produce discrete DNA fragments that are then separated by electrophoresis in an agarose or acrylamide gel. The DNA fragments are denatured to single strands and then blotted onto a membrane. A DNA probe is generated from one bacterial species by PCR (although other techniques can be used) and labeled with a radioactive or nonradioactive tag. This probe is hybridized to the DNA blot, and the hybridized bands are visualized by autoradiography or phosphorimaging. Standardized double-stranded DNA markers are used to help determine sample fragment sizes. Southern blotting is used, for example, to detect the presence of specific genes among different species or strains of a single species.
Glossary
northern blot A technique to detect specific RNA sequences. Sample RNA is subjected to gel electrophoresis, transferred to a blot, and probed with a labeled cDNA that will hybridize to target RNA sequences.
hybridization The annealing of a nucleic acid strand with another nucleic acid strand containing a complementary sequence of bases. The binding of one nucleic acid strand with a complementary strand. autoradiography The visualization of a radioactive probe by exposing the probed material to X-ray film and then photographically developing the film.
phosphorimaging The use of phosphors for detecting radiolabeled nucleic acids, typically in Southern or northern blots.
Southern blot A technique (named for its inventor, Edwin M. Southern) to detect specific DNA sequences. Sample DNA segments are separated by gel electrophoresis, transferred to a blot, and probed with a labeled DNA that will hybridize to complementary DNA sequences.
A3.5 DNA Isolation and PCR Amplificationnot assigned
Imagine having the ability to turn one copy of a gene into billions within 1 or 2 hours. This powerful technique, called the polymerase chain reaction (PCR), has revolutionized biological research, medicine, and forensic analysis. In this section we describe various PCR methods to isolate DNA from cells and to amplify (make many copies of) short stretches of DNA for sequence analysis. PCR amplification of DNA and RNA forms the basis of the key diagnostic test for infections such as that of the coronavirus SARS-CoV-2 and for detection of viral nucleic acids in wastewater monitoring. PCR has revolutionized forensic science and made possible the solving of crimes committed decades ago, where there remains physical evidence containing minute amounts of DNA.
DNA Isolation and Purification
The chemical uniformity of DNA means that simple and reliable purification methods can be used to isolate it. A variety of techniques are used to extract DNA from microbial cells. Bacteria may be lysed by lysozyme, which degrades the peptidoglycan of the cell wall, followed by treatment with detergents to dissolve the cell membranes. Lysozyme is an enzyme that cleaves the bond linking residues of peptidoglycan. Once the cell contents are released, most proteins are precipitated in a high-salt solution. The precipitated proteins are removed by centrifugation, leaving a clear lysate containing DNA. This lysate is passed through a column containing a silica resin that specifically binds DNA. Any remaining proteins in the lysate are washed out of the column because they do not stick to the resin. Once the proteins are removed, the DNA is eluted (removed) from the resin with water.
Ethanol (or isopropanol) and salt are added to the DNA, which precipitates it from aqueous solution as ethanol removes water associated with DNA’s phosphoryl groups (negatively charged), which then bind the Na + ions from the salt. The precipitated DNA is then dissolved in water or a very low-salt buffer. At this point, the extracted DNA can be examined with a variety of analytical tools.
PCR Amplifies Specific Genes from Complex Genomes
PCR is performed by heat-stable DNA polymerases that withstand the high temperatures required to denature double-stranded DNA into single-stranded DNA for primer hybridization. Heat-stable polymerases are isolated from various thermophilic bacteria and archaea, and then developed for commercial production. Heat denaturation is followed by cooling (annealing) of the denatured DNA with flanking sense and antisense primers that are extended by a thermostable DNA polymerase. This denature-anneal-extend cycle is repeated 25–40 times to amplify segments of DNA (Fig. A3.9). FIGURE A3.9 ■ The polymerase chain reaction. The cyclic PCR reaction makes a large number of copies of a small piece of DNA. Potentially 2 30 copies of a fragment can be made from a single DNA molecule.
PCR, as well as other molecular techniques, such as gene cloning and reverse transcription, relies on the ability of complementary
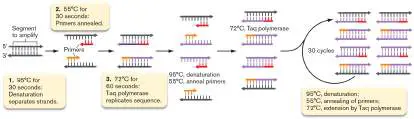
single strands of DNA or RNA to anneal and form double-stranded DNA or DNA-RNA complexes (for review, see Chapters 7 and 8). The PCR technique, outlined in Figure A3.9, requires the design of specific oligonucleotide primers (usually between 20 and 30 bp) that anneal to known DNA sequences flanking the DNA that will be amplified. The primers initiate replication of the target DNA by providing a “priming” substrate for DNA polymerase. The DNA polymerase synthesizes DNA by extending the primer molecule in a 5′-to-3′ direction, using the complementary DNA strand as the template. Heat-stable DNA polymerases are used because the PCR reaction mixture must undergo repeated cycles of heating to 95°C (to separate DNA strands so that they are available for primer annealing), cooling to 55°C (to enable primer annealing), and heating to 72°C (the optimal reaction temperature for the polymerase). To prepare enough target DNA, PCR requires 25–40 heating and cooling cycles, so a machine called a thermocycler is used to reproducibly and rapidly deliver these cycles.
This basic PCR technique has been modified to serve many purposes. Primers can be engineered to contain specific restriction sites that simplify subsequent cloning. If the primers used for PCR are highly specific for a gene that is present in only one microorganism, PCR can be used to detect the presence of that organism in a complex environment, such as the presence of the pathogen Escherichia coli O157:H7 in ground beef. Multiplex PCR, involving several primer sets, can be used to detect multiple pathogens in a single reaction (discussed later).
Quantitative (Real-Time) PCR
Another modification of the PCR technique is called quantitative PCR (qPCR) or real-time PCR. Real-time PCR uses fluorescence to monitor the progress of PCR as it occurs (that is, in real time). Data are collected throughout the PCR process rather than just at the end of the reaction. Quantitative PCR can be used to quantify the level of DNA in a sample or it can be used to quantify RNA, by amplification of complementary DNA (cDNA); that is, DNA reverse-transcribed from the RNA.
For qPCR, DNA is quantified on the basis of how long it takes to first detect an amplified product while the polymerase chain reaction is still running. The higher the starting copy number of the nucleic acid target, the sooner a significant increase in fluorescence is observed. Thus, the time at which fluorescence first increases is a reflection of the amount of nucleic acid in the original sample. How is the amplified DNA detected? Two techniques are commonly used. In one, a compound called SYBR Green is added to the reaction mix. This dye binds to double-stranded DNA and fluoresces. The fluorescence emitted increases with the amount of double-stranded PCR product produced.
The second quantitative PCR procedure, sometimes called TaqMan (Fig. A3.10), uses a reporter oligonucleotide probe containing a fluorescent dye on its 5′ end and a quencher dye on its 3′ end. As long as the probe remains intact, the quencher absorbs the energy emitted by the fluorescent dye—a process called fluorescence resonance energy transfer (FRET). The reporter probe does not itself prime DNA synthesis but anneals to the target downstream of a priming oligonucleotide.
FIGURE A3.10 ■ Quantitative (real-time) PCR. A. The Taq DNA polymerase, extending an upstream primer, reaches the downstream reporter probe and degrades the probe, releasing the fluorescent dye from the vicinity of the quencher. B.
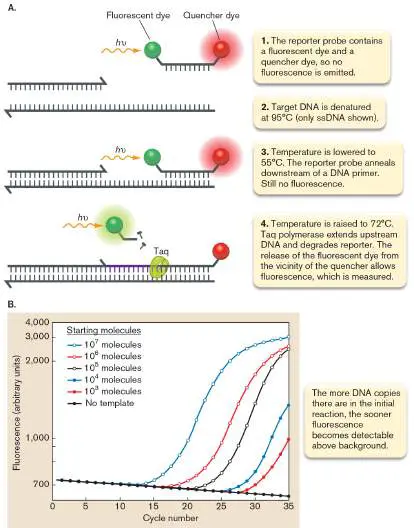
Amplification plot of Rhodococcus with primer BPH4. Different numbers of DNA copies were used for each reaction mixture. The priming oligonucleotide and the reporter probe both anneal to the target DNA sequence. Taq polymerase begins to synthesize DNA from the upstream primer (Fig. A3.10). However, Taq polymerase also has 5′-to-3′ exonuclease activity. So, Taq will run into and degrade the reporter probe, separating the fluorescent dye from the quencher dye. Fluorescence is emitted. Meanwhile, primer extension by Taq polymerase continues to the end of the template, and the template is amplified. After each annealing cycle, more reporter probe binds to the newly made templates and is cleaved by Taq polymerase during each round of polymerization. As a result, fluorescence continues to increase as the amount of amplified template increases. The more DNA copies there are in the initial reaction, the sooner fluorescence becomes detectable above background.
Multiplex PCR
The TaqMan technology enables an advanced method of multiplex PCR, a modification of PCR that can screen for several organisms simultaneously, saving time and money. Multiplex PCR combines multiple pairs of DNA primers, each pair bracketing a unique fluorescent Taq probe. The multiple probe sets amplify several different species-specific genes in a single PCR reaction. For multiplex PCR to be successful, the oligonucleotide pairs cannot bind to each other or inadvertently amplify some other chromosomal gene. In addition, the amplicon (amplified product) sizes for each pair must be clearly different so that the amplicons can be separated on a gel. If these conditions are met, finding a given fragment will unambiguously demonstrate that the corresponding organism was present in the material tested.
Multiplex PCR has been used, for example, to test a patient sample for five different SARS-CoV-2 variant strains simultaneously ( Fig. A3.11). For each variant strain, a unique probe set was designed in which the fluorescent probe sequence matched one mutation found only in the one strain. Each probe is then attached to a fluorophore with distinctive fluorescence wavelength, and the five fluorophores are detected simultaneously by a multiplex detector. For each virus strain in Figure A3.11, only one colored probe set generates cycles of amplification.
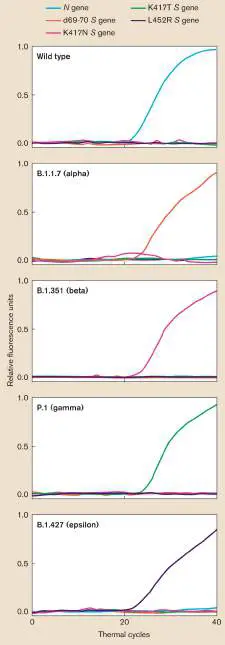
FIGURE A3.11 ■ Multiplex PCR for multiple variants of SARS-CoV-2 virus. The variant strains are amplified by distinct TaqMan probe sets specific for the wild-type viral N gene; the alpha variant, with S gene deleted for bases 69–70; the beta variant, with S gene K417N (lysine at position 417 replaced by asparagine); the gamma variant, with S gene K417T (lysine replaced by threonine); and the epsilon variant, with S gene L452R (leucine at position 452 replaced by arginine).
Source: Ryan J. Dikdan et al. 2022. J. Mol. Diagn. 24 .
Glossary
polymerase chain reaction (PCR)
A method to amplify DNA in vitro using many cycles of DNA denaturation, primer annealing, and DNA polymerization with a heat-stable polymerase.
primer An oligonucleotide that anneals to a complementary DNA sequence and serves as the substrate to initiate DNA synthesis by DNA polymerase. The primer is RNA for chromosomal replication and DNA for PCR applications. Also refers to a primer for RNA virus replication, which can be RNA or protein. quantitative PCR (qPCR)
Also called real-time PCR. A technique using fluorescence to detect the products of PCR amplification as the reaction progresses, in order to quantify the amount of DNA in a sample. real-time PCR Also called quantitative PCR. A technique using fluorescence to detect the products of PCR amplification as the reaction progresses, in order to quantify the amount of DNA in a sample. TaqMan A real-time PCR technique in which Taq polymerase, in the process of synthesizing DNA along a template, degrades a downstream fluorescent oligonucleotide probe. The increase in fluorescence indicates the production of an amplified DNA product.
fluorescence resonance energy transfer (FRET)
The detectable transfer of fluorescent energy from one molecule to another. Because the participating molecules must be near each other, FRET can be used to monitor protein-protein interactions in cells and is also used in real-time PCR. multiplex PCR A polymerase chain reaction that uses multiple pairs of oligonucleotide primers to amplify several different DNA sequences simultaneously.
A3.6 DNA Sequencing by Sanger, Illumina, and Nanopore MethodsUnit 2 · Genomes
The most accurate method of reading a DNA sequence is called dideoxy sequencing, or Sanger sequencing, named for pioneering DNA scientist Frederick Sanger (1918–2013). In Sanger sequencing, a small amount of a dideoxynucleotide (a nucleotide missing the 3′ OH group) is mixed with normal deoxynucleotides in a DNA synthesis reaction. Incorporation of dideoxy ATP in a growing DNA chain halts further elongation of that chain because there is no 3′ OH group to which the next base can be linked. But, because only a small amount of the dideoxy ATP terminator is present relative to normal deoxy ATP, many chains can complete their synthesis, while other chains stop at different adenine positions.
While Sanger sequencing is the most accurate method (99.99% accuracy), more rapid technologies are used for sequencing large quantities of DNA from genomes and metagenomes. These “next-generation sequencing” (NGS) technologies include Illumina sequencing by synthesis and nanopore strand sequencing.
Sanger or Dideoxy Sequencing
For Sanger sequencing, we conduct four separate reactions using four different dideoxynucleotides corresponding to A, T, C, and G, with each dideoxy base tagged with a different-colored fluorescent dye (Fig. A3.12A). (In an automated sequencer, all four reactions run in one tube.) The result is a series of different-sized strands of DNA, each tagged at its 3′ end with a color that depends on which base is incorporated. Analyzing the results of this reaction by electrophoresis will separate the various fragments according to size. A laser and detector positioned at the bottom of the gel can read the individual fragments as they pass (Fig. A3.12B ). Because we know the color of each tagged base, we can use a computer to display a series of colored peaks whose order corresponds to the template DNA sequence (Figs. A3.12C and A3.13 ). Although Figure A3.12depicts a standard polyacrylamide slab gel, the more rapid, automated DNA sequencers that use the Sanger method for larger-scale projects utilize small capillary tube gels.
FIGURE A3.12 ■ DNA sequencing using fluorescently tagged dideoxynucleotides to randomly stop chain elongation. A. The tagged strands are first synthesized using dideoxynucleotides, and then separated. B. The reaction products are separated by size using a polyacrylamide gel apparatus that includes a laser and detector to specifically identify the different tagged fragments. C. The bases are then read and displayed as different-colored peaks.
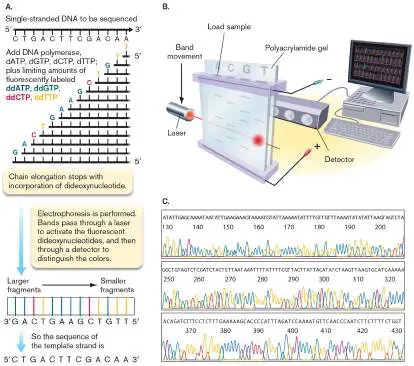
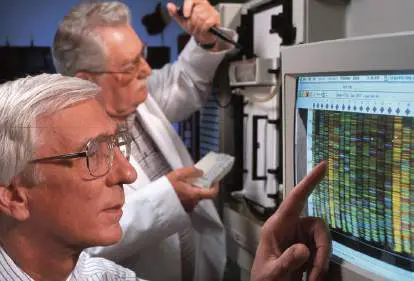
FIGURE A3.13 ■ Rapid DNA sequencing using an automated DNA sequencer. Samples of new sequencing reactions are loaded into a DNA sequencer at the National Center for Agricultural Utilization Research. The lanes on the screen represent the sequences of different DNA molecules.
KEITH WELLER, USDA
Illumina Sequencing
The traditional way of sequencing genomes was to randomly clone DNA fragments into plasmid or phage vectors and then separately sequence each fragment. It took months, if not years, to sequence an entire genome. Today, NGS technologies combine the power of robotics, computers, and fluidics to sequence an entire bacterial genome or community metagenome (see Chapters 7 and 21) in a matter of days. The technology most used today is the platform of
Illumina sequencing, a technology called “sequencing by synthesis” developed by Solexa, a company now part of Illumina, Inc.
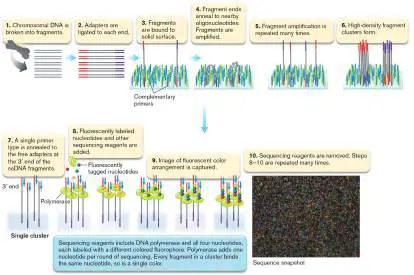
The Illumina process is outlined in Figure A3.14. First, the genome to be sequenced is fragmented sonically (by ultrasound bombardment) into segments of 100–300 bp. Small fragments are used because the technique can sequence only 100–500 bp from any one fragment. Next, different linker oligonucleotides are ligated to each end (Fig. A3.14, steps 1 and 2). Strands of each fragment are then separated, and the mixture is added to an optical flow cell. The fragments, millions of them, are randomly fixed to the solid surface (step 3). Each individual fragment sticks to a different area of the flow cell. The flow cell has a dense lawn of oligonucleotides fixed at their 5′ ends to the glass surface. These oligonucleotides are complementary to the fragment linker ends and will hybridize to them later in the process.
FIGURE A3.14 ■ Illumina sequencing: sequencing by synthesis. Steps 1–6: Generation of clusters by bridge amplification. Steps 7–10: Sequencing by synthesis using reversible fluorescent termination.
J. SHENDURE ET AL. 2005. SCIENCE 309: 1728–1732.
DOI:10.1126/SCIENCE.1117389. REPRINTED WITH PERMISSION FROM AAAS
Next, each single-stranded DNA (ssDNA) fragment is converted into a tight cluster of identical fragments through a series of so-called bridge amplifications (Fig. A3.14, steps 4 and 5). Ends of each fragment anneal to nearby matched oligonucleotides (fixed to the glass surface), which then serve as primers to amplify the fragments further. Multiple amplifications result in millions of different ssDNA fragment clusters dotting each lane of each slide (step 6).
All clusters are simultaneously sequenced in a repetitive series of single-step, reversible, chain termination reactions that attach fluorescently labeled nucleotides one at a time to the clusters (Fig. A3.14, steps 7 and 8). Because each individual cluster is a tuft of identical DNA molecules, all of the molecules in that cluster will have the same tagged base added and will fluoresce the same color. Note that the sequence of either strand can be determined by the addition of one or the other primer. After a base is added, a snapshot captures the colors, which reveal the bases added to each cluster (step 9). Next, the fluorescent marker (fluor) is removed from the growing chain, which also reverses chain termination, and the slide is again flooded with tagged bases (step 10). Snapshots taken after each sequencing round sequentially capture the fluorescent colors of each cluster as each base is added.
The old Sanger dideoxy method could sequence 1,000 bp per template but required considerable time, effort, and space to do so. In contrast, each flow-cell lane in the sequencing-by-synthesis technique produces 10–120 million DNA fragments, thus generating up to 1,800 gigabases (Gb) of DNA sequence per run (1 Gb = 1 billion bases). Each read is short (up to 300 bases per template), but because millions of templates are read, the massively parallel sequencing yields hundreds of millions of bases. Computer programs then find the overlaps among the millions of sequence results and assemble them into the sequence of an entire chromosome; for examples, see Chapters 7 and 21. With this technology, the cost of sequencing an entire human genome can be as low as $1,000.
Nanopore (MinION) Sequencing
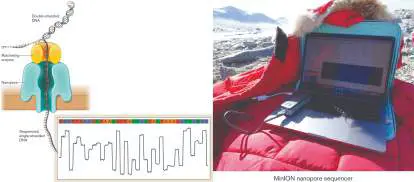
Nanopore DNA strand sequencing uses a very different principle from Sanger or Illumina sequencing. No DNA synthesis is involved; instead, a single molecule is read on the basis of the changes in electric current that occur when a single strand of DNA passes through a nanopore structure. The nanopore MinION instrument from Oxford Nanopore Technologies fits in the palm of the hand and can be powered by a laptop (Fig. A3.15). It has the advantage of fast sample preparation and short run time (a few hours total). The MinION can be run on a laboratory benchtop or in remote locations such as the McMurdo Dry Valleys region of Antarctica or even the zero-gravity International Space Station. It can provide real-time data from the field on outbreaks of epidemic disease, such as Ebola virus.
For nanopore sequencing, DNA is first ligated to an adapter, and these adapters are recognized by an enzyme that ratchets one of the strands through the nanopore (Fig. A3.15). The sequencer cannot recognize each base specifically, but it can recognize short strings of bases (three to six bases long) because they produce signature changes in current as they pass through the nanopore. Machine-learning algorithms are then used to convert these current profiles into base sequences.
FIGURE A3.15 ■ Nanopore sequencing. One strand of DNA is ratcheted through a nanopore by a specialized enzyme, and as the bases pass through, they cause changes in electric current (inset), which a computer translates into base sequences. Inset: A MinION nanopore sequencer is used in Antarctica.
SARAH JOHNSON
Because the system relies on changes in electric current rather than on synthesis, it can also be used to sequence RNA directly, without requiring that the RNA be reverse-transcribed to DNA. Finally, nanopore sequencing can generate single reads that exceed 800 kb. This capability for long reads enables sequencing through complex, repetitive regions of chromosomal DNA that cannot be assembled from Illumina reads.
The main drawback of nanopore sequencing is that it suffers from higher error rates than other methods. Although recent improvements have increased the single-read accuracy to higher than 99%, the technique is still considered inappropriate for applications in which sequencing accuracy is critical, such as the identification of single-base-pair mutations. However, accuracy can be further increased by performing multiple reads and aligning those reads for a consensus at each position. It is likely that nanopore sequencing may achieve accuracy comparable to that of Illumina sequencing in the near future.
Glossary
Sanger sequencing A method of sequencing DNA based on the incorporation of chain-terminating dideoxynucleotides by a DNA polymerase. Illumina sequencing [definition to come] nanopore DNA strand sequencing A type of nucleic acid sequence determination that relies on the changes in electric current that occur when a single strand of DNA passes through a nanopore structure.
A3.7 Gene Cloning and Gibson Assemblynot assigned
The concept of cloning a gene from one organism into the DNA of an unrelated organism was devised by several twentieth-century researchers, including Stanley Cohen and Herb Boyer, in 1972. The technique became known as “gene cloning.” Since then, more elaborate methods such as Gibson Assembly have been devised to replicate much larger sequences, even an entire genome of a bacterium.
Gene Cloning
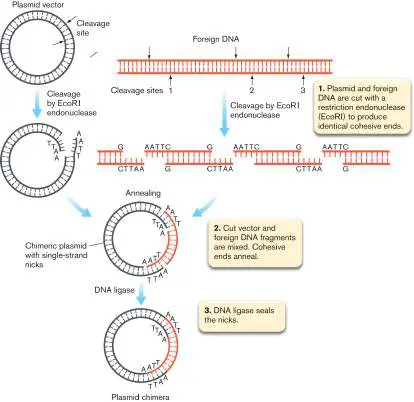
The key insight of Cohen and Boyer was that a piece of DNA cut from one organism’s chromosome could be grafted to a plasmid cut with the same restriction endonuclease (Fig. A3.16). The enzyme DNA ligase (see Chapter 7) can then seal the fragment to the plasmid and form a new artificial DNA molecule. The recombinant plasmid is then introduced into Escherichia coli and replicated successfully, like naturally occurring plasmids of bacteria. This process of gene cloning can be performed using various kinds of vectors derived from plasmids or bacteriophages.
FIGURE A3.16 ■ Formation of recombinant DNA molecules. To clone a DNA sequence, the gene sequence and a plasmid vector are cut by the same restriction enzyme (step 1). The cut sequences are the same, enabling the â foreignâ DNA ends to hybridize to the cut ends of the vector (step 2). The enzyme DNA ligase seals the phosphodiester bonds of the DNA backbone, completing the recombinant molecule (step 3).
Today, plasmid vectors are engineered with features specifically designed for cloning and expressing genes. One common element of plasmids is a gene for positive selection, such as a gene that confers antibiotic resistance to the host cell. Cells are unable to grow in
media containing the antibiotic unless the plasmid is present. Growing the cells in the presence of antibiotics thus ensures that the plasmid is maintained.
Another common feature is a multicloning site, which is a region that is highly enriched for target recognition sequences of restriction endonucleases. This abundance of recognition sequences provides the researcher with many options for cloning by restriction digestion and ligation of the inserted DNA at the multicloning site. If the cloned insert is to be expressed, these multicloning sites may be downstream of a promoter that is recognized by the host cell (usually E. coli).
Some cloning methods utilize special enzymes for the restriction digestion or ligation steps. Golden Gate cloning uses a class of restriction endonucleases that cuts at a distance from the recognition sequence. This feature is exploited to eliminate the recognition sequence in the final product. TOPO TA cloning bypasses the restriction step and can clone PCR products directly into plasmids. TOPO TA cloning uses topoisomerase I rather than DNA ligase to ligate the insert into the plasmid. This cloning is made exceptionally efficient by the covalent attachment of the topoisomerase to the two ends of the linearized plasmid vector. TOPO TA cloning is especially useful in cloning DNA from environmental samples, where DNA concentrations may be limited and the goal is to capture a large fraction of the total microbial diversity.
Cloning by PCR: Gibson Assembly
Restriction digestion and ligation works well for many cloning purposes but can be cumbersome if many DNA fragments need to be stitched together. Such was the case for the construction of the first chemically synthesized organism, JCVI-syn1.0. Its genome of 531,490 bp was assembled from oligonucleotides that were each less than 100 bp long. To perform this massive scale of assembly more efficiently, a restriction-independent method of cloning was utilized.
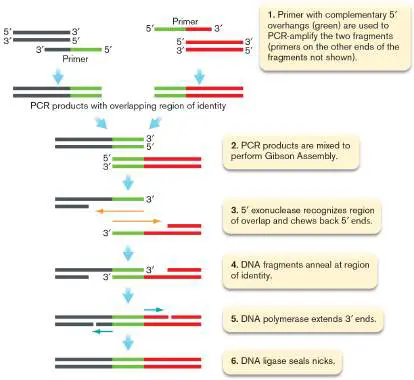
Gibson Assembly, named after its developer, Daniel Gibson, at the J. Craig Venter Institute, relies on PCR to amplify the DNA segments, and a special enzyme to splice the PCR products together. PCR primers are designed such that the products of PCR have overlapping regions of sequence identity at their ends (Fig. A3.17). When mixed together, the T5 exonuclease enzyme “chews back” the 5′ end of one strand of each overlapping DNA. The complementary 3′ overhangs generated by this activity can then anneal, and with the addition of DNA polymerase and DNA ligase, the two strands of DNA become covalently attached. For simplicity, Figure A3.17shows a Gibson Assembly reaction at a single region of homology between two DNA fragments. If a PCR product has regions of homology to a plasmid at both of its ends, Gibson Assembly can be used to insert the product into the plasmid. FIGURE A3.17 ■ Formation of recombinant DNA by Gibson Assembly. DNA segments are PCR-amplified, and single-stranded overhangs are then added. The overhangs enable hybridization and joining of several different DNA sequences.
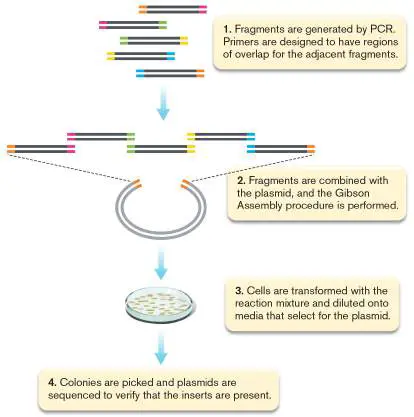
Gibson Assembly has several advantages over classic restriction-and-ligation cloning. First, the site of splicing can be at any position along the DNA fragments, not just at restriction sites. Second, because the reaction occurs only at specific regions of homology, up to five fragments can be linked simultaneously, in the desired orientation and in a single reaction, if the regions of overlap are
distinct (Fig. A3.18). This ability was fundamental to the creation of the first synthetic organism, JCVI-syn1.0.
FIGURE A3.18 ■ Gibson Assembly can clone multiple PCR fragments simultaneously. After fragments are hybridized at their overhangs, the recombinant molecule is then cloned in a plasmid vector.
A3.8 Primer Extension to Identify Transcriptional Start Sitesnot assigned
For some genes, transcription can occur from multiple promoters to produce transcripts of different sizes. These different promoters are useful because they can respond to different cell signals (for example, high temperature versus acidic pH versus nitrogen limitation).
Recall from Section 8.2 that promoters are located at −10 and −35 bp from the transcriptional start site. So, if there are different transcriptional start sites upstream of a single ORF (gene), then there must be different −10 and −35 bp sequences (promoters) associated with each transcriptional start. To begin searching for upstream promoter sequences, we need to define where each transcript begins. One method to determine transcript length is called primer extension, illustrated for the generic case in Figure A3.19A. Knowing the sequence of the gene, the researcher designs a single DNA primer that will anneal to the mRNA of interest near the suspected start site. The primer is used in a reverse transcription reaction (reverse transcriptase makes DNA from RNA) that extends the primer to the 5′ end (the start) of the message. Reverse transcription generates complementary DNA (cDNA) of a precise length. The cDNA is radiolabeled by using radioactive nucleotides in the reaction mixture.
FIGURE A3.19 ■ Primer extension analysis to determine transcriptional start sites. A. The top sequence represents the DNA sequence of an imaginary promoter. The mRNA product is shown below (shaded blue). After separating the RNA from DNA, a DNA oligonucleotide primer that binds to the mRNA at a defined place is added, followed by a reverse transcriptase reaction. Reverse transcriptase produces a cDNA primer extension product that ends at the beginning (5′ end) of the mRNA. The product is run in a polyacrylamide gel next to a sequencing ladder of the original DNA made with the same primer used in the reverse transcriptase reaction. The primer extension product will migrate to the same position as the DNA fragment ending in the base that represents the start site of transcription. B. Primer extension (far-right lane) showing the transcriptional start site of the gadA gene (arrow) involved in E. coli acid resistance. C. The sequence of the promoter is shown with â’10, â’35, and the transcriptional start site (+1) marked. Lowercase letters indicate bases that differ from consensus â’10 and â’35 sequences. Note that the first base of the mRNA
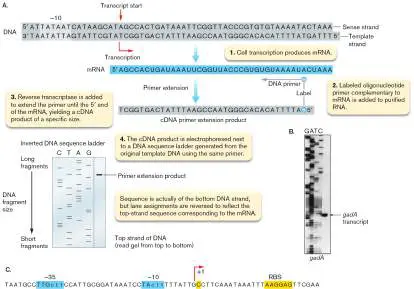
transcript is marked C (cytosine). This corresponds to a G (guanosine) in the gel sequence ladder (panel B). The C is correct for the transcript because the DNA sequence obtained using the primer is actually that of the strand complementary to the message. RBS = ribosome-binding site.
Source: Daniela De Biase et al. 1999. Mol. Microbiol. 32 :1198.
JOHN W. FOSTER
The key to using the primer extension technique is that the same primer is also used in a DNA sequencing reaction with the template DNA (Fig. A3.19A). The cDNA primer extension fragment is then run on a polyacrylamide gel alongside the products of a Sanger DNA sequencing reaction of the gene fragment (see Section A3.6). The size of the primer extension cDNA fragment will be identical to the size of one of the “rungs” on the DNA sequence ladder. That rung represents the base in the sequence that correlates to the transcriptional start site. The cDNA from the transcripts of genes that have multiple promoters will produce primer extension fragments of varying sizes that co-migrate with different-sized sequencing fragments.
Primer extension analysis of gadA, one of the Escherichia coli acid resistance genes, is illustrated in Figure A3.19B . The analysis indicates that the transcript begins opposite a G in the sequence of the complementary DNA strand. As Figure A3.19C shows, this corresponds to a C (marked +1) in the sense strand of DNA. The sense strand has the same sequence as the mRNA. Thus, the promoter sequences for gadA reside at −10 and −35 bp from the transcriptional start site. Once the promoter is identified, we can begin to search for nearby DNA sequences that control expression of the promoter.
Glossary
primer extension A technique to determine the 5′ end of an RNA transcript. A primer is used in a reverse-transcription reaction (reverse transcriptase makes DNA from RNA) that extends the primer to the 5′ end (the start) of the message.
A3.9 DNA Microarraynot assigned
The DNA microarray technique uses a tool called a DNA microchip, where DNA fragments from every ORF in a genome are affixed to separate locations on a solid support surface, producing a grid, or array (Fig. A3.20). The DNA fragments are generated by PCR or by in vitro chemical synthesis. The key to the technique is that only one strand of a double helix is actually fixed to the slide. Heating the slide breaks the hydrogen bonds holding down the complementary strands. The released strands are washed off, leaving the tethered strands free to anneal with a complementary DNA that diffuses from the medium.
FIGURE A3.20 ■ DNA microarray technology. This procedure is used to determine transcript levels produced from every gene in a cell (transcriptome). It assesses the relative level of each transcript produced by cells grown in different
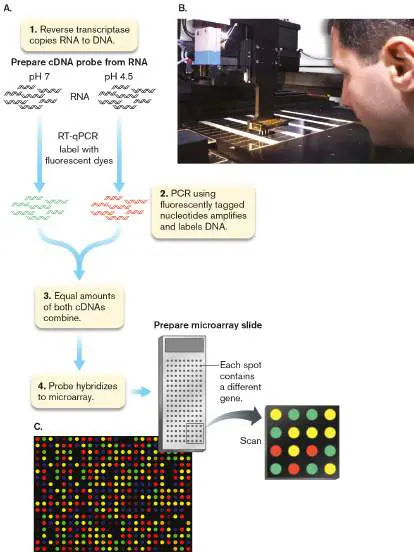
conditions or between mutant and wild-type strains of bacteria. A. RNA is extracted from cultures grown under different conditions (pH 7 versus pH 4.5 in this example). The RNA molecules from the two cultures are converted to DNA with reverse transcriptase (RT), and then amplified and quantitatively tagged with different-colored fluorescent tags using PCR techniques. B. DNA fragments of each ORF in the bacterial genome are spotted by robotics to a glass slide (DNA microchip). The tagged (fluorescent) RT-qPCR mixtures are then applied to the DNA microchip and allowed to anneal. Each tagged RT-qPCR fragment will anneal only to the spot corresponding to its gene. C. Laser scanning of the annealed chip will reveal red spots if that gene was expressed mostly under pH 4.5 conditions, green spots if it was expressed mostly at pH 7, and yellow or orange if it was expressed equally under both conditions (an equal mix of red tag and green tag).
COURTESY OF OAK RIDGE NATIONAL LABORATORY
ALFRED PASIEKA/SCIENCE SOURCE
The DNA microchip can be used to analyze cDNA copies of RNA extracted from microbes grown under two different conditions. The ultimate goal is to compare the relative expressions of each gene under the two sets of environmental conditions; for example, at a pH of 7 versus a pH of 4.5. The latter is a pH that bacteria such as Salmonella might encounter in eukaryotic host cell vesicles. After extraction, the two RNA samples are treated separately with the enzyme reverse transcriptase, which makes cDNA from RNA templates. Fluorescently tagged nucleotides are used in the reaction so that the product cDNAs also carry a fluorescent tag. How much of one cDNA is made depends on how much mRNA was initially present. Different-colored tags (usually red and green) are used for each sample. In the example shown in Figure A3.20, the cDNAs from the pH 7 and pH 4.5 cultures were labeled red and green, respectively.
The two fluorescently tagged batches of cDNA are flooded onto a microchip, where the individual cDNA molecules find and bind their mates on the organized grid. This is the hybridization step. After hybridization, a laser scans the slide and a confocal fluorescence microscope (see Section A3.11) reads emissions. Composite images of the two scans, one for red and one for green, are made and analyzed by computer. If a given gene is expressed equally under both test conditions, the corresponding spot on the chip will contain equal amounts of red and green—a result that produces a yellow color. If a gene is expressed more during growth at pH 7, the spot will glow green. If expressed more at pH 4.5, it will fluoresce red. The result is a comprehensive view of what has been called the cell’s transcriptome —all of a cell’s expressed mRNAs (Fig. A3.20C ). This technology has been used to examine the effect on the transcriptome of several global regulators discussed in the book, such as cAMP receptor protein (CRP) of Escherichia coli or the sigma H regulating sporulation of Bacillus subtilis.
Glossary
DNA microarray A technique, used for measuring the amount of specific mRNA molecules transcribed in cells, in which DNA fragments from every open reading frame in a genome are affixed to separate locations on a solid support surface (a DNA microchip), producing a grid, or array.
transcriptome The set of transcribed genes in a cell at a given time. The “complete transcriptome” includes all the possible RNA transcription products from a given genome. The “expressed transcriptome” is the set of RNAs present during a given condition.
A3.10 Protein Binding to DNA (ChIP- seq) and Protein-Protein Binding (Yeast Two-Hybrid Assay)not assigned
Various techniques can reveal the molecular interactions of proteins that regulate gene expression. The DNA sequences that bind regulatory proteins can be identified by chromatin immunoprecipitation (ChIP) combined with high-volume DNA sequencing such as Illumina sequencing by synthesis (ChIP-seq). Protein-protein binding interactions can be identified by yeast two-hybrid assays.
ChIP-seq Analysis of Genomic DNA Protein-Binding Sites
Suppose genetic analysis identifies a protein that appears to regulate the transcription level of various genes. How can we determine all the sites in a genome to which a proposed regulatory protein binds? The technique of ChIP sequencing (ChIP-seq) is outlined in Figure A3.21. In the example shown, the DNA-binding protein of interest is the stationary-phase sigma factor of Escherichia coli, sigma S. Sigma S binds to a large number of DNA target sites in the genome. To identify these sites, the cells are first treated with formaldehyde to covalently cross-link proteins to DNA where they are bound. The DNA and its bound proteins are isolated and sheared into small fragments. Next, the transcription factor (TF)–DNA complexes are “fished” from the extract using tiny beads with antibodies attached that bind only to that particular TF protein. The beads are pelleted by centrifugation, which “pulls down” antibody bound to the TF protein–DNA complexes. Unbound DNA fragments are washed away. This process is called chromatin immunoprecipitation, or ChIP.
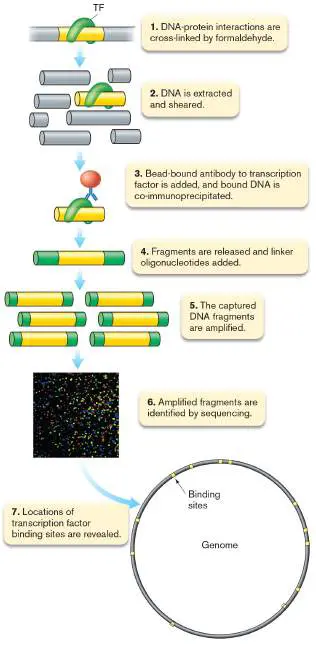
FIGURE A3.21 ■ ChIP-seq technology. TF = transcription factor.
REPUBLISHED WITH PERMISSION OF AMERICAN ASSOCIATION FOR CLINICAL
CHEMISTRY, INC.
Next, the protein-DNA cross-links are removed (usually by heat), and the released DNA fragments are amplified by PCR. To amplify the unknown fragments, the fragments are ligated at both ends to linker oligonucleotides that can be amplified by known primers containing fluorescent dye. The fluorescently tagged, amplified fragments are then sequenced by Illumina or other next-generation sequencing methods (see Section A3.6). The sequence identifies precisely where the transcription factor is bound to the genome and which genes it likely controls. In the case of E. coli sigma S, ChIP-seq identified 63 binding sites and discovered that several new genes in oxidative stress resistance and cell-surface chemistry are under sigma S control and could be important for stationary-phase survival.
Mapping the Interactome: Protein-Protein Interactions
Many cell proteins interact with and influence the function of other proteins in the cell. Some, such as RNA polymerase and the ribosome, function as components of multisubunit complexes. In other cases, short-lived protein interactions govern detailed regulatory processes. For example, in Bacillus subtilis, the timing of sporulation is controlled by a cascade of sigma factors interacting with anti-sigma factors. Overall, the protein-protein interactions of a living cell are collectively referred to as the interactome. Mapping the details of this interactome provides key insights into protein function.
It is important to probe protein-protein interactions in vivo, where the proteins actually work. An ingenious tool to measure in vivo protein-protein interaction is two-hybrid analysis. Two-hybrid analysis can be used to mine the cytoplasm for unknown “prey” proteins that interact with a known “bait” protein.
There are many types of two-hybrid techniques involving different kinds of cells. The classic example is the yeast two-hybrid system (Fig. A3.22). In yeast two-hybrid analysis, genes encoding two potentially interacting proteins are fused to separated parts (domains) of the yeast GAL4 transcription factor. The fusion proteins are expressed by gene fusions (see Section 2.5) that are constructed by recombinant DNA technology. The gene encoding one protein of interest is fused to the GAL4 activation domain, while the gene encoding a potential partner protein is fused to the GAL4 DNA-binding domain. If the two proteins of interest interact with each other, then the two parts of GAL4 are brought together. The DNA-binding domain binds to the yeast GAL1 gene promoter region, and the activation domain (towed behind by the interacting proteins) is positioned to bind RNA polymerase and stimulate transcription of a target reporter gene.
FIGURE A3.22 ■ Detecting protein-protein interactions: the yeast two-hybrid system. Interacting proteins are fused to separate halves of the GAL4 regulator.
The target reporter gene is typically a chromosomal GAL1-lacZ transcriptional fusion, although other reporter genes can be used. When the two hybrid proteins interact, the complex activates the transcription of GAL1-lacZ, which is visualized on agar plates
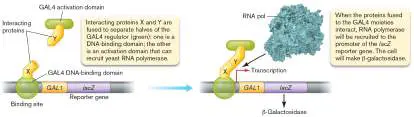
containing X-Gal. X-Gal is a colorless substrate of beta-galactosidase that, when cleaved, produces a blue product.
The power of the yeast two-hybrid technique is that it can also be used to find unknown proteins that interact with a known protein. A known protein fused to one of the GAL4 domains can be used as “bait” to find the “prey” proteins expressed by randomly cloned “prey” genes fused to the other GAL4 domain. Plasmids containing the bait fusion and prey fusion are transformed into yeast cells, and the transformants are plated onto a medium containing X-Gal. Colonies that express beta-galactosidase are the result of protein-protein interactions between the bait and prey fusion proteins. Sequencing the DNA insertion can then identify the gene encoding the prey protein.
Glossary
ChIP sequencing (ChIP-seq)
A procedure that scans a genome for all DNA sequences capable of binding to a specific DNAbinding protein.
chromatin immunoprecipitation (ChIP)
An experimental method used to determine the DNA-binding sites on a chromosome to which a DNA protein binds.
ChIP An experimental method used to determine the DNA-binding sites on a chromosome to which a DNA protein binds.
two-hybrid analysis An in vivo technique to determine protein-protein interactions in which DNA sequences encoding proteins of interest are fused separately to the DNA-binding and activation domains of a transcription factor. The recombinant organism is then tested for expression of a reporter gene.
A3.11 Confocal Microscopynot assigned
An advanced application of fluorescence is confocal laser scanning microscopy (or confocal microscopy), in which excitation light and emitted light are focused together. Confocal microscopy is used to produce images of cells at high resolution, with interference effects decreased by laser optics. The images can be “stacked”
computationally to model a cell in 3D.
In Figure A3.23, confocal microscopy shows human tissue culture cells infected by enteroinvasive Escherichia coli. The DNA of bacteria and of the nuclei of HeLa cells (an immortal cancer cell line) are stained blue with DAPI fluorophore. Invading bacteria cause the host to form actin “tails,” which help the bacteria move. Tails are stained green by the actin-binding fluorophore fluorescein isothiocyanate (FITC).
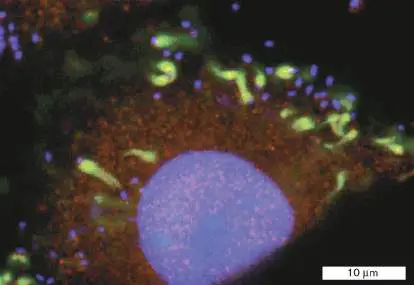
FIGURE A3.23 ■ Human tissue culture cells infected by enteroinvasive Escherichia coli. DNA of bacteria and of HeLa nuclei are stained blue with DAPI fluorophore. Invading bacteria (blue-stained rods, 1–2 μm long) cause the host to form actin â tails,â stained green with the actin-binding FITC fluorophore (confocal microscopy).
MICHAEL S. DONNENBERG/UNIVERSITY OF MARYLAND
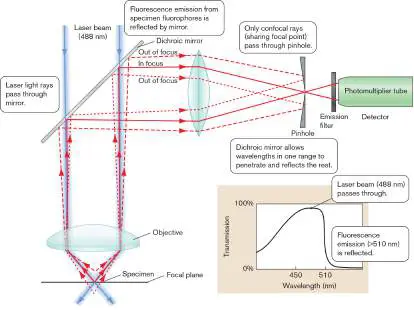
In confocal microscopy, a laser beam is focused onto the specimen and scanned across it in 2D; that is, in a line in two planes at right angles to each other (Fig. A3.24). The laser beam excites the fluorophore, causing it to emit light at a longer wavelength. The emitted light passes in reverse direction through the objective, where it encounters a dichroic mirror that allows light transmission at the excitation wavelength but reflects light at the wavelength of emission. The reflected emission rays are then focused and pass through a pinhole, which eliminates all unfocused light. A narrow, focused beam, representing one “pixel” of image, enters the photomultiplier tube. The laser beam scans across the specimen to give a 2D pattern of pixels that forms an image. The scanned images can be stacked through a series of focal planes to generate a 3D model.
FIGURE A3.24 ■ Confocal microscopy. In confocal optics, the incident laser beam (blue) passes through a dichroic mirror and reaches the specimen, where its absorption leads to fluorescent emission at a longer wavelength. The fluorescent emission travels back to the dichroic mirror, where it is reflected toward the photomultiplier. Only the confocal rays (those emitted from the focal point) pass through the pinhole and reach the photomultiplier.
The scanning feature of confocal microscopy is also used to acquire data for high-throughput experiments in which a large number of chemical reactions are arranged in microscopic quantities in an array, such as a DNA microarray (see Section A3.9). The DNA microarray contains probes for all the genes of a genome. Short segments of DNA are arrayed on a microscope slide such that an entire genome of potential protein-encoding genes may be present on a single slide. The fluorescent cDNA copies of all a cell’s RNA can
then hybridize to the DNA sequences of specific genes. The hybridization positions are visualized by confocal microscopy.
Glossary
confocal laser scanning microscopy or confocal microscopy A type of fluorescence microscopy in which the excitation light from a laser and the emitted light from the specimen are focused together, producing high-resolution images.
A3.12 Immunoprecipitation and Western Blotnot assigned
Immunoprecipitation, described in Section 24.2, is an important property of antigen-antibody reactions that is also the basis for many techniques used in immunology. An antigen can immunoprecipitate with an antibody to a single epitope when the target of the antibody has multiple identical epitopes.
Immunoprecipitation can also occur when an antigen molecule has different epitopes (Fig. A3.25A). Antiserum raised against such an antigen will contain antibodies to each epitope. The different antibodies can collaborate to precipitate the antigen by cross-binding identical epitopes on different molecules.
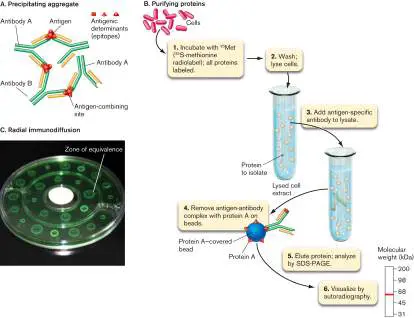
FIGURE A3.25 ■ Applications based on antigen-antibody behavior. A. Precipitating aggregate. Antibodies to different antigenic determinants residing on antigen molecules can cross-link the antigens to make a huge, insoluble complex that precipitates. B. Purifying proteins. Specific proteins are removed from a complex cell extract using immunoprecipitation. In the experiment, antibody to a specific cellular protein (shown as red square at step 4) is added to a lysed cell extract. Protein A beads are then added. Protein A will bind to the Fc region of the antigen-antibody complex. Centrifugation then is used to pull down the beads and the protein with them. The protein is eluted from the antibody and analyzed by SDS-PAGE (protein A remains covalently attached to the bead). C. Radial immunodiffusion. The agarose plate shown is embedded with antibodies specific for a certain antigen. Different concentrations of the antigen are placed in each well. The antigen diffuses into the agarose. A ring of precipitation occurs when the concentration of the diffusing antigen reaches a zone of equivalence with the antibody in the plate.
COURTESY OF TRIPLE J FARMS
Immunoprecipitation can isolate specific proteins from a complex cell extract (Fig. A3.25B ). Antibody is added to a complex mix of different antigens. The antibody, however, can bind to only its specific antigen. Beads coated with a molecule known as protein A (derived from Staphylococcus aureus) are added to specifically purify that antigen-antibody complex. Protein A binds to the Fc region of an IgG antibody molecule. Consequently, all the antigen-antibody complexes will become bound to the bead. Because the bead is heavy, centrifugation will remove the desired antigen from the complex mixture.
The technique called radial immunodiffusion allows the concentration of an antigen in a solution to be determined (Fig. A3.25C ). In this technique, a ring of precipitation is visualized in an agarose gel impregnated with antibody. Antigen placed within a well will diffuse outward until reaching a zone of equivalence with the embedded antibody. At this point, antigen-antibody complexes precipitate and form a ring a certain distance from the well. The farther the antigen diffuses away from the well, the lower its concentration becomes. Consequently, the higher the concentration of antigen that is originally present in the well, the farther it will have to diffuse before the zone of equivalence is reached and a ring of precipitation forms. The concentration of antigen in an unknown solution is determined by comparing the radius of immunoprecipitation formed to a standard curve in which known concentrations of antigen are plotted against the radius of the ring of precipitation.
Another important research technique involving antibodies is the western blot, which is used to detect the presence of a specific protein in cell extracts. The western blot technique was named for its similarity to the northern and Southern blot techniques of identifying specific macromolecules from a mixture (see Section A3.4). For the western blot, instead of nucleic acids, proteins are separated using SDS polyacrylamide gel electrophoresis (SDS-PAGE). The proteins are transferred (blotted) from the gel onto a nitrocellulose or other membrane. The membrane is then probed with an antibody directed against a specific protein. Antibody sticks to the protein in question, and because that antibody is labeled in some way (for example, a radioactive or fluorescent probe has been added), the protein band can be visualized by autoradiography or phosphorimaging. The western blot technique can be used to estimate differences in the concentration of a specific protein when comparing two different strains of cells (such as mutant and wild type) or in the same cell type treated in different ways (for instance, growth in different environments or in the presence or absence of different chemicals).
Glossary
immunoprecipitation The antibody-mediated cross-linking of antigens to form large, insoluble complexes. It is used in research labs and is normally seen only in vitro.
radial immunodiffusion A technique in which a ring of precipitation is visualized in an agarose gel impregnated with antibody. Antigen placed within a well diffuses outward until reaching a zone of equivalence where antigen-antibody complexes precipitate and form a ring. western blot A technique to detect specific proteins. Proteins are subjected to gel electrophoresis, transferred to a blot, and probed with enzyme-linked or fluorescently tagged antibodies that specifically bind the protein of interest.
A3.13 ICNP Phylum Nomenclaturenot assigned
Microbial nomenclature undergoes continual revision, as phylogenetic relationships emerge from new DNA sequence data. In 2021, the International Committee on Systematics of Prokaryotes (ICSP) proposed to standardize phylum-level scientific names in the International Code of Nomenclature of Prokaryotes (ICNP). This decision would change the long-standing names of many prokaryotic phyla, mainly bacteria. The most significant of these changes are listed in Table A3.1. In most cases the change only revises the suffix “-ota,” but in some cases the main name is changed.
Phylum Names for ICNP
TABLE A3.1
(Partial List)
Phylum name Phylum name for ICNP with long standing in literature Acidobacteria Acidobacteriota Actinobacteria Actinomycetota Aquificae Aquificota Bacteroidetes Bacteroidota Bdellovibrio Bdellovibrionota
Phylum Names for ICNP
TABLE A3.1
(Partial List)
Chlamydiae Chlamydiota Chlorobi Chlorobiota Chloroflexi Chloroflexota Cyanobacteria Cyanobacteriota (under discussion)
Deinococcus-Deinococcota Thermus Firmicutes Bacillota Fusobacteria Fusobacteriota Mycoplasma Mycoplasmatota (formerly Tenericutes)
Nitrospirae Nitrospirota Planctomycetes Planctomycetota Spirochetes Spirochaetota Thermotogae Thermotogota Verrucomicrobia Verrucomicrobiota The field of microbiology is now in the process of considering the use of the new phylum names. For the sixth edition of Microbiology: An Evolving Science, we continue using the preexisting phylum names while presenting the ICNP proposed names as shown in Figure A3.26and Table A3.1.
FIGURE A3.26 ■ Bacterial phylogeny using ICNP nomenclature. A phylogenetic tree of representative Bacteria based on comparison of rRNA and ribosomal protein sequences; for historical names, see Chapter 18. The tree is rooted with respect to Archaea and Eukarya. Black labels indicate the three domains of life. Blue labels indicate phyla and deep-branching
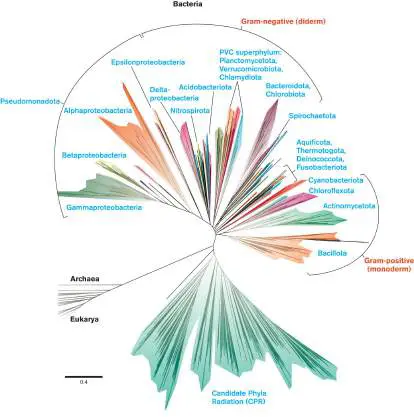
classes. Unit of branch length represents the average number of substitutions per base.